EXHIBIT 99.1
PART I
Item 1. Business.
PepsiCo, Inc. was incorporated in Delaware in 1919 and was reincorporated in North Carolina in 1986. When used in this report, the terms “we,” “us,” “our,” “PepsiCo” and the “Company” mean PepsiCo, Inc. and its divisions and subsidiaries.
We are a leading global food, snack and beverage company. Our brands – which include Quaker Oats, Tropicana, Gatorade, Lay’s and Pepsi – are household names that stand for quality throughout the world. As a global company, we also have strong regional brands such as Walkers, Gamesa and Sabritas. Either independently or through contract manufacturers, we make, market and sell a variety of convenient, enjoyable and wholesome foods and beverages in over 200 countries. Our portfolio includes oat, rice and grain-based foods, as well as carbonated and non-carbonated beverages. Our largest operations are in North America (United States and Canada), Mexico, Russia and the United Kingdom.
We are united by our unique commitment to Performance with Purpose, which means delivering sustainable growth by investing in a healthier future for people and our planet. Our goal is to continue to build a balanced portfolio of enjoyable and wholesome foods and beverages, find innovative ways to reduce the use of energy, water and packaging and provide a great workplace for our associates. Additionally, we are committed to respecting, supporting and investing in the local communities where we operate by hiring local people, creating products designed for local tastes and partnering with local farmers, governments and community groups. We make this commitment because we are a responsible company, and a healthier future for all people and our planet means a more successful future for PepsiCo.
In recognition of our continuing sustainability efforts, we were again included on the Dow Jones Sustainability North America Index and the Dow Jones Sustainability World Index in September 2010. These indices are compiled annually.
Our Divisions
We are organized into four business units, as follows:
| | 1. | PepsiCo Americas Foods (PAF), which includes Frito-Lay North America (FLNA), Quaker Foods North America (QFNA) and all of our Latin American food and snack businesses (LAF), including our Sabritas and Gamesa businesses in Mexico; |
| | 2. | PepsiCo Americas Beverages (PAB), which includes PepsiCo Beverages Americas and Pepsi Beverages Company; |
1
| | 3. | PepsiCo Europe, which includes all beverage, food and snack businesses in Europe; and |
| | 4. | PepsiCo Asia, Middle East and Africa (AMEA), which includes all beverage, food and snack businesses in AMEA. |
Our four business units are comprised of six reportable segments (referred to as divisions), as follows:
See Note 1 to our consolidated financial statements for financial information about our divisions and geographic areas.
Frito-Lay North America
Either independently or through contract manufacturers, FLNA makes, markets, sells and distributes branded snack foods. These foods include Lay’s potato chips, Doritos tortilla chips, Cheetos cheese flavored snacks, Tostitos tortilla chips, branded dips, Ruffles potato chips, Fritos corn chips and SunChips multigrain snacks. FLNA branded products are sold to independent distributors and retailers. In addition, FLNA’s joint venture with Strauss Group makes, markets, sells and distributes Sabra refrigerated dips and spreads. FLNA’s net revenue was $12.6 billion, $12.4 billion and $11.7 billion in 2010, 2009 and 2008, respectively, and approximated 22%, 29% and 27% of our total net revenue in 2010, 2009 and 2008, respectively.
Quaker Foods North America
Either independently or through contract manufacturers, QFNA makes, markets and sells cereals, rice, pasta and other branded products. QFNA’s products include Quaker oatmeal, Aunt Jemima mixes and syrups, Quaker Chewy granola bars, Cap’n Crunch cereal, Quaker grits, Life cereal, Rice-A-Roni, Quaker rice cakes, Pasta Roni and Near East side dishes. These branded products are sold to independent distributors and retailers. QFNA’s net revenue was $2.7 billion in 2010, 2009 and 2008 and approximated 4% of our total net revenue in 2010 and 6% of our total net revenue in both 2009 and 2008.
2
Latin America Foods
Either independently or through contract manufacturers, LAF makes, markets and sells a number of snack food brands including Doritos, Marias Gamesa, Cheetos, Ruffles, Emperador, Saladitas, Sabritas and Lay’s, as well as many Quaker-brand cereals and snacks. These branded products are sold to independent distributors and retailers. LAF’s net revenue was $6.3 billion, $5.7 billion and $5.9 billion in 2010, 2009 and 2008, respectively, and approximated 11%, 13% and 14% of our total net revenue in 2010, 2009 and 2008, respectively.
PepsiCo Americas Beverages
Either independently or through contract manufacturers, PAB makes, markets, sells and distributes beverage concentrates, fountain syrups and finished goods, under various beverage brands including Pepsi, Mountain Dew, Gatorade, 7UP (outside the U.S.), Tropicana Pure Premium, Electropura, Sierra Mist, Epura and Mirinda. PAB also, either independently or through contract manufacturers, makes, markets and sells ready-to-drink tea, coffee and water products through joint ventures with Unilever (under the Lipton brand name) and Starbucks. In addition, PAB licenses the Aquafina water brand to its independent bottlers and markets this brand. Furthermore, PAB manufactures and distributes certain brands licensed from Dr Pepper Snapple Group, Inc. (DPSG), including Dr Pepper and Crush. PAB sells concentrate and finished goods for some of these brands to authorized bottlers, and some of these branded finished goods are sold directly by us to independent distributors and retailers. The bottlers sell our brands as finished goods to independent distributors and retailers. PAB’s net revenue was $20.4 billion, $10.1 billion and $10.9 billion in 2010, 2009 and 2008, respectively, and approximated 35%, 23% and 25% of our total net revenue in 2010, 2009 and 2008, respectively.
See Note 15 for additional information about our acquisitions of The Pepsi Bottling Group, Inc. (PBG) and PepsiAmericas, Inc. (PAS) in 2010.
Europe
Either independently or through contract manufacturers, Europe makes, markets and sells a number of leading snack foods including Lay’s, Walkers, Doritos, Cheetos and Ruffles, as well as many Quaker-brand cereals and snacks, through consolidated businesses as well as through noncontrolled affiliates. Europe also, either independently or through contract manufacturers, makes, markets and sells beverage concentrates, fountain syrups and finished goods under various beverage brands including Pepsi, 7UP and Tropicana. These branded products are sold to authorized bottlers, independent distributors and retailers. In certain markets, however, Europe operates its own bottling plants and distribution facilities. In addition, Europe licenses the Aquafina water brand to certain of its authorized bottlers. Europe also, either independently or through contract manufacturers, makes, markets and sells ready-to-drink tea products through an international joint venture with Unilever (under the Lipton brand name). Europe’s net revenue was $9.6 billion, $7.0 billion and $7.2 billion in 2010, 2009 and 2008,
3
respectively, and approximated 17% our total net revenue in 2010, 2009 and 2008. See Note 15 for additional information about our acquisitions of PBG and PAS in 2010.
Also see “Acquisition of Wimm-Bill-Dann Foods OJSC” below and Note 15 for additional information about our acquisition of Wimm-Bill-Dann Foods OJSC.
Asia, Middle East & Africa
AMEA makes, markets and sells a number of leading snack food brands including Lay’s, Chipsy, Kurkure, Doritos, Cheetos and Smith’s, through consolidated businesses as well as through noncontrolled affiliates. Further, either independently or through contract manufacturers, AMEA makes, markets and sells many Quaker-brand cereals and snacks. AMEA also makes, markets and sells beverage concentrates, fountain syrups and finished goods, under various beverage brands including Pepsi, Mirinda, 7UP and Mountain Dew. These branded products are sold to authorized bottlers, independent distributors and retailers. However, in certain markets, AMEA operates its own bottling plants and distribution facilities. In addition, AMEA licenses the Aquafina water brand to certain of its authorized bottlers. AMEA also, either independently or through contract manufacturers, makes, markets and sells ready-to-drink tea products through an international joint venture with Unilever (under the Lipton brand name). AMEA’s net revenue was $6.3 billion, $5.3 billion and $4.8 billion in 2010, 2009 and 2008, respectively, and approximated 11%, 12% and 11% of our total net revenue in 2010, 2009 and 2008, respectively.
Acquisition of Wimm-Bill-Dann Foods OJSC
On February 3, 2011, we announced that we had completed the previously announced acquisition of ordinary shares, American Depositary Shares, and Global Depositary Shares of Wimm-Bill-Dann Foods OJSC, a company incorporated in the Russian Federation (WBD), which represent in the aggregate approximately 66% of WBD’s outstanding ordinary shares, pursuant to the purchase agreement dated December 1, 2010 between PepsiCo and certain selling shareholders of WBD for approximately $3.8 billion. The acquisition increased PepsiCo’s total ownership of WBD to approximately 77%. See Note 15 for additional information about our acquisition of WBD.
Our Distribution Network
Our products are brought to market through direct-store-delivery (DSD), customer warehouse and foodservice and vending distribution networks. The distribution system used depends on customer needs, product characteristics and local trade practices. These distribution systems are described under the heading “Our Distribution Network” contained in “Item 7. Management’s Discussion and Analysis of Financial Condition and Results of Operations.”
4
Ingredients and Other Supplies
The principal ingredients we use in our food and beverage businesses are apple and pineapple juice and other juice concentrates, aspartame, corn, corn sweeteners, flavorings, flour, grapefruits and other fruits, oats, oranges, potatoes, rice, seasonings, sucralose, sugar, vegetable and essential oils and wheat. Our key packaging materials include plastic resins, including polyethylene terephthalate (PET) and polypropylene resins used for plastic beverage bottles and film packaging used for snack foods, aluminum used for cans, glass bottles, closures, cardboard and paperboard cartons. Fuel and natural gas are also important commodities due to their use in our plants and in the trucks delivering our products. These ingredients, raw materials and commodities are purchased mainly in the open market. We employ specialists to secure adequate supplies of many of these items and have not experienced any significant continuous shortages. The prices we pay for such items are subject to fluctuation. When prices increase, we may or may not pass on such increases to our customers. See Note 10 to our consolidated financial statements for additional information on how we manage our exposure to commodity costs.
Our Brands
We own numerous valuable trademarks which are essential to our worldwide businesses, including Alegro, Amp Energy, Aquafina, Aunt Jemima, Cap’n Crunch, Cheetos, Chester’s, Chipsy, Cracker Jack, Diet Pepsi, Doritos, Duyvis, Emperador, Frito-Lay, Fritos, Fruktovy Sad, Frustyle, Gamesa, Gatorade, G2, G Series, Grandma’s, Izze, Kurkure, Lay’s, Life, Manzanita Sol, Marias Gamesa, Matutano, Mirinda, Miss Vickie’s, Mother’s, Mountain Dew, Mug, Munchies, Naked, Near East, Paso de los Toros, Pasta Roni, Pepsi, Pepsi Max, Pepsi One, Propel, Quaker, Quaker Chewy, Quakes, Red Rock Deli, Rice-A-Roni, Rold Gold, Ruffles, Sabritas, Saladitas, Sakata, Sandora, 7UP and Diet 7UP (outside the United States), Santitas, Sierra Mist, Simba, Smartfood, Smith’s, Snack a Jacks, SoBe, SoBe Lifewater, Sonric’s, Stacy’s, SunChips, Tonus, Tostitos, Trop 50, Tropicana, Tropicana Pure Premium, Tropicana Twister, V Water, Walkers and Ya. We also hold long-term licenses to use valuable trademarks in connection with our products, including Dole and Ocean Spray. Joint ventures in which we participate either own or have the right to use certain trademarks, such as Lipton, Starbucks and Sabra. Trademarks remain valid so long as they are used properly for identification purposes, and we emphasize correct use of our trademarks. We have authorized, through licensing arrangements, the use of many of our trademarks in such contexts as snack food joint ventures and beverage bottling appointments. In addition, we license the use of our trademarks on promotional items for the primary purpose of enhancing brand awareness.
We either own or have licenses to use a number of patents which relate to some of our products, their packaging, the processes for their production and the design and operation of various equipment used in our businesses. Some of these patents are licensed to others.
5
Seasonality
Our beverage and food divisions are subject to seasonal variations. Our beverage sales are higher during the warmer months and certain food sales are higher in the cooler months. Weekly beverage and snack sales are generally highest in the third quarter due to seasonal and holiday-related patterns, and generally lowest in the first quarter. However, taken as a whole, seasonality does not have a material impact on our business.
Our Customers
Our primary customers include wholesale distributors, grocery stores, convenience stores, mass merchandisers, membership stores, authorized independent bottlers and foodservice distributors, including hotels and restaurants. We normally grant our independent bottlers exclusive contracts to sell and manufacture certain beverage products bearing our trademarks within a specific geographic area. These arrangements provide us with the right to charge our independent bottlers for concentrate, finished goods and Aquafina royalties and specify the manufacturing process required for product quality.
Retail consolidation and the current economic environment continue to increase the importance of major customers. In 2010, sales to Wal-Mart Stores, Inc. (Wal-Mart), including Sam’s Club (Sam’s), represented approximately 12% of our total net revenue. Our top five retail customers represented approximately 31% of our 2010 North American net revenue, with Wal-Mart (including Sam’s) representing approximately 18%. These percentages include concentrate sales to our independent bottlers (including concentrate sales to PBG and PAS prior to the February 26, 2010 acquisition date) which were used in finished goods sold by them to these retailers. See “Our Customers” and “Our Related Party Bottlers” contained in “Item 7. Management’s Discussion and Analysis of Financial Condition and Results of Operations” and Note 8 to our consolidated financial statements for more information on our customers, including our independent bottlers and Note 15 to our consolidated financial statements for additional information about acquisitions of PBG and PAS in 2010.
Our Competition
Our businesses operate in highly competitive markets. We compete against global, regional, local and private label manufacturers on the basis of price, quality, product variety and distribution. In U.S. measured channels, our chief beverage competitor, The Coca-Cola Company, has a larger share of CSD (carbonated soft drinks) consumption, while we have a larger share of liquid refreshment beverages consumption. In addition, The Coca-Cola Company has a significant CSD share advantage in many markets outside the United States. Further, our snack brands hold significant leadership positions in the snack industry worldwide. Our snack brands face local, regional and private label competitors, as well as national and global snack competitors, and compete on the basis of price, quality, product variety and distribution. Success in this competitive environment is dependent on effective promotion of existing products, the introduction of new products and the effectiveness of our advertising campaigns, marketing programs and product packaging. We believe that the strength of our brands, innovation and
6
marketing, coupled with the quality of our products and flexibility of our distribution network, allow us to compete effectively.
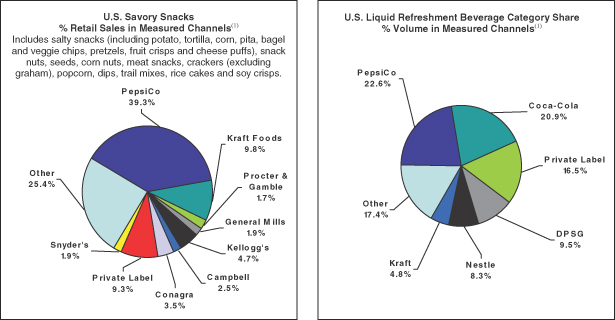
| (1) | The categories and category share information in the charts above are as of December 2010 and are defined by the following source of the information: Information Resources, Inc. The above charts exclude data from certain customers such as Wal-Mart that do not report data to this service. |
Research and Development
We engage in a variety of research and development activities and continue to invest to accelerate growth in these activities. These activities principally involve the development of new products and improvement in the quality of existing products. In 2010, we created our Global Nutrition Group, led by our Chief Scientific Officer, charged with collaborating with each of our divisions to grow our nutrition portfolio by focusing on four target platforms: fruits and vegetables, grains, dairy and functional nutrition. We also expanded our portfolio of products made with all-natural ingredients, increased the amount of whole grains, fruits, vegetables, nuts, seeds and low-fat dairy in certain of our products and took steps to reduce the average amount of sodium, saturated fat and added sugar per serving in certain of our products. We entered into a long-term collaboration agreement with Senomyx, Inc., a leading company focused on proprietary technologies, to discover and develop sweet enhancers and natural high-potency sweeteners with the intent to bring to the marketplace lower-calorie, great tasting PepsiCo beverages. We invested in agricultural development and the development and implementation of new technologies to both enhance the quality and value of current and proposed product lines and to minimize our impact on the environment, including by building facilities that conserve energy and raw materials and reduce waste and by reviewing our packaging process to continue to reduce total packaging volume, recycle containers, use renewable resources and remove environmentally sensitive materials. Consumer research is
7
excluded from research and development costs and included in other marketing costs. Research and development costs were $488 million in 2010, $414 million in 2009 and $388 million in 2008 and are reported within selling, general and administrative expenses.
Regulatory Environment and Environmental Compliance
The conduct of our businesses, and the production, distribution, sale, advertising, labeling, safety, transportation and use of many of our products, are subject to various laws and regulations administered by federal, state and local governmental agencies in the United States, as well as to foreign laws and regulations administered by government entities and agencies in markets where we operate. It is our policy to abide by the laws and regulations around the world that apply to our businesses.
In the United States, we are required to comply with federal laws, such as the Food, Drug and Cosmetic Act, the Occupational Safety and Health Act, the Clean Air Act, the Clean Water Act, the Resource Conservation and Recovery Act, the Federal Motor Carrier Safety Act, The Foreign Corrupt Practices Act, laws governing equal employment opportunity, customs and foreign trade laws and regulations, laws regulating the sales of products in schools, and various other federal statutes and regulations. We are also subject to various state and local statutes and regulations, including California Proposition 65 which requires that a specific warning appear on any product that contains a component listed by the State of California as having been found to cause cancer or birth defects. Many food and beverage producers who sell products in California, including PepsiCo, may be required to provide warning labels on their products. See also “Changes in the legal and regulatory environment could limit our business activities, increase our operating costs, reduce demand for our products or result in litigation” in “Risk Factors” in Item 1A. of our Annual Report on Form 10-K for the fiscal year ended December 25, 2010 (2010 Form 10-K). Outside the United States, we are subject to numerous similar and other laws and regulations, including anti-corruption laws and regulations. In addition, in many jurisdictions, compliance with competition laws is of special importance to us due to our competitive position in those jurisdictions. We rely on legal and operational compliance programs, as well as local in-house and outside counsel, to guide our businesses in complying with applicable laws and regulations of the countries in which we do business.
Legislation has been enacted in certain U.S. states and in certain of the countries in which our products are sold that requires collection and recycling of containers or that prohibits the sale of our beverages in certain non-refillable containers unless a deposit or other fee is charged. It is possible that similar or more restrictive legal requirements may be proposed or enacted in the future. In addition, proposals have been introduced in certain jurisdictions in which we operate which would impose special taxes on products we sell. For example, various federal, state and local government officials have raised the possibility of taxing the sale of certain “sugared” beverages, including non-diet soft drinks, fruit drinks, teas and flavored waters, to help pay for the cost of certain government programs.
8
The cost of compliance with U.S. and foreign laws does not have a material financial impact on our operations.
We are also subject to national and local environmental laws in the United States and in foreign countries in which we do business, including laws related to water consumption and treatment, wastewater and air emissions, handling and disposal of waters, and, in the United States, the Comprehensive Environmental Response, Compensation and Liability Act, the Resource Conservation and Recovery Act and other federal and state laws regarding handling, release and disposal of wastes at on-site and off-site locations. We are committed to meeting all applicable environmental compliance requirements. We and our subsidiaries are subject to environmental remediation obligations in the normal course of business, as well as remediation and related indemnification obligations in connection with certain historical activities and contractual obligations of businesses acquired by our subsidiaries. While neither the results of these proceedings nor any indemnification obligations or other liabilities of our subsidiaries in connection therewith can be predicted with certainty, environmental compliance costs have not had, and are not expected to have, a material impact on our capital expenditures, earnings or competitive position. See also “Changes in the legal and regulatory environment could limit our business activities, increase our operating costs, reduce demand for our products or result in litigation” in “Risk Factors” in Item 1A. of our 2010 Form 10-K.
Employees
As of December 25, 2010, we employed approximately 294,000 people worldwide, including approximately 108,000 people within the United States. Our employment levels are subject to seasonal variations. We or our subsidiaries are a party to numerous collective bargaining agreements. We expect that we will be able to renegotiate these collective bargaining agreements on satisfactory terms when they expire. We believe that relations with our employees are generally good.
Available Information
We are required to file annual, quarterly and current reports, proxy statements and other information with the U.S. Securities and Exchange Commission (SEC). The public may read and copy any materials that we file with the SEC at the SEC’s Public Reference Room at 100 F Street, N.E., Washington, D.C. 20549. Information on the operation of the Public Reference Room may be obtained by calling the SEC at 1-800-SEC-0330. In addition, the SEC maintains an Internet site that contains reports, proxy and information statements, and other information regarding issuers that file electronically with the SEC athttp://www.sec.gov.
Our Annual Reports on Form 10-K, Quarterly Reports on Form 10-Q, Current Reports on Form 8-K, proxy statements and amendments to those reports filed or furnished pursuant to Section 13(a) or 15(d) of the Exchange Act, are also available free of charge on our Internet site athttp://www.pepsico.com as soon as reasonably practicable after such reports are electronically filed with or furnished to the SEC. The information on our
9
website is not, and shall not be deemed to be, a part hereof or incorporated into this or any of our other filings with the SEC.
10
Item 7. Management’s Discussion and Analysis of Financial Condition and Results of Operations
| | | | |
OUR BUSINESS | | | | |
Executive Overview | | | 13 | |
Our Operations | | | 16 | |
Our Customers | | | 18 | |
Our Distribution Network | | | 19 | |
Our Competition | | | 20 | |
Other Relationships | | | 20 | |
Our Business Risks | | | 21 | |
OUR CRITICAL ACCOUNTING POLICIES | | | | |
Revenue Recognition | | | 24 | |
Goodwill and Other Intangible Assets | | | 25 | |
Income Tax Expense and Accruals | | | 27 | |
Pension and Retiree Medical Plans | | | 28 | |
OUR FINANCIAL RESULTS | | | | |
Items Affecting Comparability | | | 32 | |
Results of Operations – Consolidated Review | | | 35 | |
Results of Operations – Division Review | | | 40 | |
Frito-Lay North America | | | 42 | |
Quaker Foods North America | | | 43 | |
Latin America Foods | | | 44 | |
PepsiCo Americas Beverages | | | 45 | |
Europe | | | 46 | |
Asia, Middle East & Africa | | | 48 | |
Our Liquidity and Capital Resources | | | 49 | |
11
| | | | |
Consolidated Statement of Income | | | 53 | |
Consolidated Statement of Cash Flows | | | 54 | |
Consolidated Balance Sheet | | | 56 | |
Consolidated Statement of Equity | | | 57 | |
Notes to Consolidated Financial Statements | | | | |
Note 1 – Basis of Presentation and Our Divisions | | | 59 | |
Note 2 – Our Significant Accounting Policies | | | 65 | |
Note 3 – Restructuring, Impairment and Integration Charges | | | 68 | |
Note 4 – Property, Plant and Equipment and Intangible Assets | | | 71 | |
Note 5 – Income Taxes | | | 73 | |
Note 6 – Stock-Based Compensation | | | 76 | |
Note 7 – Pension, Retiree Medical and Savings Plans | | | 78 | |
Note 8 – Noncontrolled Bottling Affiliates | | | 86 | |
Note 9 – Debt Obligations and Commitments | | | 89 | |
Note 10 – Financial Instruments | | | 91 | |
Note 11 – Net Income Attributable to PepsiCo per Common Share | | | 95 | |
Note 12 – Preferred Stock | | | 96 | |
Note 13 – Accumulated Other Comprehensive Loss Attributable to PepsiCo | | | 97 | |
Note 14 – Supplemental Financial Information | | | 98 | |
Note 15 – Acquisitions | | | 99 | |
MANAGEMENT’S RESPONSIBILITY FOR FINANCIAL REPORTING | | | 105 | |
REPORT OF INDEPENDENT REGISTERED PUBLIC ACCOUNTING FIRM | | | 107 | |
SELECTED FINANCIAL DATA | | | 108 | |
FIVE-YEAR SUMMARY | | | 110 | |
GLOSSARY | | | 112 | |
12
Our discussion and analysis is an integral part of our consolidated financial statements and is provided as an addition to, and should be read in connection with, our consolidated financial statements and the accompanying notes. Definitions of key terms can be found in the glossary beginning on page 112. Tabular dollars are presented in millions, except per share amounts. All per share amounts reflect common per share amounts, assume dilution unless noted, and are based on unrounded amounts. Percentage changes are based on unrounded amounts.
OUR BUSINESS
Executive Overview
We are a leading global food, snack and beverage company. Our brands – which include Quaker Oats, Tropicana, Gatorade, Lay’s and Pepsi – are household names that stand for quality throughout the world. As a global company, we also have strong regional brands such as Walkers, Gamesa and Sabritas. Either independently or through contract manufacturers, we make, market and sell a variety of convenient, enjoyable and wholesome foods and beverages in over 200 countries. Our portfolio includes oat, rice and grain-based foods, as well as carbonated and non-carbonated beverages. Our largest operations are in North America (United States and Canada), Mexico, Russia and the United Kingdom. Additional information concerning our divisions and geographic areas is presented in Note 1.
We are united by our unique commitment to Performance with Purpose, which means delivering sustainable growth by investing in a healthier future for people and our planet. Our goal is to continue to build a balanced portfolio of enjoyable and wholesome foods and beverages, find innovative ways to reduce the use of energy, water and packaging and provide a great workplace for our associates. Additionally, we are committed to respecting, supporting and investing in the local communities where we operate by hiring local people, creating products designed for local tastes and partnering with local farmers, governments and community groups. We make this commitment because we are a responsible company and a healthier future for all people and our planet means a more successful future for PepsiCo.
In recognition of our continuing sustainability efforts, we were again included on the Dow Jones Sustainability North America Index and the Dow Jones Sustainability World Index in September 2010. These indices are compiled annually.
Our management monitors a variety of key indicators to evaluate our business results and financial conditions. These indicators include market share, volume, net revenue, operating profit, management operating cash flow, earnings per share and return on invested capital.
13
Strategies to Drive Our Growth into the Future
We remain focused on growing our business with the objectives of improving our financial results and increasing returns for our shareholders. We continue to focus on delivering strong financial performance in both the near term and the long term, while making global investments in key regions and targeted product categories to drive sustainable growth. We have identified six key challenges and related strategic business imperatives that we believe will enable us to drive growth into the future:
Build and extend our macro snack portfolio
Our first imperative is to build and extend our macro snack portfolio. Building and extending our profitable macro snacks business is important to our future. PepsiCo is the largest player in the macro snack category, and we believe there is still room for growth. Our goal in the macro snacks business is to grow our core salty snack brands that are loved and respected around the world, while expanding into adjacent categories like crackers, bread bites and baked snacks. We will work to continue to grow our portfolio from Fun-for-You to Better-for-You products—while adding many Good-for-You products that are designed to meet growing global demand for wholesome and convenient nutrition. We will also strive to create new flavors in tune with local tastes, which reflect local culture and traditions. We believe that by doing so, we will position ourselves to gain share, while continuing to grow the top- and bottom-line in our macro snack business.
Sustainably and profitably grow our beverage business worldwide
Our second imperative is to sustainably and profitably grow our beverage business worldwide. The U.S. liquid refreshment beverage category and challenging economic conditions facing consumers continue to place pressure on our beverage business worldwide. In the face of this pressure, we continue to take action to ensure sustainable profitable growth in our beverage business worldwide. In 2010, we revitalized both the Gatorade brand and the no-calorie carbonated category by promoting Pepsi Max. Our focus in 2011 will be on taking our North American beverage business and growing it sustainably for the future, while continuing to invest in emerging and developing markets—including the vital China and India markets.
Unleash the power of the Power of One to provide better value for our customers
Our third imperative is to unleash the power of the Power of One to provide better value for customers. We must maintain mutually beneficial relationships with our customers to effectively compete. We are a leader in two extraordinary consumer categories that have special relevance to our customers across the globe. Our snacks and beverages are both high-velocity categories; both generate retail traffic; both are profitable; and both deliver strong cash flow. Studies show that 85 percent of the time, when a person eats a snack, he or she also reaches for a beverage. To realize the value of Power of One in 2010, we successfully completed our bottling acquisitions, which enabled us to better service our customers. We also continued, with a critical mass of SAP implementations, to
14
standardize processes, improve organizational alignment and benchmark performance. In 2011, we are re-focusing our efforts with a systematic approach to unlock the Power of One across the entire value chain. We believe the opportunities in the U.S., in particular, are vast. We will work to make Power of One changes at every level: from the way our products reach our customers; to how our products are displayed; to the channels through which our products are marketed and advertised.
Build and expand our nutrition business
Our fourth imperative is to build and expand our nutrition business and our global nutrition initiatives, to rapidly grow our Good-for-You portfolio of products—both organically and through strategic tuck-in acquisitions. Consumer tastes and preferences are constantly changing and our success depends on our ability to respond to consumer trends, including responding to consumers’ desire for healthier choices. Our basic belief is that companies succeed when society succeeds, and what is good for the world should be good for business. This includes encouraging people to live healthier lives by offering a portfolio of both enjoyable and wholesome foods and beverages. With the acquisition of Wimm-Bill-Dann Foods OJSC (WBD), PepsiCo’s annual revenues from nutritious and functional foods are expected to rise from $10 billion to nearly $13 billion. We also are expanding our portfolio of products made with all-natural ingredients, increasing the amount of whole grains, fruits, vegetables, nuts, seeds and low-fat dairy in certain of our products and taking steps to reduce the average amount of sodium, saturated fat and added sugar per serving in certain of our products.
Cherish our PepsiCo associates
Our fifth imperative is to cherish our PepsiCo associates. Our continued growth requires us to hire, retain and develop our leadership bench. We are fortunate to employ, worldwide, a truly remarkable set of associates. The market becomes more competitive every day and innovation is the key to success. It is people who hold that key and to be a good employer is one of the most important strategic decisions a company has to make.
Achieve excellent performance
Our sixth and final imperative is the sum total of the other five. Our continued success requires that we do everything we can to position ourselves to achieve excellent performance in each of the areas mentioned above. By focusing on the five key challenges and related strategic business imperatives discussed above, we believe we can achieve this goal.
15
Our Operations
We are organized into four business units, as follows:
| | 1) | PepsiCo Americas Foods (PAF), which includes Frito-Lay North America (FLNA), Quaker Foods North America (QFNA) and all of our Latin American food and snack businesses (LAF), including our Sabritas and Gamesa businesses in Mexico; |
| | 2) | PepsiCo Americas Beverages (PAB), which includes PepsiCo Beverages Americas and Pepsi Beverages Company; |
| | 3) | PepsiCo Europe, which includes all beverage, food and snack businesses in Europe; and |
| | 4) | PepsiCo Asia, Middle East and Africa (AMEA), which includes all beverage, food and snack businesses in AMEA. |
Our four business units are comprised of six reportable segments (referred to as divisions), as follows:
Frito-Lay North America
Either independently or through contract manufacturers, FLNA makes, markets, sells and distributes branded snack foods. These foods include Lay’s potato chips, Doritos tortilla chips, Cheetos cheese flavored snacks, Tostitos tortilla chips, branded dips, Ruffles potato chips, Fritos corn chips and SunChips multigrain snacks. FLNA branded products are sold to independent distributors and retailers. In addition, FLNA’s joint venture with Strauss Group makes, markets, sells and distributes Sabra refrigerated dips and spreads.
Quaker Foods North America
Either independently or through contract manufacturers, QFNA makes, markets and sells cereals, rice, pasta and other branded products. QFNA’s products include Quaker oatmeal, Aunt Jemima mixes and syrups, Quaker Chewy granola bars, Cap’n Crunch cereal, Quaker grits, Life cereal, Rice-A-Roni, Quaker rice cakes, Pasta Roni and Near East side dishes. These branded products are sold to independent distributors and retailers.
16
Latin America Foods
Either independently or through contract manufacturers, LAF makes, markets and sells a number of snack food brands including Doritos, Marias Gamesa, Cheetos, Ruffles, Emperador, Saladitas, Sabritas and Lay’s, as well as many Quaker-brand cereals and snacks. These branded products are sold to independent distributors and retailers.
PepsiCo Americas Beverages
Either independently or through contract manufacturers, PAB makes, markets, sells and distributes beverage concentrates, fountain syrups and finished goods, under various beverage brands including Pepsi, Mountain Dew, Gatorade, 7UP (outside the U.S.), Tropicana Pure Premium, Electropura, Sierra Mist, Epura and Mirinda. PAB also, either independently or through contract manufacturers, makes, markets and sells ready-to-drink tea, coffee and water products through joint ventures with Unilever (under the Lipton brand name) and Starbucks. In addition, PAB licenses the Aquafina water brand to its independent bottlers and markets this brand. Furthermore, PAB manufactures and distributes certain brands licensed from Dr Pepper Snapple Group, Inc. (DPSG), including Dr Pepper and Crush. PAB sells concentrate and finished goods for some of these brands to authorized bottlers, and some of these branded finished goods are sold directly by us to independent distributors and retailers. The bottlers sell our brands as finished goods to independent distributors and retailers. PAB’s volume reflects sales to its independent distributors and retailers, as well as the sales of beverages bearing our trademarks that bottlers have reported as sold to independent distributors and retailers. BCS and CSE are not necessarily equal during any given period due to seasonality, timing of product launches, product mix, bottler inventory practices and other factors. However, the difference between BCS and CSE measures has been greatly reduced since our acquisitions of our anchor bottlers, PBG and PAS, on February 26, 2010, as we now consolidate these bottlers and thus eliminate the impact of differences between BCS and CSE for a substantial majority of PAB’s total volume. While our revenues are not entirely based on BCS volume, as there continue to be independent bottlers in the supply chain, we believe that BCS is a valuable measure as it quantifies the sell-through of our products at the consumer level.
See Note 15 for additional information about our acquisitions of PBG and PAS in 2010.
Europe
Either independently or through contract manufacturers, Europe makes, markets and sells a number of leading snack foods including Lay’s, Walkers, Doritos, Cheetos and Ruffles, as well as many Quaker-brand cereals and snacks, through consolidated businesses as well as through noncontrolled affiliates. Europe also, either independently or through contract manufacturers, makes, markets and sells beverage concentrates, fountain syrups and finished goods under various beverage brands including Pepsi, 7UP and Tropicana. These branded products are sold to authorized bottlers, independent distributors and retailers. In certain markets, however, Europe operates its own bottling plants and distribution facilities. In addition, Europe licenses the Aquafina water brand to certain of
17
its authorized bottlers. Europe also, either independently or through contract manufacturers, makes, markets and sells ready-to-drink tea products through an international joint venture with Unilever (under the Lipton brand name).
Europe reports two measures of volume. Snacks volume is reported on a system-wide basis, which includes our own sales and the sales by our noncontrolled affiliates of snacks bearing Company-owned or licensed trademarks. Beverage volume reflects Company-owned or authorized bottler sales of beverages bearing Company-owned or licensed trademarks to independent distributors and retailers (see PepsiCo Americas Beverages above).
See “Acquisition of Wimm-Bill-Dann Foods OJSC” in “Business” in Item 1. and Note 15 for additional information about our acquisitions of PBG and PAS in 2010 and our acquisition of WBD.
Asia, Middle East & Africa
AMEA makes, markets and sells a number of leading snack food brands including Lay’s, Chipsy, Kurkure, Doritos, Cheetos and Smith’s, through consolidated businesses as well as through noncontrolled affiliates. Further, either independently or through contract manufacturers, AMEA makes, markets and sells many Quaker-brand cereals and snacks. AMEA also makes, markets and sells beverage concentrates, fountain syrups and finished goods, under various beverage brands including Pepsi, Mirinda, 7UP and Mountain Dew. These branded products are sold to authorized bottlers, independent distributors and retailers. However, in certain markets, AMEA operates its own bottling plants and distribution facilities. In addition, AMEA licenses the Aquafina water brand to certain of its authorized bottlers. AMEA also, either independently or through contract manufacturers, makes, markets and sells ready-to-drink tea products through an international joint venture with Unilever (under the Lipton brand name). AMEA reports two measures of volume (see Europe above).
Our Customers
Our primary customers include wholesale distributors, grocery stores, convenience stores, mass merchandisers, membership stores, authorized independent bottlers and foodservice distributors, including hotels and restaurants. We normally grant our independent bottlers exclusive contracts to sell and manufacture certain beverage products bearing our trademarks within a specific geographic area. These arrangements provide us with the right to charge our independent bottlers for concentrate, finished goods and Aquafina royalties and specify the manufacturing process required for product quality.
Since we do not sell directly to the consumer, we rely on and provide financial incentives to our customers to assist in the distribution and promotion of our products. For our independent distributors and retailers, these incentives include volume-based rebates, product placement fees, promotions and displays. For our independent bottlers, these incentives are referred to as bottler funding and are negotiated annually with each bottler to support a variety of trade and consumer programs, such as consumer incentives,
18
advertising support, new product support, and vending and cooler equipment placement. Consumer incentives include coupons, pricing discounts and promotions, and other promotional offers. Advertising support is directed at advertising programs and supporting independent bottler media. New product support includes targeted consumer and retailer incentives and direct marketplace support, such as point-of-purchase materials, product placement fees, media and advertising. Vending and cooler equipment placement programs support the acquisition and placement of vending machines and cooler equipment. The nature and type of programs vary annually.
Retail consolidation and the current economic environment continue to increase the importance of major customers. In 2010, sales to Wal-Mart (including Sam’s) represented approximately 12% of our total net revenue. Our top five retail customers represented approximately 31% of our 2010 North American net revenue, with Wal-Mart (including Sam’s) representing approximately 18%. These percentages include concentrate sales to our independent bottlers (including concentrate sales to PBG and PAS prior to the February 26, 2010 acquisition date) which were used in finished goods sold by them to these retailers.
See Note 15 for additional information about our acquisitions of PBG and PAS in 2010.
Our Related Party Bottlers
Prior to our acquisitions of PBG and PAS on February 26, 2010, we had noncontrolling interests in these bottlers. Because our ownership was less than 50%, and since we did not control these bottlers, we did not consolidate their results. Instead, we included our share of their net income based on our percentage of economic ownership in our income statement as bottling equity income. On February 26, 2010, in connection with our acquisitions of PBG and PAS, we began to consolidate the results of these bottlers. Our share of the net income of Pepsi Bottling Ventures LLC (PBV) is reflected in bottling equity income. Our share of income or loss from other noncontrolled affiliates is recorded as a component of selling, general and administrative expenses. See Note 8 for additional information on these related parties and related party commitments and guarantees.
Our Distribution Network
Our products are brought to market through DSD, customer warehouse and foodservice and vending distribution networks. The distribution system used depends on customer needs, product characteristics and local trade practices.
Direct-Store-Delivery
We, our independent bottlers and our distributors operate DSD systems that deliver snacks and beverages directly to retail stores where the products are merchandised by our employees or our bottlers.DSD enables us to merchandise with maximum visibility and appeal. DSD is especially well-suited to products that are restocked often and respond to in-store promotion and merchandising.
19
Customer Warehouse
Some of our products are delivered from our manufacturing plants and warehouses to customer warehouses and retail stores. These less costly systems generally work best for products that are less fragile and perishable, have lower turnover, and are less likely to be impulse purchases.
Foodservice and Vending
Our foodservice and vending sales force distributes snacks, foods and beverages to third-party foodservice and vending distributors and operators. Our foodservice and vending sales force also distributes certain beverages through our independent bottlers. This distribution system supplies our products to restaurants, businesses, schools, stadiums and similar locations.
Our Competition
Our businesses operate in highly competitive markets. We compete against global, regional, local and private label manufacturers on the basis of price, quality, product variety and distribution. In U.S. measured channels, our chief beverage competitor, The Coca-Cola Company, has a larger share of CSD consumption, while we have a larger share of liquid refreshment beverages consumption. In addition, The Coca-Cola Company has a significant CSD share advantage in many markets outside the United States. Further, our snack brands hold significant leadership positions in the snack industry worldwide. Our snack brands face local, regional and private label competitors, as well as national and global snack competitors, and compete on the basis of price, quality, product variety and distribution. Success in this competitive environment is dependent on effective promotion of existing products, the introduction of new products and the effectiveness of our advertising campaigns, marketing programs and product packaging. We believe that the strength of our brands, innovation and marketing, coupled with the quality of our products and flexibility of our distribution network, allow us to compete effectively.
Other Relationships
Certain members of our Board of Directors also serve on the boards of certain vendors and customers. Those Board members do not participate in our vendor selection and negotiations nor in our customer negotiations. Our transactions with these vendors and customers are in the normal course of business and are consistent with terms negotiated with other vendors and customers. In addition, certain of our employees serve on the boards of PBV and other affiliated companies and do not receive incremental compensation for their Board services.
20
Our Business Risks
We are subject to risks in the normal course of business. See “Risk Factors” in Item 1A. of our 2010 Form 10-K and “Executive Overview” above and “Market Risks” below for more information about these risks.
Risk Management Framework
The achievement of our strategic and operating objectives will necessarily involve taking risks. Our risk management process is intended to ensure that risks are taken knowingly and purposefully. As such, we leverage an integrated risk management framework to identify, assess, prioritize, manage, monitor and communicate risks across the Company. This framework includes:
| | • | | The PepsiCo Risk Committee (PRC), comprised of a cross-functional, geographically diverse, senior management group which meets regularly to identify, assess, prioritize and address strategic and reputational risks; |
| | • | | Division Risk Committees (DRCs), comprised of cross-functional senior management teams which meet regularly to identify, assess, prioritize and address division-specific operating risks; |
| | • | | PepsiCo’s Risk Management Office, which manages the overall risk management process, provides ongoing guidance, tools and analytical support to the PRC and the DRCs, identifies and assesses potential risks and facilitates ongoing communication between the parties, as well as to PepsiCo’s Audit Committee and Board of Directors; |
| | • | | PepsiCo Corporate Audit, which evaluates the ongoing effectiveness of our key internal controls through periodic audit and review procedures; and |
| | • | | PepsiCo’s Compliance Department, which leads and coordinates our compliance policies and practices. |
Market Risks
We are exposed to market risks arising from adverse changes in:
| | • | | commodity prices, affecting the cost of our raw materials and energy; |
| | • | | foreign exchange rates; and |
In the normal course of business, we manage these risks through a variety of strategies, including productivity initiatives, global purchasing programs and hedging strategies. Ongoing productivity initiatives involve the identification and effective implementation of meaningful cost-saving opportunities or efficiencies. Our global purchasing programs include fixed-price purchase orders and pricing agreements. See Note 9 for further information on our non-cancelable purchasing commitments. Our hedging strategies include the use of derivatives. Certain derivatives are designated as either cash flow or fair value hedges and qualify for hedge accounting treatment, while others do not qualify
21
and are marked to market through earnings. Cash flows from derivatives used to manage commodity, foreign exchange or interest risks are classified as operating activities. We do not use derivative instruments for trading or speculative purposes. We perform assessments of our counterparty credit risk regularly, including a review of credit ratings, credit default swap rates and potential nonperformance of the counterparty. Based on our most recent assessment of our counterparty credit risk, we consider this risk to be low. In addition, we enter into derivative contracts with a variety of financial institutions that we believe are creditworthy in order to reduce our concentration of credit risk and generally settle with these financial institutions on a net basis.
The fair value of our derivatives fluctuates based on market rates and prices. The sensitivity of our derivatives to these market fluctuations is discussed below. See Note 10 for further discussion of these derivatives and our hedging policies. See “Our Critical Accounting Policies” for a discussion of the exposure of our pension plan assets and pension and retiree medical liabilities to risks related to market fluctuations.
Inflationary, deflationary and recessionary conditions impacting these market risks also impact the demand for and pricing of our products. See “Risk Factors” in Item 1A. of our 2010 Form 10-K for further discussion.
Commodity Prices
We expect to be able to reduce the impact of volatility in our raw material and energy costs through our hedging strategies and ongoing sourcing initiatives.
Our open commodity derivative contracts that qualify for hedge accounting had a face value of $590 million as of December 25, 2010 and $151 million as of December 26, 2009. These contracts resulted in net unrealized gains of $46 million as of December 25, 2010 and net unrealized losses of $29 million as of December 26, 2009. At the end of 2010, the potential change in fair value of commodity derivative instruments, assuming a 10% decrease in the underlying commodity price, would have decreased our net unrealized gains in 2010 by $64 million.
Our open commodity derivative contracts that do not qualify for hedge accounting had a face value of $266 million as of December 25, 2010 and $231 million as of December 26, 2009. These contracts resulted in net gains of $26 million in 2010 and net losses of $57 million in 2009. At the end of 2010, the potential change in fair value of commodity derivative instruments, assuming a 10% decrease in the underlying commodity price, would have decreased our net gains in 2010 by $29 million.
Foreign Exchange
Financial statements of foreign subsidiaries are translated into U.S. dollars using period-end exchange rates for assets and liabilities and weighted-average exchange rates for revenues and expenses. Adjustments resulting from translating net assets are reported as a separate component of accumulated other comprehensive loss within shareholders’ equity under the caption currency translation adjustment.
22
Our operations outside of the U.S. generate over 45% of our net revenue, with Mexico, Canada, Russia and the United Kingdom comprising approximately 20% of our net revenue. As a result, we are exposed to foreign currency risks. During 2010, favorable foreign currency contributed 1 percentage point to net revenue growth, primarily due to appreciation of the Mexican peso, Canadian dollar and Brazilian real, partially offset by depreciation of the Venezuelan bolivar. Currency declines against the U.S. dollar which are not offset could adversely impact our future results.
In addition, we continue to use the official exchange rate to translate the financial statements of our snack and beverage businesses in Venezuela. We use the official rate as we currently intend to remit dividends solely through the government-operated Foreign Exchange Administration Board (CADIVI). As of the beginning of our 2010 fiscal year, the results of our Venezuelan businesses were reported under hyperinflationary accounting. This determination was made based upon Venezuela’s National Consumer Price Index (NCPI) which indicated cumulative inflation in Venezuela in excess of 100% for the three-year period ended November 30, 2009. Consequently, the functional currency of our Venezuelan entities was changed from the bolivar fuerte (bolivar) to the U.S. dollar. Effective January 11, 2010, the Venezuelan government devalued the bolivar by resetting the official exchange rate from 2.15 bolivars per dollar to 4.3 bolivars per dollar; however, certain activities were permitted to access an exchange rate of 2.6 bolivars per dollar. Effective June 2010, the Central Bank of Venezuela began accepting and approving applications, under certain conditions, for non-CADIVI exchange transactions at the weighted-average implicit exchange rate obtained from the Transaction System for Foreign Currency Denominated Securities (SITME). As of December 25, 2010, this rate was 5.3 bolivars per dollar. We continue to use all available options, including CADIVI, SITME and bond auctions, to obtain U.S. dollars to meet our operational needs. In 2010, the majority of our transactions were remeasured at the 4.3 exchange rate, and as a result of the change to hyperinflationary accounting and the devaluation of the bolivar, we recorded a one-time net charge of $120 million in the first quarter of 2010. In 2010, our operations in Venezuela comprised 4% of our cash and cash equivalents balance and generated less than 1% of our net revenue. As of January 1, 2011, the Venezuelan government unified the country’s two official exchange rates (4.3 and 2.6 bolivars per dollar) by eliminating the 2.6 bolivars per dollar rate, which was previously permitted for certain activities. This change did not, nor is expected to, have a material impact on our financial statements.
Exchange rate gains or losses related to foreign currency transactions are recognized as transaction gains or losses in our income statement as incurred. We may enter into derivatives, primarily forward contracts with terms of no more than two years, to manage our exposure to foreign currency transaction risk. Our foreign currency derivatives had a total face value of $1.7 billion as of December 25, 2010 and $1.2 billion as of December 26, 2009. The contracts that qualify for hedge accounting resulted in net unrealized losses of $15 million as of December 25, 2010 and $20 million as of December 26, 2009. At the end of 2010, we estimate that an unfavorable 10% change in the exchange rates would have increased our net unrealized losses by $119 million. The contracts that do not qualify for hedge accounting resulted in net losses of $6 million in 2010 and a net
23
gain of $1 million in 2009. All losses and gains were offset by changes in the underlying hedged items, resulting in no net material impact on earnings.
Interest Rates
We centrally manage our debt and investment portfolios considering investment opportunities and risks, tax consequences and overall financing strategies. We use various interest rate derivative instruments including, but not limited to, interest rate swaps, cross-currency interest rate swaps, Treasury locks and swap locks to manage our overall interest expense and foreign exchange risk. These instruments effectively change the interest rate and currency of specific debt issuances. Certain of our fixed rate indebtedness has been swapped to floating rates. The notional amount, interest payment and maturity date of the interest rate and cross-currency swaps match the principal, interest payment and maturity date of the related debt. Our Treasury locks and swap locks are entered into to protect against unfavorable interest rate changes relating to forecasted debt transactions.
Assuming year-end 2010 variable rate debt and investment levels, a 1-percentage-point increase in interest rates would have increased net interest expense by $43 million in 2010.
OUR CRITICAL ACCOUNTING POLICIES
An appreciation of our critical accounting policies is necessary to understand our financial results. These policies may require management to make difficult and subjective judgments regarding uncertainties, and as a result, such estimates may significantly impact our financial results. The precision of these estimates and the likelihood of future changes depend on a number of underlying variables and a range of possible outcomes. Other than our accounting for pension plans, our critical accounting policies do not involve the choice between alternative methods of accounting. We applied our critical accounting policies and estimation methods consistently in all material respects, and for all periods presented, and have discussed these policies with our Audit Committee.
Our critical accounting policies arise in conjunction with the following:
| | • | | goodwill and other intangible assets; |
| | • | | income tax expense and accruals; and |
| | • | | pension and retiree medical plans. |
Revenue Recognition
Our products are sold for cash or on credit terms. Our credit terms, which are established in accordance with local and industry practices, typically require payment within 30 days of delivery in the U.S., and generally within 30 to 90 days internationally, and may allow discounts for early payment. We recognize revenue upon shipment or delivery to our customers based on written sales terms that do not allow for a right of return. However,
24
our policy for DSD and certain chilled products is to remove and replace damaged and out-of-date products from store shelves to ensure that consumers receive the product quality and freshness they expect. Similarly, our policy for certain warehouse-distributed products is to replace damaged and out-of-date products. Based on our experience with this practice, we have reserved for anticipated damaged and out-of-date products.
Our policy is to provide customers with product when needed. In fact, our commitment to freshness and product dating serves to regulate the quantity of product shipped or delivered. In addition, DSD products are placed on the shelf by our employees with customer shelf space and storerooms limiting the quantity of product. For product delivered through our other distribution networks, we monitor customer inventory levels.
As discussed in “Our Customers,” we offer sales incentives and discounts through various programs to customers and consumers. Sales incentives and discounts are accounted for as a reduction of revenue and totaled $29.1 billion in 2010, $12.9 billion in 2009 and $12.5 billion in 2008. Sales incentives include payments to customers for performing merchandising activities on our behalf, such as payments for in-store displays, payments to gain distribution of new products, payments for shelf space and discounts to promote lower retail prices. A number of our sales incentives, such as bottler funding to independent bottlers and customer volume rebates, are based on annual targets, and accruals are established during the year for the expected payout. These accruals are based on contract terms and our historical experience with similar programs and require management judgment with respect to estimating customer participation and performance levels. Differences between estimated expense and actual incentive costs are normally insignificant and are recognized in earnings in the period such differences are determined. The terms of most of our incentive arrangements do not exceed a year, and therefore do not require highly uncertain long-term estimates. For interim reporting, we estimate total annual sales incentives for most of our programs and record a pro rata share in proportion to revenue. Certain arrangements, such as fountain pouring rights, may extend beyond one year. Payments made to obtain these rights are recognized over the shorter of the economic or contractual life, as a reduction of revenue, and the remaining balances of $296 million, as of both December 25, 2010 and December 26, 2009, are included in current assets and other assets on our balance sheet.
We estimate and reserve for our bad debt exposure based on our experience with past due accounts and collectibility, the aging of accounts receivable and our analysis of customer data. Bad debt expense is classified within selling, general and administrative expenses in our income statement.
Goodwill and Other Intangible Assets
We sell products under a number of brand names, many of which were developed by us. The brand development costs are expensed as incurred. We also purchase brands in acquisitions. Upon acquisition, the purchase price is first allocated to identifiable assets and liabilities, including brands, based on estimated fair value, with any remaining purchase price recorded as goodwill. Determining fair value requires significant estimates and assumptions based on an evaluation of a number of factors, such as
25
marketplace participants, product life cycles, market share, consumer awareness, brand history and future expansion expectations, amount and timing of future cash flows and the discount rate applied to the cash flows.
We believe that a brand has an indefinite life if it has a history of strong revenue and cash flow performance, and we have the intent and ability to support the brand with marketplace spending for the foreseeable future. If these perpetual brand criteria are not met, brands are amortized over their expected useful lives, which generally range from five to 40 years. Determining the expected life of a brand requires management judgment and is based on an evaluation of a number of factors, including market share, consumer awareness, brand history and future expansion expectations, as well as the macroeconomic environment of the countries in which the brand is sold.
Perpetual brands and goodwill, including the goodwill that is part of our noncontrolled bottling investment balances, are not amortized. Perpetual brands and goodwill are assessed for impairment at least annually. If the carrying amount of a perpetual brand exceeds its fair value, as determined by its discounted cash flows, an impairment loss is recognized in an amount equal to that excess. Goodwill is evaluated using a two-step impairment test at the reporting unit level. A reporting unit can be a division or business within a division. The first step compares the book value of a reporting unit, including goodwill, with its fair value, as determined by its discounted cash flows. If the book value of a reporting unit exceeds its fair value, we complete the second step to determine the amount of goodwill impairment loss that we should record. In the second step, we determine an implied fair value of the reporting unit’s goodwill by allocating the fair value of the reporting unit to all of the assets and liabilities other than goodwill (including any unrecognized intangible assets). The amount of impairment loss is equal to the excess of the book value of the goodwill over the implied fair value of that goodwill.
Amortizable brands are only evaluated for impairment upon a significant change in the operating or macroeconomic environment. If an evaluation of the undiscounted future cash flows indicates impairment, the asset is written down to its estimated fair value, which is based on its discounted future cash flows.
In connection with our acquisitions of PBG and PAS, we reacquired certain franchise rights which provided PBG and PAS with the exclusive and perpetual rights to manufacture and/or distribute beverages for sale in specified territories. In determining the useful life of these reacquired franchise rights, we considered many factors including the existing perpetual bottling arrangements, the indefinite period expected for the reacquired rights to contribute to our future cash flows, as well as the lack of any factors that would limit the useful life of the reacquired rights to us, including legal, regulatory, contractual, competitive, economic or other factors. Therefore, certain reacquired franchise rights, as well as perpetual brands and goodwill, will not be amortized, but instead will be tested for impairment at least annually. Certain reacquired and acquired franchise rights are amortizable over the remaining contractual period of the contract in which the right was granted.
26
On December 7, 2009, we reached an agreement with DPSG to manufacture and distribute Dr Pepper and certain other DPSG products in the territories where they were previously sold by PBG and PAS. Under the terms of the agreement, we made an upfront payment of $900 million to DPSG on February 26, 2010. Based upon the terms of the agreement with DPSG, the amount of the upfront payment has been capitalized and will not be amortized, but instead will be tested for impairment at least annually.
Significant management judgment is necessary to evaluate the impact of operating and macroeconomic changes and to estimate future cash flows. Assumptions used in our impairment evaluations, such as forecasted growth rates and our cost of capital, are based on the best available market information and are consistent with our internal forecasts and operating plans. These assumptions could be adversely impacted by certain of the risks discussed in “Risk Factors” in Item 1A. of our 2010 Form 10-K and “Our Business Risks.”
We did not recognize any impairment charges for perpetual brands or goodwill in the years presented. In addition, as of December 25, 2010, we did not have any reporting units that were at risk of failing the first step of the goodwill impairment test. As of December 25, 2010, we had $26.4 billion of perpetual brands and goodwill, of which approximately 65% related to the goodwill and other nonamortizable intangible assets from the acquisitions of PBG and PAS.
Income Tax Expense and Accruals
Our annual tax rate is based on our income, statutory tax rates and tax planning opportunities available to us in the various jurisdictions in which we operate. Significant judgment is required in determining our annual tax rate and in evaluating our tax positions. We establish reserves when, despite our belief that our tax return positions are fully supportable, we believe that certain positions are subject to challenge and that we may not succeed. We adjust these reserves, as well as the related interest, in light of changing facts and circumstances, such as the progress of a tax audit.
An estimated effective tax rate for a year is applied to our quarterly operating results. In the event there is a significant or unusual item recognized in our quarterly operating results, the tax attributable to that item is separately calculated and recorded at the same time as that item. We consider the tax adjustments from the resolution of prior year tax matters to be among such items.
Tax law requires items to be included in our tax returns at different times than the items are reflected in our financial statements. As a result, our annual tax rate reflected in our financial statements is different than that reported in our tax returns (our cash tax rate). Some of these differences are permanent, such as expenses that are not deductible in our tax return, and some differences reverse over time, such as depreciation expense. These temporary differences create deferred tax assets and liabilities. Deferred tax assets generally represent items that can be used as a tax deduction or credit in our tax returns in future years for which we have already recorded the tax benefit in our income statement. We establish valuation allowances for our deferred tax assets if, based on the available evidence, it is more likely than not that some portion or all of the deferred tax assets will
27
not be realized. Deferred tax liabilities generally represent tax expense recognized in our financial statements for which payment has been deferred, or expense for which we have already taken a deduction in our tax return but have not yet recognized as expense in our financial statements.
In 2010, our annual tax rate was 23.0% compared to 26.0% in 2009, as discussed in “Other Consolidated Results.” The tax rate in 2010 decreased 3.0 percentage points primarily reflecting the impact of our acquisitions of PBG and PAS, which includes the reversal of deferred taxes attributable to our previously held equity interests in PBG and PAS, as well as the favorable resolution of certain tax matters in 2010.
Pension and Retiree Medical Plans
Our pension plans cover full-time employees in the U.S. and certain international employees. Benefits are determined based on either years of service or a combination of years of service and earnings. U.S. and Canada retirees are also eligible for medical and life insurance benefits (retiree medical) if they meet age and service requirements. Generally, our share of retiree medical costs is capped at specified dollar amounts which vary based upon years of service, with retirees contributing the remainder of the cost.
See Note 7 for information about certain changes to our U.S. pension and retiree medical plans and changes in connection with our acquisitions of PBG and PAS.
Our Assumptions
The determination of pension and retiree medical plan obligations and related expenses requires the use of assumptions to estimate the amount of benefits that employees earn while working, as well as the present value of those benefits. Annual pension and retiree medical expense amounts are principally based on four components: (1) the value of benefits earned by employees for working during the year (service cost), (2) increase in the liability due to the passage of time (interest cost), and (3) other gains and losses as discussed below, reduced by (4) the expected return on plan assets for our funded plans.
Significant assumptions used to measure our annual pension and retiree medical expense include:
| | • | | the interest rate used to determine the present value of liabilities (discount rate); |
| | • | | certain employee-related factors, such as turnover, retirement age and mortality; |
| | • | | the expected return on assets in our funded plans; |
| | • | | for pension expense, the rate of salary increases for plans where benefits are based on earnings; and |
| | • | | for retiree medical expense, health care cost trend rates. |
Our assumptions reflect our historical experience and management’s best judgment regarding future expectations. Due to the significant management judgment involved, our assumptions could have a material impact on the measurement of our pension and retiree medical benefit expenses and obligations.
28
At each measurement date, the discount rates are based on interest rates for high-quality, long-term corporate debt securities with maturities comparable to those of our liabilities. Our U.S. discount rate is determined using the Mercer Pension Discount Yield Curve (Mercer Yield Curve). The Mercer Yield Curve uses a portfolio of high-quality bonds rated Aa or higher by Moody’s. The Mercer Yield Curve includes bonds that closely match the timing and amount of our expected benefit payments.
The expected return on pension plan assets is based on our pension plan investment strategy, our expectations for long-term rates of return by asset class, taking into account volatilities and correlation among asset classes and our historical experience. We also review current levels of interest rates and inflation to assess the reasonableness of the long-term rates. We evaluate our expected return assumptions annually to ensure that they are reasonable. Our pension plan investment strategy includes the use of actively managed securities and is reviewed annually based upon plan liabilities, an evaluation of market conditions, tolerance for risk and cash requirements for benefit payments. Our investment objective is to ensure that funds are available to meet the plans’ benefit obligations when they become due. Our overall investment strategy is to prudently invest plan assets in a well-diversified portfolio of equity and high-quality debt securities to achieve our long-term return expectations. Our investment policy also permits the use of derivative instruments which are primarily used to reduce risk. Our expected long-term rate of return on U.S. plan assets is 7.8%. Our target investment allocation is 40% for U.S. equity allocations, 20% for international equity allocations and 40% for fixed income allocations. Actual investment allocations may vary from our target investment allocations due to prevailing market conditions. We regularly review our actual investment allocations and periodically rebalance our investments to our target allocations. To calculate the expected return on pension plan assets, we use a market-related valuation method that recognizes investment gains or losses (the difference between the expected and actual return based on the market-related value of assets) for securities included in our equity allocations over a five-year period. This has the effect of reducing year-to-year volatility. For all other asset categories, the actual fair value is used for the market-related value of assets.
The difference between the actual return on plan assets and the expected return on plan assets is added to, or subtracted from, other gains and losses resulting from actual experience differing from our assumptions and from changes in our assumptions determined at each measurement date. If this net accumulated gain or loss exceeds 10% of the greater of the market-related value of plan assets or plan liabilities, a portion of the net gain or loss is included in expense for the following year based upon the average remaining service period of active plan participants, which is approximately 11 years for pension expense and approximately 8 years for retiree medical expense. The cost or benefit of plan changes that increase or decrease benefits for prior employee service (prior service cost/(credit)) is included in earnings on a straight-line basis over the average remaining service period of active plan participants.
The health care trend rate used to determine our retiree medical plan’s liability and expense is reviewed annually. Our review is based on our claim experience, information
29
provided by our health plans and actuaries, and our knowledge of the health care industry. Our review of the trend rate considers factors such as demographics, plan design, new medical technologies and changes in medical carriers.
Weighted-average assumptions for pension and retiree medical expense are as follows:
| | | | | | | | | | | | |
| | | 2011 | | | 2010 | | | 2009 | |
Pension | | | | | | | | | | | | |
Expense discount rate | | | 5.6 | % | | | 6.0 | % | | | 6.2 | % |
Expected rate of return on plan assets | | | 7.6 | % | | | 7.6 | % | | | 7.6 | % |
Expected rate of salary increases | | | 4.1 | % | | | 4.4 | % | | | 4.4 | % |
Retiree medical | | | | | | | | | | | | |
Expense discount rate | | | 5.2 | % | | | 5.8 | % | | | 6.2 | % |
Expected rate of return on plan assets | | | 7.8 | % | | | | | | | | |
Current health care cost trend rate | | | 7.0 | % | | | 7.5 | % | | | 8.0 | % |
Based on our assumptions, we expect our pension and retiree medical expenses to increase in 2011, as a result of assumption changes, an increase in experience loss amortization, plan changes and normal growth, partially offset by expected asset returns on contributions. The most significant assumption changes result from the use of lower discount rates.
Sensitivity of Assumptions
A decrease in the discount rate or in the expected rate of return assumptions would increase pension expense. The estimated impact of a 25-basis-point decrease in the discount rate on 2011 pension expense is an increase of approximately $55 million. The estimated impact on 2011 pension expense of a 25-basis-point decrease in the expected rate of return is an increase of approximately $28 million.
See Note 7 regarding the sensitivity of our retiree medical cost assumptions.
Funding
We make contributions to pension trusts maintained to provide plan benefits for certain pension plans. These contributions are made in accordance with applicable tax regulations that provide for current tax deductions for our contributions and taxation to the employee only upon receipt of plan benefits. Generally, we do not fund our pension plans when our contributions would not be currently tax deductible. As our retiree medical plans are not subject to regulatory funding requirements, we generally fund these plans on a pay-as-you-go basis, although we periodically review available options to make additional contributions toward these benefits.
30
Our pension contributions for 2010 were $1.5 billion, of which $1.3 billion was discretionary. Our U.S. retiree medical contributions for 2010 were $270 million, of which $170 million was discretionary.
In 2011, we expect to make pension contributions of approximately $160 million, with up to approximately $15 million expected to be discretionary. Our cash payments for retiree medical benefits are estimated to be approximately $145 million in 2011. Our pension and retiree medical contributions are subject to change as a result of many factors, such as changes in interest rates, deviations between actual and expected asset returns and changes in tax or other benefit laws. For estimated future benefit payments, including our pay-as-you-go payments as well as those from trusts, see Note 7.
31
OUR FINANCIAL RESULTS
Items Affecting Comparability
The year-over-year comparisons of our financial results are affected by the following items:
| | | | | | | | | | | | |
| | | 2010 | | | 2009 | | | 2008 | |
Operating profit | | | | | | | | | | | | |
Mark-to-market net impact (gain/(loss)) | | $ | 91 | | | $ | 274 | | | $ | (346 | ) |
Restructuring and impairment charges | | | — | | | $ | (36 | ) | | $ | (543 | ) |
Merger and integration charges | | $ | (769 | ) | | $ | (50 | ) | | | — | |
Inventory fair value adjustments | | $ | (398 | ) | | | — | | | | — | |
Venezuela currency devaluation | | $ | (120 | ) | | | — | | | | — | |
Asset write-off | | $ | (145 | ) | | | — | | | | — | |
Foundation contribution | | $ | (100 | ) | | | — | | | | — | |
Bottling equity income | | | | | | | | | | | | |
PepsiCo share of PBG restructuring and impairment charges | | | — | | | | — | | | $ | (138 | ) |
Gain on previously held equity interests | | $ | 735 | | | | — | | | | — | |
Merger and integration charges | | $ | (9 | ) | | $ | (11 | ) | | | — | |
Interest expense | | | | | | | | | | | | |
Merger and integration charges | | $ | (30 | ) | | | — | | | | — | |
Debt repurchase | | $ | (178 | ) | | | — | | | | — | |
Net income attributable to PepsiCo | | | | | | | | | | | | |
Mark-to-market net impact (gain/(loss)) | | $ | 58 | | | $ | 173 | | | $ | (223 | ) |
Restructuring and impairment charges | | | — | | | $ | (29 | ) | | $ | (408 | ) |
PepsiCo share of PBG restructuring and impairment charges | | | — | | | | — | | | $ | (114 | ) |
Gain on previously held equity interests | | $ | 958 | | | | — | | | | — | |
Merger and integration charges | | $ | (648 | ) | | $ | (44 | ) | | | — | |
Inventory fair value adjustments | | $ | (333 | ) | | | — | | | | — | |
Venezuela currency devaluation | | $ | (120 | ) | | | — | | | | — | |
Asset write-off | | $ | (92 | ) | | | — | | | | — | |
Foundation contribution | | $ | (64 | ) | | | — | | | | — | |
Debt repurchase | | $ | (114 | ) | | | — | | | | — | |
Net income attributable to PepsiCo per common share– diluted | | | | | | | | | | | | |
Mark-to-market net impact (gain/(loss)) | | $ | 0.04 | | | $ | 0.11 | | | $ | (0.14 | ) |
Restructuring and impairment charges | | | — | | | $ | (0.02 | ) | | $ | (0.25 | ) |
PepsiCo share of PBG restructuring and impairment charges | | | — | | | | — | | | $ | (0.07 | ) |
Gain on previously held equity interests | | $ | 0.60 | | | | — | | | | — | |
Merger and integration charges | | $ | (0.40 | ) | | $ | (0.03 | ) | | | — | |
Inventory fair value adjustments | | $ | (0.21 | ) | | | — | | | | — | |
Venezuela currency devaluation | | $ | (0.07 | ) | | | — | | | | — | |
Asset write-off | | $ | (0.06 | ) | | | — | | | | — | |
Foundation contribution | | $ | (0.04 | ) | | | — | | | | — | |
Debt repurchase | | $ | (0.07 | ) | | | — | | | | — | |
32
Mark-to-Market Net Impact
We centrally manage commodity derivatives on behalf of our divisions. These commodity derivatives include energy, fruit, aluminum and other raw materials. Certain of these commodity derivatives do not qualify for hedge accounting treatment and are marked to market with the resulting gains and losses recognized in corporate unallocated expenses. These gains and losses are subsequently reflected in division results when the divisions take delivery of the underlying commodity. Therefore, the divisions realize the economic effects of the derivative without experiencing any resulting mark-to-market volatility, which remains in corporate unallocated expenses.
In 2010, we recognized $91 million ($58 million after-tax or $0.04 per share) of mark-to-market net gains on commodity hedges in corporate unallocated expenses.
In 2009, we recognized $274 million ($173 million after-tax or $0.11 per share) of mark-to-market net gains on commodity hedges in corporate unallocated expenses.
In 2008, we recognized $346 million ($223 million after-tax or $0.14 per share) of mark-to-market net losses on commodity hedges in corporate unallocated expenses.
Restructuring and Impairment Charges
In 2009, we incurred charges of $36 million ($29 million after-tax or $0.02 per share) in conjunction with our Productivity for Growth program that began in 2008. The program includes actions in all divisions of the business, including the closure of six plants that we believe will increase cost competitiveness across the supply chain, upgrade and streamline our product portfolio, and simplify the organization for more effective and timely decision-making. These initiatives were completed in the second quarter of 2009.
In 2008, we incurred charges of $543 million ($408 million after-tax or $0.25 per share) in conjunction with our Productivity for Growth program.
Gain on Previously Held Equity Interests
In 2010, in connection with our acquisitions of PBG and PAS, we recorded a gain on our previously held equity interests of $958 million ($0.60 per share), comprising $735 million which is non-taxable and recorded in bottling equity income and $223 million related to the reversal of deferred tax liabilities associated with these previously held equity interests.
Merger and Integration Charges
In 2010, we incurred merger and integration charges of $799 million related to our acquisitions of PBG and PAS, as well as advisory fees in connection with our acquisition of WBD. $467 million of these charges were recorded in the PAB segment, $111 million recorded in the Europe segment, $191 million recorded in corporate unallocated expenses
33
and $30 million recorded in interest expense. The merger and integration charges related to our acquisitions of PBG and PAS are being incurred to help create a more fully integrated supply chain and go-to-market business model, to improve the effectiveness and efficiency of the distribution of our brands and to enhance our revenue growth. These charges also include closing costs, one-time financing costs and advisory fees related to our acquisitions of PBG and PAS. In addition, we recorded $9 million of merger-related charges, representing our share of the respective merger costs of PBG and PAS, in bottling equity income. In total, the above charges had an after-tax impact of $648 million or $0.40 per share.
In 2009, we incurred $50 million of merger-related charges, as well as an additional $11 million of merger-related charges, representing our share of the respective merger costs of PBG and PAS, recorded in bottling equity income. In total, these charges had an after-tax impact of $44 million or $0.03 per share.
Inventory Fair Value Adjustments
In 2010, we recorded $398 million ($333 million after-tax or $0.21 per share) of incremental costs related to fair value adjustments to the acquired inventory and other related hedging contracts included in PBG’s and PAS’s balance sheets at the acquisition date. Substantially all of these costs were recorded in cost of sales.
Venezuela Currency Devaluation
As of the beginning of our 2010 fiscal year, we recorded a one-time $120 million net charge related to our change to hyperinflationary accounting for our Venezuelan businesses and the related devaluation of the bolivar. $129 million of this net charge was recorded in corporate unallocated expenses, with the balance (income of $9 million) recorded in our PAB segment. In total, this net charge had an after-tax impact of $120 million or $0.07 per share.
Asset Write-Off
In 2010, we recorded a $145 million charge ($92 million after-tax or $0.06 per share) related to a change in scope of one release in our ongoing migration to SAP software. This change was driven, in part, by a review of our North America systems strategy following our acquisitions of PBG and PAS. This change does not impact our overall commitment to continue our implementation of SAP across our global operations over the next few years.
Foundation Contribution
In 2010, we made a $100 million ($64 million after-tax or $0.04 per share) contribution to The PepsiCo Foundation, Inc., in order to fund charitable and social programs over the next several years. This contribution was recorded in corporate unallocated expenses.
34
Debt Repurchase
In 2010, we paid $672 million in a cash tender offer to repurchase $500 million (aggregate principal amount) of our 7.90% senior unsecured notes maturing in 2018. As a result of this debt repurchase, we recorded a $178 million charge to interest expense ($114 million after-tax or $0.07 per share), primarily representing the premium paid in the tender offer.
PepsiCo Share of PBG’s Restructuring and Impairment Charges
In 2008, PBG implemented a restructuring initiative across all of its geographic segments. In addition, PBG recognized an asset impairment charge related to its business in Mexico. Consequently, a non-cash charge of $138 million was included in bottling equity income ($114 million after-tax or $0.07 per share) as part of recording our share of PBG’s financial results.
Non-GAAP Measures
Certain measures contained in this Form 10-K are financial measures that are adjusted for items affecting comparability (see “Items Affecting Comparability” for a detailed list and description of each of these items), as well as, in certain instances, adjusted for foreign currency. These measures are not in accordance with Generally Accepted Accounting Principles (GAAP). Items adjusted for currency assume foreign currency exchange rates used for translation based on the rates in effect for the comparable prior-year period. We believe investors should consider these non-GAAP measures in evaluating our results as they are more indicative of our ongoing performance and with how management evaluates our operational results and trends. These measures are not, and should not be viewed as, a substitute for U.S. GAAP reporting measures. See “Management Operating Cash Flow.”
Results of Operations – Consolidated Review
In the discussions of net revenue and operating profit below,effective net pricing reflects the year-over-year impact of discrete pricing actions, sales incentive activities and mix resulting from selling varying products in different package sizes and in different countries. Additionally,acquisitionsreflect all mergers and acquisitions activity, including the impact of acquisitions, divestitures and changes in ownership or control in consolidated subsidiaries and nonconsolidated equity investees.
Servings
Since our divisions each use different measures of physical unit volume (i.e., kilos, gallons, pounds and case sales), a common servings metric is necessary to reflect our consolidated physical unit volume. Our divisions’ physical volume measures are converted into servings based on U.S. Food and Drug Administration guidelines for single-serving sizes of our products.
35
In 2010, total servings increased 7% compared to 2009, as servings for snacks increased 2% while servings for beverages increased 9%. In 2009, total servings increased slightly compared to 2008, as servings for snacks increased 1% while servings for beverages decreased 1%.
Total Net Revenue and Operating Profit
| | | | | | | | | | | | | | | | | | | | |
| | | | | | | | | | | | Change | |
| | | 2010 | | | 2009 | | | 2008 | | | 2010 | | | 2009 | |
Total net revenue | | $ | 57,838 | | | $ | 43,232 | | | $ | 43,251 | | | | 34 | % | | | — | |
Operating profit | | | | | | | | | | | | | | | | | | | | |
FLNA | | $ | 3,376 | | | $ | 3,105 | | | $ | 2,831 | | | | 9 | % | | | 10 | % |
QFNA | | | 741 | | | | 781 | | | | 710 | | | | (5 | )% | | | 10 | % |
LAF | | | 1,004 | | | | 904 | | | | 897 | | | | 11 | % | | | 1 | % |
PAB | | | 2,776 | | | | 2,172 | | | | 2,026 | | | | 28 | % | | | 7 | % |
Europe | | | 1,054 | | | | 948 | | | | 944 | | | | 11 | % | | | — | |
AMEA | | | 708 | | | | 700 | | | | 558 | | | | 1 | % | | | 25 | % |
Corporate Unallocated | | | | | | | | | | | | | | | | | | | | |
Mark-to-market net (gains/(losses)) | | | 91 | | | | 274 | | | | (346 | ) | | | (67 | )% | | | n/m | |
Merger and integration charges | | | (191 | ) | | | (49 | ) | | | — | | | | 284 | % | | | n/m | |
Restructuring and impairment charges | | | — | | | | — | | | | (10 | ) | | | — | | | | n/m | |
Venezuela currency devaluation | | | (129 | ) | | | — | | | | — | | | | n/m | | | | — | |
Asset write-off | | | (145 | ) | | | — | | | | — | | | | n/m | | | | — | |
Foundation contribution | | | (100 | ) | | | — | | | | — | | | | n/m | | | | — | |
Other | | | (853 | ) | | | (791 | ) | | | (651 | ) | | | 8 | % | | | 21 | % |
| | | | | | | | | | | | | | | | | | | | |
Total operating profit | | $ | 8,332 | | | $ | 8,044 | | | $ | 6,959 | | | | 4 | % | | | 16 | % |
| | | | | | | | | | | | | | | | | | | | |
Total operating profit margin | | | 14.4 | % | | | 18.6 | % | | | 16.1 | % | | | (4.2 | ) | | | 2.5 | |
n/m represents year-over-year changes that are not meaningful.
36
2010
Total operating profit increased 4% and operating margin decreased 4.2 percentage points. Operating profit performance was impacted by items affecting comparability (see “Items Affecting Comparability”) which reduced operating profit by 21 percentage points and contributed 2.9 percentage points to the total operating margin decline. Operating profit performance also reflects the incremental operating results from our acquisitions of PBG and PAS.
2009
Total operating profit increased 16% and operating margin increased 2.5 percentage points. These increases were driven by the net favorable mark-to-market impact of our commodity hedges and lower restructuring and impairment charges related to our Productivity for Growth program, collectively contributing 17 percentage points to operating profit growth, partially offset by 1 percentage point from costs associated with our acquisitions of PBG and PAS. Foreign currency reduced operating profit growth by 6 percentage points, and acquisitions contributed 2 percentage points to the operating profit growth.
Other corporate unallocated expenses increased 21%, primarily reflecting deferred compensation losses, compared to gains in 2008. The deferred compensation losses are offset (as an increase to interest income) by gains on investments used to economically hedge these costs.
37
Other Consolidated Results
| | | | | | | | | | | | | | | | | | | | |
| | | | | | | | | | | | Change | |
| | | 2010 | | | 2009 | | | 2008 | | | 2010 | | | 2009 | |
Bottling equity income | | $ | 735 | | | $ | 365 | | | $ | 374 | | | $ | 370 | | | $ | (9 | ) |
Interest expense, net | | $ | (835 | ) | | $ | (330 | ) | | $ | (288 | ) | | $ | (505 | ) | | $ | (42 | ) |
Annual tax rate | | | 23.0 | % | | | 26.0 | % | | | 26.7 | % | | | | | | | | |
Net income attributable to PepsiCo | | $ | 6,320 | | | $ | 5,946 | | | $ | 5,142 | | | | 6 | % | | | 16 | % |
Net income attributable to PepsiCo per common share – diluted | | $ | 3.91 | | | $ | 3.77 | | | $ | 3.21 | | | | 4 | % | | | 17 | % |
Mark-to-market net (gains)/losses | | | (0.04 | ) | | | (0.11 | ) | | | 0.14 | | | | | | | | | |
Restructuring and impairment charges | | | — | | | | 0.02 | | | | 0.25 | | | | | | | | | |
PepsiCo share of PBG’s restructuring and impairment charges | | | — | | | | — | | | | 0.07 | | | | | | | | | |
Gain on previously held equity interests | | | (0.60 | ) | | | — | | | | — | | | | | | | | | |
Merger and integration charges | | | 0.40 | | | | 0.03 | | | | — | | | | | | | | | |
Inventory fair value adjustments | | | 0.21 | | | | — | | | | — | | | | | | | | | |
Venezuela currency devaluation | | | 0.07 | | | | — | | | | — | | | | | | | | | |
Asset write-off | | | 0.06 | | | | — | | | | — | | | | | | | | | |
Foundation contribution | | | 0.04 | | | | — | | | | — | | | | | | | | | |
Debt repurchase | | | 0.07 | | | | — | | | | — | | | | | | | | | |
| | | | | | | | | | | | | | | | | | | | |
Net income attributable to PepsiCo per common share – diluted, excluding above items* | | $ | 4.13 | ** | | $ | 3.71 | | | $ | 3.68 | ** | | | 12 | % | | | 1 | % |
| | | | | | | | | | | | | | | | | | | | |
Impact of foreign currency translation | | | | | | | | | | | | | | | 1 | | | | 5 | |
| | | | | | | | | | | | | | | | | | | | |
Growth in net income attributable to PepsiCo per common share – diluted, excluding above items, on a constant currency basis* | | | | | | | | | | | | | | | 12 | %** | | | 6 | % |
| | | | | | | | | | | | | | | | | | | | |
| ** | Does not sum due to rounding |
38
As discussed in “Our Customers,” prior to our acquisitions of PBG and PAS on February 26, 2010, we had noncontrolling interests in each of these bottlers and consequently included our share of their net income in bottling equity income. Upon consummation of the acquisitions in the first quarter of 2010, we began to consolidate the results of these bottlers and recorded a $735 million gain in bottling equity income associated with revaluing our previously held equity interests in PBG and PAS to fair value. Our share of the net income of PBV is reflected in bottling equity income.
2010
Bottling equity income increased $370 million, primarily reflecting the gain on our previously held equity interests in connection with our acquisitions of PBG and PAS, partially offset by the consolidation of the related financial results of the acquired bottlers.
Net interest expense increased $505 million, primarily reflecting higher average debt balances, interest expense incurred in connection with our cash tender offer to repurchase debt, and bridge and term financing costs in connection with our acquisitions of PBG and PAS. These increases were partially offset by lower average rates on our debt balances.
The reported tax rate decreased 3.0 percentage points compared to the prior year, primarily reflecting the impact of our acquisitions of PBG and PAS, which includes the reversal of deferred taxes attributable to our previously held equity interests in PBG and PAS, as well as the favorable resolution of certain tax matters in 2010.
Net income attributable to PepsiCo increased 6% and net income attributable to PepsiCo per common share increased 4%. Items affecting comparability (see “Items Affecting Comparability”) decreased net income attributable to PepsiCo and net income attributable to PepsiCo per common share by 8 percentage points.
2009
Bottling equity income decreased $9 million, primarily reflecting pre-tax gains on our sales of PBG and PAS stock in 2008, mostly offset by a 2008 non-cash charge of $138 million related to our share of PBG’s 2008 restructuring and impairment charges.
Net interest expense increased $42 million, primarily reflecting lower average rates on our investment balances and higher average debt balances. This increase was partially offset by gains in the market value of investments used to economically hedge a portion of our deferred compensation costs.
The tax rate decreased 0.7 percentage points compared to 2008, primarily due to the favorable resolution of certain foreign tax matters and lower taxes on foreign results in 2009.
39
Net income attributable to PepsiCo increased 16% and net income attributable to PepsiCo per common share increased 17%. The favorable net mark-to-market impact of our commodity hedges and lower restructuring and impairment charges in 2009 were partially offset by the merger costs related to our acquisitions of PBG and PAS; these items affecting comparability (see “Items Affecting Comparability”) increased net income attributable to PepsiCo by 16 percentage points and net income attributable to PepsiCo per common share by 17 percentage points. Net income attributable to PepsiCo per common share was also favorably impacted by share repurchases in 2008.
Results of Operations – Division Review
The results and discussions below are based on how our Chief Executive Officer monitors the performance of our divisions. See “Items Affecting Comparability” for a discussion of items to consider when evaluating our results and related information regarding non-GAAP measures.
40
| | | | | | | | | | | | | | | | | | | | | | | | | | | | |
| | | FLNA | | | QFNA | | | LAF | | | PAB | | | Europe | | | AMEA | | | Total | |
Net Revenue, 2010 | | $ | 12,573 | | | $ | 2,656 | | | $ | 6,315 | | | $ | 20,401 | | | $ | 9,602 | | | $ | 6,291 | | | $ | 57,838 | |
Net Revenue, 2009 | | $ | 12,421 | | | $ | 2,687 | | | $ | 5,703 | | | $ | 10,116 | | | $ | 7,028 | | | $ | 5,277 | | | $ | 43,232 | |
% Impact of: | | | | | | | | | | | | | | | | | | | | | | | | | | | | |
Volume(a) | | | — | % | | | — | % | | | 3 | % | | | * | | | | * | | | | 12 | % | | | * | |
Effective net pricing(b) | | | — | | | | (2 | ) | | | 6 | | | | * | | | | * | | | | 3 | | | | * | |
Foreign exchange | | | 1 | | | | 1 | | | | 1 | | | | — | | | | (1 | ) | | | 3 | | | | 1 | |
Acquisitions | | | — | | | | — | | | | — | | | | * | | | | * | | | | 1 | | | | * | |
| | | | | | | | | | | | | | | | | | | | | | | | | | | | |
% Change(c) | | | 1 | % | | | (1 | )% | | | 11 | % | | | 102 | % | | | 37 | % | | | 19 | % | | | 34 | % |
| | | | | | | | | | | | | | | | | | | | | | | | | | | | |
| | | | | | | |
| | | FLNA | | | QFNA | | | LAF | | | PAB | | | Europe | | | AMEA | | | Total | |
Net Revenue, 2009 | | $ | 12,421 | | | $ | 2,687 | | | $ | 5,703 | | | $ | 10,116 | | | $ | 7,028 | | | $ | 5,277 | | | $ | 43,232 | |
Net Revenue, 2008 | | $ | 11,698 | | | $ | 2,711 | | | $ | 5,895 | | | $ | 10,937 | | | $ | 7,177 | | | $ | 4,833 | | | $ | 43,251 | |
% Impact of: | | | | | | | | | | | | | | | | | | | | | | | | | | | | |
Volume(a) | | | 1 | % | | | — | % | | | (2 | )% | | | (7 | )% | | | (3 | )% | | | 8 | % | | | (1 | )% |
Effective net pricing(b) | | | 6 | | | | — | | | | 12 | | | | — | | | | 5 | | | | 4 | | | | 5 | |
Foreign exchange | | | (1 | ) | | | (1 | ) | | | (14 | ) | | | (1 | ) | | | (12 | ) | | | (3 | ) | | | (5 | ) |
Acquisitions | | | — | | | | — | | | | — | | | | — | | | | 8 | | | | 1 | | | | 1.5 | |
| | | | | | | | | | | | | | | | | | | | | | | | | | | | |
% Change(c) | | | 6 | % | | | (1 | )% | | | (3 | )% | | | (8 | )% | | | (2 | )% | | | 9 | % | | | — | % |
| | | | | | | | | | | | | | | | | | | | | | | | | | | | |
| (a) | Excludes the impact of acquisitions. In certain instances, volume growth varies from the amounts disclosed in the following divisional discussions due to nonconsolidated joint venture volume, and, for our beverage businesses, temporary timing differences between BCS and CSE. Our net revenue excludes nonconsolidated joint venture volume, and, for our beverage businesses, is based on CSE. |
| (b) | Includes the year-over-year impact of discrete pricing actions, sales incentive activities and mix resulting from selling varying products in different package sizes and in different countries. |
| (c) | Amounts may not sum due to rounding. |
| * | It is impractical to separately determine and quantify the impact of our acquisitions of PBG and PAS from changes in our pre-existing beverage business since we now manage these businesses as an integrated system. |
41
Frito-Lay North America
| | | | | | | | | | | | | | | | | | | | |
| | | | | | | | | | | | % Change | |
| | | 2010 | | | 2009 | | | 2008 | | | 2010 | | | 2009 | |
Net revenue | | $ | 12,573 | | | $ | 12,421 | | | $ | 11,698 | | | | 1 | | | | 6 | |
Impact of foreign currency translation | | | | | | | | | | | | | | | (1 | ) | | | 1 | |
| | | | | | | | | | | | | | | | | | | | |
Net revenue growth, on a constant currency basis* | | | | | | | | | | | | | | | — | | | | 7 | |
| | | | | | | | | | | | | | | | | | | | |
| | | | | |
Operating profit | | $ | 3,376 | | | $ | 3,105 | | | $ | 2,831 | | | | 9 | | | | 10 | |
Restructuring and impairment charges | | | — | | | | 1 | | | | 81 | | | | | | | | | |
| | | | | | | | | | | | | | | | | | | | |
Operating profit excluding above item* | | $ | 3,376 | | | $ | 3,106 | | | $ | 2,912 | | | | 9 | | | | 7 | |
| | | | | | | | | | | | | | | | | | | | |
Impact of foreign currency translation | | | | | | | | | | | | | | | (1 | ) | | | — | |
| | | | | | | | | | | | | | | | | | | | |
Operating profit growth excluding above item, on a constant currency basis* | | | | | | | | | | | | | | | 8 | | | | 7 | |
| | | | | | | | | | | | | | | | | | | | |
2010
Pound volume decreased 1%, primarily due to the overlap of the 2009 “20% More Free” promotion, as well as a double-digit decline in SunChips, partially offset by mid-single-digit growth in trademark Lay’s. Net revenue grew 1%, primarily reflecting mid-single-digit revenue growth in trademark Lay’s, double-digit revenue growth in variety packs and high-single-digit revenue growth in trademark Ruffles. These gains were partially offset by a double-digit revenue decline in SunChips and a mid-single-digit revenue decline in Tostitos. Foreign currency contributed 1 percentage point to the net revenue growth.
Operating profit grew 9%, reflecting lower commodity costs, primarily cooking oil.
2009
Net revenue grew 6% and pound volume increased 1%. The volume growth reflects high-single-digit growth in dips, double-digit growth from our Sabra joint venture, and low-single-digit growth in trademark Lay’s. These volume gains were partially offset by high-single-digit declines in trademark Ruffles. Net revenue growth also benefited from effective net pricing. Foreign currency reduced net revenue growth by almost 1 percentage point.
Operating profit grew 10%, primarily reflecting the net revenue growth, partially offset by higher commodity costs, primarily cooking oil and potatoes. Lower restructuring and impairment charges in 2009 related to our Productivity for Growth program increased operating profit growth by 3 percentage points.
42
Quaker Foods North America
| | | | | | | | | | | | | | | | | | | | |
| | | | | | | | | | | | % Change | |
| | | 2010 | | | 2009 | | | 2008 | | | 2010 | | | 2009 | |
Net revenue | | $ | 2,656 | | | $ | 2,687 | | | $ | 2,711 | | | | (1 | ) | | | (1 | ) |
Impact of foreign currency translation | | | | | | | | | | | | | | | (1 | ) | | | 1 | |
| | | | | | | | | | | | | | | | | | | | |
Net revenue growth, on a constant currency basis* | | | | | | | | | | | | | | | (2 | ) | | | — | |
| | | | | | | | | | | | | | | | | | | | |
| | | | | | | | | | | | | | | | | | | | |
| | | | | |
Operating profit | | $ | 741 | | | $ | 781 | | | $ | 710 | | | | (5 | ) | | | 10 | |
Restructuring and impairment charges | | | — | | | | 2 | | | | 58 | | | | | | | | | |
| | | | | | | | | | | | | | | | | | | | |
Operating profit excluding above item* | | $ | 741 | | | $ | 783 | | | $ | 768 | | | | (5 | ) | | | 2 | |
| | | | | | | | | | | | | | | | | | | | |
Impact of foreign currency translation | | | | | | | | | | | | | | | (1 | ) | | | 1 | |
| | | | | | | | | | | | | | | | | | | | |
Operating profit growth excluding above item, on a constant currency basis* | | | | | | | | | | | | | | | (6 | ) | | | 3 | |
| | | | | | | | | | | | | | | | | | | | |
2010
Net revenue declined 1% and volume was flat. Low-single-digit volume declines in Oatmeal and ready-to-eat cereals were mostly offset by high-single-digit growth in chewy granola bars. Unfavorable mix and net pricing contributed to the net revenue decline. Favorable foreign currency positively contributed 1 percentage point to net revenue performance.
Operating profit declined 5%, primarily reflecting the net revenue performance, as well as insurance settlement recoveries recorded in the prior year related to the Cedar Rapids flood, which negatively impacted operating profit performance by over 2 percentage points.
2009
Net revenue declined 1% and volume was flat. Low-single-digit volume declines in Oatmeal and high-single-digit declines in trademark Roni were offset by high-single-digit growth in ready-to-eat cereals. Favorable net pricing, driven by price increases taken in 2008, was offset by unfavorable mix. Unfavorable foreign currency reduced net revenue growth by 1 percentage point.
Operating profit increased 10%, primarily reflecting the absence of 2008 restructuring and impairment charges related to our Productivity for Growth program, which increased operating profit growth by 8 percentage points. Lower advertising and marketing, and selling and distribution expenses, also contributed to the operating profit growth.
43
Latin America Foods
| | | | | | | | | | | | | | | | | | | | |
| | | | | | | | | | | | % Change | |
| | | 2010 | | | 2009 | | | 2008 | | | 2010 | | | 2009 | |
Net revenue | | $ | 6,315 | | | $ | 5,703 | | | $ | 5,895 | | | | 11 | | | | (3 | ) |
Impact of foreign currency translation | | | | | | | | | | | | | | | (1 | ) | | | 14 | |
| | | | | | | | | | | | | | | | | | | | |
Net revenue growth, on a constant currency basis* | | | | | | | | | | | | | | | 10 | | | | 10 | ** |
| | | | | | | | | | | | | | | | | | | | |
| | | | | | | | | | | | | | | | | | | | |
| | | | | |
Operating profit | | $ | 1,004 | | | $ | 904 | | | $ | 897 | | | | 11 | | | | 1 | |
Restructuring and impairment charges | | | — | | | | 3 | | | | 40 | | | | | | | | | |
| | | | | | | | | | | | | | | | | | | | |
Operating profit excluding above item* | | $ | 1,004 | | | $ | 907 | | | $ | 937 | | | | 11 | | | | (3 | ) |
| | | | | | | | | | | | | | | | | | | | |
Impact of foreign currency translation | | | | | | | | | | | | | | | — | | | | 17 | |
| | | | | | | | | | | | | | | | | | | | |
Operating profit growth excluding above item, on a constant currency basis* | | | | | | | | | | | | | | | 11 | | | | 13 | ** |
| | | | | | | | | | | | | | | | | | | | |
| ** | Does not sum due to rounding |
2010
Volume increased 4%, reflecting mid-single-digit increases at Sabritas in Mexico and Brazil. Additionally, Gamesa in Mexico grew at a low-single-digit rate.
Net revenue increased 11%, primarily reflecting favorable effective net pricing and the volume growth. Net revenue growth reflected 1 percentage point of favorable foreign currency, which was net of a 6-percentage-point unfavorable impact from Venezuela.
Operating profit grew 11%, primarily reflecting the net revenue growth. Unfavorable foreign currency reduced operating profit growth slightly, as an 8-percentage-point unfavorable impact from Venezuela was offset by favorable foreign currency in other markets.
2009
Volume declined 2%, largely reflecting pricing actions to cover commodity inflation. A mid-single-digit decline at Sabritas in Mexico and a low-single-digit decline at Gamesa in Mexico were partially offset by mid-single-digit growth in Brazil.
Net revenue declined 3%, primarily reflecting an unfavorable foreign currency impact of 14 percentage points. Favorable effective net pricing was partially offset by the volume declines.
Operating profit grew 1%, reflecting favorable effective net pricing, partially offset by the higher commodity costs. Unfavorable foreign currency reduced operating profit by 17 percentage points. Operating profit growth benefited from lower restructuring and impairment charges in 2009 related to our Productivity for Growth program.
44
PepsiCo Americas Beverages
| | | | | | | | | | | | | | | | | | | | |
| | | | | | | | | | | | % Change | |
| | | 2010 | | | 2009 | | | 2008 | | | 2010 | | | 2009 | |
Net revenue | | $ | 20,401 | | | $ | 10,116 | | | $ | 10,937 | | | | 102 | | | | (8 | ) |
Impact of foreign currency translation | | | | | | | | | | | | | | | — | | | | 1 | |
| | | | | | | | | | | | | | | | | | | | |
Net revenue growth, on a constant currency basis* | | | | | | | | | | | | | | | 102 | | | | (6 | )** |
| | | | | | | | | | | | | | | | | | | | |
| | | | | | | | | | | | | | | | | | | | |
| | | | | |
Operating profit | | $ | 2,776 | | | $ | 2,172 | | | $ | 2,026 | | | | 28 | | | | 7 | |
Restructuring and impairment charges | | | — | | | | 16 | | | | 289 | | | | | | | | | |
Merger and integration costs | | | 467 | | | | — | | | | — | | | | | | | | | |
Inventory fair value adjustments | | | 358 | | | | — | | | | — | | | | | | | | | |
Venezuela currency devaluation | | | (9 | ) | | | — | | | | — | | | | | | | | | |
| | | | | | | | | | | | | | | | | | | | |
Operating profit excluding above items* | | $ | 3,592 | | | $ | 2,188 | | | $ | 2,315 | | | | 64 | | | | (5.5 | ) |
| | | | | | | | | | | | | | | | | | | | |
Impact of foreign currency translation | | | | | | | | | | | | | | | 4 | | | | 3 | |
| | | | | | | | | | | | | | | | | | | | |
Operating profit growth excluding above items, on a constant currency basis* | | | | | | | | | | | | | | | 68 | | | | (3 | )** |
| | | | | | | | | | | | | | | | | | | | |
| ** | Does not sum due to rounding |
2010
Volume increased 10%, primarily reflecting volume from incremental brands related to our acquisition of PBG’s operations in Mexico, which contributed over 6 percentage points to volume growth, as well as incremental volume related to our DPSG manufacturing and distribution agreement, entered into in connection with our acquisitions of PBG and PAS, which contributed over 5 percentage points to volume growth. North America volumes, excluding the impact of the incremental DPSG volume, declined 1%, driven by a 3% decline in CSD volume, partially offset by a 1% increase in non-carbonated beverage volume. The non-carbonated beverage volume growth primarily reflected a mid-single-digit increase in Gatorade sports drinks and a high-single-digit increase in Lipton ready-to-drink teas, mostly offset by mid-single-digit declines in our base Aquafina water and Tropicana businesses.
Net revenue increased 102%, primarily reflecting the incremental finished goods revenue related to our acquisitions of PBG and PAS.
Reported operating profit increased 28%, primarily reflecting the incremental operating results from our acquisitions of PBG and PAS, partially offset by the items affecting comparability in the above table (see “Items Affecting Comparability”). Excluding the items affecting comparability, operating profit increased 64%. Unfavorable foreign currency reduced operating profit performance by 4 percentage points, driven primarily by a 6-percentage-point unfavorable impact from Venezuela.
45
2009
BCS volume declined 6%, reflecting continued softness in the North America liquid refreshment beverage category.
In North America, non-carbonated beverage volume declined 11%, primarily driven by double-digit declines in Gatorade sports drinks and in our base Aquafina water business. CSD volumes declined 5%.
Net revenue declined 8%, primarily reflecting the volume declines. Unfavorable foreign currency contributed over 1 percentage point to the net revenue decline.
Operating profit increased 7%, primarily reflecting lower restructuring and impairment charges in 2009 related to our Productivity for Growth program. Excluding restructuring and impairment charges, operating profit declined 5.5%, primarily reflecting the net revenue performance. Operating profit was also negatively impacted by unfavorable foreign currency which reduced operating profit growth by almost 3 percentage points.
Europe
| | | | | | | | | | | | | | | | | | | | |
| | | | | | | | | | | | % Change | |
| | | 2010 | | | 2009 | | | 2008 | | | 2010 | | | 2009 | |
Net revenue | | $ | 9,602 | | | $ | 7,028 | | | $ | 7,177 | | | | 37 | | | | (2 | ) |
Impact of foreign currency translation | | | | | | | | | | | | | | | 1 | | | | 12 | |
| | | | | | | | | | | | | | | | | | | | |
Net revenue growth, on a constant currency basis* | | | | | | | | | | | | | | | 38 | | | | 10 | |
| | | | | | | | | | | | | | | | | | | | |
| | | | | | | | | | | | | | | | | | | | |
| | | | | |
Operating profit | | $ | 1,054 | | | $ | 948 | | | $ | 944 | | | | 11 | | | | — | |
Restructuring and impairment charges | | | — | | | | 2 | | | | 50 | | | | | | | | | |
Merger and integration costs | | | 111 | | | | 1 | | | | — | | | | | | | | | |
Inventory fair value adjustments | | | 40 | | | | — | | | | — | | | | | | | | | |
| | | | | | | | | | | | | | | | | | | | |
Operating profit excluding above items* | | $ | 1,205 | | | $ | 951 | | | $ | 994 | | | | 27 | | | | (4 | ) |
| | | | | | | | | | | | | | | | | | | | |
Impact of foreign currency translation | | | | | | | | | | | | | | | 1 | | | | 16 | |
| | | | | | | | | | | | | | | | | | | | |
Operating profit growth excluding above items, on a constant currency basis* | | | | | | | | | | | | | | | 27 | ** | | | 11 | ** |
| | | | | | | | | | | | | | | | | | | | |
| ** | Does not sum due to rounding |
2010
Snacks volume increased 2%, reflecting high-single-digit growth in South Africa and Quaker in the United Kingdom, a double-digit increase in France and mid-single-digit increases in Russia and Turkey. These gains were partially offset by a double-digit decline in Romania and a low-single-digit decline in Spain. Additionally, Walkers in the United Kingdom experienced low-single-digit growth.
46
Beverage volume increased 10%, reflecting double-digit increases in Russia and Turkey, high-single-digit growth in Poland and France and a mid-single-digit increase in the United Kingdom. These gains were partially offset by a double-digit decline in Romania. Additionally, incremental brands related to our acquisitions of PBG and PAS contributed 5 percentage points to the beverage volume growth.
Net revenue grew 37%, primarily reflecting the incremental finished goods revenue related to our acquisitions of PBG and PAS. Unfavorable foreign currency reduced net revenue growth by over 1 percentage point.
Operating profit grew 11%, primarily reflecting incremental operating results from our acquisitions of PBG and PAS. Operating profit growth was also adversely impacted by the items affecting comparability in the above table (see “Items Affecting Comparability”). Excluding these items, operating profit increased 27%. Unfavorable foreign currency reduced operating profit growth by 1 percentage point.
2009
Snacks volume declined 1%, reflecting continued macroeconomic challenges and planned weight outs in response to higher input costs. High-single-digit declines in Spain and Turkey and a double-digit decline in Poland were partially offset by low-single-digit growth in Russia and South Africa. Additionally, Walkers in the United Kingdom declined at a low-single-digit rate. Our acquisition in the fourth quarter of 2008 of a snacks company in Serbia positively contributed 2 percentage points to the volume performance.
Beverage volume grew 3.5%, primarily reflecting our acquisition of Lebedyansky in Russia in the fourth quarter of 2008 which contributed 8 percentage points to volume growth. A high-single-digit increase in Germany and mid-single-digit increases in the United Kingdom and Poland were more than offset by double-digit declines in Russia and the Ukraine.
Net revenue declined 2%, primarily reflecting adverse foreign currency which contributed 12 percentage points to the decline, partially offset by acquisitions which positively contributed 8 percentage points to the net revenue performance. Favorable effective net pricing positively contributed to the net revenue performance.
Operating profit increased slightly, primarily reflecting the favorable effective net pricing and lower restructuring and impairment costs in 2009 related to our Productivity for Growth program. Acquisitions positively contributed 5 percentage points to the operating profit growth and adverse foreign currency reduced operating profit growth by 16 percentage points.
47
Asia, Middle East & Africa
| | | | | | | | | | | | | | | | | | | | |
| | | | | | | | | | | | % Change | |
| | | 2010 | | | 2009 | | | 2008 | | | 2010 | | | 2009 | |
Net revenue | | $ | 6,291 | | | $ | 5,277 | | | $ | 4,833 | | | | 19 | | | | 9 | |
Impact of foreign currency translation | | | | | | | | | | | | | | | (3 | ) | | | 3 | |
| | | | | | | | | | | | | | | | | | | | |
Net revenue growth, on a constant currency basis* | | | | | | | | | | | | | | | 16 | | | | 13 | ** |
| | | | | | | | | | | | | | | | | | | | |
| | | | | | | | | | | | | | | | | | | | |
| | | | | |
Operating profit | | $ | 708 | | | $ | 700 | | | $ | 558 | | | | 1 | | | | 25 | |
Restructuring and impairment charges | | | — | | | | 12 | | | | 15 | | | | | | | | | |
| | | | | | | | | | | | | | | | | | | | |
Operating profit excluding above items* | | $ | 708 | | | $ | 712 | | | $ | 573 | | | | (1 | ) | | | 24 | |
| | | | | | | | | | | | | | | | | | | | |
Impact of foreign currency translation | | | | | | | | | | | | | | | (3 | ) | | | 3 | |
| | | | | | | | | | | | | | | | | | | | |
Operating profit growth excluding above items, on a constant currency basis* | | | | | | | | | | | | | | | (4 | ) | | | 27 | |
| | | | | | | | | | | | | | | | | | | | |
| ** | Does not sum due to rounding |
2010
Snacks volume grew 16%, reflecting broad-based increases driven by double-digit growth in India, the Middle East and China, partially offset by a low-single-digit decline in Australia. Acquisitions contributed nearly 3 percentage points to the snacks volume growth.
Beverage volume grew 7%, driven by double-digit growth in India and China, partially offset by a low-single-digit decline in the Middle East. Acquisitions had a nominal impact on the beverage volume growth rate.
Net revenue grew 19%, reflecting the volume growth and favorable effective net pricing. Foreign currency contributed 3 percentage points to the net revenue growth. The net impact of acquisitions and divestitures contributed 1 percentage point to the net revenue growth.
Operating profit grew 1%, driven primarily by the net revenue growth, partially offset by higher commodity costs and increased investments in strategic markets. The net impact of acquisitions and divestitures reduced operating profit growth by 10 percentage points, primarily as a result of a one-time gain in the prior year associated with the contribution of our snacks business in Japan to form a joint venture with Calbee Foods Company (Calbee). Favorable foreign currency contributed over 3 percentage points to the operating profit growth and the absence of restructuring and impairment charges in the current year contributed 2 percentage points.
48
2009
Snacks volume grew 10%, reflecting broad-based increases driven by double-digit growth in India and the Middle East, partially offset by a low-single-digit decline in China. Additionally, Australia grew volume slightly. The net impact of acquisitions and divestitures contributed 2 percentage points to the snacks volume growth.
Beverage volume grew 8%, reflecting broad-based increases driven by double-digit growth in India and high-single-digit growth in Pakistan. Additionally, the Middle East grew at a mid-single-digit rate and China grew at a low-single-digit rate. Acquisitions had a nominal impact on the beverage volume growth rate.
Net revenue grew 9%, reflecting volume growth and favorable effective net pricing. Foreign currency reduced net revenue growth by over 3 percentage points. The net impact of acquisitions and divestitures contributed 1 percentage point to the net revenue growth.
Operating profit grew 25%, driven primarily by the net revenue growth. The net impact of acquisitions and divestitures contributed 11 percentage points to the operating profit growth and included a one-time gain associated with the contribution of our snacks business in Japan to form a joint venture with Calbee. Foreign currency reduced operating profit growth by 3 percentage points.
Our Liquidity and Capital Resources
We believe that our cash generating capability and financial condition, together with our revolving credit facilities and other available methods of debt financing (including long-term debt financing which, depending upon market conditions, we may use to replace a portion of our commercial paper borrowings), will be adequate to meet our operating, investing and financing needs. However, there can be no assurance that volatility in the global capital and credit markets will not impair our ability to access these markets on terms commercially acceptable to us or at all. See Note 9 for a description of our credit facilities. See “Unfavorable economic conditions in the countries in which we operate may have an adverse impact on our business results or financial condition.” in “Risk Factors” in Item 1A. of our 2010 Form 10-K.
In addition, currency restrictions enacted by the government in Venezuela have impacted our ability to pay dividends outside of the country from our snack and beverage operations in Venezuela. As of December 25, 2010, our operations in Venezuela comprised 4% of our cash and cash equivalents balance.
Furthermore, our cash provided from operating activities is somewhat impacted by seasonality. Working capital needs are impacted by weekly sales, which are generally highest in the third quarter due to seasonal and holiday-related sales patterns, and generally lowest in the first quarter. On a continuing basis, we consider various transactions to increase shareholder value and enhance our business results, including acquisitions, divestitures, joint ventures and share repurchases. These transactions may result in future cash proceeds or payments.
49
Operating Activities
During 2010, net cash provided by operating activities was $8.4 billion, compared to net cash provided of $6.8 billion in the prior year. The increase over the prior year primarily reflects the incremental operating results from our acquisitions of PBG and PAS, as well as favorable working capital comparisons to the prior year. Also see “Management Operating Cash Flow” below for certain other items impacting net cash provided by operating activities.
In 2009, our operations provided $6.8 billion of cash, compared to $7.0 billion in 2008, reflecting a $1.0 billion ($0.6 billion after-tax) discretionary pension contribution to our U.S. pension plans, $196 million of restructuring payments related to our Productivity for Growth program and $49 million of merger cost payments related to our acquisitions of PBG and PAS. Operating cash flow also reflected net favorable working capital comparisons to 2008.
Investing Activities
During 2010, net cash used for investing activities was $7.7 billion, primarily reflecting $3.2 billion for net capital spending, $2.8 billion of net cash paid in connection with our acquisitions of PBG and PAS, and $0.9 billion of cash paid in connection with our manufacturing and distribution agreement with DPSG. We also paid $0.5 billion to acquire WBD American Depositary Shares in the open market.
In 2009, net cash used for investing activities was $2.4 billion, primarily reflecting $2.1 billion for capital spending and $0.5 billion for acquisitions.
Subsequent to year-end 2010, we paid $0.2 billion to acquire WBD American Depositary Shares in the open market. We also spent approximately $3.8 billion to acquire approximately 66% of WBD’s outstanding ordinary shares, increasing our total ownership of WBD to approximately 77%. In addition to these transactions, we expect to incur an additional $1.4 billion of investing cash outflows in connection with our intended purchase of the remaining outstanding WBD shares, funded primarily through existing international cash. See “Acquisition of Wimm-Bill-Dann Foods OJSC” in Item 1. and Note 15.
We anticipate net capital spending in 2011 of about $3.7 billion, which includes about $150 million of capital spending related to the integration of PBG and PAS, as well as capital spending related to our acquisition of WBD.
Financing Activities
During 2010, net cash provided by financing activities was $1.4 billion, primarily reflecting proceeds from issuances of long-term debt of $6.5 billion, mostly in connection with our acquisitions of PBG and PAS, and net proceeds from short-term borrowings of $2.5 billion. These increases were largely offset by the return of operating cash flow to our shareholders through share repurchases and dividend payments of $8.0 billion.
In 2009, net cash used for financing activities was $2.5 billion, primarily reflecting the return of operating cash flow to our shareholders through dividend payments of $2.7 billion. Net proceeds from issuances of long-term debt of $0.8 billion and stock option proceeds of $0.4 billion were mostly offset by net repayments of short-term borrowings of $1.0 billion.
50
We annually review our capital structure with our Board, including our dividend policy and share repurchase activity. In the first quarter of 2010, our Board of Directors approved a 7% dividend increase from $1.80 to $1.92 per share and authorized the repurchase of up to $15.0 billion of PepsiCo common stock through June 30, 2013. This authorization was in addition to our $8.0 billion repurchase program authorized by our Board of Directors, publicly announced on May 2, 2007 and which expired on June 30, 2010. We anticipate share repurchases of approximately $2.5 billion in 2011.
Management Operating Cash Flow
We focus on management operating cash flow as a key element in achieving maximum shareholder value, and it is the primary measure we use to monitor cash flow performance. However, it is not a measure provided by accounting principles generally accepted in the U.S. Therefore, this measure is not, and should not be viewed as, a substitute for U.S. GAAP cash flow measures. Since net capital spending is essential to our product innovation initiatives and maintaining our operational capabilities, we believe that it is a recurring and necessary use of cash. As such, we believe investors should also consider net capital spending when evaluating our cash from operating activities. Additionally, we consider certain items (included in the table below), in evaluating management operating cash flow. We believe investors should consider these items in evaluating our management operating cash flow results.
The table below reconciles net cash provided by operating activities, as reflected in our cash flow statement, to our management operating cash flow excluding the impact of the items below.
| | | | | | | | | | | | |
| | | 2010 | | | 2009 | | | 2008 | |
Net cash provided by operating activities | | $ | 8,448 | | | $ | 6,796 | | | $ | 6,999 | |
Capital spending | | | (3,253 | ) | | | (2,128 | ) | | | (2,446 | ) |
Sales of property, plant and equipment | | | 81 | | | | 58 | | | | 98 | |
| | | | | | | | | | | | |
Management operating cash flow | | | 5,276 | | | | 4,726 | | | | 4,651 | |
Discretionary pension and retiree medical contributions (after-tax) | | | 983 | | | | 640 | | | | — | |
Payments related to 2009 restructuring charges (after-tax) | | | 20 | | | | 168 | | | | 180 | |
Merger and integration payments (after-tax) | | | 299 | | | | 49 | | | | — | |
Foundation contribution (after-tax) | | | 64 | | | | — | | | | — | |
Debt repurchase (after-tax) | | | 112 | | | | — | | | | — | |
Capital investments related to the PBG/PAS integration | | | 138 | | | | — | | | | — | |
| | | | | | | | | | | | |
Management operating cash flow excluding above items | | $ | 6,892 | | | $ | 5,583 | | | $ | 4,831 | |
| | | | | | | | | | | | |
In 2010, management operating cash flow was used primarily to repurchase shares and pay dividends. In 2009, management operating cash flow was used primarily to pay dividends. In 2008, management operating cash flow was used primarily to repurchase shares and pay dividends. We expect to continue to return management operating cash flow to our shareholders through dividends and share repurchases while maintaining short-term credit ratings that ensure appropriate financial flexibility and ready access to global and capital credit markets at favorable interest rates. However, see “Risk Factors” in Item 1A. of our 2010 Form 10-K and “Our Business Risks” for certain factors that may impact our operating cash flows.
51
Credit Ratings
Our objective is to maintain credit ratings that provide us with ready access to global capital and credit markets at favorable interest rates. On February 24, 2010, Moody’s Investors Service (Moody’s) lowered the corporate credit rating of PepsiCo and its supported subsidiaries and the rating of PepsiCo’s senior unsecured long-term debt to Aa3 from Aa2. Moody’s rating for PepsiCo’s short-term indebtedness was confirmed at Prime-1 and the outlook is stable. On March 17, 2010, Standard & Poor’s Ratings Services (S&P) lowered PepsiCo’s corporate credit rating to A from A+ and lowered the rating of PepsiCo’s senior unsecured long-term debt to A- from A+. S&P’s rating for PepsiCo’s short-term indebtedness was confirmed at A-1 and the outlook is stable. Any downgrade of our credit ratings by either Moody’s or S&P, including any downgrade to below investment grade, could increase our future borrowing costs or impair our ability to access capital markets on terms commercially acceptable to us or at all. See “Our Business Risks” and Note 9.
Credit Facilities and Long-Term Contractual Commitments
See Note 9 for a description of our credit facilities and long-term contractual commitments.
Off-Balance-Sheet Arrangements
It is not our business practice to enter into off-balance-sheet arrangements, other than in the normal course of business. Additionally, we do not enter into off-balance-sheet transactions specifically structured to provide income or tax benefits or to avoid recognizing or disclosing assets or liabilities. See Note 9 for a description of our off-balance-sheet arrangements.
52
Consolidated Statement of Income
PepsiCo, Inc. and Subsidiaries
Fiscal years ended December 25, 2010, December 26, 2009 and December 27, 2008
(in millions except per share amounts)
| | | | | | | | | | | | |
| | | 2010 | | | 2009 | | | 2008 | |
Net Revenue | | $ | 57,838 | | | $ | 43,232 | | | $ | 43,251 | |
Cost of sales | | | 26,575 | | | | 20,099 | | | | 20,351 | |
Selling, general and administrative expenses | | | 22,814 | | | | 15,026 | | | | 15,877 | |
Amortization of intangible assets | | | 117 | | | | 63 | | | | 64 | |
| | | | | | | | | | | | |
Operating Profit | | | 8,332 | | | | 8,044 | | | | 6,959 | |
Bottling equity income | | | 735 | | | | 365 | | | | 374 | |
Interest expense | | | (903 | ) | | | (397 | ) | | | (329 | ) |
Interest income | | | 68 | | | | 67 | | | | 41 | |
| | | | | | | | | | | | |
Income before income taxes | | | 8,232 | | | | 8,079 | | | | 7,045 | |
Provision for income taxes | | | 1,894 | | | | 2,100 | | | | 1,879 | |
| | | | | | | | | | | | |
Net income | | | 6,338 | | | | 5,979 | | | | 5,166 | |
Less: Net income attributable to noncontrolling interests | | | 18 | | | | 33 | | | | 24 | |
| | | | | | | | | | | | |
Net Income Attributable to PepsiCo | | $ | 6,320 | | | $ | 5,946 | | | $ | 5,142 | |
| | | | | | | | | | | | |
Net Income Attributable to PepsiCo per Common Share | | | | | | | | | | | | |
Basic | | $ | 3.97 | | | $ | 3.81 | | | $ | 3.26 | |
Diluted | | $ | 3.91 | | | $ | 3.77 | | | $ | 3.21 | |
Cash dividends declared per common share | | $ | 1.89 | | | $ | 1.775 | | | $ | 1.65 | |
See accompanying notes to consolidated financial statements.
53
Consolidated Statement of Cash Flows
PepsiCo, Inc. and Subsidiaries
Fiscal years ended December 25, 2010, December 26, 2009 and December 27, 2008
(in millions)
| | | | | | | | | | | | |
| | | 2010 | | | 2009 | | | 2008 | |
Operating Activities | | | | | | | | | | | | |
Net income | | $ | 6,338 | | | $ | 5,979 | | | $ | 5,166 | |
Depreciation and amortization | | | 2,327 | | | | 1,635 | | | | 1,543 | |
Stock-based compensation expense | | | 299 | | | | 227 | | | | 238 | |
Restructuring and impairment charges | | | — | | | | 36 | | | | 543 | |
Cash payments for restructuring charges | | | (31 | ) | | | (196 | ) | | | (180 | ) |
Merger and integration costs | | | 808 | | | | 50 | | | | — | |
Cash payments for merger and integration costs | | | (385 | ) | | | (49 | ) | | | — | |
Gain on previously held equity interests in PBG and PAS | | | (958 | ) | | | — | | | | — | |
Asset write-off | | | 145 | | | | — | | | | — | |
Non-cash foreign exchange loss related to Venezuela devaluation | | | 120 | | | | — | | | | — | |
Excess tax benefits from share-based payment arrangements | | | (107 | ) | | | (42 | ) | | | (107 | ) |
Pension and retiree medical plan contributions | | | (1,734 | ) | | | (1,299 | ) | | | (219 | ) |
Pension and retiree medical plan expenses | | | 453 | | | | 423 | | | | 459 | |
Bottling equity income, net of dividends | | | 42 | | | | (235 | ) | | | (202 | ) |
Deferred income taxes and other tax charges and credits | | | 500 | | | | 284 | | | | 573 | |
Change in accounts and notes receivable | | | (268 | ) | | | 188 | | | | (549 | ) |
Change in inventories | | | 276 | | | | 17 | | | | (345 | ) |
Change in prepaid expenses and other current assets | | | 144 | | | | (127 | ) | | | (68 | ) |
Change in accounts payable and other current liabilities | | | 488 | | | | (133 | ) | | | 718 | |
Change in income taxes payable | | | 123 | | | | 319 | | | | (180 | ) |
Other, net | | | (132 | ) | | | (281 | ) | | | (391 | ) |
| | | | | | | | | | | | |
Net Cash Provided by Operating Activities | | | 8,448 | | | | 6,796 | | | | 6,999 | |
| | | | | | | | | | | | |
Investing Activities | | | | | | | | | | | | |
Capital spending | | | (3,253 | ) | | | (2,128 | ) | | | (2,446 | ) |
Sales of property, plant and equipment | | | 81 | | | | 58 | | | | 98 | |
Acquisitions of PBG and PAS, net of cash and cash equivalents acquired | | | (2,833 | ) | | | — | | | | — | |
Acquisition of manufacturing and distribution rights from DPSG | | | (900 | ) | | | — | | | | — | |
Investment in WBD | | | (463 | ) | | | — | | | | — | |
Other acquisitions and investments in noncontrolled affiliates | | | (83 | ) | | | (500 | ) | | | (1,925 | ) |
Divestitures | | | 12 | | | | 99 | | | | 6 | |
Cash restricted for pending acquisitions | | | — | | | | 15 | | | | (40 | ) |
Cash proceeds from sale of PBG and PAS stock | | | — | | | | — | | | | 358 | |
Short-term investments, by original maturity | | | | | | | | | | | | |
More than three months – purchases | | | (12 | ) | | | (29 | ) | | | (156 | ) |
More than three months – maturities | | | 29 | | | | 71 | | | | 62 | |
Three months or less, net | | | (229 | ) | | | 13 | | | | 1,376 | |
Other investing, net | | | (17 | ) | | | — | | | | — | |
| | | | | | | | | | | | |
Net Cash Used for Investing Activities | | | (7,668 | ) | | | (2,401 | ) | | | (2,667 | ) |
| | | | | | | | | | | | |
(Continued on following page)
54
Consolidated Statement of Cash Flows (continued)
PepsiCo, Inc. and Subsidiaries
Fiscal years ended December 25, 2010, December 26, 2009 and December 27, 2008
(in millions)
| | | | | | | | | | | | |
| | | 2010 | | | 2009 | | | 2008 | |
Financing Activities | | | | | | | | | | | | |
Proceeds from issuances of long-term debt | | $ | 6,451 | | | $ | 1,057 | | | $ | 3,719 | |
Payments of long-term debt | | | (59 | ) | | | (226 | ) | | | (649 | ) |
Debt repurchase | | | (500 | ) | | | — | | | | — | |
Short-term borrowings, by original maturity | | | | | | | | | | | | |
More than three months – proceeds | | | 227 | | | | 26 | | | | 89 | |
More than three months – payments | | | (96 | ) | | | (81 | ) | | | (269 | ) |
Three months or less, net | | | 2,351 | | | | (963 | ) | | | 625 | |
Cash dividends paid | | | (2,978 | ) | | | (2,732 | ) | | | (2,541 | ) |
Share repurchases – common | | | (4,978 | ) | | | — | | | | (4,720 | ) |
Share repurchases – preferred | | | (5 | ) | | | (7 | ) | | | (6 | ) |
Proceeds from exercises of stock options | | | 1,038 | | | | 413 | | | | 620 | |
Excess tax benefits from share-based payment arrangements | | | 107 | | | | 42 | | | | 107 | |
Acquisition of noncontrolling interest in Lebedyansky from PBG | | | (159 | ) | | | — | | | | — | |
Other financing | | | (13 | ) | | | (26 | ) | | | — | |
| | | | | | | | | | | | |
Net Cash Provided by/(Used for) Financing Activities | | | 1,386 | | | | (2,497 | ) | | | (3,025 | ) |
| | | | | | | | | | | | |
Effect of exchange rate changes on cash and cash equivalents | | | (166 | ) | | | (19 | ) | | | (153 | ) |
| | | | | | | | | | | | |
Net Increase in Cash and Cash Equivalents | | | 2,000 | | | | 1,879 | | | | 1,154 | |
Cash and Cash Equivalents, Beginning of Year | | | 3,943 | | | | 2,064 | | | | 910 | |
| | | | | | | | | | | | |
Cash and Cash Equivalents, End of Year | | $ | 5,943 | | | $ | 3,943 | | | $ | 2,064 | |
| | | | | | | | | | | | |
Non-cash activity: | | | | | | | | | | | | |
Issuance of common stock and equity awards in connection with our acquisitions of PBG and PAS, as reflected in investing and financing activities | | $ | 4,451 | | | | — | | | | — | |
| | | | | | | | | | | | |
See accompanying notes to consolidated financial statements.
55
Consolidated Balance Sheet
PepsiCo, Inc. and Subsidiaries
December 25, 2010 and December 26, 2009
(in millions except per share amounts)
| | | | | | | | |
| | | 2010 | | | 2009 | |
ASSETS | | | | | | | | |
Current Assets | | | | | | | | |
Cash and cash equivalents | | $ | 5,943 | | | $ | 3,943 | |
Short-term investments | | | 426 | | | | 192 | |
Accounts and notes receivable, net | | | 6,323 | | | | 4,624 | |
Inventories | | | 3,372 | | | | 2,618 | |
Prepaid expenses and other current assets | | | 1,505 | | | | 1,194 | |
| | | | | | | | |
Total Current Assets | | | 17,569 | | | | 12,571 | |
Property, Plant and Equipment, net | | | 19,058 | | | | 12,671 | |
Amortizable Intangible Assets, net | | | 2,025 | | | | 841 | |
Goodwill | | | 14,661 | | | | 6,534 | |
Other nonamortizable intangible assets | | | 11,783 | | | | 1,782 | |
| | | | | | | | |
Nonamortizable Intangible Assets | | | 26,444 | | | | 8,316 | |
Investments in Noncontrolled Affiliates | | | 1,368 | | | | 4,484 | |
Other Assets | | | 1,689 | | | | 965 | |
| | | | | | | | |
Total Assets | | $ | 68,153 | | | $ | 39,848 | |
| | | | | | | | |
LIABILITIES AND EQUITY | | | | | | | | |
Current Liabilities | | | | | | | | |
Short-term obligations | | $ | 4,898 | | | $ | 464 | |
Accounts payable and other current liabilities | | | 10,923 | | | | 8,127 | |
Income taxes payable | | | 71 | | | | 165 | |
| | | | | | | | |
Total Current Liabilities | | | 15,892 | | | | 8,756 | |
Long-Term Debt Obligations | | | 19,999 | | | | 7,400 | |
Other Liabilities | | | 6,729 | | | | 5,591 | |
Deferred Income Taxes | | | 4,057 | | | | 659 | |
| | | | | | | | |
Total Liabilities | | | 46,677 | | | | 22,406 | |
Commitments and Contingencies | | | | | | | | |
Preferred Stock, no par value | | | 41 | | | | 41 | |
Repurchased Preferred Stock | | | (150 | ) | | | (145 | ) |
PepsiCo Common Shareholders’ Equity | | | | | | | | |
Common stock, par value 12/3¢ per share (authorized 3,600 shares, issued 1,865 and 1,782 shares, respectively) | | | 31 | | | | 30 | |
Capital in excess of par value | | | 4,527 | | | | 250 | |
Retained earnings | | | 37,090 | | | | 33,805 | |
Accumulated other comprehensive loss | | | (3,630 | ) | | | (3,794 | ) |
Repurchased common stock, at cost (284 and 217 shares, respectively) | | | (16,745 | ) | | | (13,383 | ) |
| | | | | | | | |
Total PepsiCo Common Shareholders’ Equity | | | 21,273 | | | | 16,908 | |
Noncontrolling interests | | | 312 | | | | 638 | |
| | | | | | | | |
Total Equity | | | 21,476 | | | | 17,442 | |
| | | | | | | | |
Total Liabilities and Equity | | $ | 68,153 | | | $ | 39,848 | |
| | | | | | | | |
See accompanying notes to consolidated financial statements.
56
Consolidated Statement of Equity
PepsiCo, Inc. and Subsidiaries
Fiscal years ended December 25, 2010, December 26, 2009 and December 27, 2008
(in millions)
| | | | | | | | | | | | | | | | | | | | | | | | |
| | | 2010 | | | 2009 | | | 2008 | |
| | | Shares | | | Amount | | | Shares | | | Amount | | | Shares | | | Amount | |
Preferred Stock | | | 0.8 | | | $ | 41 | | | | 0.8 | | | $ | 41 | | | | 0.8 | | | $ | 41 | |
| | | | | | | | | | | | | | | | | | | | | | | | |
Repurchased Preferred Stock | | | | | | | | | | | | | | | | | | | | | | | | |
Balance, beginning of year | | | (0.6 | ) | | | (145 | ) | | | (0.5 | ) | | | (138 | ) | | | (0.5 | ) | | | (132 | ) |
Redemptions | | | (— | ) | | | (5 | ) | | | (0.1 | ) | | | (7 | ) | | | (— | ) | | | (6 | ) |
| | | | | | | | | | | | | | | | | | | | | | | | |
Balance, end of year | | | (0.6 | ) | | | (150 | ) | | | (0.6 | ) | | | (145 | ) | | | (0.5 | ) | | | (138 | ) |
| | | | | | | | | | | | | | | | | | | | | | | | |
Common Stock | | | | | | | | | | | | | | | | | | | | | | | | |
Balance, beginning of year | | | 1,782 | | | | 30 | | | | 1,782 | | | | 30 | | | | 1,782 | | | | 30 | |
Shares issued in connection with our acquisitions of PBG and PAS | | | 83 | | | | 1 | | | | — | | | | — | | | | — | | | | — | |
| | | | | | | | | | | | | | | | | | | | | | | | |
Balance, end of year | | | 1,865 | | | | 31 | | | | 1,782 | | | | 30 | | | | 1,782 | | | | 30 | |
| | | | | | | | | | | | | | | | | | | | | | | | |
Capital in Excess of Par Value | | | | | | | | | | | | | | | | | | | | | | | | |
Balance, beginning of year | | | | | | | 250 | | | | | | | | 351 | | | | | | | | 450 | |
Stock-based compensation expense | | | | | | | 299 | | | | | | | | 227 | | | | | | | | 238 | |
Stock option exercises/RSUs converted(a) | | | | | | | (500 | ) | | | | | | | (292 | ) | | | | | | | (280 | ) |
Withholding tax on RSUs converted | | | | | | | (68 | ) | | | | | | | (36 | ) | | | | | | | (57 | ) |
Equity issued in connection with our acquisitions of PBG and PAS | | | | | | | 4,451 | | | | | | | | — | | | | | | | | — | |
Other | | | | | | | 95 | | | | | | | | — | | | | | | | | — | |
| | | | | | | | | | | | | | | | | | | | | | | | |
Balance, end of year | | | | | | | 4,527 | | | | | | | | 250 | | | | | | | | 351 | |
| | | | | | | | | | | | | | | | | | | | | | | | |
Retained Earnings | | | | | | | | | | | | | | | | | | | | | | | | |
Balance, beginning of year | | | | | | | 33,805 | | | | | | | | 30,638 | | | | | | | | 28,184 | |
Measurement date change | | | | | | | — | | | | | | | | — | | | | | | | | (89 | ) |
| | | | | | | | | | | | | | | | | | | | | | | | |
Adjusted balance, beginning of year | | | | | | | 33,805 | | | | | | | | 30,638 | | | | | | | | 28,095 | |
Net income attributable to PepsiCo | | | | | | | 6,320 | | | | | | | | 5,946 | | | | | | | | 5,142 | |
Cash dividends declared – common | | | | | | | (3,028 | ) | | | | | | | (2,768 | ) | | | | | | | (2,589 | ) |
Cash dividends declared – preferred | | | | | | | (1 | ) | | | | | | | (2 | ) | | | | | | | (2 | ) |
Cash dividends declared – RSUs | | | | | | | (12 | ) | | | | | | | (9 | ) | | | | | | | (8 | ) |
Other | | | | | | | 6 | | | | | | | | — | | | | | | | | — | |
| | | | | | | | | | | | | | | | | | | | | | | | |
Balance, end of year | | | | | | | 37,090 | | | | | | | | 33,805 | | | | | | | | 30,638 | |
| | | | | | | | | | | | | | | | | | | | | | | | |
Accumulated Other Comprehensive Loss | | | | | | | | | | | | | | | | | | | | | | | | |
Balance, beginning of year | | | | | | | (3,794 | ) | | | | | | | (4,694 | ) | | | | | | | (952 | ) |
Measurement date change | | | | | | | — | | | | | | | | — | | | | | | | | 51 | |
| | | | | | | | | | | | | | | | | | | | | | | | |
Adjusted balance, beginning of year | | | | | | | (3,794 | ) | | | | | | | (4,694 | ) | | | | | | | (901 | ) |
Currency translation adjustment | | | | | | | 312 | | | | | | | | 800 | | | | | | | | (2,484 | ) |
Cash flow hedges, net of tax: | | | | | | | | | | | | | | | | | | | | | | | | |
Net derivative (losses)/gains | | | | | | | (111 | ) | | | | | | | (55 | ) | | | | | | | 16 | |
Reclassification of net losses to net income | | | | | | | 53 | | | | | | | | 28 | | | | | | | | 5 | |
Pension and retiree medical, net of tax: | | | | | | | | | | | | | | | | | | | | | | | | |
Net pension and retiree medical (losses)/gains | | | | | | | (280 | ) | | | | | | | 21 | | | | | | | | (1,376 | ) |
Reclassification of net losses to net income | | | | | | | 166 | | | | | | | | 86 | | | | | | | | 73 | |
Unrealized gains/(losses) on securities, net of tax | | | | | | | 23 | | | | | | | | 20 | | | | | | | | (21 | ) |
Other | | | | | | | 1 | | | | | | | | — | | | | | | | | (6 | ) |
| | | | | | | | | | | | | | | | | | | | | | | | |
Balance, end of year | | | | | | | (3,630 | ) | | | | | | | (3,794 | ) | | | | | | | (4,694 | ) |
| | | | | | | | | | | | | | | | | | | | | | | | |
Repurchased Common Stock | | | | | | | | | | | | | | | | | | | | | | | | |
Balance, beginning of year | | | (217 | ) | | | (13,383 | ) | | | (229 | ) | | | (14,122 | ) | | | (177 | ) | | | (10,387 | ) |
Share repurchases | | | (76 | ) | | | (4,978 | ) | | | — | | | | — | | | | (68 | ) | | | (4,720 | ) |
Stock option exercises | | | 24 | | | | 1,487 | | | | 11 | | | | 649 | | | | 15 | | | | 883 | |
Other | | | (15 | ) | | | 129 | | | | 1 | | | | 90 | | | | 1 | | | | 102 | |
| | | | | | | | | | | | | | | | | | | | | | | | |
Balance, end of year | | | (284 | ) | | | (16,745 | ) | | | (217 | ) | | | (13,383 | ) | | | (229 | ) | | | (14,122 | ) |
| | | | | | | | | | | | | | | | | | | | | | | | |
Total Common Shareholders’ Equity | | | | | | | 21,273 | | | | | | | | 16,908 | | | | | | | | 12,203 | |
| | | | | | | | | | | | | | | | | | | | | | | | |
Noncontrolling Interests | | | | | | | | | | | | | | | | | | | | | | | | |
Balance, beginning of year | | | | | | | 638 | | | | | | | | 476 | | | | | | | | 62 | |
Net income attributable to noncontrolling interests | | | | | | | 18 | | | | | | | | 33 | | | | | | | | 24 | |
(Distributions to)/contributions from noncontrolling interests, net | | | | | | | (332 | ) | | | | | | | 150 | | | | | | | | 450 | |
Currency translation adjustment | | | | | | | (13 | ) | | | | | | | (12 | ) | | | | | | | (48 | ) |
Other, net | | | | | | | 1 | | | | | | | | (9 | ) | | | | | | | (12 | ) |
| | | | | | | | | | | | | | | | | | | | | | | | |
Balance, end of year | | | | | | | 312 | | | | | | | | 638 | | | | | | | | 476 | |
| | | | | | | | | | | | | | | | | | | | | | | | |
Total Equity | | | | | | $ | 21,476 | | | | | | | $ | 17,442 | | | | | | | $ | 12,582 | |
| | | | | | | | | | | | | | | | | | | | | | | | |
| (a) | Includes total tax benefits of $75 million in 2010, $31 million in 2009 and $95 million in 2008. |
(Continued on following page)
57
Consolidated Statement of Equity (continued)
PepsiCo, Inc. and Subsidiaries
Fiscal years ended December 25, 2010, December 26, 2009 and December 27, 2008
(in millions)
| | | | | | | | | | | | |
| | | 2010 | | | 2009 | | | 2008 | |
Comprehensive Income | | | | | | | | | | | | |
Net income | | $ | 6,338 | | | $ | 5,979 | | | $ | 5,166 | |
Other Comprehensive Income/(Loss) | | | | | | | | | | | | |
Currency translation adjustment | | | 299 | | | | 788 | | | | (2,532 | ) |
Cash flow hedges, net of tax | | | (58 | ) | | | (27 | ) | | | 21 | |
Pension and retiree medical, net of tax: | | | | | | | | | | | | |
Net prior service credit/(cost) | | | 22 | | | | (3 | ) | | | 55 | |
Net (losses)/gains | | | (136 | ) | | | 110 | | | | (1,358 | ) |
Unrealized gains/(losses) on securities, net of tax | | | 23 | | | | 20 | | | | (21 | ) |
Other | | | 1 | | | | — | | | | (6 | ) |
| | | | | | | | | | | | |
| | | 151 | | | | 888 | | | | (3,841 | ) |
| | | | | | | | | | | | |
Comprehensive Income | | | 6,489 | | | | 6,867 | | | | 1,325 | |
Comprehensive (income)/loss attributable to noncontrolling interests | | | (5 | ) | | | (21 | ) | | | 24 | |
| | | | | | | | | | | | |
Comprehensive Income Attributable to PepsiCo | | $ | 6,484 | | | $ | 6,846 | | | $ | 1,349 | |
| | | | | | | | | | | | |
See accompanying notes to consolidated financial statements.
58
Notes to Consolidated Financial Statements
Note 1 — Basis of Presentation and Our Divisions
Basis of Presentation
Our financial statements include the consolidated accounts of PepsiCo, Inc. and the affiliates that we control. In addition, we include our share of the results of certain other affiliates based on our economic ownership interest. We do not control these other affiliates, as our ownership in these other affiliates is generally less than 50%. Intercompany balances and transactions are eliminated. Our fiscal year ends on the last Saturday of each December, resulting in an additional week of results every five or six years.
On February 26, 2010, we completed our acquisitions of The Pepsi Bottling Group, Inc. (PBG) and PepsiAmericas, Inc. (PAS). The results of the acquired companies in the U.S. and Canada are reflected in our consolidated results as of the acquisition date, and the international results of the acquired companies have been reported as of the beginning of our second quarter of 2010, consistent with our monthly international reporting calendar. The results of the acquired companies in the U.S., Canada and Mexico are reported within our PAB segment, and the results of the acquired companies in Europe, including Russia, are reported within our Europe segment. Prior to our acquisitions of PBG and PAS, we recorded our share of equity income or loss from the acquired companies in bottling equity income in our income statement. Our share of the net income of PBV is reflected in bottling equity income and our share of income or loss from other noncontrolled affiliates is reflected as a component of selling, general and administrative expenses. Additionally, in the first quarter of 2010, in connection with our acquisitions of PBG and PAS, we recorded a gain on our previously held equity interests of $958 million, comprising $735 million which is non-taxable and recorded in bottling equity income and $223 million related to the reversal of deferred tax liabilities associated with these previously held equity interests. See Notes 8 and 15 and for additional unaudited information on items affecting the comparability of our consolidated results, see “Items Affecting Comparability” in Management’s Discussion and Analysis of Financial Condition and Results of Operations.
As of the beginning of our 2010 fiscal year, the results of our Venezuelan businesses are reported under hyperinflationary accounting. See “Our Business Risks” and “Items Affecting Comparability” in Management’s Discussion and Analysis of Financial Condition and Results of Operations.
Raw materials, direct labor and plant overhead, as well as purchasing and receiving costs, costs directly related to production planning, inspection costs and raw material handling facilities, are included in cost of sales. The costs of moving, storing and delivering finished product are included in selling, general and administrative expenses.
The preparation of our consolidated financial statements in conformity with generally accepted accounting principles requires us to make estimates and assumptions that affect reported amounts of assets, liabilities, revenues, expenses and disclosure of contingent
59
assets and liabilities. Estimates are used in determining, among other items, sales incentives accruals, tax reserves, stock-based compensation, pension and retiree medical accruals, useful lives for intangible assets, and future cash flows associated with impairment testing for perpetual brands, goodwill and other long-lived assets. We evaluate our estimates on an ongoing basis using our historical experience, as well as other factors we believe appropriate under the circumstances, such as current economic conditions, and adjust or revise our estimates as circumstances change. As future events and their effect cannot be determined with precision, actual results could differ significantly from these estimates.
While the majority of our results are reported on a weekly calendar basis, most of our international operations report on a monthly calendar basis. The following chart details our quarterly reporting schedule:
| | | | |
Quarter | | U.S. and Canada | | International |
| First Quarter | | 12 weeks | | January, February |
| Second Quarter | | 12 weeks | | March, April and May |
| Third Quarter | | 12 weeks | | June, July and August |
| Fourth Quarter | | 16 weeks | | September, October, |
| | | | November and December |
See “Our Divisions” below and for additional unaudited information on items affecting the comparability of our consolidated results, see “Items Affecting Comparability” in Management’s Discussion and Analysis of Financial Condition and Results of Operations.
Tabular dollars are in millions, except per share amounts. All per share amounts reflect common per share amounts, assume dilution unless noted, and are based on unrounded amounts. Certain reclassifications were made to prior years’ amounts to conform to the 2010 presentation.
Our Divisions
We manufacture or use contract manufacturers, market and sell a variety of salty, convenient, sweet and grain-based snacks, carbonated and non-carbonated beverages, and foods in over 200 countries with our largest operations in North America (United States and Canada), Mexico, Russia and the United Kingdom. Division results are based on how our Chief Executive Officer assesses the performance of and allocates resources to our divisions. For additional unaudited information on our divisions, see “Our Operations” in Management’s Discussion and Analysis of Financial Condition and Results of Operations. The accounting policies for the divisions are the same as those described in Note 2, except for the following allocation methodologies:
| | • | | stock-based compensation expense; |
| | • | | pension and retiree medical expense; and |
60
Stock-Based Compensation Expense
Our divisions are held accountable for stock-based compensation expense and, therefore, this expense is allocated to our divisions as an incremental employee compensation cost. The allocation of stock-based compensation expense in 2010 was approximately 16% to FLNA, 3% to QFNA, 5% to LAF, 32% to PAB, 11% to Europe, 8% to AMEA and 25% to corporate unallocated expenses. We had similar allocations of stock-based compensation expense to our divisions in 2009 and 2008. The expense allocated to our divisions excludes any impact of changes in our assumptions during the year which reflect market conditions over which division management has no control. Therefore, any variances between allocated expense and our actual expense are recognized in corporate unallocated expenses.
Pension and Retiree Medical Expense
Pension and retiree medical service costs measured at a fixed discount rate, as well as amortization of costs related to certain pension plan amendments and gains and losses due to demographics, including salary experience, are reflected in division results for North American employees. Division results also include interest costs, measured at a fixed discount rate, for retiree medical plans. Interest costs for the pension plans, pension asset returns and the impact of pension funding, and gains and losses other than those due to demographics, are all reflected in corporate unallocated expenses. In addition, corporate unallocated expenses include the difference between the service costs measured at a fixed discount rate (included in division results as noted above) and the total service costs determined using the plans’ discount rates as disclosed in Note 7.
Derivatives
We centrally manage commodity derivatives on behalf of our divisions. These commodity derivatives include energy, fruit and other raw materials. Certain of these commodity derivatives do not qualify for hedge accounting treatment and are marked to market with the resulting gains and losses recognized in corporate unallocated expenses. These gains and losses are subsequently reflected in division results when the divisions take delivery of the underlying commodity. Therefore, the divisions realize the economic effects of the derivative without experiencing any resulting mark-to-market volatility, which remains in corporate unallocated expenses. These derivatives hedge underlying commodity price risk and were not entered into for speculative purposes.
61
| | | | | | | | | | | | | | | | | | | | | | | | |
| | | 2010 | | | 2009 | | | 2008 | | | 2010 | | | 2009 | | | 2008 | |
| | | Net Revenue | | | Operating Profit(a) | |
FLNA | | $ | 12,573 | | | $ | 12,421 | | | $ | 11,698 | | | $ | 3,376 | | | $ | 3,105 | | | $ | 2,831 | |
QFNA | | | 2,656 | | | | 2,687 | | | | 2,711 | | | | 741 | | | | 781 | | | | 710 | |
LAF | | | 6,315 | | | | 5,703 | | | | 5,895 | | | | 1,004 | | | | 904 | | | | 897 | |
PAB(b) | | | 20,401 | | | | 10,116 | | | | 10,937 | | | | 2,776 | | | | 2,172 | | | | 2,026 | |
Europe(b) | | | 9,602 | | | | 7,028 | | | | 7,177 | | | | 1,054 | | | | 948 | | | | 944 | |
AMEA | | | 6,291 | | | | 5,277 | | | | 4,833 | | | | 708 | | | | 700 | | | | 558 | |
| | | | | | | | | | | | | | | | | | | | | | | | |
Total division | | | 57,838 | | | | 43,232 | | | | 43,251 | | | | 9,659 | | | | 8,610 | | | | 7,966 | |
Corporate Unallocated | | | | | | | | | | | | | | | | | | | | | | | | |
Net impact of mark-to-market on commodity hedges | | | — | | | | — | | | | — | | | | 91 | | | | 274 | | | | (346 | ) |
Merger and integration costs | | | — | | | | — | | | | — | | | | (191 | ) | | | (49 | ) | | | — | |
Restructuring and impairment charges | | | — | | | | — | | | | — | | | | — | | | | — | | | | (10 | ) |
Venezuela currency devaluation | | | — | | | | — | | | | — | | | | (129 | ) | | | — | | | | — | |
Asset write-off | | | — | | | | — | | | | — | | | | (145 | ) | | | — | | | | — | |
Foundation contribution | | | — | | | | — | | | | — | | | | (100 | ) | | | — | | | | — | |
Other | | | — | | | | — | | | | — | | | | (853 | ) | | | (791 | ) | | | (651 | ) |
| | | | | | | | | | | | | | | | | | | | | | | | |
| | $ | 57,838 | | | $ | 43,232 | | | $ | 43,251 | | | $ | 8,332 | | | $ | 8,044 | | | $ | 6,959 | |
| | | | | | | | | | | | | | | | | | | | | | | | |
| (a) | For information on the impact of restructuring, impairment and integration charges on our divisions, see Note 3. |
| (b) | Changes in 2010 relate primarily to our acquisitions of PBG and PAS. |
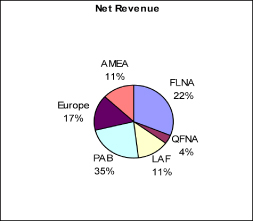
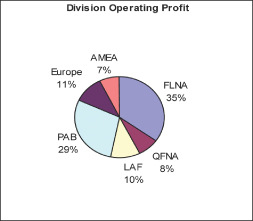
62
Corporate
Corporate includes costs of our corporate headquarters, centrally managed initiatives, such as our ongoing business transformation initiative and research and development projects, unallocated insurance and benefit programs, foreign exchange transaction gains and losses, certain commodity derivative gains and losses and certain other items.
Other Division Information
| | | | | | | | | | | | | | | | | | | | | | | | |
| | | 2010 | | | 2009 | | | 2008 | | | 2010 | | | 2009 | | | 2008 | |
| | | Total Assets | | | Capital Spending | |
FLNA | | $ | 6,027 | | | $ | 6,093 | | | $ | 6,037 | | | $ | 515 | | | $ | 478 | | | $ | 539 | |
QFNA | | | 1,217 | | | | 1,241 | | | | 1,282 | | | | 48 | | | | 45 | | | | 57 | |
LAF | | | 4,053 | | | | 3,575 | | | | 3,023 | | | | 370 | | | | 310 | | | | 351 | |
PAB(a) | | | 31,622 | | | | 7,670 | | | | 7,673 | | | | 973 | | | | 182 | | | | 344 | |
Europe(a) | | | 13,032 | | | | 9,471 | | | | 8,959 | | | | 517 | | | | 370 | | | | 435 | |
AMEA | | | 5,569 | | | | 4,787 | | | | 3,637 | | | | 610 | | | | 572 | | | | 445 | |
| | | | | | | | | | | | | | | | | | | | | | | | |
Total division | | | 61,520 | | | | 32,837 | | | | 30,611 | | | | 3,033 | �� | | | 1,957 | | | | 2,171 | |
Corporate(b) | | | 6,394 | | | | 3,933 | | | | 2,729 | | | | 220 | | | | 171 | | | | 275 | |
Investments in bottling affiliates(a) | | | 239 | | | | 3,078 | | | | 2,654 | | | | — | | | | — | | | | — | |
| | | | | | | | | | | | | | | | | | | | | | | | |
| | $ | 68,153 | | | $ | 39,848 | | | $ | 35,994 | | | $ | 3,253 | | | $ | 2,128 | | | $ | 2,446 | |
| | | | | | | | | | | | | | | | | | | | | | | | |
| (a) | Changes in total assets in 2010 relate primarily to our acquisitions of PBG and PAS. |
| (b) | Corporate assets consist principally of cash and cash equivalents, short-term investments, derivative instruments and property, plant and equipment. |
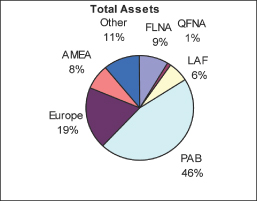
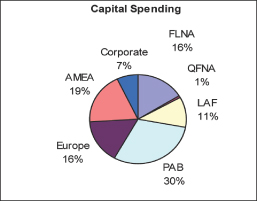
63
| | | | | | | | | | | | | | | | | | | | | | | | |
| | | 2010 | | | 2009 | | | 2008 | | | 2010 | | | 2009 | | | 2008 | |
| | | Amortization of Intangible
Assets | | | Depreciation and Other
Amortization | |
FLNA | | $ | 7 | | | $ | 7 | | | $ | 9 | | | $ | 448 | | | $ | 428 | | | $ | 430 | |
QFNA | | | — | | | | — | | | | — | | | | 52 | | | | 48 | | | | 45 | |
LAF | | | 6 | | | | 5 | | | | 6 | | | | 213 | | | | 189 | | | | 194 | |
PAB(a) | | | 56 | | | | 18 | | | | 16 | | | | 749 | | | | 345 | | | | 334 | |
Europe(a) | | | 35 | | | | 22 | | | | 23 | | | | 355 | | | | 236 | | | | 216 | |
AMEA | | | 13 | | | | 11 | | | | 10 | | | | 294 | | | | 239 | | | | 207 | |
| | | | | | | | | | | | | | | | | | | | | | | | |
Total division | | | 117 | | | | 63 | | | | 64 | | | | 2,111 | | | | 1,485 | | | | 1,426 | |
Corporate | | | — | | | | — | | | | — | | | | 99 | | | | 87 | | | | 53 | |
| | | | | | | | | | | | | | | | | | | | | | | | |
| | $ | 117 | | | $ | 63 | | | $ | 64 | | | $ | 2,210 | | | $ | 1,572 | | | $ | 1,479 | |
| | | | | | | | | | | | | | | | | | | | | | | | |
| | | | | | |
| | | 2010 | | | 2009 | | | 2008 | | | 2010 | | | 2009 | | | 2008 | |
| | | Net Revenue(b) | | | Long-Lived Assets(c) | |
U.S.(a) | | $ | 30,618 | | | $ | 22,446 | | | $ | 22,525 | | | $ | 28,631 | | | $ | 12,496 | | | $ | 12,095 | |
Mexico(a) | | | 4,531 | | | | 3,210 | | | | 3,714 | | | | 1,671 | | | | 1,044 | | | | 904 | |
Canada(a) | | | 3,081 | | | | 1,996 | | | | 2,107 | | | | 3,133 | | | | 688 | | | | 556 | |
Russia(a) | | | 1,890 | | | | 1,006 | | | | 585 | | | | 2,744 | | | | 2,094 | | | | 577 | |
United Kingdom | | | 1,888 | | | | 1,826 | | | | 2,099 | | | | 1,019 | | | | 1,358 | | | | 1,509 | |
All other countries | | | 15,830 | | | | 12,748 | | | | 12,221 | | | | 11,697 | | | | 8,632 | | | | 6,889 | |
| | | | | | | | | | | | | | | | | | | | | | | | |
| | $ | 57,838 | | | $ | 43,232 | | | $ | 43,251 | | | $ | 48,895 | | | $ | 26,312 | | | $ | 22,530 | |
| | | | | | | | | | | | | | | | | | | | | | | | |
| (a) | Increases in 2010 relate primarily to our acquisitions of PBG and PAS. |
| (b) | Represents net revenue from businesses operating in these countries. |
| (c) | Long-lived assets represent property, plant and equipment, nonamortizable intangible assets, amortizable intangible assets and investments in noncontrolled affiliates. These assets are reported in the country where they are primarily used. |
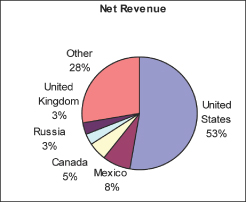
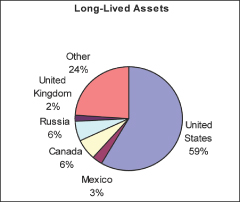
64
Note 2 — Our Significant Accounting Policies
Revenue Recognition
We recognize revenue upon shipment or delivery to our customers based on written sales terms that do not allow for a right of return. However, our policy for DSD and certain chilled products is to remove and replace damaged and out-of-date products from store shelves to ensure that our consumers receive the product quality and freshness that they expect. Similarly, our policy for certain warehouse-distributed products is to replace damaged and out-of-date products. Based on our experience with this practice, we have reserved for anticipated damaged and out-of-date products. For additional unaudited information on our revenue recognition and related policies, including our policy on bad debts, see “Our Critical Accounting Policies” in Management’s Discussion and Analysis of Financial Condition and Results of Operations. We are exposed to concentration of credit risk by our customers, including Wal-Mart. In 2010, Wal-Mart (including Sam’s) represented approximately 12% of our total net revenue, including concentrate sales to our bottlers (including concentrate sales to PBG and PAS prior to the February 26, 2010 acquisition date) which are used in finished goods sold by them to Wal-Mart. We have not experienced credit issues with these customers.
Sales Incentives and Other Marketplace Spending
We offer sales incentives and discounts through various programs to our customers and consumers. Sales incentives and discounts are accounted for as a reduction of revenue and totaled $29.1 billion in 2010, $12.9 billion in 2009 and $12.5 billion in 2008. While most of these incentive arrangements have terms of no more than one year, certain arrangements, such as fountain pouring rights, may extend beyond one year. Costs incurred to obtain these arrangements are recognized over the shorter of the economic or contractual life, as a reduction of revenue, and the remaining balances of $296 million, as of both December 25, 2010 and December 26, 2009, are included in current assets and other assets on our balance sheet.For additional unaudited information on our sales incentives, see “Our Critical Accounting Policies” in Management’s Discussion and Analysis of Financial Condition and Results of Operations.
Other marketplace spending, which includes the costs of advertising and other marketing activities, totaled $3.4 billion in 2010, $2.8 billion in 2009 and $2.9 billion in 2008 and is reported as selling, general and administrative expenses. Included in these amounts were advertising expenses of $1.9 billion in 2010 and $1.7 billion in both 2009 and 2008. Deferred advertising costs are not expensed until the year first used and consist of:
| | • | | media and personal service prepayments; |
| | • | | promotional materials in inventory; and |
| | • | | production costs of future media advertising. |
Deferred advertising costs of $158 million and $143 million at year-end 2010 and 2009, respectively, are classified as prepaid expenses on our balance sheet.
65
Distribution Costs
Distribution costs, including the costs of shipping and handling activities, are reported as selling, general and administrative expenses. Shipping and handling expenses were $7.7 billion in 2010 and $5.6 billion in both 2009 and 2008.
Cash Equivalents
Cash equivalents are investments with original maturities of three months or less which we do not intend to rollover beyond three months.
Software Costs
We capitalize certain computer software and software development costs incurred in connection with developing or obtaining computer software for internal use when both the preliminary project stage is completed and it is probable that the software will be used as intended. Capitalized software costs include only (i) external direct costs of materials and services utilized in developing or obtaining computer software, (ii) compensation and related benefits for employees who are directly associated with the software project and (iii) interest costs incurred while developing internal-use computer software. Capitalized software costs are included in property, plant and equipment on our balance sheet and amortized on a straight-line basis when placed into service over the estimated useful lives of the software, which approximate five to ten years. Software amortization totaled $137 million in 2010, $119 million in 2009 and $58 million in 2008. Net capitalized software and development costs were $1.1 billion as of both December 25, 2010 and December 26, 2009.
Commitments and Contingencies
We are subject to various claims and contingencies related to lawsuits, certain taxes and environmental matters, as well as commitments under contractual and other commercial obligations. We recognize liabilities for contingencies and commitments when a loss is probable and estimable. For additional information on our commitments, see Note 9.
Research and Development
We engage in a variety of research and development activities. These activities principally involve the development of new products, improvement in the quality of existing products, improvement and modernization of production processes, and the development and implementation of new technologies to enhance the quality and value of both current and proposed product lines. Consumer research is excluded from research and development costs and included in other marketing costs. Research and development costs were $488 million in 2010, $414 million in 2009 and $388 million in 2008 and are reported within selling, general and administrative expenses.
66
Other Significant Accounting Policies
Our other significant accounting policies are disclosed as follows:
| | • | | Property, Plant and Equipment and Intangible Assets– Note 4, and for additional unaudited information on goodwill and other intangible assets, see “Our Critical Accounting Policies” in Management’s Discussion and Analysis of Financial Condition and Results of Operations. |
| | • | | Income Taxes – Note 5, and for additional unaudited information, see “Our Critical Accounting Policies” in Management’s Discussion and Analysis of Financial Condition and Results of Operations. |
| | • | | Stock-Based Compensation –Note 6. |
| | • | | Pension, Retiree Medical and Savings Plans – Note 7, and for additional unaudited information, see “Our Critical Accounting Policies” in Management’s Discussion and Analysis of Financial Condition and Results of Operations. |
| | • | | Financial Instruments – Note 10, and for additional unaudited information, see “Our Business Risks” in Management’s Discussion and Analysis of Financial Condition and Results of Operations. |
Recent Accounting Pronouncements
In December 2007, the Financial Accounting Standards Board (FASB) amended its guidance on accounting for business combinations to improve, simplify and converge internationally the accounting for business combinations. The new accounting guidance continues the movement toward the greater use of fair value in financial reporting and increased transparency through expanded disclosures. We adopted the provisions of the new guidance as of the beginning of our 2009 fiscal year. The new accounting guidance changes how business acquisitions are accounted for and will impact financial statements both on the acquisition date and in subsequent periods. Additionally, under the new guidance, transaction costs are expensed rather than capitalized. Future adjustments made to valuation allowances on deferred taxes and acquired tax contingencies associated with acquisitions that closed prior to the beginning of our 2009 fiscal year apply the new provisions and will be evaluated based on the outcome of these matters.
In June 2009, the FASB amended its accounting guidance on the consolidation of variable interest entities (VIE). Among other things, the new guidance requires a qualitative rather than a quantitative assessment to determine the primary beneficiary of a VIE based on whether the entity (1) has the power to direct matters that most significantly impact the activities of the VIE and (2) has the obligation to absorb losses or the right to receive benefits of the VIE that could potentially be significant to the VIE. In addition, the amended guidance requires an ongoing reconsideration of the primary beneficiary. The provisions of this new guidance were effective as of the beginning of our 2010 fiscal year, and the adoption did not have a material impact on our financial statements.
In the second quarter of 2010, the Patient Protection and Affordable Care Act (PPACA) was signed into law. The PPACA changes the tax treatment related to an existing retiree
67
drug subsidy (RDS) available to sponsors of retiree health benefit plans that provide a benefit that is at least actuarially equivalent to the benefits under Medicare Part D. As a result of the PPACA, RDS payments will effectively become taxable in tax years beginning in 2013, by requiring the amount of the subsidy received to be offset against our deduction for health care expenses. The provisions of the PPACA required us to record the effect of this tax law change beginning in our second quarter of 2010, and consequently we recorded a one-time related tax charge of $41 million in the second quarter of 2010. We continue to evaluate the longer-term impacts of this new legislation.
Note 3 — Restructuring, Impairment and Integration Charges
In 2010, we incurred merger and integration charges of $799 million related to our acquisitions of PBG and PAS, as well as advisory fees in connection with our acquisition of WBD. $467 million of these charges were recorded in the PAB segment, $111 million recorded in the Europe segment, $191 million recorded in corporate unallocated expenses and $30 million recorded in interest expense. All of these charges, other than the interest expense portion, were recorded in selling, general and administrative expenses. The merger and integration charges related to our acquisitions of PBG and PAS are being incurred to help create a more fully integrated supply chain and go-to-market business model, to improve the effectiveness and efficiency of the distribution of our brands and to enhance our revenue growth. These charges also include closing costs, one-time financing costs and advisory fees related to our acquisitions of PBG and PAS. In addition, we recorded $9 million of merger–related charges, representing our share of the respective merger costs of PBG and PAS, in bottling equity income. Substantially all cash payments related to the above charges are expected to be paid by the end of 2011. In total, these charges had an after-tax impact of $648 million or $0.40 per share.
In 2009, we incurred $50 million of charges related to the merger of PBG and PAS, of which substantially all was paid in 2009. In 2009, we also incurred charges of $36 million ($29 million after-tax or $0.02 per share) in conjunction with our Productivity for Growth program that began in 2008. The program includes actions in all divisions of the business, including the closure of six plants that we believe will increase cost competitiveness across the supply chain, upgrade and streamline our product portfolio, and simplify the organization for more effective and timely decision-making. These charges were recorded in selling, general and administrative expenses. These initiatives were completed in the second quarter of 2009 and substantially all cash payments related to these charges were paid by the end of 2010.
In 2008, we incurred charges of $543 million ($408 million after-tax or $0.25 per share) in conjunction with our Productivity for Growth program. Approximately $455 million of the charge was recorded in selling, general and administrative expenses, with the remainder recorded in cost of sales.
68
A summary of our merger and integration activity in 2010 is as follows:
| | | | | | | | | | | | | | | | |
| | | Severance and Other
Employee Costs(a) | | | Asset
Impairment | | | Other Costs | | | Total | |
2010 merger and integration charges | | $ | 396 | | | $ | 132 | | | $ | 280 | | | $ | 808 | |
Cash payments | | | (114 | ) | | | — | | | | (271 | ) | | | (385 | ) |
Non-cash charges | | | (103 | ) | | | (132 | ) | | | 16 | | | | (219 | ) |
| | | | | | | | | | | | | | | | |
Liability as of December 25, 2010 | | $ | 179 | | | $ | — | | | $ | 25 | | | $ | 204 | |
| | | | | | | | | | | | | | | | |
| (a) | Primarily reflects termination costs for approximately 2,370 employees. |
A summary of our restructuring and impairment charges in 2009 is as follows:
| | | | | | | | | | | | |
| | | Severance and Other
Employee Costs(a) | | | Other Costs | | | Total | |
FLNA | | $ | — | | | $ | 1 | | | $ | 1 | |
QFNA | | | — | | | | 2 | | | | 2 | |
LAF | | | 3 | | | | — | | | | 3 | |
PAB | | | 6 | | | | 10 | | | | 16 | |
Europe | | | 2 | | | | — | | | | 2 | |
AMEA | | | 6 | | | | 6 | | | | 12 | |
| | | | | | | | | | | | |
| | $ | 17 | | | $ | 19 | | | $ | 36 | |
| | | | | | | | | | | | |
| (a) | Primarily reflects termination costs for approximately 410 employees. |
A summary of our restructuring and impairment charges in 2008 is as follows:
| | | | | | | | | | | | | | | | |
| | | Severance and Other
Employee Costs | | | Asset
Impairment | | | Other Costs | | | Total | |
FLNA | | $ | 35 | | | $ | 31 | | | $ | 15 | | | $ | 81 | |
QFNA | | | 27 | | | | 10 | | | | 21 | | | | 58 | |
LAF | | | 30 | | | | 8 | | | | 2 | | | | 40 | |
PAB | | | 68 | | | | 92 | | | | 129 | | | | 289 | |
Europe | | | 39 | | | | 6 | | | | 5 | | | | 50 | |
AMEA | | | 11 | | | | 2 | | | | 2 | | | | 15 | |
Corporate | | | 2 | | | | — | | | | 8 | | | | 10 | |
| | | | | | | | | | | | | | | | |
| | $ | 212 | | | $ | 149 | | | $ | 182 | | | $ | 543 | |
| | | | | | | | | | | | | | | | |
Severance and other employee costs primarily reflect termination costs for approximately 3,500 employees. Asset impairments relate to the closure of six plants and changes to our beverage product portfolio. Other costs include contract exit costs and third-party incremental costs associated with upgrading our product portfolio and our supply chain.
69
A summary of our Productivity for Growth program activity is as follows:
| | | | | | | | | | | | | | | | |
| | | Severance and Other
Employee Costs | | | Asset
Impairment | | | Other
Costs | | | Total | |
2008 restructuring and impairment charges | | $ | 212 | | | $ | 149 | | | $ | 182 | | | $ | 543 | |
Cash payments | | | (50 | ) | | | — | | | | (109 | ) | | | (159 | ) |
Non-cash charge | | | (27 | ) | | | (149 | ) | | | (9 | ) | | | (185 | ) |
Currency translation | | | (1 | ) | | | — | | | | — | | | | (1 | ) |
| | | | | | | | | | | | | | | | |
Liability as of December 27, 2008 | | | 134 | | | | — | | | | 64 | | | | 198 | |
2009 restructuring and impairment charges | | | 17 | | | | 12 | | | | 7 | | | | 36 | |
Cash payments | | | (128 | ) | | | — | | | | (68 | ) | | | (196 | ) |
Currency translation | | | (14 | ) | | | (12 | ) | | | 25 | | | | (1 | ) |
| | | | | | | | | | | | | | | | |
Liability as of December 26, 2009 | | | 9 | | | | — | | | | 28 | | | | 37 | |
Cash payments | | | (6 | ) | | | — | | | | (25 | ) | | | (31 | ) |
Non-cash charge | | | (2 | ) | | | — | | | | (1 | ) | | | (3 | ) |
Currency translation | | | — | | | | — | | | | (1 | ) | | | (1 | ) |
| | | | | | | | | | | | | | | | |
Liability as of December 25, 2010 | | $ | 1 | | | $ | — | | | $ | 1 | | | $ | 2 | |
| | | | | | | | | | | | | | | | |
70
Note 4 — Property, Plant and Equipment and Intangible Assets
| | | | | | | | | | | | | | | | |
| | | Average
Useful Life | | | 2010 | | | 2009 | | | 2008 | |
Property, plant and equipment, net | | | | | | | | | | | | | | | | |
Land and improvements | | | 10 – 34yrs. | | | $ | 1,976 | | | $ | 1,208 | | | | | |
Buildings and improvements | | | 15 – 44 | | | | 7,054 | | | | 5,080 | | | | | |
Machinery and equipment, including fleet and software | | | 5 – 15 | | | | 22,091 | | | | 17,183 | | | | | |
Construction in progress | | | | | | | 1,920 | | | | 1,441 | | | | | |
| | | | | | | | | | | | | | | | |
| | | | | | | 33,041 | | | | 24,912 | | | | | |
Accumulated depreciation | | | | | | | (13,983 | ) | | | (12,241 | ) | | | | |
| | | | | | | | | | | | | | | | |
| | | | | | $ | 19,058 | | | $ | 12,671 | | | | | |
| | | | | | | | | | | | | | | | |
Depreciation expense | | | | | | $ | 2,124 | | | $ | 1,500 | | | $ | 1,422 | |
| | | | | | | | | | | | | | | | |
Amortizable intangible assets, net | | | | | | | | | | | | | | | | |
Acquired franchise rights | | | 56 – 60 | | | $ | 949 | | | $ | — | | | | | |
Reacquired franchise rights | | | 1 – 14 | | | | 110 | | | | — | | | | | |
Brands | | | 5 – 40 | | | | 1,463 | | | | 1,465 | | | | | |
Other identifiable intangibles | | | 10 – 24 | | | | 747 | | | | 505 | | | | | |
| | | | | | | | | | | | | | | | |
| | | | | | | 3,269 | | | | 1,970 | | | | | |
Accumulated amortization | | | | | | | (1,244 | ) | | | (1,129 | ) | | | | |
| | | | | | | | | | | | | | | | |
| | | | | | $ | 2,025 | | | $ | 841 | | | | | |
| | | | | | | | | | | | | | | | |
Amortization expense | | | | | | $ | 117 | | | $ | 63 | | | $ | 64 | |
| | | | | | | | | | | | | | | | |
Property, plant and equipment is recorded at historical cost. Depreciation and amortization are recognized on a straight-line basis over an asset’s estimated useful life. Land is not depreciated and construction in progress is not depreciated until ready for service. Amortization of intangible assets for each of the next five years, based on existing intangible assets as of December 25, 2010 and using average 2010 foreign exchange rates, is expected to be $121 million in 2011, $114 million in 2012, $106 million in 2013, $89 million in 2014 and $81 million in 2015.
Depreciable and amortizable assets are only evaluated for impairment upon a significant change in the operating or macroeconomic environment. In these circumstances, if an evaluation of the undiscounted cash flows indicates impairment, the asset is written down to its estimated fair value, which is based on discounted future cash flows. Useful lives are periodically evaluated to determine whether events or circumstances have occurred which indicate the need for revision. For additional unaudited information on our policies for amortizable brands, see “Our Critical Accounting Policies” in Management’s Discussion and Analysis of Financial Condition and Results of Operations.
71
Nonamortizable Intangible Assets
Perpetual brands and goodwill are assessed for impairment at least annually. If the carrying amount of a perpetual brand exceeds its fair value, as determined by its discounted cash flows, an impairment loss is recognized in an amount equal to that excess. No impairment charges resulted from these impairment evaluations. The change in the book value of nonamortizable intangible assets is as follows:
| | | | | | | | | | | | | | | | | | | | | | | | | | | | |
| | | Balance,
Beginning
2009 | | | Acquisitions | | | Translation
and Other | | | Balance,
End of
2009 | | | Acquisitions | | | Translation
and Other | | | Balance,
End of
2010 | |
FLNA | | | | | | | | | | | | | | | | | | | | | | | | | | | | |
Goodwill | | $ | 277 | | | $ | 6 | | | $ | 23 | | | $ | 306 | | | $ | — | | | $ | 7 | | | $ | 313 | |
Brands | | | — | | | | 26 | | | | 4 | | | | 30 | | | | — | | | | 1 | | | | 31 | |
| | | | | | | | | | | | | | | | | | | | | | | | | | | | |
| | | 277 | | | | 32 | | | | 27 | | | | 336 | | | | — | | | | 8 | | | | 344 | |
| | | | | | | | | | | | | | | | | | | | | | | | | | | | |
QFNA | | | | | | | | | | | | | | | | | | | | | | | | | | | | |
Goodwill | | | 175 | | | | — | | | | — | | | | 175 | | | | — | | | | — | | | | 175 | |
| | | | | | | | | | | | | | | | | | | | | | | | | | | | |
LAF | | | | | | | | | | | | | | | | | | | | | | | | | | | | |
Goodwill | | | 424 | | | | 17 | | | | 38 | | | | 479 | | | | — | | | | 18 | | | | 497 | |
Brands | | | 127 | | | | 1 | | | | 8 | | | | 136 | | | | — | | | | 7 | | | | 143 | |
| | | | | | | | | | | | | | | | | | | | | | | | | | | | |
| | | 551 | | | | 18 | | | | 46 | | | | 615 | | | | — | | | | 25 | | | | 640 | |
| | | | | | | | | | | | | | | | | | | | | | | | | | | | |
PAB(a) | | | | | | | | | | | | | | | | | | | | | | | | | | | | |
Goodwill | | | 2,355 | | | | 62 | | | | 14 | | | | 2,431 | | | | 7,476 | | | | 39 | | | | 9,946 | |
Reacquired franchise rights | | | — | | | | — | | | | — | | | | — | | | | 7,229 | | | | 54 | | | | 7,283 | |
Acquired franchise rights | | | — | | | | — | | | | — | | | | — | | | | 660 | | | | 905 | (b) | | | 1,565 | |
Brands | | | 59 | | | | 48 | | | | 5 | | | | 112 | | | | 66 | | | | 4 | | | | 182 | |
Other | | | — | | | | — | | | | — | | | | — | | | | 10 | | | | — | | | | 10 | |
| | | | | | | | | | | | | | | | | | | | | | | | | | | | |
| | | 2,414 | | | | 110 | | | | 19 | | | | 2,543 | | | | 15,441 | | | | 1,002 | | | | 18,986 | |
| | | | | | | | | | | | | | | | | | | | | | | | | | | | |
Europe(a) | | | | | | | | | | | | | | | | | | | | | | | | | | | | |
Goodwill | | | 1,470 | | | | 1,291 | | | | (136 | ) | | | 2,625 | | | | 583 | | | | (168 | ) | | | 3,040 | |
Reacquired franchise rights | | | — | | | | — | | | | — | | | | — | | | | 810 | | | | (17 | ) | | | 793 | |
Acquired franchise rights | | | — | | | | — | | | | — | | | | — | | | | 232 | | | | (5 | ) | | | 227 | |
Brands | | | 844 | | | | 572 | | | | (38 | ) | | | 1,378 | | | | 88 | | | | (86 | ) | | | 1,380 | |
| | | | | | | | | | | | | | | | | | | | | | | | | | | | |
| | | 2,314 | | | | 1,863 | | | | (174 | ) | | | 4,003 | | | | 1,713 | | | | (276 | ) | | | 5,440 | |
| | | | | | | | | | | | | | | | | | | | | | | | | | | | |
AMEA | | | | | | | | | | | | | | | | | | | | | | | | | | | | |
Goodwill | | | 423 | | | | 4 | | | | 91 | | | | 518 | | | | 116 | | | | 56 | | | | 690 | |
Brands | | | 98 | | | | — | | | | 28 | | | | 126 | | | | 26 | | | | 17 | | | | 169 | |
| | | | | | | | | | | | | | | | | | | | | | | | | | | | |
| | | 521 | | | | 4 | | | | 119 | | | | 644 | | | | 142 | | | | 73 | | | | 859 | |
| | | | | | | | | | | | | | | | | | | | | | | | | | | | |
Total goodwill | | | 5,124 | | | | 1,380 | | | | 30 | | | | 6,534 | | | | 8,175 | | | | (48 | ) | | | 14,661 | |
Total reacquired franchise rights | | | — | | | | — | | | | — | | | | — | | | | 8,039 | | | | 37 | | | | 8,076 | |
Total acquired franchise rights | | | — | | | | — | | | | — | | | | — | | | | 892 | | | | 900 | | | | 1,792 | |
Total brands | | | 1,128 | | | | 647 | | | | 7 | | | | 1,782 | | | | 180 | | | | (57 | ) | | | 1,905 | |
Total other | | | — | | | | — | | | | — | | | | — | | | | 10 | | | | — | | | | 10 | |
| | | | | | | | | | | | | | | | | | | | | | | | | | | | |
| | $ | 6,252 | | | $ | 2,027 | | | $ | 37 | | | $ | 8,316 | | | $ | 17,296 | | | $ | 832 | | | $ | 26,444 | |
| | | | | | | | | | | | | | | | | | | | | | | | | | | | |
| (a) | Net increases in 2010 relate primarily to our acquisitions of PBG and PAS. |
| (b) | Includes $900 million related to our upfront payment to DPSG to manufacture and distribute Dr Pepper and certain other DPSG products. |
72
Note 5 — Income Taxes
| | | | | | | | | | | | |
| | | 2010 | | | 2009 | | | 2008 | |
Income before income taxes | | | | | | | | | |
U.S. | | $ | 4,008 | | | $ | 4,209 | | | $ | 3,274 | |
Foreign | | | 4,224 | | | | 3,870 | | | | 3,771 | |
| | | | | | | | | | | | |
| | $ | 8,232 | | | $ | 8,079 | | | $ | 7,045 | |
| | | | | | | | | | | | |
Provision for income taxes | | | | | | | | | | | | |
Current: U.S. Federal | | $ | 932 | | | $ | 1,238 | | | $ | 815 | |
Foreign | | | 728 | | | | 473 | | | | 732 | |
State | | | 137 | | | | 124 | | | | 87 | |
| | | | | | | | | | | | |
| | | 1,797 | | | | 1,835 | | | | 1,634 | |
| | | | | | | | | | | | |
Deferred: U.S. Federal | | | 78 | | | | 223 | | | | 313 | |
Foreign | | | 18 | | | | 21 | | | | (69 | ) |
State | | | 1 | | | | 21 | | | | 1 | |
| | | | | | | | | | | | |
| | | 97 | | | | 265 | | | | 245 | |
| | | | | | | | | | | | |
| | $ | 1,894 | | | $ | 2,100 | | | $ | 1,879 | |
| | | | | | | | | | | | |
Tax rate reconciliation | | | | | | | | | | | | |
U.S. Federal statutory tax rate | | | 35.0 | % | | | 35.0 | % | | | 35.0 | % |
State income tax, net of U.S. Federal tax benefit | | | 1.1 | | | | 1.2 | | | | 0.8 | |
Lower taxes on foreign results | | | (9.4 | ) | | | (7.9 | ) | | | (8.0 | ) |
Acquisitions of PBG and PAS | | | (3.1 | ) | | | — | | | | — | |
Other, net | | | (0.6 | ) | | | (2.3 | ) | | | (1.1 | ) |
| | | | | | | | | | | | |
Annual tax rate | | | 23.0 | % | | | 26.0 | % | | | 26.7 | % |
| | | | | | | | | | | | |
Deferred tax liabilities | | | | | | | | | | | | |
Investments in noncontrolled affiliates | | $ | 74 | | | $ | 1,120 | | | | | |
Debt guarantee of wholly owned subsidiary | | | 828 | | | | — | | | | | |
Property, plant and equipment | | | 1,984 | | | | 1,056 | | | | | |
Intangible assets other than nondeductible goodwill | | | 3,726 | | | | 417 | | | | | |
Other | | | 647 | | | | 68 | | | | | |
| | | | | | | | | | | | |
Gross deferred tax liabilities | | | 7,259 | | | | 2,661 | | | | | |
| | | | | | | | | | | | |
Deferred tax assets | | | | | | | | | | | | |
Net carryforwards | | | 1,264 | | | | 624 | | | | | |
Stock-based compensation | | | 455 | | | | 410 | | | | | |
Retiree medical benefits | | | 579 | | | | 508 | | | | | |
Other employee-related benefits | | | 527 | | | | 442 | | | | | |
Pension benefits | | | 291 | | | | 179 | | | | | |
Deductible state tax and interest benefits | | | 320 | | | | 256 | | | | | |
Long-term debt obligations acquired | | | 291 | | | | — | | | | | |
Other | | | 904 | | | | 560 | | | | | |
| | | | | | | | | | | | |
Gross deferred tax assets | | | 4,631 | | | | 2,979 | | | | | |
Valuation allowances | | | (875 | ) | | | (586 | ) | | | | |
| | | | | | | | | | | | |
Deferred tax assets, net | | | 3,756 | | | | 2,393 | | | | | |
| | | | | | | | | | | | |
Net deferred tax liabilities | | $ | 3,503 | | | $ | 268 | | | | | |
| | | | | | | | | | | | |
73
| | | | | | | | | | | | |
| | | 2010 | | | 2009 | | | 2008 | |
Deferred taxes included within: | | | | | | | | | | | | |
Assets: | | | | | | | | | | | | |
Prepaid expenses and other current assets | | $ | 554 | | | $ | 391 | | | | | |
Other assets | | | — | | | | — | | | | | |
Liabilities: | | | | | | | | | | | | |
Deferred income taxes | | $ | 4,057 | | | $ | 659 | | | | | |
| Analysis of valuation allowances | | | | | | | | | | | | |
Balance, beginning of year | | $ | 586 | | | $ | 657 | | | $ | 695 | |
Provision/(Benefit) | | | 75 | | | | (78 | ) | | | (5 | ) |
Other additions/(deductions) | | | 214 | | | | 7 | | | | (33 | ) |
| | | | | | | | | | | | |
Balance, end of year | | $ | 875 | | | $ | 586 | | | $ | 657 | |
| | | | | | | | | | | | |
For additional unaudited information on our income tax policies, including our reserves for income taxes, see “Our Critical Accounting Policies” in Management’s Discussion and Analysis of Financial Condition and Results of Operations.
Reserves
A number of years may elapse before a particular matter, for which we have established a reserve, is audited and finally resolved. The number of years with open tax audits varies depending on the tax jurisdiction. Our major taxing jurisdictions and the related open tax audits are as follows:
| | • | | U.S. – continue to dispute one matter related to tax years 1998 through 2002. During 2010, all but three issues were resolved for tax years 2003 through 2005. These three issues are currently under review by the IRS Appeals Division. Our U.S. tax returns for the years 2006 through 2007 are currently under audit; |
| | • | | Mexico – audits have been substantially completed for all taxable years through 2005; |
| | • | | United Kingdom – audits have been completed for all taxable years prior to 2008; and |
| | • | | Canada – domestic audits have been substantially completed for all taxable years through 2007. International audits have been completed for all taxable years through 2003. |
While it is often difficult to predict the final outcome or the timing of resolution of any particular tax matter, we believe that our reserves reflect the probable outcome of known tax contingencies. We adjust these reserves, as well as the related interest, in light of changing facts and circumstances. Settlement of any particular issue would usually require the use of cash. Favorable resolution would be recognized as a reduction to our annual tax rate in the year of resolution. For further unaudited information on the impact of the resolution of open tax issues, see “Other Consolidated Results.”
74
As of December 25, 2010, the total gross amount of reserves for income taxes, reported in other liabilities, was $2,023 million. Any prospective adjustments to these reserves will be recorded as an increase or decrease to our provision for income taxes and would impact our effective tax rate. In addition, we accrue interest related to reserves for income taxes in our provision for income taxes and any associated penalties are recorded in selling, general and administrative expenses. The gross amount of interest accrued, reported in other liabilities, was $570 million as of December 25, 2010, of which $135 million was recognized in 2010.The gross amount of interest accrued was $461 million as of December 26, 2009, of which $30 million was recognized in 2009.
A rollforward of our reserves for all federal, state and foreign tax jurisdictions, is as follows:
| | | | | | | | |
| | | 2010 | | | 2009 | |
Balance, beginning of year | | $ | 1,731 | | | $ | 1,711 | |
Additions for tax positions related to the current year | | | 204 | | | | 238 | |
Additions for tax positions from prior years | | | 517 | | | | 79 | |
Reductions for tax positions from prior years | | | (391 | ) | | | (236 | ) |
Settlement payments | | | (30 | ) | | | (64 | ) |
Statute of limitations expiration | | | (7 | ) | | | (4 | ) |
Translation and other | | | (2 | ) | | | 7 | |
| | | | | | | | |
Balance, end of year | | $ | 2,022 | (a) | | $ | 1,731 | |
| | | | | | | | |
| (a) | Includes amounts related to our acquisitions of PBG and PAS. |
Carryforwards and Allowances
Operating loss carryforwards totaling $9.1 billion at year-end 2010 are being carried forward in a number of foreign and state jurisdictions where we are permitted to use tax operating losses from prior periods to reduce future taxable income. These operating losses will expire as follows: $0.4 billion in 2011, $6.5 billion between 2012 and 2030 and $2.2 billion may be carried forward indefinitely. We establish valuation allowances for our deferred tax assets if, based on the available evidence, it is more likely than not that some portion or all of the deferred tax assets will not be realized.
Undistributed International Earnings
As of December 25, 2010, we had approximately $26.6 billion of undistributed international earnings. We intend to continue to reinvest earnings outside the U.S. for the foreseeable future and, therefore, have not recognized any U.S. tax expense on these earnings.
75
Note 6 — Stock-Based Compensation
Our stock-based compensation program is designed to attract and retain employees while also aligning employees’ interests with the interests of our shareholders. Stock options and restricted stock units (RSU) are granted to employees under the shareholder-approved 2007 Long-Term Incentive Plan (LTIP), the only stock-based plan under which we currently grant stock options and RSUs. Stock-based compensation expense was $352 million in 2010, $227 million in 2009 and $238 million in 2008. In 2010, $299 million was recorded as stock-based compensation expense and $53 million was included in merger and integration charges. $86 million of the $352 million recorded in 2010 was related to the unvested acquisition-related grants described below. Income tax benefits related to stock-based compensation expense and recognized in earnings were $89 million in 2010, $67 million in 2009 and $71 million in 2008. At year-end 2010, 154 million shares were available for future stock-based compensation grants.
In connection with our acquisition of PBG, we issued 13.4 million stock options and 2.7 million RSUs at weighted-average grant prices of $42.89 and $62.30, respectively, to replace previously held PBG equity awards. In connection with our acquisition of PAS, we issued 0.4 million stock options at a weighted-average grant price of $31.72 to replace previously held PAS equity awards. Our equity issuances included 8.3 million stock options and 0.6 million RSUs which were vested at the acquisition date and were included in the purchase price. The remaining 5.5 million stock options and 2.1 million RSUs issued are unvested and are being amortized over their remaining vesting period, up to 3 years.
As a result of our annual benefits review in 2010, the Company approved certain changes to our benefits programs to remain market competitive relative to other leading global companies. These changes included ending the Company’s broad-based SharePower stock option program. Consequently, beginning in 2011, no new awards will be granted under the SharePower program. Outstanding SharePower awards from 2010 and earlier will continue to vest and be exercisable according to the terms and conditions of the program. See Note 7 for additional information regarding other related changes.
Method of Accounting and Our Assumptions
We account for our employee stock options under the fair value method of accounting using a Black-Scholes valuation model to measure stock option expense at the date of grant. All stock option grants have an exercise price equal to the fair market value of our common stock on the date of grant and generally have a 10-year term. We do not backdate, reprice or grant stock-based compensation awards retroactively. Repricing of awards would require shareholder approval under the LTIP.
The fair value of stock option grants is amortized to expense over the vesting period, generally three years. Executives who are awarded long-term incentives based on their performance are generally offered the choice of stock options or RSUs. Executives who elect RSUs receive one RSU for every four stock options that would have otherwise been granted. Senior officers do not have a choice and are granted 50% stock options and 50% performance-based RSUs. Vesting of RSU awards for senior officers is contingent upon the achievement of pre-established performance targets approved by the Compensation Committee of the Board of Directors. RSU expense is based on the fair value
76
of PepsiCo stock on the date of grant and is amortized over the vesting period, generally three years. Each RSU is settled in a share of our stock after the vesting period.
Our weighted-average Black-Scholes fair value assumptions are as follows:
| | | | | | | | | | | | |
| | | 2010 | | | 2009 | | | 2008 | |
Expected life | | | 5 yrs. | | | | 6 yrs. | | | | 6 yrs. | |
Risk-free interest rate | | | 2.3 | % | | | 2.8 | % | | | 3.0 | % |
Expected volatility | | | 17 | % | | | 17 | % | | | 16 | % |
Expected dividend yield | | | 2.8 | % | | | 3.0 | % | | | 1.9 | % |
The expected life is the period over which our employee groups are expected to hold their options. It is based on our historical experience with similar grants. The risk-free interest rate is based on the expected U.S. Treasury rate over the expected life. Volatility reflects movements in our stock price over the most recent historical period equivalent to the expected life. Dividend yield is estimated over the expected life based on our stated dividend policy and forecasts of net income, share repurchases and stock price.
A summary of our stock-based compensation activity for the year ended December 25, 2010 is presented below:
Our Stock Option Activity
| | | | | | | | | | | | | | | | |
| | | Options(a) | | | Average
Price(b) | | | Average
Life
(years)(c) | | | Aggregate
Intrinsic
Value(d) | |
Outstanding at December 26, 2009 | | | 106,011 | | | $ | 51.68 | | | | | | | | | |
Granted | | | 26,858 | | | | 54.09 | | | | | | | | | |
Exercised | | | (23,940 | ) | | | 43.47 | | | | | | | | | |
Forfeited/expired | | | (2,726 | ) | | | 55.85 | | | | | | | | | |
| | | | | | | | | | | | | | | | |
Outstanding at December 25, 2010 | | | 106,203 | | | $ | 54.03 | | | | 5.19 | | | $ | 1,281,596 | |
| | | | | | | | | | | | | | | | |
Exercisable at December 25, 2010 | | | 67,304 | | | $ | 50.26 | | | | 3.44 | | | $ | 1,040,510 | |
| (a) | Options are in thousands and include options previously granted under PBG, PAS and Quaker plans. No additional options or shares may be granted under the PBG, PAS and Quaker plans. |
| (b) | Weighted-average exercise price. |
| (c) | Weighted-average contractual life remaining. |
77
Our RSU Activity
| | | | | | | | | | | | | | | | |
| | | RSUs(a) | | | Average
Intrinsic
Value(b) | | | Average
Life
(years)(c) | | | Aggregate
Intrinsic
Value(d) | |
Outstanding at December 26, 2009 | | | 6,092 | | | $ | 60.98 | | | | | | | | | |
Granted | | | 8,326 | | | | 65.01 | | | | | | | | | |
Converted | | | (3,183 | ) | | | 63.58 | | | | | | | | | |
Forfeited/expired | | | (573 | ) | | | 62.50 | | | | | | | | | |
| | | | | | | | | | | | | | | | |
Outstanding at December 25, 2010 | | | 10,662 | | | $ | 63.27 | | | | 1.69 | | | $ | 700,397 | |
| | | | | | | | | | | | | | | | |
| (a) | RSUs are in thousands and include RSUs previously granted under a PBG plan. No additional RSUs or shares may be granted under the PBG plan. |
| (b) | Weighted-average intrinsic value at grant date. |
| (c) | Weighted-average contractual life remaining. |
Other Stock-Based Compensation Data
| | | | | | | | | | | | |
| | | 2010 | | | 2009 | | | 2008 | |
Stock Options | | | | | | | | | | | | |
Weighted-average fair value of options granted | | $ | 13.93 | | | $ | 7.02 | | | $ | 11.24 | |
Total intrinsic value of options exercised(a) | | $ | 502,354 | | | $ | 194,545 | | | $ | 410,152 | |
RSUs | | | | | | | | | | | | |
Total number of RSUs granted(a) | | | 8,326 | | | | 2,653 | | | | 2,135 | |
Weighted-average intrinsic value of RSUs granted | | $ | 65.01 | | | $ | 53.22 | | | $ | 68.73 | |
Total intrinsic value of RSUs converted(a) | | $ | 202,717 | | | $ | 124,193 | | | $ | 180,563 | |
As of December 25, 2010, there was $423 million of total unrecognized compensation cost related to nonvested share-based compensation grants. This unrecognized compensation is expected to be recognized over a weighted-average period of 2 years.
Note 7 — Pension, Retiree Medical and Savings Plans
Our pension plans cover full-time employees in the U.S. and certain international employees. Benefits are determined based on either years of service or a combination of years of service and earnings. U.S. and Canada retirees are also eligible for medical and life insurance benefits (retiree medical) if they meet age and service requirements. Generally, our share of retiree medical costs is capped at specified dollar amounts, which vary based upon years of service, with retirees contributing the remainder of the costs.
78
Gains and losses resulting from actual experience differing from our assumptions, including the difference between the actual return on plan assets and the expected return on plan assets, and from changes in our assumptions are also determined at each measurement date. If this net accumulated gain or loss exceeds 10% of the greater of the market-related value of plan assets or plan liabilities, a portion of the net gain or loss is included in expense for the following year based upon the average remaining service period of active plan participants, which is approximately 11 years for pension expense and approximately 8 years for retiree medical expense. The cost or benefit of plan changes that increase or decrease benefits for prior employee service (prior service cost/(credit)) is included in earnings on a straight-line basis over the average remaining service period of active plan participants.
In connection with our acquisitions of PBG and PAS, we assumed sponsorship of pension and retiree medical plans that provide benefits to U.S. and certain international employees. Subsequently, during the third quarter of 2010, we merged the pension plan assets of the legacy PBG and PAS U.S. pension plans with those of PepsiCo into one master trust.
During 2010, the Compensation Committee of PepsiCo’s Board of Directors approved certain changes to the U.S. pension and retiree medical plans, effective January 1, 2011. Pension plan design changes include implementing a new employer contribution to the 401(k) savings plan for all future salaried new hires of the Company, as salaried new hires are no longer eligible to participate in the defined benefit pension plan, as well as implementing a new defined benefit pension formula for certain hourly new hires of the Company. Pension plan design changes also include implementing a new employer contribution to the 401(k) savings plan for certain legacy PBG and PAS salaried employees (as such employees are also not eligible to participate in the defined benefit pension plan), as well as implementing a new defined benefit pension formula for certain legacy PBG and PAS hourly employees. The retiree medical plan design change includes phasing out Company subsidies of retiree medical benefits.
As a result of these changes, we remeasured our pension and retiree medical expenses and liabilities in the third quarter of 2010, which resulted in a one-time pre-tax curtailment gain of $62 million included in retiree medical expense.
The provisions of both the PPACA and the Health Care and Education Reconciliation Act are reflected in our retiree medical expenses and liabilities and were not material to our financial statements.
79
Selected financial information for our pension and retiree medical plans is as follows:
| | | | | | | | | | | | | | | | | | | | | | | | |
| | | Pension | | | Retiree Medical | |
| | | 2010 | | | 2009 | | | 2010 | | | 2009 | | | 2010 | | | 2009 | |
| | | U.S. | | | International | | | | | | | |
Change in projected benefit liability | | | | | | | | | | | | | | | | | | | | | | | | |
Liability at beginning of year | | $ | 6,606 | | | $ | 6,217 | | | $ | 1,709 | | | $ | 1,270 | | | $ | 1,359 | | | $ | 1,370 | |
Acquisitions | | | 2,161 | | | | — | | | | 90 | | | | — | | | | 396 | | | | — | |
Service cost | | | 299 | | | | 238 | | | | 81 | | | | 54 | | | | 54 | | | | 44 | |
Interest cost | | | 506 | | | | 373 | | | | 106 | | | | 82 | | | | 93 | | | | 82 | |
Plan amendments | | | 28 | | | | — | | | | — | | | | — | | | | (132 | ) | | | — | |
Participant contributions | | | — | | | | — | | | | 3 | | | | 10 | | | | — | | | | — | |
Experience loss/(gain) | | | 583 | | | | 70 | | | | 213 | | | | 221 | | | | 95 | | | | (63 | ) |
Benefit payments | | | (375 | ) | | | (296 | ) | | | (69 | ) | | | (50 | ) | | | (100 | ) | | | (80 | ) |
Settlement/curtailment gain | | | (2 | ) | | | — | | | | (3 | ) | | | (8 | ) | | | — | | | | — | |
Special termination benefits | | | 45 | | | | — | | | | 3 | | | | — | | | | 3 | | | | — | |
Foreign currency adjustment | | | — | | | | — | | | | (18 | ) | | | 130 | | | | 2 | | | | 6 | |
Other | | | — | | | | 4 | | | | 27 | | | | — | | | | — | | | | — | |
| | | | | | | | | | | | | | | | | | | | | | | | |
Liability at end of year | | $ | 9,851 | | | $ | 6,606 | | | $ | 2,142 | | | $ | 1,709 | | | $ | 1,770 | | | $ | 1,359 | |
| | | | | | | | | | | | | | | | | | | | | | | | |
Change in fair value of plan assets | | | | | | | | | | | | | | | | | | | | | | | | |
Fair value at beginning of year | | $ | 5,420 | | | $ | 3,974 | | | $ | 1,561 | | | $ | 1,165 | | | $ | 13 | | | $ | — | |
Acquisitions | | | 1,633 | | | | — | | | | 52 | | | | — | | | | — | | | | — | |
Actual return on plan assets | | | 943 | | | | 697 | | | | 164 | | | | 159 | | | | 7 | | | | 2 | |
Employer contributions/funding | | | 1,249 | | | | 1,041 | | | | 215 | | | | 167 | | | | 270 | | | | 91 | |
Participant contributions | | | — | | | | — | | | | 3 | | | | 10 | | | | — | | | | — | |
Benefit payments | | | (375 | ) | | | (296 | ) | | | (69 | ) | | | (50 | ) | | | (100 | ) | | | (80 | ) |
Settlement | | | — | | | | — | | | | (2 | ) | | | (8 | ) | | | — | | | | — | |
Foreign currency adjustment | | | — | | | | — | | | | (28 | ) | | | 118 | | | | — | | | | — | |
Other | | | — | | | | 4 | | | | — | | | | — | | | | — | | | | — | |
| | | | | | | | | | | | | | | | | | | | | | | | |
Fair value at end of year | | $ | 8,870 | | | $ | 5,420 | | | $ | 1,896 | | | $ | 1,561 | | | $ | 190 | | | $ | 13 | |
| | | | | | | | | | | | | | | | | | | | | | | | |
Funded status | | $ | (981 | ) | | $ | (1,186 | ) | | $ | (246 | ) | | $ | (148 | ) | | $ | (1,580 | ) | | $ | (1,346 | ) |
| | | | | | | | | | | | | | | | | | | | | | | | |
80
| | | | | | | | | | | | | | | | | | | | | | | | |
| | | Pension | | | Retiree Medical | |
| | | 2010 | | | 2009 | | | 2010 | | | 2009 | | | 2010 | | | 2009 | |
| | | U.S. | | | International | | | | | | | |
Amounts recognized | | | | | | | | | | | | | | | | | | | | | | | | |
Other assets | | $ | 47 | | | $ | — | | | $ | 66 | | | $ | 50 | | | $ | — | | | $ | — | |
Other current liabilities | | | (54 | ) | | | (36 | ) | | | (10 | ) | | | (1 | ) | | | (145 | ) | | | (105 | ) |
Other liabilities | | | (974 | ) | | | (1,150 | ) | | | (302 | ) | | | (197 | ) | | | (1,435 | ) | | | (1,241 | ) |
| | | | | | | | | | | | | | | | | | | | | | | | |
Net amount recognized | | $ | (981 | ) | | $ | (1,186 | ) | | $ | (246 | ) | | $ | (148 | ) | | $ | (1,580 | ) | | $ | (1,346 | ) |
| | | | | | | | | | | | | | | | | | | | | | | | |
Amounts included in accumulated other comprehensive loss (pre-tax) | |
Net loss | | $ | 2,726 | | | $ | 2,563 | | | $ | 767 | | | $ | 625 | | | $ | 270 | | | $ | 190 | |
Prior service cost/(credit) | | | 117 | | | | 101 | | | | 17 | | | | 20 | | | | (150 | ) | | | (102 | ) |
| | | | | | | | | | | | | | | | | | | | | | | | |
Total | | $ | 2,843 | | | $ | 2,664 | | | $ | 784 | | | $ | 645 | | | $ | 120 | | | $ | 88 | |
| | | | | | | | | | | | | | | | | | | | | | | | |
Components of the increase/(decrease) in net loss | |
Change in discount rate | | $ | 556 | | | $ | 47 | | | $ | 213 | | | $ | 97 | | | $ | 101 | | | $ | 11 | |
Employee-related assumption changes | | | 4 | | | | — | | | | (4 | ) | | | 70 | | | | 8 | | | | (38 | ) |
Liability-related experience different from assumptions | | | 43 | | | | 23 | | | | 5 | | | | 51 | | | | (22 | ) | | | (36 | ) |
Actual asset return different from expected return | | | (300 | ) | | | (235 | ) | | | (41 | ) | | | (54 | ) | | | (6 | ) | | | (2 | ) |
Amortization of losses | | | (119 | ) | | | (111 | ) | | | (24 | ) | | | (9 | ) | | | (9 | ) | | | (11 | ) |
Other, including foreign currency adjustments | | | (21 | ) | | | 13 | | | | (7 | ) | | | 49 | | | | 8 | | | | — | |
| | | | | | | | | | | | | | | | | | | | | | | | |
Total | | $ | 163 | | | $ | (263 | ) | | $ | 142 | | | $ | 204 | | | $ | 80 | | | $ | (76 | ) |
| | | | | | | | | | | | | | | | | | | | | | | | |
Liability at end of year for service to date | | $ | 9,163 | | | $ | 5,784 | | | $ | 1,743 | | | $ | 1,414 | | | | | | | | | |
The components of benefit expense are as follows:
| | | | | | | | | | | | | | | | | | | | | | | | | | | | | | | | | | | | |
| | | Pension | | | Retiree Medical | |
| | | 2010 | | | 2009 | | | 2008 | | | 2010 | | | 2009 | | | 2008 | | | 2010 | | | 2009 | | | 2008 | |
| | | U.S. | | | International | | | | | | | | | | |
Components of benefit expense | | | | | | | | | | | | | | | | | | | | | | | | | | | | | | | | | | | | |
Service cost | | $ | 299 | | | $ | 238 | | | $ | 244 | | | $ | 81 | | | $ | 54 | | | $ | 61 | | | $ | 54 | | | $ | 44 | | | $ | 45 | |
Interest cost | | | 506 | | | | 373 | | | | 371 | | | | 106 | | | | 82 | | | | 88 | | | | 93 | | | | 82 | | | | 82 | |
Expected return on plan assets | | | (643 | ) | | | (462 | ) | | | (416 | ) | | | (123 | ) | | | (105 | ) | | | (112 | ) | | | (1 | ) | | | — | | | | — | |
Amortization of prior service cost/(credit) | | | 12 | | | | 12 | | | | 19 | | | | 2 | | | | 2 | | | | 3 | | | | (22 | ) | | | (17 | ) | | | (13 | ) |
Amortization of net loss | | | 119 | | | | 110 | | | | 55 | | | | 24 | | | | 9 | | | | 19 | | | | 9 | | | | 11 | | | | 7 | |
| | | | | | | | | | | | | | | | | | | | | | | | | | | | | | | | | | | | |
| | | 293 | | | | 271 | | | | 273 | | | | 90 | | | | 42 | | | | 59 | | | | 133 | | | | 120 | | | | 121 | |
Settlement/curtailment (gain)/loss | | | (2 | ) | | | (13 | ) | | | 3 | | | | 1 | | | | 3 | | | | 3 | | | | (62 | ) | | | — | | | | — | |
Special termination benefits | | | 45 | | | | — | | | | 31 | | | | 3 | | | | — | | | | 2 | | | | 3 | | | | — | | | | 3 | |
| | | | | | | | | | | | | | | | | | | | | | | | | | | | | | | | | | | | |
Total | | $ | 336 | | | $ | 258 | | | $ | 307 | | | $ | 94 | | | $ | 45 | | | $ | 64 | | | $ | 74 | | | $ | 120 | | | $ | 124 | |
| | | | | | | | | | | | | | | | | | | | | | | | | | | | | | | | | | | | |
81
The estimated amounts to be amortized from accumulated other comprehensive loss into benefit expense in 2011 for our pension and retiree medical plans are as follows:
| | | | | | | | | | | | |
| | | Pension | | | Retiree Medical | |
| | | U.S. | | | International | | | | |
Net loss | | $ | 144 | | | $ | 39 | | | $ | 12 | |
Prior service cost/(credit) | | | 15 | | | | 2 | | | | (28 | ) |
| | | | | | | | | | | | |
Total | | $ | 159 | | | $ | 41 | | | $ | (16 | ) |
| | | | | | | | | | | | |
The following table provides the weighted-average assumptions used to determine projected benefit liability and benefit expense for our pension and retiree medical plans:
| | | | | | | | | | | | | | | | | | | | | | | | | | | | | | | | | | | | |
| | | Pension | | | Retiree Medical | |
| | | 2010 | | | 2009 | | | 2008 | | | 2010 | | | 2009 | | | 2008 | | | 2010 | | | 2009 | | | 2008 | |
| | | U.S. | | | International | | | | | | | | | | |
Weighted-average assumptions | | | | | | | | | | | | | | | | | | | | | | | | | | | | | | | | | | | | |
Liability discount rate | | | 5.7 | % | | | 6.1 | % | | | 6.2 | % | | | 5.5 | % | | | 5.9 | % | | | 6.3 | % | | | 5.2 | % | | | 6.1 | % | | | 6.2 | % |
Expense discount rate | | | 6.0 | % | | | 6.2 | % | | | 6.5 | % | | | 6.0 | % | | | 6.3 | % | | | 5.6 | % | | | 5.8 | % | | | 6.2 | % | | | 6.5 | % |
Expected return on plan assets | | | 7.8 | % | | | 7.8 | % | | | 7.8 | % | | | 7.1 | % | | | 7.1 | % | | | 7.2 | % | | | 7.8 | % | | | | | | | | |
Liability rate of salary increases | | | 4.1 | % | | | 4.4 | % | | | 4.4 | % | | | 4.1 | % | | | 4.1 | % | | | 4.1 | % | | | | | | | | | | | | |
Expense rate of salary increases | | | 4.4 | % | | | 4.4 | % | | | 4.6 | % | | | 4.1 | % | | | 4.2 | % | | | 3.9 | % | | | | | | | | | | | | |
The following table provides selected information about plans with liability for service to date and total benefit liability in excess of plan assets:
| | | | | | | | | | | | | | | | | | | | | | | | |
| | | Pension | | | Retiree Medical | |
| | | 2010 | | | 2009 | | | 2010 | | | 2009 | | | 2010 | | | 2009 | |
| | | U.S. | | | International | | | | | | | |
Selected information for plans with liability for service to date in excess of plan assets | |
Liability for service to date | | $ | (525 | ) | | $ | (2,695 | ) | | $ | (610 | ) | | $ | (342 | ) | | | | | | | | |
Fair value of plan assets | | $ | — | | | $ | 2,220 | | | $ | 474 | | | $ | 309 | | | | | | | | | |
Selected information for plans with projected benefit liability in excess of plan assets | |
Benefit liability | | $ | (5,806 | ) | | $ | (6,603 | ) | | $ | (1,949 | ) | | $ | (1,566 | ) | | $ | (1,770 | ) | | $ | (1,359 | ) |
Fair value of plan assets | | $ | 4,778 | | | $ | 5,417 | | | $ | 1,638 | | | $ | 1,368 | | | $ | 190 | | | $ | 13 | |
Of the total projected pension benefit liability at year-end 2010, $747 million relates to plans that we do not fund because the funding of such plans does not receive favorable tax treatment.
82
Future Benefit Payments and Funding
Our estimated future benefit payments are as follows:
| | | | | | | | | | | | | | | | | | | | | | | | |
| | | 2011 | | | 2012 | | | 2013 | | | 2014 | | | 2015 | | | 2016-20 | |
Pension | | $ | 480 | | | $ | 500 | | | $ | 520 | | | $ | 560 | | | $ | 595 | | | $ | 3,770 | |
Retiree medical(a) | | $ | 155 | | | $ | 155 | | | $ | 160 | | | $ | 165 | | | $ | 170 | | | $ | 875 | |
| (a) | Expected future benefit payments for our retiree medical plans do not reflect any estimated subsidies expected to be received under the 2003 Medicare Act. Subsidies are expected to be approximately $11 million for each of the years from 2011 through 2015 and approximately $90 million in total for 2016 through 2020. |
These future benefits to beneficiaries include payments from both funded and unfunded pension plans.
In 2011, we expect to make pension contributions of approximately $160 million, with up to approximately $15 million expected to be discretionary. Our net cash payments for retiree medical are estimated to be approximately $145 million in 2011.
Plan Assets
Pension
Our pension plan investment strategy includes the use of actively managed securities and is reviewed annually based upon plan liabilities, an evaluation of market conditions, tolerance for risk and cash requirements for benefit payments. Our investment objective is to ensure that funds are available to meet the plans’ benefit obligations when they become due. Our overall investment strategy is to prudently invest plan assets in a well-diversified portfolio of equity and high-quality debt securities to achieve our long-term return expectations. Our investment policy also permits the use of derivative instruments which are primarily used to reduce risk. Our expected long-term rate of return on U.S. plan assets is 7.8%. Our target investment allocation is 40% for U.S. equity allocations, 20% for international equity allocations and 40% for fixed income allocations. Actual investment allocations may vary from our target investment allocations due to prevailing market conditions. We regularly review our actual investment allocations and periodically rebalance our investments to our target allocations. In an effort to enhance diversification, the pension plan divested its holdings of PepsiCo stock in the fourth quarter of 2010.
The expected return on pension plan assets is based on our pension plan investment strategy, our expectations for long-term rates of return by asset class, taking into account volatilities and correlation among asset classes, and our historical experience. We also review current levels of interest rates and inflation to assess the reasonableness of the long-term rates. We evaluate our expected return assumptions annually to ensure that they are reasonable. To calculate the expected return on pension plan assets, we use a market-related valuation method that recognizes investment gains or losses (the difference between the expected and actual return based on the market-related value of assets) for securities included in our equity strategies over a five-year period. This has the effect of reducing year-to-year volatility. For all other asset categories, the actual fair value is used for the market-related value of assets.
83
Retiree Medical
In 2010, we made nondiscretionary contributions of $100 million to fund the payment of U.S. retiree medical claims. During the fourth quarter of 2010, we made a discretionary contribution of $170 million to fund future U.S. retiree medical plan benefits. This contribution was invested consistent with the allocation of existing assets in the U.S. pension plan.
Fair Value
The guidance on fair value measurements defines fair value, establishes a framework for measuring fair value, and expands disclosures about fair value measurements. The fair value framework requires the categorization of assets and liabilities into three levels based upon the assumptions (inputs) used to price the assets. Level 1 provides the most reliable measure of fair value, whereas Level 3 generally requires significant management judgment.
84
Plan assets measured at fair value as of fiscal year-end 2010 and 2009 are categorized consistently by level in both years, and are as follows:
| | | | | | | | | | | | | | | | | | | | |
| | | 2010* | | | 2009 | |
| | | Total | | | Level 1 | | | Level 2 | | | Level 3 | | | Total | |
U.S. plan assets | | | | | | | | | | | | | | | | | | | | |
Equity securities: | | | | | | | | | | | | | | | | | | | | |
PepsiCo common stock(a) | | $ | — | | | $ | — | | | $ | — | | | $ | — | | | $ | 332 | |
U.S. common stock(a) | | | 304 | | | | 304 | | | | — | | | | — | | | | 229 | |
U.S. commingled funds(b) | | | 3,426 | | | | — | | | | 3,426 | | | | — | | | | 1,387 | |
International common stock(a) | | | 834 | | | | 834 | | | | — | | | | — | | | | 700 | |
International commingled fund(c) | | | 992 | | | | — | | | | 992 | | | | — | | | | 114 | |
Preferred stock(d) | | | 4 | | | | — | | | | 4 | | | | — | | | | 4 | |
Fixed income securities: | | | | | | | | | | | | | | | | | | | | |
Government securities(d) | | | 950 | | | | — | | | | 950 | | | | — | | | | 741 | |
Corporate bonds(d) | | | 2,374 | | | | — | | | | 2,374 | | | | — | | | | 1,214 | |
Mortgage-backed securities(d) | | | 20 | | | | — | | | | 20 | | | | — | | | | 201 | |
Other: | | | | | | | | | | | | | | | | | | | | |
Contracts with insurance companies(f) | | | 28 | | | | — | | | | — | | | | 28 | | | | 9 | |
Cash and cash equivalents | | | 81 | | | | 81 | | | | — | | | | — | | | | 457 | |
| | | | | | | | | | | | | | | | | | | | |
Sub-total U.S. plan assets | | | 9,013 | | | $ | 1,219 | | | $ | 7,766 | | | $ | 28 | | | | 5,388 | |
| | | | | | | | | | | | | | | | | | | | |
Dividends and interest receivable | | | 47 | | | | | | | | | | | | | | | | 32 | |
| | | | | | | | | | | | | | | | | | | | |
Total U.S. plan assets | | $ | 9,060 | | | | | | | | | | | | | | | $ | 5,420 | |
| | | | | | | | | | | | | | | | | | | | |
International plan assets | | | | | | | | | | | | | | | | | | | | |
Equity securities: | | | | | | | | | | | | | | | | | | | | |
U.S. commingled funds(b) | | $ | 193 | | | $ | — | | | $ | 193 | | | $ | — | | | $ | 180 | |
International commingled funds(c) | | | 779 | | | | — | | | | 779 | | | | — | | | | 661 | |
Fixed income securities: | | | | | | | | | | | | | | | | | | | | |
Government securities(d) | | | 184 | | | | — | | | | 184 | | | | — | | | | 139 | |
Corporate bonds(d) | | | 152 | | | | — | | | | 152 | | | | — | | | | 128 | |
Fixed income commingled funds(e) | | | 393 | | | | — | | | | 393 | | | | — | | | | 363 | |
Other: | | | | | | | | | | | | | | | | | | | | |
Contracts with insurance companies(f) | | | 28 | | | | — | | | | — | | | | 28 | | | | 29 | |
Currency commingled funds(g) | | | 42 | | | | — | | | | 42 | | | | — | | | | 44 | |
Cash and cash equivalents | | | 120 | | | | 120 | | | | — | | | | — | | | | 17 | |
| | | | | | | | | | | | | | | | | | | | |
Sub-total international plan assets | | | 1,891 | | | $ | 120 | | | $ | 1,743 | | | $ | 28 | | | | 1,561 | |
| | | | | | | | | | | | | | | | | | | | |
Dividends and interest receivable | | | 5 | | | | | | | | | | | | | | | | — | |
| | | | | | | | | | | | | | | | | | | | |
Total international plan assets | | $ | 1,896 | | | | | | | | | | | | | | | $ | 1,561 | |
| | | | | | | | | | | | | | | | | | | | |
| (a) | Based on quoted market prices in active markets. |
| (b) | Based on the fair value of the investments owned by these funds that track various U.S. large, mid-cap and small company indices. Includes one large-cap fund that represents 32% and 25%, respectively, of total U.S. plan assets for 2010 and 2009. |
| (c) | Based on the fair value of the investments owned by these funds that track various non-U.S. equity indices. |
| (d) | Based on quoted bid prices for comparable securities in the marketplace and broker/dealer quotes that are not observable. Corporate bonds of U.S.-based companies represent 22% and 18%, respectively, of total U.S. plan assets for 2010 and 2009. |
| (e) | Based on the fair value of the investments owned by these funds that track various government and corporate bond indices. |
| (f) | Based on the fair value of the contracts as determined by the insurance companies using inputs that are not observable. |
| (g) | Based on the fair value of the investments owned by these funds. Includes managed hedge funds that invest primarily in derivatives to reduce currency exposure. |
| * | 2010 amounts include $190 million of retiree medical plan assets that are restricted for purposes of providing health benefits for U.S. retirees and their beneficiaries. |
85
Retiree Medical Cost Trend Rates
An average increase of 7% in the cost of covered retiree medical benefits is assumed for 2011. This average increase is then projected to decline gradually to 5% in 2020 and thereafter. These assumed health care cost trend rates have an impact on the retiree medical plan expense and liability. However, the cap on our share of retiree medical costs limits the impact. In addition, beginning January 1, 2011, the Company will start phasing out company subsidies of retiree medical benefits. A 1-percentage-point change in the assumed health care trend rate would have the following effects:
| | | | | | | | |
| | | 1%
Increase | | | 1%
Decrease | |
2010 service and interest cost components | | $ | 5 | | | $ | (4 | ) |
2010 benefit liability | | $ | 42 | | | $ | (50 | ) |
Savings Plan
Our U.S. employees are eligible to participate in 401(k) savings plans, which are voluntary defined contribution plans. The plans are designed to help employees accumulate additional savings for retirement, and we make company matching contributions on a portion of eligible pay based on years of service. In 2010, in connection with our acquisitions of PBG and PAS, we also made company retirement contributions for certain employees on a portion of eligible pay based on years of service. In 2010 and 2009, our total contributions were $135 million and $72 million, respectively.
Beginning January 1, 2011, a new employer contribution to the 401(k) savings plan will become effective for certain eligible legacy PBG and PAS salaried employees as well as all future eligible salaried new hires of PepsiCo who are not eligible to participate in the defined benefit pension plan as a result of plan design changes approved during 2010.
For additional unaudited information on our pension and retiree medical plans and related accounting policies and assumptions, see “Our Critical Accounting Policies” in Management’s Discussion and Analysis.
Note 8 — Noncontrolled Bottling Affiliates
On February 26, 2010, we completed our acquisitions of PBG and PAS, at which time we gained control over their operations and began to consolidate their results. See Note 1. Prior to these acquisitions, PBG and PAS represented our most significant noncontrolled bottling affiliates. Sales to PBG in 2010 (prior to the acquisition date) represented less than 1% of our total net revenue in 2010, 6% of our total net revenue in 2009 and 7% of our total net revenue in 2008.
See Note 15 for additional information regarding our acquisitions of PBG and PAS.
86
The Pepsi Bottling Group
In addition to approximately 32% of PBG’s outstanding common stock that we owned at year-end 2009, we owned 100% of PBG’s class B common stock and approximately 7% of the equity of Bottling Group, LLC, PBG’s principal operating subsidiary.
PBG’s summarized financial information is as follows:
| | | | | | | | |
| | | 2009 | | | 2008 | |
Current assets | | $ | 3,412 | | | | | |
Noncurrent assets | | | 10,158 | | | | | |
| | | | | | | | |
Total assets | | $ | 13,570 | | | | | |
| | | | | | | | |
Current liabilities | | $ | 1,965 | | | | | |
Noncurrent liabilities | | | 7,896 | | | | | |
| | | | | | | | |
Total liabilities | | $ | 9,861 | | | | | |
| | | | | | | | |
Our investment | | $ | 1,775 | | | | | |
| | | | | | | | |
Net revenue | | $ | 13,219 | | | $ | 13,796 | |
Gross profit | | $ | 5,840 | | | $ | 6,210 | |
Operating income | | $ | 1,048 | | | $ | 649 | |
Net income attributable to PBG | | $ | 612 | | | $ | 162 | |
Our investment in PBG, which included the related goodwill, was $463 million higher than our ownership interest in their net assets less noncontrolling interests at year-end 2009.
During 2008, together with PBG, we jointly acquired Russia’s leading branded juice company, Lebedyansky. See Note 14 for further information on this acquisition.
PepsiAmericas
At year-end 2009, we owned approximately 43% of the outstanding common stock of PAS.
PAS’s summarized financial information is as follows:
| | | | | | | | |
| | | 2009 | | | 2008 | |
Current assets | | $ | 952 | | | | | |
Noncurrent assets | | | 4,141 | | | | | |
| | | | | | | | |
Total assets | | $ | 5,093 | | | | | |
| | | | | | | | |
Current liabilities | | $ | 669 | | | | | |
Noncurrent liabilities | | | 2,493 | | | | | |
| | | | | | | | |
Total liabilities | | $ | 3,162 | | | | | |
| | | | | | | | |
Our investment | | $ | 1,071 | | | | | |
| | | | | | | | |
Net revenue | | $ | 4,421 | | | $ | 4,937 | |
Gross profit | | $ | 1,767 | | | $ | 1,982 | |
Operating income | | $ | 381 | | | $ | 473 | |
Net income attributable to PAS | | $ | 181 | | | $ | 226 | |
87
Our investment in PAS, which included the related goodwill, was $322 million higher than our ownership interest in their net assets less noncontrolling interests at year-end 2009.
Related Party Transactions
Our significant related party transactions are with our noncontrolled bottling affiliates, including PBG and PAS prior to our acquisitions on February 26, 2010. All such amounts are settled on terms consistent with other trade receivables and payables. The transactions primarily consist of (1) selling concentrate to these affiliates, which they use in the production of CSDs and non-carbonated beverages, (2) selling certain finished goods to these affiliates, (3) receiving royalties for the use of our trademarks for certain products and (4) paying these affiliates to act as our manufacturing and distribution agent for product associated with our national account fountain customers. Sales of concentrate and finished goods are reported net of bottler funding. For further unaudited information on these bottlers, see “Our Customers” in Management’s Discussion and Analysis of Financial Condition and Results of Operations. These transactions with our bottling affiliates are reflected in our consolidated financial statements as follows:
| | | | | | | | | | | | |
| | | 2010 (a) | | | 2009 | | | 2008 | |
Net revenue | | $ | 993 | | | $ | 3,922 | | | $ | 4,049 | |
Cost of sales | | $ | 116 | | | $ | 634 | | | $ | 660 | |
Selling, general and administrative expenses | | $ | 6 | | | $ | 24 | | | $ | 30 | |
Accounts and notes receivable | | $ | 27 | | | $ | 254 | | | $ | 248 | |
Accounts payable and other liabilities | | $ | 42 | | | $ | 285 | | | $ | 198 | |
| (a) | Includes transactions with PBG and PAS in 2010 prior to the date of acquisition. 2010 balance sheet information for PBG and PAS is not applicable as we consolidated their balance sheets at the date of acquisition. |
We also coordinate, on an aggregate basis, the contract negotiations of sweeteners and other raw material requirements, including aluminum cans and plastic bottles and closures for certain of our independent bottlers. Once we have negotiated the contracts, the bottlers order and take delivery directly from the supplier and pay the suppliers directly. Consequently, these transactions are not reflected in our consolidated financial statements. As the contracting party, we could be liable to these suppliers in the event of any nonpayment by our bottlers, but we consider this exposure to be remote.
In addition, our joint ventures with Unilever (under the Lipton brand name) and Starbucks sell finished goods (ready-to-drink teas, coffees and water products) to our noncontrolled bottling affiliates. Consistent with accounting for equity method investments, our joint venture revenue is not included in our consolidated net revenue and therefore is not included in the above table.
In 2010, we repurchased $357 million (5.5 million shares) of PepsiCo stock from the Master Trust which holds assets of PepsiCo’s U.S. qualified pension plans at market value. See Note 7.
88
Note 9 — Debt Obligations and Commitments
| | | | | | | | |
| | | 2010 | | | 2009 | |
Short-term debt obligations | | | | | | | | |
Current maturities of long-term debt | | $ | 113 | | | $ | 102 | |
Commercial paper (0.2%) | | | 2,632 | | | | — | |
Notes due 2011 (4.4%) | | | 1,513 | | | | — | |
Other borrowings (5.3% and 6.7%) | | | 640 | | | | 362 | |
| | | | | | | | |
| | $ | 4,898 | | | $ | 464 | |
| | | | | | | | |
Long-term debt obligations | | | | | | | | |
Notes due 2012 (3.1% and 1.9%) | | $ | 2,437 | | | $ | 1,079 | |
Notes due 2013 (3.0% and 3.7%) | | | 2,110 | | | | 999 | |
Notes due 2014 (5.3% and 4.0%) | | | 2,888 | | | | 1,026 | |
Notes due 2015 (2.6%) | | | 1,617 | | | | — | |
Notes due 2016-2040 (4.9% and 5.4%) | | | 10,828 | | | | 4,056 | |
Zero coupon notes, due 2011-2012 (13.3%) | | | 136 | | | | 192 | |
Other, due 2011-2019 (4.8% and 8.4%) | | | 96 | | | | 150 | |
| | | | | | | | |
| | | 20,112 | | | | 7,502 | |
Less: current maturities of long-term debt obligations | | | (113 | ) | | | (102 | ) |
| | | | | | | | |
| | $ | 19,999 | | | $ | 7,400 | |
| | | | | | | | |
The interest rates in the above table reflect weighted-average rates at year-end.
In the first quarter of 2010, we issued $1.25 billion of floating rate notes maturing in 2011 which bear interest at a rate equal to the three-month London Inter-Bank Offered Rate (LIBOR) plus 3 basis points, $1.0 billion of 3.10% senior notes maturing in 2015, $1.0 billion of 4.50% senior notes maturing in 2020 and $1.0 billion of 5.50% senior notes maturing in 2040. A portion of the net proceeds from the issuance of these notes was used to finance our acquisitions of PBG and PAS and the remainder was used for general corporate purposes.
On February 26, 2010, in connection with the transactions contemplated by the PBG merger agreement, Pepsi-Cola Metropolitan Bottling Company, Inc. (Metro) assumed the due and punctual payment of the principal of (and premium, if any) and interest on PBG’s 7.00% senior notes due March 1, 2029 ($1 billion principal amount of which are outstanding). These notes are guaranteed by Bottling Group, LLC and PepsiCo.
On February 26, 2010, in connection with the transactions contemplated by the PAS merger agreement, Metro assumed the due and punctual payment of the principal of (and premium, if any) and interest on PAS’s 7.625% notes due 2015 ($9 million principal amount of which are outstanding), 7.29% notes due 2026 ($100 million principal amount of which are outstanding), 7.44% notes due 2026 ($25 million principal amount of which are outstanding), 4.50% notes due 2013 ($150 million principal amount of which are outstanding), 5.625% notes due 2011 ($250 million principal amount of which are outstanding), 5.75% notes due 2012 ($300 million principal amount of which are outstanding), 4.375% notes due 2014 ($350 million principal amount of which are outstanding), 4.875% notes due 2015 ($300 million principal amount of which are outstanding), 5.00% notes due 2017 ($250 million principal amount of which are outstanding) and 5.50% notes
89
due 2035 ($250 million principal amount of which are outstanding). These notes are guaranteed by PepsiCo.
On February 26, 2010, as a result of the transactions contemplated by the PBG merger agreement, Bottling Group, LLC became a wholly owned subsidiary of Metro. Bottling Group, LLC’s 4.625% senior notes due 2012 ($1 billion principal amount of which are outstanding), 4.125% senior notes due 2015 ($250 million principal amount of which are outstanding), 5.00% senior notes due 2013 ($400 million principal amount of which are outstanding), 5.50% senior notes due 2016 ($800 million principal amount of which are outstanding), 6.95% senior notes due 2014 ($1.3 billion principal amount of which are outstanding) and 5.125% senior notes due 2019 ($750 million principal amount of which are outstanding) are guaranteed by PepsiCo.
As of December 25, 2010, the long-term debt acquired from our anchor bottlers (including debt previously issued by PBG, Bottling Group, LLC and PAS) in connection with our acquisitions of PBG and PAS has a total face value of approximately $7,484 million (fair value of $8,472 million) with a weighted-average stated interest rate of 5.7%. This acquired debt has a remaining weighted-average maturity of 6.6 years. See Note 15.
In the third quarter of 2010, we entered into a $2,575 million 364-day unsecured revolving credit agreement which expires in June 2011. We may request renewal of this facility for an additional 364-day period or convert any amounts outstanding into a term loan for a period of up to one year, which would mature no later than June 2012. This agreement replaced our $1,975 million 364-day unsecured revolving credit agreement and a $540 million amended PAS credit facility and is in addition to our existing $2,000 million unsecured revolving credit agreement and the $1,080 million amended PBG credit facility, both of which expire in 2012. Funds borrowed under these agreements may be used for general corporate purposes, including but not limited to repayment of our outstanding commercial paper, working capital, capital investments and/or acquisitions. Borrowings under the amended PBG credit facility are guaranteed by PepsiCo. Our lines of credit remain unused as of December 25, 2010.
In the fourth quarter of 2010, we paid $672 million in a cash tender offer to repurchase $500 million (aggregate principal amount) of our 7.90% senior unsecured notes maturing in 2018. As a result of this debt repurchase, we recorded a $178 million charge to interest expense, primarily representing the premium paid in the tender offer.
In the fourth quarter of 2010, we issued $500 million of 0.875% senior unsecured notes maturing in 2013, $1.0 billion of 3.125% senior unsecured notes maturing in 2020 and $750 million of 4.875% senior unsecured notes maturing in 2040. A portion of the net proceeds from the issuance of these notes was used to finance the debt repurchase and the remainder was used for general corporate purposes.
In addition, as of December 25, 2010, $657 million of our debt related to borrowings from various lines of credit that are maintained for our international divisions. These lines of credit are subject to normal banking terms and conditions and are fully committed at least to the extent of our borrowings.
90
Long-Term Contractual Commitments(a)
| | | | | | | | | | | | | | | | | | | | |
| | | Payments Due by Period | |
| | | Total | | | 2011 | | | 2012 –
2013 | | | 2014 –
2015 | | | 2016 and
beyond | |
Long-term debt obligations(b) | | $ | 19,337 | | | $ | — | | | $ | 4,569 | | | $ | 4,322 | | | $ | 10,446 | |
Interest on debt obligations(c) | | | 7,746 | | | | 809 | | | | 1,480 | | | | 1,075 | | | | 4,382 | |
Operating leases | | | 1,676 | | | | 390 | | | | 543 | | | | 320 | | | | 423 | |
Purchasing commitments | | | 2,433 | | | | 765 | | | | 1,159 | | | | 481 | | | | 28 | |
Marketing commitments | | | 824 | | | | 294 | | | | 268 | | | | 151 | | | | 111 | |
| | | | | | | | | | | | | | | | | | | | |
| | $ | 32,016 | | | $ | 2,258 | | | $ | 8,019 | | | $ | 6,349 | | | $ | 15,390 | |
| | | | | | | | | | | | | | | | | | | | |
| (a) | Reflects non-cancelable commitments as of December 25, 2010 based on year-end foreign exchange rates and excludes any reserves for uncertain tax positions as we are unable to reasonably predict the ultimate amount or timing of settlement. |
| (b) | Excludes $662 million related to the fair value step-up of debt acquired in connection with our acquisitions of PBG and PAS, as well as $113 million related to current maturities of long-term debt. |
| (c) | Interest payments on floating-rate debt are estimated using interest rates effective as of December 25, 2010. |
Most long-term contractual commitments, except for our long-term debt obligations, are not recorded on our balance sheet. Non-cancelable operating leases primarily represent building leases. Non-cancelable purchasing commitments are primarily for packaging materials, oranges and orange juice. Non-cancelable marketing commitments are primarily for sports marketing. Bottler funding to independent bottlers is not reflected in our long-term contractual commitments as it is negotiated on an annual basis. Accrued liabilities for pension and retiree medical plans are not reflected in our long-term contractual commitments because they do not represent expected future cash outflows. See Note 7 for additional information regarding our pension and retiree medical obligations.
Off-Balance-Sheet Arrangements
It is not our business practice to enter into off-balance-sheet arrangements, other than in the normal course of business. See Note 8 regarding contracts related to certain of our bottlers.
See “Our Liquidity and Capital Resources” in Management’s Discussion and Analysis of Financial Condition and Results of Operations for further unaudited information on our borrowings.
Note 10 — Financial Instruments
We are exposed to market risks arising from adverse changes in:
| | • | | commodity prices, affecting the cost of our raw materials and energy, |
| | • | | foreign exchange risks, and |
In the normal course of business, we manage these risks through a variety of strategies, including the use of derivatives. Certain derivatives are designated as either cash flow or fair value hedges and qualify for hedge accounting treatment, while others do not qualify and are marked to market
91
through earnings. Cash flows from derivatives used to manage commodity, foreign exchange or interest risks are classified as operating activities. See “Our Business Risks” in Management’s Discussion and Analysis of Financial Condition and Results of Operations for further unaudited information on our business risks.
For cash flow hedges, changes in fair value are deferred in accumulated other comprehensive loss within common shareholders’ equity until the underlying hedged item is recognized in net income. For fair value hedges, changes in fair value are recognized immediately in earnings, consistent with the underlying hedged item. Hedging transactions are limited to an underlying exposure. As a result, any change in the value of our derivative instruments would be substantially offset by an opposite change in the value of the underlying hedged items. Hedging ineffectiveness and a net earnings impact occur when the change in the value of the hedge does not offset the change in the value of the underlying hedged item. Ineffectiveness of our hedges is not material. If the derivative instrument is terminated, we continue to defer the related gain or loss and then include it as a component of the cost of the underlying hedged item. Upon determination that the underlying hedged item will not be part of an actual transaction, we recognize the related gain or loss in net income immediately.
We also use derivatives that do not qualify for hedge accounting treatment. We account for such derivatives at market value with the resulting gains and losses reflected in our income statement. We do not use derivative instruments for trading or speculative purposes. We perform assessments of our counterparty credit risk regularly, including a review of credit ratings, credit default swap rates and potential nonperformance of the counterparty. Based on our most recent assessment of our counterparty credit risk, we consider this risk to be low. In addition, we enter into derivative contracts with a variety of financial institutions that we believe are creditworthy in order to reduce our concentration of credit risk and generally settle with these financial institutions on a net basis.
Commodity Prices
We are subject to commodity price risk because our ability to recover increased costs through higher pricing may be limited in the competitive environment in which we operate. This risk is managed through the use of fixed-price purchase orders, pricing agreements, geographic diversity and derivatives. We use derivatives, with terms of no more than three years, to economically hedge price fluctuations related to a portion of our anticipated commodity purchases, primarily for natural gas, diesel fuel and aluminum. For those derivatives that qualify for hedge accounting, any ineffectiveness is recorded immediately in corporate unallocated expenses. We classify both the earnings and cash flow impact from these derivatives consistent with the underlying hedged item. During the next 12 months, we expect to reclassify net gains of $12 million related to these hedges from accumulated other comprehensive loss into net income. Derivatives used to hedge commodity price risk that do not qualify for hedge accounting are marked to market each period and reflected in our income statement.
Our open commodity derivative contracts that qualify for hedge accounting had a face value of $590 million as of December 25, 2010 and $151 million as of December 26, 2009. These contracts resulted in net unrealized gains of $46 million as of December 25, 2010 and net unrealized losses of $29 million as of December 26, 2009.
92
Our open commodity derivative contracts that do not qualify for hedge accounting had a face value of $266 million as of December 25, 2010 and $231 million as of December 26, 2009. These contracts resulted in net gains of $26 million in 2010 and net losses of $57 million in 2009.
Foreign Exchange
Financial statements of foreign subsidiaries are translated into U.S. dollars using period-end exchange rates for assets and liabilities and weighted-average exchange rates for revenues and expenses. Adjustments resulting from translating net assets are reported as a separate component of accumulated other comprehensive loss within common shareholders’ equity as currency translation adjustment.
Our operations outside of the U.S. generate over 45% of our net revenue, with Mexico, Canada, Russia and the United Kingdom comprising approximately 20% of our net revenue. As a result, we are exposed to foreign currency risks. We also enter into derivatives, primarily forward contracts with terms of no more than two years, to manage our exposure to foreign currency transaction risk. Exchange rate gains or losses related to foreign currency transactions are recognized as transaction gains or losses in our income statement as incurred.
Our foreign currency derivatives had a total face value of $1.7 billion as of December 25, 2010 and $1.2 billion as of December 26, 2009. The contracts that qualify for hedge accounting resulted in net unrealized losses of $15 million as of December 25, 2010 and $20 million as of December 26, 2009. During the next 12 months, we expect to reclassify net losses of $14 million related to these hedges from accumulated other comprehensive loss into net income. The contracts that do not qualify for hedge accounting resulted in net losses of $6 million in 2010 and a net gain of $1 million in 2009. All losses and gains were offset by changes in the underlying hedged items, resulting in no net material impact on earnings.
Interest Rates
We centrally manage our debt and investment portfolios considering investment opportunities and risks, tax consequences and overall financing strategies. We use various interest rate derivative instruments including, but not limited to, interest rate swaps, cross-currency interest rate swaps, Treasury locks and swap locks to manage our overall interest expense and foreign exchange risk. These instruments effectively change the interest rate and currency of specific debt issuances. Certain of our fixed rate indebtedness has been swapped to floating rates. The notional amount, interest payment and maturity date of the interest rate and cross-currency swaps match the principal, interest payment and maturity date of the related debt. Our Treasury locks and swap locks are entered into to protect against unfavorable interest rate changes relating to forecasted debt transactions.
The notional amounts of the interest rate derivative instruments outstanding as of December 25, 2010 and December 26, 2009 were $9.23 billion and $5.75 billion, respectively. For those interest rate derivative instruments that qualify for cash flow hedge accounting, any ineffectiveness is recorded immediately. We classify both the earnings and cash flow impact from these interest rate derivative instruments consistent with the underlying hedged item. During the next 12 months, we expect to reclassify net losses of $13 million related to these hedges from accumulated other comprehensive loss into net income.
93
As of December 25, 2010, approximately 43% of total debt (including indebtedness acquired in our acquisitions of PBG and PAS), after the impact of the related interest rate derivative instruments, was exposed to variable rates compared to 57% as of December 26, 2009.
Fair Value Measurements
The fair values of our financial assets and liabilities as of December 25, 2010 and December 26, 2009 are categorized as follows:
| | | | | | | | | | | | | | | | |
| | | 2010 | | | 2009 | |
| | | Assets(a) | | | Liabilities(a) | | | Assets(a) | | | Liabilities(a) | |
Available-for-sale securities(b) | | $ | 636 | | | $ | — | | | $ | 71 | | | $ | — | |
Short-term investments – index funds(c) | | $ | 167 | | | $ | — | | | $ | 120 | | | $ | — | |
Deferred compensation(d) | | $ | — | | | $ | 559 | | | $ | — | | | $ | 461 | |
Derivatives designated as hedging instruments: | | | | | | | | | | | | | | | | |
Forward exchange contracts(e) | | $ | 8 | | | $ | 23 | | | $ | 11 | | | $ | 31 | |
Interest rate derivatives(f) | | | 284 | | | | 12 | | | | 177 | | | | 43 | |
Commodity contracts – other(g) | | | 70 | | | | 2 | | | | 8 | | | | 5 | |
Commodity contracts – futures(h) | | | 1 | | | | 23 | | | | — | | | | 32 | |
| | | | | | | | | | | | | | | | |
| | $ | 363 | | | $ | 60 | | | $ | 196 | | | $ | 111 | |
Derivatives not designated as hedging instruments: | | | | | | | | | | | | | | | | |
Forward exchange contracts(e) | | $ | 1 | | | $ | 7 | | | $ | 4 | | | $ | 2 | |
Interest rate derivatives(f) | | | 6 | | | | 45 | | | | — | | | | — | |
Commodity contracts – other(g) | | | 28 | | | | 1 | | | | 7 | | | | 60 | |
Commodity contracts – futures(h) | | | — | | | | 1 | | | | — | | | | 3 | |
Prepaid forward contracts(i) | | | 48 | | | | — | | | | 46 | | | | — | |
| | | | | | | | | | | | | | | | |
| | $ | 83 | | | $ | 54 | | | $ | 57 | | | $ | 65 | |
| | | | | | | | | | | | | | | | |
Total derivatives at fair value | | $ | 446 | | | $ | 114 | | | $ | 253 | | | $ | 176 | |
| | | | | | | | | | | | | | | | |
Total | | $ | 1,249 | | | $ | 673 | | | $ | 444 | | | $ | 637 | |
| | | | | | | | | | | | | | | | |
| a) | Financial assets are classified on our balance sheet within other assets, with the exception of short-term investments. Financial liabilities are classified on our balance sheet within other current liabilities and other liabilities. Unless specifically indicated, all financial assets and liabilities are categorized as Level 2 assets or liabilities. |
| b) | Based on the price of common stock. Categorized as a Level 1 asset. |
| c) | Based on price changes in index funds used to manage a portion of market risk arising from our deferred compensation liability. Categorized as a Level 1 asset. |
| d) | Based on the fair value of investments corresponding to employees’ investment elections. At December 25, 2010 and December 26, 2009, $170 million and $121 million, respectively, are categorized as Level 1 liabilities. The remaining balances are categorized as Level 2 liabilities. |
| e) | Based on observable market transactions of spot and forward rates. |
| f) | Based on LIBOR and recently reported transactions in the marketplace. |
| g) | Based on recently reported transactions in the marketplace, primarily swap arrangements. |
| h) | Based on average prices on futures exchanges. Categorized as a Level 1 asset or liability. |
| i) | Based primarily on the price of our common stock. |
94
The effective portion of the pre-tax (gains)/losses on our derivative instruments are categorized in the tables below.
| | | | | | | | | | | | | | | | | | | | | | | | |
| | | Fair Value/Non-
designated Hedges | | | Cash Flow Hedges | |
| | | Losses/(Gains)
Recognized in
Income Statement(a) | | | Losses/(Gains)
Recognized in
Accumulated Other
Comprehensive Loss | | | Losses/(Gains)
Reclassified from
Accumulated Other
Comprehensive
Loss into Income
Statement(b) | |
| | | 2010 | | | 2009 | | | 2010 | | | 2009 | | | 2010 | | | 2009 | |
Forward exchange contracts | | $ | 6 | | | $ | (29 | ) | | $ | 26 | | | $ | 75 | | | $ | 40 | | | $ | (64 | ) |
Interest rate derivatives | | | (104 | ) | | | 206 | | | | 75 | | | | 32 | | | | 7 | | | | — | |
Prepaid forward contracts | | | (4 | ) | | | (5 | ) | | | — | | | | — | | | | — | | | | — | |
Commodity contracts | | | (30 | ) | | | (274 | ) | | | (32 | ) | | | (1 | ) | | | 28 | | | | 90 | |
| | | | | | | | | | | | | | | | | | | | | | | | |
Total | | $ | (132 | ) | | $ | (102 | ) | | $ | 69 | | | $ | 106 | | | $ | 75 | | | $ | 26 | |
| | | | | | | | | | | | | | | | | | | | | | | | |
| (a) | Interest rate gains/losses are included in interest expense in our income statement. All other gains/losses are included in corporate unallocated expenses. |
| (b) | Interest rate losses are included in interest expense in our income statement. All other gains/losses are included in cost of sales in our income statement. |
The carrying amounts of our cash and cash equivalents and short-term investments approximate fair value due to the short-term maturity. Short-term investments consist principally of short-term time deposits and index funds used to manage a portion of market risk arising from our deferred compensation liability. The fair value of our debt obligations as of December 25, 2010 and December 26, 2009 was $25.9 billion and $8.6 billion, respectively, based upon prices of similar instruments in the marketplace.
The above table excludes guarantees. See Note 9 for additional information on our guarantees.
Note 11 — Net Income Attributable to PepsiCo per Common Share
Basic net income attributable to PepsiCo per common share is net income available for PepsiCo common shareholders divided by the weighted average of common shares outstanding during the period. Diluted net income attributable to PepsiCo per common share is calculated using the weighted average of common shares outstanding adjusted to include the effect that would occur if in-the-money employee stock options were exercised and RSUs and preferred shares were converted into common shares. Options to purchase 24.4 million shares in 2010, 39.0 million shares in 2009 and 9.8 million shares in 2008 were not included in the calculation of diluted earnings per common share because these options were out-of-the-money. Out-of-the-money options had average exercise prices of $67.26 in 2010, $61.52 in 2009 and $67.59 in 2008.
95
The computations of basic and diluted net income attributable to PepsiCo per common share are as follows:
| | | | | | | | | | | | | | | | | | | | | | | | |
| | | 2010 | | | 2009 | | | 2008 | |
| | | Income | | | Shares(a) | | | Income | | | Shares(a) | | | Income | | | Shares(a) | |
Net income attributable to PepsiCo | | $ | 6,320 | | | | | | | $ | 5,946 | | | | | | | $ | 5,142 | | | | | |
Preferred shares: | | | | | | | | | | | | | | | | | | | | | | | | |
Dividends | | | (1 | ) | | | | | | | (1 | ) | | | | | | | (2 | ) | | | | |
Redemption premium | | | (5 | ) | | | | | | | (5 | ) | | | | | | | (6 | ) | | | | |
| | | | | | | | | | | | | | | | | | | | | | | | |
Net income available for PepsiCo common shareholders | | $ | 6,314 | | | | 1,590 | | | $ | 5,940 | | | | 1,558 | | | $ | 5,134 | | | | 1,573 | |
| | | | | | | | | | | | | | | | | | | | | | | | |
Basic net income attributable to PepsiCo per common share | | $ | 3.97 | | | | | | | $ | 3.81 | | | | | | | $ | 3.26 | | | | | |
| | | | | | | | | | | | | | | | | | | | | | | | |
Net income available for PepsiCo common shareholders | | $ | 6,314 | | | | 1,590 | | | $ | 5,940 | | | | 1,558 | | | $ | 5,134 | | | | 1,573 | |
Dilutive securities: | | | | | | | | | | | | | | | | | | | | | | | | |
Stock options and RSUs | | | — | | | | 23 | | | | — | | | | 17 | | | | — | | | | 27 | |
ESOP convertible preferred stock | | | 6 | | | | 1 | | | | 6 | | | | 2 | | | | 8 | | | | 2 | |
| | | | | | | | | | | | | | | | | | | | | | | | |
Diluted | | $ | 6,320 | | | | 1,614 | | | $ | 5,946 | | | | 1,577 | | | $ | 5,142 | | | | 1,602 | |
| | | | | | | | | | | | | | | | | | | | | | | | |
Diluted net income attributable to PepsiCo per common share | | $ | 3.91 | | | | | | | $ | 3.77 | | | | | | | $ | 3.21 | | | | | |
| | | | | | | | | | | | | | | | | | | | | | | | |
| (a) | Weighted-average common shares outstanding (in millions). |
Note 12 — Preferred Stock
As of December 25, 2010 and December 26, 2009, there were 3 million shares of convertible preferred stock authorized. The preferred stock was issued for an ESOP established by Quaker and these shares are redeemable for common stock by the ESOP participants. The preferred stock accrues dividends at an annual rate of $5.46 per share. At year-end 2010 and 2009, there were 803,953 preferred shares issued and 227,653 and 243,553 shares outstanding, respectively. The outstanding preferred shares had a fair value of $74 million as of December 25, 2010 and $73 million as of December 26, 2009. Each share is convertible at the option of the holder into 4.9625 shares of common stock. The preferred shares may be called by us upon written notice at $78 per share plus accrued and unpaid dividends. Quaker made the final award to its ESOP plan in June 2001.
96
| | | | | | | | | | | | | | | | | | | | | | | | |
| | | 2010 | | | 2009 | | | 2008 | |
| | | Shares(a) | | | Amount | | | Shares(a) | | | Amount | | | Shares(a) | | | Amount | |
Preferred stock | | | 0.8 | | | $ | 41 | | | | 0.8 | | | $ | 41 | | | | 0.8 | | | $ | 41 | |
| | | | | | | | | | | | | | | | | | | | | | | | |
Repurchased preferred stock | | | | | | | | | | | | | | | | | | | | | | | | |
Balance, beginning of year | | | 0.6 | | | $ | 145 | | | | 0.5 | | | $ | 138 | | | | 0.5 | | | $ | 132 | |
Redemptions | | | — | | | | 5 | | | | 0.1 | | | | 7 | | | | — | | | | 6 | |
| | | | | | | | | | | | | | | | | | | | | | | | |
Balance, end of year | | | 0.6 | | | $ | 150 | | | | 0.6 | | | $ | 145 | | | | 0.5 | | | $ | 138 | |
| | | | | | | | | | | | | | | | | | | | | | | | |
Note 13 — Accumulated Other Comprehensive Loss Attributable to PepsiCo
Comprehensive income is a measure of income which includes both net income and other comprehensive income or loss. Other comprehensive income or loss results from items deferred from recognition into our income statement. Accumulated other comprehensive loss is separately presented on our balance sheet as part of common shareholders’ equity. Other comprehensive income/(loss) attributable to PepsiCo was $164 million in 2010, $900 million in 2009 and $(3,793) million in 2008. The accumulated balances for each component of other comprehensive loss attributable to PepsiCo were as follows:
| | | | | | | | | | | | |
| | | 2010 | | | 2009 | | | 2008 | |
Currency translation adjustment | | $ | (1,159 | ) | | $ | (1,471 | ) | | $ | (2,271 | ) |
Cash flow hedges, net of tax(a) | | | (100 | ) | | | (42 | ) | | | (14 | ) |
Unamortized pension and retiree medical, net of tax(b) | | | (2,442 | ) | | | (2,328 | ) | | | (2,435 | ) |
Unrealized gain on securities, net of tax | | | 70 | | | | 47 | | | | 28 | |
Other | | | 1 | | | | — | | | | (2 | ) |
| | | | | | | | | | | | |
Accumulated other comprehensive loss attributable to PepsiCo | | $ | (3,630 | ) | | $ | (3,794 | ) | | $ | (4,694 | ) |
| | | | | | | | | | | | |
| (a) | Includes $23 million after-tax gain in 2009 and $17 million after-tax loss in 2008 for our share of our equity investees’ accumulated derivative activity. |
| (b) | Net of taxes of $1,322 million in 2010, $1,211 million in 2009 and $1,288 million in 2008. Includes $51 million decrease to the opening balance of accumulated other comprehensive loss attributable to PepsiCo in 2008 due to a change in measurement date for our pension and retiree medical plans. |
97
Note 14 — Supplemental Financial Information
| | | | | | | | | | | | |
| | | 2010 | | | 2009 | | | 2008 | |
Accounts receivable | | | | | | | | | | | | |
Trade receivables | | $ | 5,514 | | | $ | 4,026 | | | | | |
Other receivables | | | 953 | | | | 688 | | | | | |
| | | | | | | | | | | | |
| | | 6,467 | | | | 4,714 | | | | | |
| | | | | | | | | | | | |
Allowance, beginning of year | | | 90 | | | | 70 | | | $ | 69 | |
Net amounts charged to expense | | | 12 | | | | 40 | | | | 21 | |
Deductions(a) | | | (37 | ) | | | (21 | ) | | | (16 | ) |
Other(b) | | | 79 | | | | 1 | | | | (4 | ) |
| | | | | | | | | | | | |
Allowance, end of year | | | 144 | | | | 90 | | | $ | 70 | |
| | | | | | | | | | | | |
Net receivables | | $ | 6,323 | | | $ | 4,624 | | | | | |
| | | | | | | | | | | | |
Inventories(c) | | | | | | | | | | | | |
Raw materials | | $ | 1,654 | | | $ | 1,274 | | | | | |
Work-in-process | | | 128 | | | | 165 | | | | | |
Finished goods | | | 1,590 | | | | 1,179 | | | | | |
| | | | | | | | | | | | |
| | $ | 3,372 | | | $ | 2,618 | | | | | |
| | | | | | | | | | | | |
| (a) | Includes accounts written off. |
| (b) | Includes adjustments related to our acquisitions of PBG and PAS, currency translation effects and other adjustments. |
| (c) | Inventories are valued at the lower of cost or market. Cost is determined using the average, first-in, first-out (FIFO) or last-in, first-out (LIFO) methods. Approximately 8% in 2010 and 10% in 2009 of the inventory cost was computed using the LIFO method. The differences between LIFO and FIFO methods of valuing these inventories were not material. |
| | | | | | | | |
| | | 2010 | | | 2009 | |
Other assets | | | | | | | | |
Noncurrent notes and accounts receivable | | $ | 165 | | | $ | 118 | |
Deferred marketplace spending | | | 203 | | | | 182 | |
Unallocated purchase price for recent acquisitions | | | — | | | | 143 | |
Pension plans | | | 121 | | | | 64 | |
Other investments(a) | | | 653 | | | | 89 | |
Other | | | 547 | | | | 369 | |
| | | | | | | | |
| | $ | 1,689 | | | $ | 965 | |
| | | | | | | | |
Accounts payable and other current liabilities | | | | | | | | |
Accounts payable | | $ | 3,865 | | | $ | 2,881 | |
Accrued marketplace spending | | | 1,841 | | | | 1,656 | |
Accrued compensation and benefits | | | 1,779 | | | | 1,291 | |
Dividends payable | | | 766 | | | | 706 | |
Other current liabilities | | | 2,672 | | | | 1,593 | |
| | | | | | | | |
| | $ | 10,923 | | | $ | 8,127 | |
| | | | | | | | |
| (a) | In 2010, includes our investment in WBD of $549 million. This investment is accounted for as an available-for-sale security with any unrealized gains or losses recorded in other comprehensive income. |
98
| | | | | | | | | | | | |
| | | 2010 | | | 2009 | | | 2008 | |
Other supplemental information | | | | | | | | | | | | |
Rent expense | | $ | 526 | | | $ | 412 | | | $ | 357 | |
Interest paid | | $ | 1,043 | | | $ | 456 | | | $ | 359 | |
Income taxes paid, net of refunds | | $ | 1,495 | | | $ | 1,498 | | | $ | 1,477 | |
Acquisitions(a) | | | | | | | | | | | | |
Fair value of assets acquired | | $ | 27,665 | | | $ | 851 | | | $ | 2,907 | |
Cash paid, net of cash acquired | | | (3,044 | ) | | | (466 | ) | | | (1,925 | ) |
Equity issued | | | (4,451 | ) | | | — | | | | — | |
Previously held equity interests in PBG and PAS | | | (4,293 | ) | | | — | | | | — | |
| | | | | | | | | | | | |
Liabilities and noncontrolling interests assumed | | $ | 15,877 | | | $ | 385 | | | $ | 982 | |
| | | | | | | | | | | | |
| (a) | In 2010, amounts primarily reflect our acquisitions of PBG and PAS. During 2008, together with PBG, we jointly acquired Lebedyansky, for a total purchase price of $1.8 billion. |
Note 15 — Acquisitions
PBG and PAS
On August 3, 2009, we entered into a Merger Agreement (the PBG Merger Agreement) with PBG and Metro pursuant to which PBG merged with and into Metro, with Metro continuing as the surviving corporation and a wholly owned subsidiary of PepsiCo. Also on August 3, 2009, we entered into a Merger Agreement (the PAS Merger Agreement and together with the PBG Merger Agreement, the Merger Agreements) with PAS and Metro pursuant to which PAS merged with and into Metro, with Metro continuing as the surviving corporation and a wholly owned subsidiary of PepsiCo. On February 26, 2010, we acquired PBG and PAS to create a more fully integrated supply chain and go-to-market business model, improving the effectiveness and efficiency of the distribution of our brands and enhancing our revenue growth. The total purchase price was approximately $12.6 billion, which included $8.3 billion of cash and equity and the fair value of our previously held equity interests in PBG and PAS of $4.3 billion.
Under the terms of the PBG Merger Agreement, each outstanding share of common stock of PBG not held by Metro, PepsiCo or a subsidiary of PepsiCo or held by PBG as treasury stock (each, a “PBG Share”) was canceled and converted into the right to receive, at the holder’s election, either 0.6432 shares of common stock of PepsiCo (the “PBG Per Share Stock Consideration”) or $36.50 in cash, without interest (the “PBG Cash Election Price”), subject to proration provisions which provide that an aggregate 50% of such outstanding PBG Shares were converted into the right to receive common stock of PepsiCo and an aggregate 50% of such outstanding PBG Shares were converted into the right to receive cash and each PBG Share and share of Class B common stock of PBG held by Metro, PepsiCo or a subsidiary of PepsiCo was canceled or converted to the right to receive 0.6432 shares of common stock of PepsiCo. Under the terms of the PAS Merger Agreement, each outstanding share of common stock of PAS not held by Metro, PepsiCo or a subsidiary of PepsiCo or held by PAS as treasury stock (each, a “PAS Share”) was canceled and converted into the right to receive, at the holder’s election, either 0.5022 shares of common stock of PepsiCo (the “PAS Per Share Stock Consideration”) or $28.50 in cash, without interest (the “PAS Cash Election Price”), subject to proration provisions which provide that an aggregate 50% of such outstanding PAS Shares were converted into the
99
right to receive common stock of PepsiCo and an aggregate 50% of such outstanding PAS Shares were converted into the right to receive cash and each PAS Share held by Metro, PepsiCo or a subsidiary of PepsiCo was canceled or converted into the right to receive 0.5022 shares of common stock of PepsiCo.
Under the terms of the applicable Merger Agreement, each PBG or PAS stock option was converted into an adjusted PepsiCo stock option to acquire a number of shares of PepsiCo common stock, determined by multiplying the number of shares of PBG or PAS common stock subject to the PBG or PAS stock option by an exchange ratio (the “Closing Exchange Ratio”) equal to the closing price of a share of PBG or PAS common stock on the business day immediately before the acquisition date divided by the closing price of a share of PepsiCo common stock on the business day immediately before the acquisition date. The exercise price per share of PepsiCo common stock subject to the adjusted PepsiCo stock option is equal to the per share exercise price of PBG or PAS stock option divided by the Closing Exchange Ratio.
Under the terms of the PBG Merger Agreement, each PBG restricted stock unit (RSU) was adjusted so that its holder is entitled to receive, upon settlement, a number of shares of PepsiCo common stock equal to the number of shares of PBG common stock subject to the PBG RSU multiplied by the PBG Per Share Stock Consideration. PBG performance-based RSUs were converted into PepsiCo RSUs based on 100% target achievement, and, following conversion, remain subject to continued service of the holder. Each PBG RSU held by a non-employee director was vested and canceled at the acquisition date, and, in exchange for cancellation of the PBG RSU, the holder received the PBG Per Share Stock Consideration for each share of PBG common stock subject to the PBG RSU.
Under the terms of the PAS Merger Agreement, each cash-settled PAS RSU was canceled in exchange for a cash payment equal to the closing price of a share of PAS common stock on the business day immediately before the closing of the PAS merger for each share of PAS common stock subject to each PAS RSU. Each PAS restricted share was converted into either the PAS Per Share Stock Consideration or the PAS Cash Election Price, at the election of the holder, with the same proration procedures applicable to PAS stockholders described above.
Pursuant to the terms of PBG’s executive retention arrangements, PBG equity awards granted to certain executives prior to the PBG merger vest immediately upon a qualifying termination of the executive’s employment except for certain PBG executives whose equity awards vested immediately at the effective time of the PBG merger pursuant to the terms of PepsiCo’s executive retention agreements. Each PAS equity award granted prior to the PAS merger vested immediately at the effective time of the PAS merger pursuant to the original terms of the awards.
Prior to the acquisitions, we had equity investments in PBG and PAS. In addition to approximately 32% of PBG’s outstanding common stock that we owned at year-end 2009, we owned 100% of PBG’s class B common stock and approximately 7% of the equity of Bottling Group, LLC, PBG’s principal operating subsidiary. At year-end 2009, we owned approximately 43% of the outstanding common stock of PAS.
The guidance on accounting for business combinations requires that an acquirer remeasure its previously held equity interest in an acquiree at its acquisition date fair value and recognize the resulting gain or loss in earnings. Thus, in connection with our acquisitions of PBG and PAS, the carrying amounts of our previously held equity interests in PBG and PAS were revalued to
100
fair value at the acquisition date, resulting in a gain in the first quarter of 2010 of $958 million, comprising $735 million which is non-taxable and recorded in bottling equity income and $223 million related to the reversal of deferred tax liabilities associated with these previously held equity interests.
As discussed in Note 9, in January 2010, we issued $4.25 billion of fixed and floating rate notes. A portion of the net proceeds from the issuance of these notes was used to finance our acquisitions of PBG and PAS.
Our actual stock price on February 25, 2010 (the last trading day prior to the closing of the acquisitions) was used to determine the value of stock, stock options and RSUs issued as consideration in connection with our acquisitions of PBG and PAS and thus to calculate the actual purchase price.
The table below represents the computation of the purchase price excluding assumed debt and the fair value of our previously held equity interests in PBG and PAS as of the acquisition date:
| | | | | | | | |
| | | Total Number of
Shares/Awards
Issued | | | Total Fair
Value | |
Payment in cash, for the remaining (not owned by PepsiCo and its subsidiaries) outstanding shares of PBG and PAS common stock and equity awards vested at consummation of merger | | | — | | | $ | 3,813 | |
Payment to PBG and PAS of shares of PepsiCo common stock for the remaining (not owned by PepsiCo and its subsidiaries) outstanding shares of PBG and PAS common stock and equity awards vested at consummation of merger | | | 67 | | | | 4,175 | |
Issuance of PepsiCo equity awards (vested and unvested) to replace existing PBG and PAS equity awards | | | 16 | | | | 276 | |
| | | | | | | | |
Total purchase price | | | 83 | | | $ | 8,264 | |
| | | | | | | | |
101
The following table summarizes the fair value of identifiable assets acquired and liabilities assumed in the acquisitions of PBG and PAS and the resulting goodwill as of the acquisition date:
| | | | |
| | | Acquisition
Date Fair Value | |
Inventory | | $ | 1,006 | |
Property, plant and equipment | | | 5,574 | |
Amortizable intangible assets | | | 1,298 | |
Nonamortizable intangible assets, primarily reacquired franchise rights | | | 9,036 | |
Other current assets and current liabilities(a) | | | 751 | |
Other noncurrent assets | | | 281 | |
Debt obligations | | | (8,814 | ) |
Pension and retiree medical benefits | | | (962 | ) |
Other noncurrent liabilities | | | (744 | ) |
Deferred income taxes | | | (3,246 | ) |
| | | | |
Total identifiable net assets | | | 4,180 | |
Goodwill | | | 8,059 | |
| | | | |
Subtotal | | | 12,239 | |
Fair value of acquisition of noncontrolling interest | | | 317 | |
| | | | |
Total purchase price | | $ | 12,556 | |
| | | | |
| (a) | Includes cash and cash equivalents, accounts receivable, prepaid expenses and other current assets, accounts payable and other current liabilities. |
Goodwill is calculated as the excess of the purchase price paid over the net assets recognized. The goodwill recorded as part of the acquisitions of PBG and PAS primarily reflects the value of adding PBG and PAS to PepsiCo to create a more fully integrated supply chain and go-to-market business model, as well as any intangible assets that do not qualify for separate recognition. Goodwill is not amortizable nor deductible for tax purposes. Substantially all of the goodwill is recorded in our PAB segment.
In connection with our acquisitions of PBG and PAS, we reacquired certain franchise rights which had previously provided PBG and PAS with the exclusive and perpetual rights to manufacture and/or distribute beverages for sale in specified territories. Reacquired franchise rights totaling $8.0 billion were assigned a perpetual life and are, therefore, not amortizable. Amortizable acquired franchise rights of $0.9 billion have weighted-average estimated useful lives of 56 years. Other amortizable intangible assets, primarily customer relationships, have weighted-average estimated useful lives of 20 years.
Under the guidance on accounting for business combinations, merger and integration costs are not included as components of consideration transferred but are accounted for as expenses in the period in which the costs are incurred. See Note 3 for details on the expenses incurred during 2010.
The following table presents unaudited consolidated pro forma financial information as if the closing of our acquisitions of PBG and PAS had occurred on December 27, 2009 for purposes of the financial information presented for the year ended December 25, 2010; and as if the closing
102
of our acquisitions of PBG and PAS had occurred on December 28, 2008 for purposes of the financial information presented for the year ended December 26, 2009.
| | | | | | | | |
| | | 2010 | | | 2009 | |
Net Revenue | | $ | 59,582 | | | $ | 57,471 | |
Net Income Attributable to PepsiCo | | $ | 5,856 | | | $ | 6,752 | |
Net Income Attributable to PepsiCo per Common Share – Diluted | | $ | 3.60 | | | $ | 4.09 | |
The unaudited consolidated pro forma financial information was prepared in accordance with the acquisition method of accounting under existing standards, and the regulations of the U.S. Securities and Exchange Commission, and is not necessarily indicative of the results of operations that would have occurred if our acquisitions of PBG and PAS had been completed on the dates indicated, nor is it indicative of the future operating results of PepsiCo.
The historical unaudited consolidated financial information has been adjusted to give effect to pro forma events that are (1) directly attributable to the acquisitions, (2) factually supportable, and (3) expected to have a continuing impact on the combined results of PepsiCo, PBG and PAS.
The unaudited pro forma results have been adjusted with respect to certain aspects of our acquisitions of PBG and PAS to reflect:
| • | | the consummation of the acquisitions; |
| • | | consolidation of PBG and PAS which are now owned 100% by PepsiCo and the corresponding gain resulting from the remeasurement of our previously held equity interests in PBG and PAS; |
| • | | the elimination of related party transactions between PepsiCo and PBG, and PepsiCo and PAS; |
| • | | changes in assets and liabilities to record their acquisition date fair values and changes in certain expenses resulting therefrom; and |
| • | | additional indebtedness, including, but not limited to, debt issuance costs and interest expense, incurred in connection with the acquisitions. |
The unaudited pro forma results do not reflect future events that may occur after the acquisitions, including, but not limited to, the anticipated realization of ongoing savings from operating synergies in subsequent periods. They also do not give effect to certain one-time charges we expect to incur in connection with the acquisitions, including, but not limited to, charges that are expected to achieve ongoing cost savings and synergies.
103
WBD
On February 3, 2011, we announced that we had completed the previously announced acquisition of ordinary shares, American Depositary Shares and Global Depositary Shares of WBD, a company incorporated in the Russian Federation, which represent in the aggregate approximately 66% of WBD’s outstanding ordinary shares, pursuant to the purchase agreement dated December 1, 2010 between PepsiCo and certain selling shareholders of WBD for approximately $3.8 billion. The acquisition increased PepsiCo’s total ownership of WBD to approximately 77%.
PepsiCo expects to make an offer in Russia (Russian Offer) on or before March 11, 2011 to acquire all of the remaining ordinary shares, in accordance with the mandatory tender offer rules of the Russian Federation. The price to be paid in the Russian Offer will be 3,883.70 Russian rubles per ordinary share. This price is $132, which is the price per share PepsiCo paid to the selling shareholders pursuant to the purchase agreement, converted to Russian rubles at the Central Bank of Russia exchange rate established for February 3, 2011. Concurrently with the Russian Offer, we expect to make an offer (U.S. Offer) to all holders of American Depositary Shares at a price per American Depositary Share equal to 970.925 Russian rubles (which is one-fourth of 3,883.70 Russian rubles since each American Depositary Share represents one-fourth of an ordinary share), without interest and less any fees, conversion expenses and applicable taxes. This amount will be converted to U.S. dollars at the spot market rate on or about the date that PepsiCo pays for the American Depositary Shares tendered in the U.S. Offer.
104
Management’s Responsibility for Financial Reporting
To Our Shareholders:
At PepsiCo, our actions – the actions of all our associates – are governed by our Worldwide Code of Conduct. This Code is clearly aligned with our stated values – a commitment to sustained growth, through empowered people, operating with responsibility and building trust. Both the Code and our core values enable us to operate with integrity – both within the letter and the spirit of the law. Our Code of Conduct is reinforced consistently at all levels and in all countries. We have maintained strong governance policies and practices for many years.
The management of PepsiCo is responsible for the objectivity and integrity of our consolidated financial statements. The Audit Committee of the Board of Directors has engaged independent registered public accounting firm, KPMG LLP, to audit our consolidated financial statements, and they have expressed an unqualified opinion.
We are committed to providing timely, accurate and understandable information to investors. Our commitment encompasses the following:
Maintaining strong controls over financial reporting. Our system of internal control is based on the control criteria framework of the Committee of Sponsoring Organizations of the Treadway Commission published in their report titledInternal Control – Integrated Framework. The system is designed to provide reasonable assurance that transactions are executed as authorized and accurately recorded; that assets are safeguarded; and that accounting records are sufficiently reliable to permit the preparation of financial statements that conform in all material respects with accounting principles generally accepted in the U.S. We maintain disclosure controls and procedures designed to ensure that information required to be disclosed in reports under the Securities Exchange Act of 1934 is recorded, processed, summarized and reported within the specified time periods. We monitor these internal controls through self-assessments and an ongoing program of internal audits. Our internal controls are reinforced through our Worldwide Code of Conduct, which sets forth our commitment to conduct business with integrity, and within both the letter and the spirit of the law.
Exerting rigorous oversight of the business. We continuously review our business results and strategies. This encompasses financial discipline in our strategic and daily business decisions. Our Executive Committee is actively involved – from understanding strategies and alternatives to reviewing key initiatives and financial performance. The intent is to ensure we remain objective in our assessments, constructively challenge our approach to potential business opportunities and issues, and monitor results and controls.
Engaging strong and effective Corporate Governance from our Board of Directors. We have an active, capable and diligent Board that meets the required standards for independence, and we welcome the Board’s oversight as a representative of our shareholders. Our Audit Committee is comprised of independent directors with the financial literacy, knowledge and experience to provide appropriate oversight. We review our critical accounting policies, financial reporting and internal control matters with them and encourage their direct communication with KPMG LLP, with our General Auditor, and with our General Counsel. We also have a Compliance Department to coordinate our compliance policies and practices.
105
Providing investors with financial results that are complete, transparent and understandable. The consolidated financial statements and financial information included in this report are the responsibility of management. This includes preparing the financial statements in accordance with accounting principles generally accepted in the U.S., which require estimates based on management’s best judgment.
PepsiCo has a strong history of doing what’s right. We realize that great companies are built on trust, strong ethical standards and principles. Our financial results are delivered from that culture of accountability, and we take responsibility for the quality and accuracy of our financial reporting.
February 18, 2011
|
| /S/ PETER A. BRIDGMAN |
| Peter A. Bridgman |
| Senior Vice President and Controller |
|
| /S/ HUGH F. JOHNSTON |
| Hugh F. Johnston |
| Chief Financial Officer |
|
| /S/ INDRA K. NOOYI |
| Indra K. Nooyi |
Chairman of the Board of Directors and Chief Executive Officer |
106
Report of Independent Registered Public Accounting Firm
The Board of Directors and Shareholders
PepsiCo, Inc.:
We have audited the accompanying Consolidated Balance Sheets of PepsiCo, Inc. and subsidiaries (“PepsiCo, Inc.” or “the Company”) as of December 25, 2010 and December 26, 2009, and the related Consolidated Statements of Income, Cash Flows and Equity for each of the fiscal years in the three-year period ended December 25, 2010. These consolidated financial statements are the responsibility of the Company’s management. Our responsibility is to express an opinion on these consolidated financial statements based on our audits.
We conducted our audits in accordance with the standards of the Public Company Accounting Oversight Board (United States). Those standards require that we plan and perform the audits to obtain reasonable assurance about whether the financial statements are free of material misstatement. An audit includes examining, on a test basis, evidence supporting the amounts and disclosures in the financial statements, assessing the accounting principles used and significant estimates made by management, and evaluating the overall financial statement presentation. We believe that our audits provide a reasonable basis for our opinion.
In our opinion, the consolidated financial statements referred to above present fairly, in all material respects, the financial position of PepsiCo, Inc. as of December 25, 2010 and December 26, 2009, and the results of its operations and its cash flows for each of the fiscal years in the three-year period ended December 25, 2010, in conformity with U.S. generally accepted accounting principles.
We also have audited, in accordance with the standards of the Public Company Accounting Oversight Board (United States), PepsiCo Inc.’s internal control over financial reporting as of December 25, 2010, based on criteria established inInternal Control– Integrated Framework issued by the Committee of Sponsoring Organizations of the Treadway Commission (COSO), and our report dated February 18, 2011 expressed an unqualified opinion on the effectiveness of the Company’s internal control over financial reporting.
/s/ KPMG LLP
New York, New York
February 18, 2011, except for Notes 1, 3, and 4, which are dated as of March 31, 2011
107
Selected Financial Data
(in millions except per share amounts, unaudited)
| | | | | | | | | | | | | | | | |
Quarterly | | First
Quarter | | | Second
Quarter | | | Third
Quarter | | | Fourth
Quarter | |
Net revenue | | | | | | | | | | | | | | | | |
2010 | | $ | 9,368 | | | $ | 14,801 | | | $ | 15,514 | | | $ | 18,155 | |
2009 | | $ | 8,263 | | | $ | 10,592 | | | $ | 11,080 | | | $ | 13,297 | |
Gross profit | | | | | | | | | | | | | | | | |
2010 | | $ | 4,905 | | | $ | 8,056 | | | $ | 8,506 | | | $ | 9,796 | |
2009 | | $ | 4,519 | | | $ | 5,711 | | | $ | 5,899 | | | $ | 7,004 | |
Mark-to-market net impact(a) | | | | | | | | | | | | | | | | |
2010 | | $ | (46 | ) | | $ | 4 | | | $ | (16 | ) | | $ | (33 | ) |
2009 | | $ | (62 | ) | | $ | (100 | ) | | $ | (29 | ) | | $ | (83 | ) |
Merger and integration charges(b) | | | | | | | | | | | | | | | | |
2010 | | $ | 321 | | | $ | 155 | | | $ | 69 | | | $ | 263 | |
2009 | | | — | | | | — | | | $ | 9 | | | $ | 52 | |
Gain on previously held equity interests(c) | | | | | | | | | | | | | | | | |
2010 | | $ | (958 | ) | | | — | | | | — | | | | — | |
Inventory fair value adjustments(d) | | | | | | | | | | | | | | | | |
2010 | | $ | 281 | | | $ | 76 | | | $ | 17 | | | $ | 24 | |
Venezuela currency devaluation(e) | | | | | | | | | | | | | | | | |
2010 | | $ | 120 | | | | — | | | | — | | | | — | |
Asset write-off(f) | | | | | | | | | | | | | | | | |
2010 | | $ | 145 | | | | — | | | | — | | | | — | |
Foundation contribution(g) | | | | | | | | | | | | | | | | |
2010 | | $ | 100 | | | | — | | | | — | | | | — | |
Debt repurchase(h) | | | | | | | | | | | | | | | | |
2010 | | | — | | | | — | | | | — | | | $ | 178 | |
Restructuring and impairment charges(i) | | | | | | | | | | | | | | | | |
2009 | | $ | 25 | | | $ | 11 | | | | — | | | | — | |
Net income attributable to PepsiCo | | | | | | | | | | | | | | | | |
2010 | | $ | 1,430 | | | $ | 1,603 | | | $ | 1,922 | | | $ | 1,365 | |
2009 | | $ | 1,135 | | | $ | 1,660 | | | $ | 1,717 | | | $ | 1,434 | |
Net income attributable to PepsiCo per common share – basic | | | | | | | | | | | | | | | | |
2010 | | $ | 0.90 | | | $ | 1.00 | | | $ | 1.21 | | | $ | 0.86 | |
2009 | | $ | 0.73 | | | $ | 1.06 | | | $ | 1.10 | | | $ | 0.92 | |
Net income attributable to PepsiCo per common share – diluted | | | | | | | | | | | | | | | | |
2010 | | $ | 0.89 | | | $ | 0.98 | | | $ | 1.19 | | | $ | 0.85 | |
2009 | | $ | 0.72 | | | $ | 1.06 | | | $ | 1.09 | | | $ | 0.90 | |
Cash dividends declared per common share | | | | | | | | | | | | | | | | |
2010 | | $ | 0.45 | | | $ | 0.48 | | | $ | 0.48 | | | $ | 0.48 | |
2009 | | $ | 0.425 | | | $ | 0.45 | | | $ | 0.45 | | | $ | 0.45 | |
2010 stock price per share(j) | | | | | | | | | | | | | | | | |
High | | $ | 66.98 | | | $ | 67.61 | | | $ | 66.83 | | | $ | 68.11 | |
Low | | $ | 58.75 | | | $ | 61.04 | | | $ | 60.32 | | | $ | 63.43 | |
Close | | $ | 66.56 | | | $ | 63.56 | | | $ | 65.57 | | | $ | 65.69 | |
2009 stock price per share(j) | | | | | | | | | | | | | | | | |
High | | $ | 56.93 | | | $ | 56.95 | | | $ | 59.64 | | | $ | 64.48 | |
Low | | $ | 43.78 | | | $ | 47.50 | | | $ | 52.11 | | | $ | 57.33 | |
Close | | $ | 50.02 | | | $ | 53.65 | | | $ | 57.54 | | | $ | 60.96 | |
| (a) | In 2010, we recognized $91 million ($58 million after-tax or $0.04 per share) of mark-to-market net gains on commodity hedges in corporate unallocated expenses. In 2009, we recognized $274 million ($173 million after-tax or $0.11 per share) of mark-to-market net gains on commodity hedges in corporate unallocated expenses. |
108
| (b) | In 2010, we incurred merger and integration charges of $799 million related to our acquisitions of PBG and PAS, as well as advisory fees in connection with our acquisition of WBD. In addition, we recorded $9 million of merger-related charges, representing our share of the respective merger costs of PBG and PAS. In total, these charges had an after-tax impact of $648 million or $0.40 per share. In 2009, we recognized $50 million of merger-related charges, as well as an additional $11 million of costs in bottling equity income representing our share of the respective merger costs of PBG and PAS. In total, these costs had an after-tax impact of $44 million or $0.03 per share. See Note 3. |
| (c) | In 2010, in connection with our acquisitions of PBG and PAS, we recorded a gain on our previously held equity interests of $958 million ($0.60 per share), comprising $735 million which is non-taxable and recorded in bottling equity income and $223 million related to the reversal of deferred tax liabilities associated with these previously held equity interests. See Note 15. |
| (d) | In 2010, we recorded $398 million ($333 million after-tax or $0.21 per share) of incremental costs related to fair value adjustments to the acquired inventory and other related hedging contracts included in PBG’s and PAS’s balance sheets at the acquisition date. |
| (e) | In 2010, we recorded a one-time $120 million net charge ($120 million after-tax or $0.07 per share) related to our change to hyperinflationary accounting for our Venezuelan businesses and the related devaluation of the bolivar. |
| (f) | In 2010, we recorded a $145 million charge ($92 million after-tax or $0.06 per share) related to a change in scope of one release in our ongoing migration to SAP software. |
| (g) | In 2010, we made a $100 million ($64 million after-tax or $0.04 per share) contribution to The PepsiCo Foundation Inc., in order to fund charitable and social programs over the next several years. |
| (h) | In 2010, we paid $672 million in a cash tender offer to repurchase $500 million (aggregate principal amount) of our 7.90% senior unsecured notes maturing in 2018. As a result of this debt repurchase, we recorded a $178 million charge to interest expense ($114 million after-tax or $0.07 per share), primarily representing the premium paid in the tender offer. |
| (i) | Restructuring and impairment charges in 2009 were $36 million ($29 million after-tax or $0.02 per share). See Note 3. |
| (j) | Represents the composite high and low sales price and quarterly closing prices for one share of PepsiCo common stock. |
109
Five-Year Summary
(unaudited)
| | | | | | | | | | | | |
| | | 2010 | | | 2009 | | | 2008 | |
Net revenue | | $ | 57,838 | | | $ | 43,232 | | | $ | 43,251 | |
Net income attributable to PepsiCo | | $ | 6,320 | | | $ | 5,946 | | | $ | 5,142 | |
Net income attributable to PepsiCo per common share – basic | | $ | 3.97 | | | $ | 3.81 | | | $ | 3.26 | |
Net income attributable to PepsiCo per common share – diluted | | $ | 3.91 | | | $ | 3.77 | | | $ | 3.21 | |
Cash dividends declared per common share | | $ | 1.89 | | | $ | 1.775 | | | $ | 1.65 | |
Total assets | | $ | 68,153 | | | $ | 39,848 | | | $ | 35,994 | |
Long-term debt | | $ | 19,999 | | | $ | 7,400 | | | $ | 7,858 | |
Return on invested capital(a) | | | 19.3 | % | | | 27.2 | % | | | 25.5 | % |
| | | |
| | | 2007 | | | 2006 | | | | |
Net revenue | | $ | 39,474 | | | $ | 35,137 | | | | | |
Net income attributable to PepsiCo | | $ | 5,658 | | | $ | 5,642 | | | | | |
Net income attributable to PepsiCo per common share – basic | | $ | 3.48 | | | $ | 3.42 | | | | | |
Net income attributable to PepsiCo per common share – diluted | | $ | 3.41 | | | $ | 3.34 | | | | | |
Cash dividends declared per common share | | $ | 1.425 | | | $ | 1.16 | | | | | |
Total assets | | $ | 34,628 | | | $ | 29,930 | | | | | |
Long-term debt | | $ | 4,203 | | | $ | 2,550 | | | | | |
Return on invested capital(a) | | | 28.9 | % | | | 30.4 | % | | | | |
| (a) | Return on invested capital is defined as adjusted net income attributable to PepsiCo divided by the sum of average common shareholders’ equity and average total debt. Adjusted net income attributable to PepsiCo is defined as net income attributable to PepsiCo plus net interest expense after-tax. Net interest expense after-tax was $534 million in 2010, $211 million in 2009, $184 million in 2008, $63 million in 2007 and $72 million in 2006. |
| • | | Includes restructuring and impairment charges of: |
| | | | | | | | | | | | | | | | |
| | | 2009 | | | 2008 | | | 2007 | | | 2006 | |
Pre-tax | | $ | 36 | | | $ | 543 | | | $ | 102 | | | $ | 67 | |
After-tax | | $ | 29 | | | $ | 408 | | | $ | 70 | | | $ | 43 | |
Per share | | $ | 0.02 | | | $ | 0.25 | | | $ | 0.04 | | | $ | 0.03 | |
| • | | Includes mark-to-market net (income)/expense of: |
| | | | | | | | | | | | | | | | | | | | |
| | | 2010 | | | 2009 | | | 2008 | | | 2007 | | | 2006 | |
Pre-tax | | $ | (91 | ) | | $ | (274 | ) | | $ | 346 | | | $ | (19 | ) | | $ | 18 | |
After-tax | | $ | (58 | ) | | $ | (173 | ) | | $ | 223 | | | $ | (12 | ) | | $ | 12 | |
Per share | | $ | (0.04 | ) | | $ | (0.11 | ) | | $ | 0.14 | | | $ | (0.01 | ) | | $ | 0.01 | |
| • | | In 2010, we incurred merger and integration charges of $799 million related to our acquisitions of PBG and PAS, as well as advisory fees in connection with our acquisition of WBD. In addition, we recorded $9 million of merger-related charges, representing our share of the respective merger costs of PBG and PAS. In total, these costs had an after-tax impact of $648 million or $0.40 per share. |
| • | | In 2010, in connection with our acquisitions of PBG and PAS, we recorded a gain on our previously held equity interests of $958 million ($0.60 per share), comprising $735 million which is non-taxable and recorded in bottling equity income and $223 million related to the reversal of deferred tax liabilities associated with these previously held equity interests. |
| • | | In 2010, we recorded $398 million ($333 million after-tax or $0.21 per share) of incremental costs related to fair value adjustments to the acquired inventory and other related hedging contracts included in PBG’s and PAS’s balance sheets at the acquisition date. |
| • | | In 2010, we recorded a one-time $120 million net charge ($120 million after-tax or $0.07 per share) related to our change to hyperinflationary accounting for our Venezuelan businesses and the related devaluation of the bolivar. |
| • | | In 2010, we recorded a $145 million charge ($92 million after-tax or $0.06 per share) related to a change in scope of one release in our ongoing migration to SAP software. |
| • | | In 2010, we made a $100 million ($64 million after-tax or $0.04 per share) contribution to The PepsiCo Foundation Inc., in order to fund charitable and social programs over the next several years. |
110
| • | | In 2010, we paid $672 million in a cash tender offer to repurchase $500 million (aggregate principal amount) of our 7.90% senior unsecured notes maturing in 2018. As a result of this debt repurchase, we recorded a $178 million charge to interest expense ($114 million after-tax or $0.07 per share), primarily representing the premium paid in the tender offer. |
| • | | In 2009, we recognized $50 million of merger-related charges related to our acquisitions of PBG and PAS, as well as an additional $11 million of costs in bottling equity income representing our share of the respective merger costs of PBG and PAS. In total, these costs had an after-tax impact of $44 million or $0.03 per share. |
| • | | In 2008, we recognized $138 million ($114 million after-tax or $0.07 per share) of our share of PBG’s restructuring and impairment charges. |
| • | | In 2007, we recognized $129 million ($0.08 per share) of non-cash tax benefits related to the favorable resolution of certain foreign tax matters. In 2006, we recognized non-cash tax benefits of $602 million ($0.36 per share) primarily in connection with the IRS’s examination of our consolidated income tax returns for the years 1998 through 2002. |
| • | | On December 30, 2006, we adopted guidance from the FASB on accounting for pension and other postretirement benefits which reduced total assets by $2,016 million, total common shareholders’ equity by $1,643 million and total liabilities by $373 million. |
111
GLOSSARY
Acquisitions: reflect all mergers and acquisitions activity, including the impact of acquisitions, divestitures and changes in ownership or control in consolidated subsidiaries and nonconsolidated equity investees.
Bottlers: customers to whom we have granted exclusive contracts to sell and manufacture certain beverage products bearing our trademarks within a specific geographical area.
Bottler Case Sales (BCS):measure of physical beverage volume shipped to retailers and independent distributors from both PepsiCo and our independent bottlers.
Bottler funding: financial incentives we give to our independent bottlers to assist in the distribution and promotion of our beverage products.
Concentrate Shipments and Equivalents (CSE): measure of our physical beverage volume shipments to independent bottlers, retailers and independent distributors. This measure is reported on our fiscal year basis.
Constant currency: financial results assuming constant foreign currency exchange rates used for translation based on the rates in effect for the comparable prior-year period.
Consumers: people who eat and drink our products.
CSD: carbonated soft drinks.
Customers: authorized independent bottlers, distributors and retailers.
Derivatives: financial instruments, such as futures, swaps, Treasury locks, options and forward contracts, that we use to manage our risk arising from changes in commodity prices, interest rates, foreign exchange rates and stock prices.
Direct-Store-Delivery (DSD): delivery system used by us and our independent bottlers to deliver snacks and beverages directly to retail stores where our products are merchandised.
Effective net pricing: reflects the year-over-year impact of discrete pricing actions, sales incentive activities and mix resulting from selling varying products in different package sizes and in different countries.
Hedge accounting: treatment for qualifying hedges that allows fluctuations in a hedging instrument’s fair value to offset corresponding fluctuations in the hedged item in the same reporting period. Hedge accounting is allowed only in cases where the hedging relationship between the hedging instruments and hedged items is highly effective, and only prospectively from the date a hedging relationship is formally documented.
Management operating cash flow: net cash provided by operating activities less capital spending plus sales of property, plant and equipment. It is our primary measure used to monitor cash flow performance.
Mark-to-market net gain or loss or impact:the change in market value for commodity contracts, that we purchase to mitigate the volatility in costs of energy and raw materials that we
112
consume. The market value is determined based on average prices on national exchanges and recently reported transactions in the marketplace.
Marketplace spending:sales incentives offered through various programs to our customers and consumers (trade spending), as well as advertising and other marketing activities.
Servings: common metric reflecting our consolidated physical unit volume. Our divisions’ physical unit measures are converted into servings based on U.S. Food and Drug Administration guidelines for single-serving sizes of our products.
Transaction gains and losses: the impact on our consolidated financial statements of exchange rate changes arising from specific transactions.
Translation adjustment: the impact of converting our foreign affiliates’ financial statements into U.S. dollars for the purpose of consolidating our financial statements.
113