UNITED STATES
SECURITIES AND EXCHANGE COMMISSION
Washington, D.C. 20549
FORM 10-K
| |
☒ | ANNUAL REPORT PURSUANT TO SECTION 13 OR 15(d) OF THE SECURITIES EXCHANGE ACT OF 1934 |
for the fiscal year ended December 31, 2024
or
| |
☐ | TRANSITION REPORT PURSUANT TO SECTION 13 OR 15(d) OF THE SECURITIES EXCHANGE ACT OF 1934 |
Commission file number: 1-31371
Oshkosh Corporation
(Exact name of registrant as specified in its charter)
| | |
Wisconsin |
| 39-0520270 |
(State or other jurisdiction
of incorporation or organization) |
| (I.R.S. Employer
Identification No.) |
| | |
1917 Four Wheel Drive Oshkosh, Wisconsin |
| 54902 |
(Address of principal executive offices) |
| (Zip code) |
(920) 502-3400
(Registrant’s telephone number, including area code)
Securities registered pursuant to Section 12(b) of the Act:
| | | | | |
Title of each class | | Trading Symbol(s) | |
| Name of each exchange on which registered |
Common Stock $0.01 par value | | OSK | |
| New York Stock Exchange |
Securities registered pursuant to Section 12(g) of the Act: None
| | | | |
Indicate by check mark if the registrant is a well-known seasoned issuer, as defined in Rule 405 of the Securities Act. |
| ☒ | Yes | ☐ | No |
Indicate by check mark if the registrant is not required to file reports pursuant to Section 13 or Section 15(d) of the Act. |
| ☐ | Yes | ☒ | No |
| | | | |
Indicate by check mark whether the registrant (1) has filed all reports required to be filed by Section 13 or 15(d) of the Securities Exchange Act of 1934 during the preceding 12 months (or for such shorter period that the registrant was required to file such reports), and (2) has been subject to such filing requirements for the past 90 days. |
| ☒ | Yes | ☐ | No |
Indicate by check mark whether the registrant has submitted electronically every Interactive Data File required to be submitted pursuant to Rule 405 of Regulation S-T (§ 232.405 of this chapter) during the preceding 12 months (or for such shorter period that the registrant was required to submit such files). |
| ☒ | Yes | ☐ | No |
Indicate by check mark whether the registrant is a large accelerated filer, an accelerated filer, a non-accelerated filer, a smaller reporting company, or an emerging growth company. See the definitions of “large accelerated filer,” “accelerated filer,” “smaller reporting company,” and “emerging growth company” in Rule 12b-2 of the Exchange Act.
| | | | | | |
Large accelerated filer | | ☒ | | Accelerated filer | | ☐ |
Non-accelerated filer | | ☐ | | Smaller reporting company | | ☐ |
| | | | Emerging growth company | | ☐ |
If an emerging growth company, indicate by check mark if the registrant has elected not to use the extended transition period for complying with any new or revised financial accounting standards provided pursuant to Section 13(a) of the Exchange Act. ☐
Indicate by check mark whether the registrant has filed a report on and attestation to its management’s assessment of the effectiveness of its internal control over financial reporting under Section 404(b) of the Sarbanes-Oxley Act (15 U.S.C. 7262(b)) by the registered public accounting firm that prepared or issued its audit report. ☒
If securities are registered pursuant to Section 12(b) of the Act, indicate by check mark whether the financial statements of the registrant included in the filing reflect the correction of an error to previously issued financial statements. ☐
Indicate by check mark whether any of those error corrections are restatements that required a recovery analysis of incentive-based compensation received by any of the registrant’s executive officers during the relevant recovery period pursuant to §240.10D-1(b).☐
| | | | |
Indicate by check mark whether the registrant is a shell company (as defined in Rule 12b-2 of the Act). |
| ☐ | Yes | ☒ | No |
At June 30, 2024, the aggregate market value of the registrant’s Common Stock held by non-affiliates was $7,049,671,672 (based on the closing price of $108.20 per share on the New York Stock Exchange as of the last trading day of the quarter ended June 30, 2024).
As of February 13, 2025, 64,524,506 shares of the registrant’s Common Stock were outstanding.
DOCUMENTS INCORPORATED BY REFERENCE:
Portions of the Proxy Statement for the 2024 Annual Meeting of Shareholders (to be filed with the Commission under Regulation 14A within 120 days after the end of the registrant’s fiscal year and, upon such filing, to be incorporated by reference into Part III).
| | | | |
Auditor Firm ID: 34 | | Auditor Name: Deloitte & Touche LLP | | Auditor Location: Milwaukee, WI |
OSHKOSH CORPORATION
FORM 10-K INDEX
As used herein, “the Company,” “we,” “us” and “our” refers to Oshkosh Corporation and its consolidated subsidiaries. “Oshkosh” refers to Oshkosh Corporation, not including JLG Industries, Inc. and its wholly-owned subsidiaries (JLG), JerrDan LLC (JerrDan), Hinowa S.p.A (Hinowa), AUSACORP S.L. (AUSA), Pierce Manufacturing Inc. (Pierce), Oshkosh AeroTech and its wholly-owned subsidiaries (AeroTech), McNeilus Companies, Inc. (McNeilus) and its wholly-owned subsidiaries, Oshkosh Commercial Products, LLC (Oshkosh S-Series), Iowa Mold Tooling Co., Inc. (IMT), Maxi-Metal, Inc. (Maxi-Metal), Kewaunee Fabrications, LLC (Kewaunee), Oshkosh Defense, LLC (Oshkosh Defense) and its wholly-owned subsidiaries, Pratt & Miller Engineering & Fabrications, LLC (Pratt Miller) or any other subsidiaries.
The “Oshkosh®,” “JLG®,” “Pierce®,” “Maxi-Metal®,” “McNeilus®,” “Jerr-Dan®,” “Frontline™,” “IMT®,” "Oshkosh S-Series™," “Oshkosh Defense®,” “Pratt Miller®,” “Command Zone™,” “TAK-4®,” “PUC™,” “Hercules™,” “Husky™,” “Ascendant™,” “SkyTrak®,” “DaVinci™” and “Volterra™” trademarks and related logos are trademarks or registered trademarks of the Company. All other product and service names referenced in this document are the trademarks or registered trademarks of their respective owners.
All references herein to earnings per share refer to earnings per share assuming dilution, unless noted otherwise.
For ease of understanding, the Company refers to types of purpose-built vehicles and equipment for particular applications as “markets.” When the Company refers to “market” positions, these comments are based on information available to the Company concerning units sold by those companies currently manufacturing the same types of purpose-built vehicles and equipment as the Company and are therefore only estimates. Unless otherwise noted, these market positions are based on sales in the United States of America. There can be no assurance that the Company will maintain such market positions in the future.
Cautionary Statement About Forward-Looking Statements
The Company believes that certain statements in “Business” and “Management’s Discussion and Analysis of Financial Condition and Results of Operations” and other statements located elsewhere in this Annual Report on Form 10-K are “forward-looking statements” within the meaning of the Private Securities Litigation Reform Act of 1995. All statements other than statements of historical fact included in this report, including, without limitation, statements regarding the Company’s future financial position, business strategy, targets, projected sales, costs, earnings, capital expenditures, debt levels and cash flows, and plans and objectives of management for future operations, including those under the caption “2025 Outlook” in “Management’s Discussion and Analysis of Financial Condition and Results of Operations,” are forward-looking statements. When used in this Annual Report on Form 10-K, words such as “may,” “will,” “expect,” “intend,” “estimate,” “anticipate,” “believe,” “should,” “project,” “confident” or “plan” or the negative thereof or variations thereon or similar terminology are generally intended to identify forward-looking statements. These forward-looking statements are not guarantees of future performance and are subject to risks, uncertainties, assumptions and other factors, some of which are beyond the Company’s control, which could cause actual results to differ materially from those expressed or implied by such forward-looking statements. These factors include the cyclical nature of the Company’s access equipment, municipal fire apparatus, air transportation equipment and refuse and recycling collection markets, which are particularly impacted by the strength of U.S. and European economies and construction seasons; the Company’s estimates of access equipment demand which, among other factors, is influenced by historical customer buying patterns and rental company fleet replacement strategies; the impact of orders and costs on the U.S. Postal Service contract; risks that a trade war and related tariffs could reduce the competitiveness of the Company’s products; the Company’s ability to increase prices to raise margins or to offset higher input costs; the Company's ability to accurately predict future input costs associated with Defense contracts; the Company’s ability to attract and retain production labor in a timely manner; the Company's ability to realize the anticipated benefits associated with the AeroTech acquisition; the strength of the U.S. dollar and its impact on Company exports, translation of foreign sales and the cost of purchased materials; the impact of severe weather, war, natural disasters or pandemics that may affect the Company, its suppliers or its customers; the Company’s ability to predict the level and timing of orders for indefinite delivery/indefinite quantity contracts with the U.S. federal government; budget uncertainty for the U.S. federal government, including risks of future budget cuts, the impact of continuing resolution funding mechanisms and the potential for shutdowns; the impact of any U.S. Department of Defense solicitation for competition for future contracts to produce military vehicles; risks related to the collectability of receivables, particularly for those businesses with exposure to construction markets; the cost of any warranty campaigns related to the Company’s products; risks associated with international operations and sales, including compliance with the Foreign Corrupt Practices Act; the Company’s ability to comply with complex laws and regulations applicable to U.S. government contractors; cybersecurity risks and costs of defending against, mitigating and responding to data security threats and breaches impacting the Company; the Company’s ability to successfully identify, complete and integrate other acquisitions and to realize the anticipated benefits associated with the same; and risks related to the Company’s ability to successfully execute on its strategic road map and meet its long-term financial goals. Additional information concerning these and other factors that could cause actual results to differ materially from those in the forward-looking statements is contained in Item 1A of Part I of this report.
All forward-looking statements, including those under the caption “2025 Outlook” in “Management’s Discussion and Analysis of Financial Condition and Results of Operations,” speak only as of February 20, 2025. The Company assumes no obligation, and disclaims any obligation, to update information contained in this Annual Report on Form 10-K. Investors should be aware that the Company may not update such information until the Company’s next quarterly earnings conference call, if at all.
PART I
ITEM 1. BUSINESS
In July 2024, the Company moved the reporting responsibility for Pratt Miller from its Defense segment to the Chief Technology and Strategic Sourcing Officer to better utilize Pratt Miller's expertise across the entire Oshkosh Corporation enterprise. Pratt Miller results are now reported within "Corporate and other." All historical information has been recast to reflect this change.
The Company
Oshkosh Corporation is a global industrial technology company dedicated to moving the world forward. As an innovator and integrator, we specialize in the design, development and manufacturing of purpose-built vehicles and equipment, serving everyday heroes in the postal, firefighting, refuse and recycling collection, construction, aviation and defense industries. We are an innovator, developing and leveraging disruptive technologies across our portfolio in the areas of electrification, autonomy and connectivity, making some of the most challenging jobs in the world safe, smart, connected, quiet, clean and productive — delivering both efficiency and impact.
The Company has three reportable segments: Access, Vocational and Defense, which comprised 48%, 31% and 20%, respectively, of the Company’s 2024 consolidated net sales. Oshkosh’s leading brands include a wide range of purpose-built vehicles and equipment to serve a diverse set of end markets. Our innovations are scalable and adaptable, often expanding across many of our businesses. We believe collaboration across our diverse and resilient portfolio allows breakthroughs in technology, supply chain, materials integration and manufacturing processes to extend across multiple markets. The Company generated approximately 20%, 19% and 25% of its net sales in 2024, 2023 and 2022, respectively, to the U.S. government, a substantial majority of which were under multi-year contracts and programs in the defense vehicle market. See Note 24 of the Notes to Consolidated Financial Statements for financial information related to the Company's reportable segments.
The Access segment designs and manufactures access and material handling equipment for use in a wide range of construction, industrial, agricultural, vegetation management and maintenance applications to safely position workers and materials at height under industry-leading brands, JLG and SkyTrak. The Access segment's customer base includes equipment rental companies, construction contractors, manufacturing companies and home improvement centers. The Access segment also includes Jerr-Dan towing and recovery vehicles (wreckers, rotators and carriers).
The Vocational segment includes the Pierce, Maxi-Metal, AeroTech, Oshkosh Airport Products, McNeilus, IMT, Frontline Communications and Oshkosh S-Series businesses. The Pierce and Maxi-Metal businesses design and manufacture commercial and custom fire apparatus. AeroTech designs and manufactures airport ground support equipment and gate equipment and provides baggage and facility airport services. Oshkosh Airport Products designs and manufactures aircraft rescue and firefighting (ARFF) vehicles. McNeilus designs and manufactures refuse and recycling collection vehicles and components. The segment also includes IMT-branded field service vehicles and truck-mounted cranes, Frontline Communications-branded simulators, command vehicles and other communication vehicles and Oshkosh S-Series front-discharge concrete mixer vehicles. Vocational segment sales are made primarily to municipal and commercial customers in the Americas.
The Defense segment designs, manufactures and sustains best-in-class specialty vehicles and mobility systems for the U.S. Department of Defense (DoD) under the Oshkosh Defense brand and exports its products to approved foreign customers. This segment also includes the U.S. Postal Service (USPS) contract to produce the Next Generation Delivery Vehicle (NGDV), which was awarded to the Company in February 2021. The contract allows for the delivery of up to 165,000 vehicles over a 10-year period.
Significant Defense segment contracts as of December 31, 2024 include:
| | | | | | |
Contract | | Customer | | Order Period | | Delivery Period for Current Orders |
Family of Heavy Tactical Vehicles (FHTV) | | DoD | | 2015 - 2029 | | 2025 - 2026 |
Family of Medium Tactical Vehicles (FMTV) | | DoD | | 2018 - 2025 | | 2025 - 2027 |
Medium Caliber Weapons System (MCWS) | | DoD | | 2021 - 2027 | | 2025 - 2026 |
Joint Light Tactical Vehicles (JLTV) | | DoD | | 2015 - 2023 | | 2025 |
NGDV | | USPS | | 2021 - 2031 | | 2025 - 2027 |
The Company has a disciplined capital allocation strategy that focuses on growth investments, including reinvesting in the Company's core businesses and growing through strategic acquisitions, as well as returns to shareholders through dividends and share repurchases. The Company's acquisition and investment strategy continues to include expanding into new categories and enhancing critical technological and lifecycle management capabilities. For example, the Company has completed the following strategic acquisitions and divestitures over the past three years:
•In September 2024, the Company acquired AUSA, a privately held Spanish manufacturer of wheeled dumpers, rough terrain forklifts and telehandlers, for $114.5 million.
•In August 2023, the Company acquired AeroTech from JBT Corporation for $804.6 million.
•In July 2023, the Defense segment sold its snow removal apparatus business for $17.1 million.
•In March 2023, the Vocational segment sold its rear-discharge concrete mixer business for $32.9 million.
•In January 2023, the Company acquired Hinowa, an Italian manufacturer of compact crawler booms and tracked equipment, for $186.8 million.
•In June 2022, the Company acquired Maxi-Metal, a Canadian manufacturer of custom fire apparatus and utility vehicles, for $19.7 million.
Business Strategy
The Company's business strategy is grounded in the Company's purpose of making a difference in the lives of the people in our communities who do tough work. The strategy is reflected in three simple words: Innovate. Serve. Advance.
Innovate. The Company innovates customer solutions by combining leading technology and operational strength to empower and protect the everyday hero. The Company is developing and integrating advanced technologies to expand production output, improve profit margins and fulfill its purpose in areas such as electrification, autonomy and connected products.
Serve. The Company serves and supports customers with a relentless focus throughout the product lifecycle. The Company believes that lifecycle services provide a robust growth opportunity while offering stability throughout business cycles.
Advance. The Company advances by expanding into new markets and geographies to move the world forward. The Company expects to continue to grow globally and expand into new categories both organically, as with the USPS program win in the delivery vehicle market, and inorganically through acquisitions.
Competitive Strengths
The following competitive strengths support the Company’s business strategy:
Strong Market Positions. The Company has developed strong market positions and brand recognition in its core businesses, which it attributes to its reputation for quality products, technology innovation, advanced engineering, vehicle and equipment performance, reliability, customer service and low total cost of ownership. The Company maintains a leading market share in nearly all of its businesses and is the sole-source supplier of a number of vehicles to the DoD.
Diversified Product Portfolios. The Company believes its broad product portfolios and end markets serve to diversify its sources of revenue, mitigate the impact of economic cyclicality and provide multiple platforms for both organic and inorganic growth. The Company’s product portfolios provide extensive opportunities to bundle products for sale to customers, leverage purchasing power and share innovation and technology within and between segments. For each of its target markets, the Company has developed advanced technology or acquired a broad product line in an effort to become a supplier of choice for purpose-built vehicles and equipment, parts and service to support its customers. In addition, the Company has established an extensive domestic and international distribution network for purpose-built vehicles and equipment tailored to each market.
Quality Products and Customer Service. The Company has developed strong brand recognition for its products as a result of its commitment to meet the stringent product quality and reliability requirements of its customers in the purpose-built vehicle and equipment markets it serves. The Company frequently achieves premium pricing due to the quality, durability and low total cost of ownership of its products and its commitment to providing high quality lifecycle support through extensive parts and service support programs.
Innovative and Proprietary Solutions. The Company’s advanced design and engineering capabilities have contributed to the development of innovative and/or proprietary, severe-duty solutions that enhance vehicle and equipment performance, reduce manufacturing costs and strengthen customer relationships. The Company’s advanced design and engineering capabilities have also allowed it to integrate many of these solutions across various segments and product lines, which enhances its ability to compete for new business and reduces its costs to manufacture its products compared to manufacturers who simply assemble purchased components. The Company has been a supplier of electric-powered products for more than 20 years and recently launched several new products that leverage zero emissions electrification for mobility across all segments.
Flexible and Efficient Manufacturing. The Company believes it has competitive advantages over larger vehicle manufacturers in its purpose-built vehicle and equipment markets due to its manufacturing flexibility and ability to effectively manage its supply base and customize products to meet customer specifications. The Company also believes it has competitive advantages over smaller vehicle and equipment manufacturers due to volumes that offer purchasing power, flexible and efficient manufacturing capabilities and technology sharing opportunities across product lines.
Strong Management Team. The Company is led by President and Chief Executive Officer, John Pfeifer. Mr. Pfeifer is complemented by an experienced senior management team that has been assembled through internal promotions and external hires. The Company’s Board of Directors maintains a robust succession planning process for its executive officers to ensure strong business continuity.
Products
Oshkosh Corporation is focused on the following purpose-built vehicle and equipment markets:
Access segment. JLG is a leading designer and manufacturer of aerial work platforms and telehandlers used in a wide variety of construction, industrial, agricultural, vegetation management and maintenance applications to safely position workers and materials at height. JLG also offers a broad range of parts and accessories, including technical support, training and reconditioning services. Access customers include equipment rental companies, distributors, construction contractors, manufacturing companies and home improvement centers. JLG's products are marketed worldwide through independent rental companies and distributors that purchase these products and then rent or sell them and provide service support, as well as through other sales and service branches or organizations.
JLG also arranges equipment financing and leasing solutions for its customers, primarily through third-party funding arrangements with independent financial companies, and occasionally provides credit support in connection with these financing and leasing arrangements. Financing arrangements that JLG offers or arranges include various types of rental fleet loans and leases, as well as floor plan and retail financing. Terms of these arrangements vary depending on the type of transaction, but typically range from 36 to 72 months and generally require the customer to be responsible for maintenance of the equipment and to bear the risk of damage to or loss of the equipment.
Jerr-Dan is a leading designer and manufacturer of towing and recovery equipment in the U.S. The Company believes Jerr-Dan is recognized as an industry leader in quality and innovation. Jerr-Dan offers a broad line of carriers, wreckers and rotators.
In addition to manufacturing equipment, Jerr-Dan provides its customers with one-stop service support and generates revenue from the installation of equipment, as well as the sale of chassis and service parts.
Vocational segment. Through Pierce and Maxi-Metal, the Company is a leading North American designer and manufacturer of municipal fire apparatus assembled on both commercially available and custom chassis, designed and manufactured to meet the demanding requirements of firefighters. Pierce’s engineering expertise allows it to design its vehicles to meet stringent industry guidelines and government regulations for safety and effectiveness. Pierce primarily serves domestic municipal customers, but also sells fire apparatus to the DoD, airports, universities and large industrial companies, and in international markets. Pierce’s history of innovation, research and development in consultation with firefighters has resulted in a broad product line that features a wide range of innovative, high-quality custom and commercial firefighting equipment with advanced fire suppression capabilities. In an effort to be a single-source supplier for its customers, Pierce offers a full line of custom and commercial fire apparatus and emergency vehicles, including pumpers, aerial platforms, ladder and tiller trucks, tankers, light-, medium- and heavy-duty rescue vehicles, wildland rough terrain response vehicles and other emergency response vehicles.
Through AeroTech, the Company is a leading designer and manufacturer of aviation ground support products and gate equipment for commercial airlines, airports, air freight carriers, ground handling and military customers. AeroTech specializes in special purpose aviation ground support products such as cargo loaders, push-back tractors and deicer trucks for airlines and air cargo companies. Terminal facilities and commercial aviation are supported by the Jetway passenger boarding bridge and related air and power products. AeroTech's Airport Services business specializes in the maintenance, servicing and operation of key airport facility systems such as HVAC, passenger boarding systems and baggage systems, as well as leveraging asset management technology, including our iOPS Intelligent Monitoring System, to support efficient airport operations. AeroTech Airport Services also provides contracting, project management, design and installation services for the critical and complex baggage systems and other key facility operations.
Through Oshkosh Airport Products, the Company is a leader in the design and sale of ARFF vehicles to domestic and international airports. These highly-specialized vehicles are required to be in service at most airports worldwide to support commercial airlines in the event of an emergency. Many of the largest airports in the United States are served by the Company’s ARFF vehicles. The U.S. government also maintains a fleet of ARFF vehicles that are used to support military operations throughout the world. Internationally, the Company’s vehicles serve airports worldwide, with recent deliveries to airports in Latin America, the Middle East, the United Kingdom and China. The Company believes that the performance and reliability of its ARFF vehicles contribute to the Company’s strong position in this market.
Through McNeilus, the Company is a leading designer and manufacturer of refuse and recycling collection vehicles for the waste services industry throughout the Americas.
Through IMT, the Company is a leading North American designer and manufacturer of field service vehicles and truck-mounted cranes for the construction, equipment dealer, rental, building supply, utility, tire service, railroad and mining industries.
Through its Frontline Communications business, the Company is a leading manufacturer, system designer and integrator of command trucks and military simulator shelters and trailers. The Company’s vehicles have supported disaster relief efforts for the Federal Emergency Management Agency (FEMA) and everyday incident response for federal and local law enforcement, emergency management agencies and fire departments.
Through its Oshkosh S-Series business, the Company is a leading designer and manufacturer of front-discharge concrete mixers for the concrete ready-mix industry.
The Company offers two- to fifteen-year municipal lease financing programs to its Pierce customers in the U.S. through the Pierce Financial Solutions program, provided by PNC Bank. Financing programs include competitive lease financing rates, flexible finance arrangements and the ease of one-stop shopping to meet the finance needs of Pierce customers. The Company typically provides credit support in connection with these financing and leasing arrangements. The Company also arranges equipment financing and leasing solutions for its other Vocational segment customers, primarily through third-party funding arrangements with independent financial companies, and occasionally provides credit support in connection with these financing and leasing arrangements.
Defense segment. Oshkosh Defense has designed and sold products to the DoD for over 100 years and also exports its products to approved foreign customers. By successfully responding to the DoD’s changing vehicle requirements, Oshkosh Defense has become a leading manufacturer of heavy, medium, and light tactical wheeled vehicles and related sustainment services, as well as a provider of next generation combat vehicle solutions for mobility, reliability and lethality, for the DoD. Oshkosh Defense designs and manufactures vehicles that perform a variety of demanding tasks such as hauling combat vehicles, missile systems, ammunition, fuel, troops and cargo for a broad range of missions. Oshkosh Defense’s proprietary product line of military heavy-payload tactical wheeled vehicles includes the Heavy Expanded Mobility Tactical Truck (HEMTT), Heavy Equipment Transporter (HET), the Palletized Load System (PLS) and the Logistic Vehicle System Replacement (LVSR). Oshkosh Defense also manufacturers the L-ATV, light combat tactical all-terrain vehicle, (domestically known as the JLTV) designed to protect, sustain and provide mobility for personnel and payloads across the full spectrum of military operations.
Oshkosh Defense was selected by the USPS to build their NGDV under an indefinite delivery, indefinite quantity (IDIQ) contract that allows the USPS to purchase up to 165,000 units over ten years. Oshkosh Defense’s offering provides the USPS with both zero-emission battery electric vehicles (BEVs) and fuel efficient, low emission internal combustion engine (ICE) vehicles. Oshkosh Defense began delivering vehicles on this contract in the first half of 2024. Through December 2024, the USPS has placed orders for 51,500 NGDVs.
Marketing, Sales, Distribution and Service
The Company believes it differentiates itself from many of its competitors by tailoring its distribution to the needs of its purpose-built vehicle and equipment markets and with its national and global sales and service capabilities. The Company’s flexible distribution model focuses on meeting customers on their terms with turnkey delivery, training and support over the life of the vehicle. The Company backs its products with rapid parts shipment, enabled by predictive tools that ensure inventory availability, and service technicians are available to domestic customers 365 days a year. The Company believes its dedication to keeping its products in-service in demanding conditions worldwide has contributed to customer loyalty.
The Company provides its salespeople, representatives and distributors with product and sales training on the operation and specifications of its products. The Company’s engineers, along with its product managers, develop user-friendly operating manuals and virtual training tools and provide field support at vehicle delivery.
U.S. dealers and representatives enter into agreements with the Company that allow for termination by either party generally upon 90 days’ notice, subject to applicable laws. Dealers and representatives, except for those utilized by JLG and IMT, are generally not permitted to market and sell competitive products.
Access segment. JLG’s products are marketed across six continents through rental companies and distributors that purchase products and then rent or sell them and provide service support, as well as through other Company owned sales and service branches. JLG maintains a broad worldwide internal sales force. Sales employees are dedicated to specific major customers, channels or geographic regions. JLG’s international sales employees are spread among international sales and service offices throughout the world.
The Company markets its Jerr-Dan-branded carriers, wreckers and rotators through its extensive network of independent distributors.
Vocational segment. The Company believes the geographic breadth, size and quality of its Pierce fire apparatus dealer network are competitive advantages in a market characterized by a few large manufacturers and numerous small, regional competitors. Pierce’s fire apparatus are sold through an extensive network of independent dealers with hundreds of sales representatives in the U.S. and Canada, which combine broad geographical reach with high frequency of contact with fire departments and municipal government officials. These dealers are supported by product and marketing support professionals and contract administrators at Pierce. The Company believes high frequency of contact, ability to customize products and local presence are important to cultivate major, and typically infrequent, purchases. After a sale, Pierce’s nationwide local parts and service capability is available to help municipalities maintain peak readiness for this vital municipal service. Pierce also sells fire apparatus to international municipal and industrial fire departments through a network of international dealers.
The Company markets its Maxi-Metal vehicles through a combination of direct sales representatives and a network of dealers. Some of these representatives and dealers also handle Pierce products.
AeroTech sales are conducted through a team of direct sales personnel strategically located across the globe and through an extensive network of sales agents.
The Company markets its Oshkosh-branded ARFF vehicles through a combination of direct sales representatives and dealerships domestically and an extensive network of representatives and distributors in international markets. Some of these international representatives and distributors also handle Pierce products.
The Company markets its McNeilus-branded refuse and recycling collection vehicles through a network of dealers and sales representatives. As part of its continuous improvement mission, McNeilus looks at ways to enhance its market share and the customer experience. As a result, in 2024, the Company changed its distribution method for non-fleet refuse and recycling collection vehicle customers to a network of dealers. The Company believes this change will enhance its industry-leading support using dedicated, local sales and service representatives to bring more access to its products, parts and service technicians. Expanding its sales and support network through experienced equipment dealers will allow the Company to tap into markets and develop relationships with customers that have historically been outside the reach of its service support network.
IMT distributes its products through a combination of direct sale representatives and a wide network of distributors in more than one hundred locations worldwide. International distributors are primarily located in Canada, Central and South America, Australia and Asia and are primarily focused on mining and construction markets.
The Company markets its Frontline Communications-branded command vehicles and shelters through both sales representatives and a network of dealers that are directed at commercial and government customers. Some of these representatives and dealers also handle Pierce products.
Defense segment. While Oshkosh Defense sells a substantial portion of its domestic defense products directly to principal branches of the DoD, it also sells defense products to numerous international governments around the globe. Oshkosh Defense locates its business development, consultants and engineering professionals near its customers’ principal commands, both domestically and internationally. Oshkosh Defense sells and services defense products to approved international governments as Direct Commercial Sales or Foreign Military Sales via U.S. government channels. Oshkosh Defense supports international sales through international sales offices, as well as through dealers, distributors and representatives.
The Company believes that its proven worldwide logistics capabilities are critical in supporting its defense parts and service business. Oshkosh Defense maintains a large parts distribution warehouse in Milwaukee, Wisconsin to fulfill stringent parts delivery schedule requirements, as well as satellite facilities near DoD bases in the U.S. and abroad.
Manufacturing
The Company manufactures its products at 31 manufacturing facilities. To reduce production costs, the Company maintains a continuing emphasis on the development of proprietary components, self-sufficiency in fabrication, just-in-time inventory management, improvement in production flows and interchangeability of components among product lines, creation of jigs and fixtures to ensure repeatability of quality processes, utilization of robotics, and performance measurements to assure progress toward cost reduction targets. The Company encourages employee involvement to improve production processes and product quality.
The Company uses a Quality Management System to support the delivery of consistent, high-quality products and services to customers. The Company requires employees at all levels to understand customer and supplier requirements, measure performance, develop systems and procedures to prevent product nonconformance and continually improve all work processes. The Company educates and trains all employees at its facilities in quality principles. The Company utilizes quality gates in its manufacturing facilities to identify issues early in the process and to analyze root cause at the source, resulting in fewer defects and less rework. The Company’s Quality Management System is based on ISO 9001, a set of internationally-accepted requirements established by the International Organization for Standardization. ISO 9001 certification indicates that a company has established and follows a rigorous set of standards aimed at achieving customer satisfaction by following a process-based approach to identify and control the quality needs of suppliers, inputs, critical processes and outputs. The Quality Management System helps ensure that the Company is continually improving and sharing successful practices across the organization. Facilities for the majority of AeroTech and Oshkosh Defense and the following brands are ISO 9001 certified: JLG, Jerr-Dan, Hinowa, AUSA, Pierce, Maxi-Metal, Oshkosh Airport Products, McNeilus and Frontline Communications.
The Company has a team of employees dedicated to leading the implementation of the Company’s simplification initiatives. The team is comprised of members with diverse backgrounds in quality, lean, data analytics, product and process engineering, and culture change management. Simplification includes lean tools to eliminate waste and provide better value for customers. It also guides customer satisfaction assessments to help identify opportunities to improve the customer experience with the Company. Within the Company’s facilities, simplification projects have contributed to manufacturing efficiency gains, materials management improvements, quality enhancements and reduced cycle times. Simplification projects have also freed up manufacturing capacity to support production increases.
Engineering, Research and Development
The Company is an innovator of purpose-built vehicles and equipment. The Company's technology and product development teams include more than 1,900 talented engineers with expertise across many disciplines including vehicle design, simulation, software and electronics. As a leading industrial technology company, the Company has facilities around the world with extensive research and development capabilities. Our team members are committed to building safer, more productive machines.
The Company leverages disruptive technologies in several key areas including electrification, autonomy and connected products. By designing and building innovative products that revolutionize the way work is done, the Company is empowering people to be safe, productive, efficient and sustainable in what they do and how they serve.
The Company is securing its heritage of innovation for the future through new product research, ideation challenges, competitions and an open framework that leverages technology partners and strategic acquisitions. The Company's acquisition of Pratt Miller, a leader in autonomous and connected systems, expanded its technological capabilities, and partnerships with leading universities such as Massachusetts Institute of Technology, Carnegie Mellon University and the University of Wisconsin- Madison, as well as the Company's corporate venture capital investments, give it access to cutting edge research, a robust talent pipeline and early access to disruptive technologies.
The Company believes it is uniquely positioned to transition technology and deliver new products at great speed across our businesses to create differentiation within the markets it serves. Recent product launches include the Pierce Volterra, North America’s first electric fire truck; the Striker Volterra Electric ARFF, an electric ARFF vehicle with advanced electric vehicle battery technology; the McNeilus Volterra ZSL and ZFL, North America’s first fully integrated electric refuse and recycling collection vehicles; the JLG DaVinci lift, the world’s first all-electric scissor lift; JLG ClearSky Smart Fleet, the construction industry’s first two-way fleet management and communication platform; and the NGDV, a delivery vehicle that leverages advanced technologies, sustainability and operational efficiency. As work environments and challenges evolve, Oshkosh responds with better, more advanced products.
Intellectual Property
Patents, trademarks, copyrights, trade secrets and licenses are important to the operation of the Company's business. The Company expects to continue growing its intellectual property portfolio as it pursues advanced innovations in electrification, autonomy, advanced analytics and connected products. The Company believes its collection of patented and patent-pending technologies are important to the operation of its business and its competitive position. The Company leverages technology across its businesses and segments to bring innovative solutions to customers around the world. Certain Oshkosh Corporation trademarks including the Oshkosh name and logomark, along with each of its business unit brands contribute to the business’ identity. The Company does not believe that any existing patent, trademark, copyright, trade secret or license is of such importance that its loss or termination would have a material adverse effect on the Company's business taken as a whole.
Competition
In all of the Company’s segments, competitors include smaller, specialized manufacturers as well as large, mass producers. The Company believes that, in its purpose-built vehicle and equipment markets, it has been able to effectively compete against large, mass producers due to its product quality, manufacturing flexibility and distribution networks. In addition, the Company believes it has competitive advantages over smaller vehicle and equipment manufacturers due to volumes that offer purchasing power, technology and manufacturing sharing opportunities across product lines. The Company believes that its competitive cost structure, strategic global purchasing capabilities, engineering expertise, product quality and global distribution and service systems have enabled it to compete effectively.
Certain of the Company’s competitors have greater financial, marketing, manufacturing, distribution and governmental affairs resources than the Company. There can be no assurance that the Company’s products will continue to compete effectively with the products of competitors or that the Company will be able to retain its customer base or improve or maintain its profit margins on sales to its customers, all of which could have a material adverse effect on the Company’s financial condition, results of operations and cash flows.
Access segment. JLG operates in the global construction, maintenance, agricultural, vegetation management and industrial equipment markets. JLG’s competitors range from some of the world’s largest multinational construction equipment manufacturers to small single-product niche manufacturers. Within this global market, competition for sales of aerial work platform equipment includes Genie Industries, Inc. (a subsidiary of Terex Corporation), Skyjack Inc. (a subsidiary of Linamar Corporation), Haulotte Group, Xuzhou Construction Machinery Group Co., Ltd. (XCMG), Zhejiang Dingli Machinery Co., Ltd. and numerous other manufacturers. Global competition for sales of telehandler equipment includes J C Bamford Excavators Ltd., the Manitou Group, Merlo SpA, Genie Industries, Inc., Skyjack Inc. and numerous other manufacturers. In addition, JLG faces competition from a number of manufacturers of other niche products such as boom vehicles, cherry pickers, skid steer loaders, mast climbers, straight mast and vehicle-mounted fork-lifts, rough-terrain and all-terrain cranes, vehicle-mounted cranes, portable material lifts, various types of material handling equipment, scaffolding and the common ladder that offer functionality that is similar to or overlaps that of JLG’s products. Principal methods of competition include brand awareness, product innovation and performance, price, quality, service and support, product availability and the extent to which a company offers single-source customer solutions. The Company believes its competitive strengths include: premium brand names; broad and single-source product offerings; product quality; product residual values that are generally higher than competitors’ units; worldwide distribution; safety record; service and support network; global procurement scale; and extensive manufacturing capabilities.
The principal competitor for Jerr-Dan-branded products is Miller Industries, Inc. Principal methods of competition for carriers, wreckers and rotators include product quality and innovation, product performance, price and service. The Company believes its competitive strengths in this market include its high-quality, innovative and high-performance product line and its cost competitive manufacturing capabilities.
Vocational segment. The Company produces and sells custom and commercial firefighting vehicles in North America and abroad under the Pierce and Maxi-Metal brands. Competitors for firefighting vehicles include Rosenbauer International AG, REV Group, Inc. and numerous smaller, regional manufacturers. Principal methods of competition include brand awareness, ability to meet or exceed customer specifications, price, lead times, the extent to which a company offers single-source customer solutions, product innovation, product quality, dealer distribution and service and support. The Company believes that its
competitive strengths include: recognized, premium brand name; nationwide network of independent Pierce dealers; extensive, high-quality and innovative product offerings, which include single-source customer solutions for aerials, pumpers and rescue units; large-scale and high-efficiency custom manufacturing capabilities; and proprietary technologies such as the Pierce Ultimate Configuration (PUC), TAK-4 independent suspension system, Hercules and Husky foam systems, Command Zone electronics, Volterra parallel-electric drivetrain and the Ascendant family of aerial fire trucks.
AeroTech supplies aviation-related fixed gate equipment and ground support equipment (GSE) for North American and international markets. AeroTech passenger boarding bridges are produced under the Jetway brand. Competitors include China International Marine Containers (Group) Co., Ltd. and TK Elevator. The Company competes in the gate equipment space based on a robust design and strong manufacturing capability, supported by capable project management and technical product support. The Company produces AeroTech GSE products under numerous brands. The principal competition for ground support equipment includes TLD Group and ITW GSE Inc. as well as other regional competitors. The Company competes for business based on total cost of ownership, product support and technology.
Airport Products manufactures ARFF vehicles for sale in the U.S. and abroad. Oshkosh’s primary competitors for ARFF vehicle sales are Rosenbauer International AG and Albert Ziegler GmbH.
The Company produces refuse and recycling collection vehicles for North America and international markets under the McNeilus brand. Competitors in the refuse and recycling collection vehicles market include Environmental Solutions Group (a subsidiary of Terex Corporation), New Way Trucks, Labrie Enviroquip Group (owned by Wynnchurch Capital) and other regional competitors. The principal methods of competition are product innovation, quality and performance, service and price. The Company competes for municipal business and large commercial business in the Americas. The Company believes its competitive strengths in the Americas refuse and recycling collection vehicle markets include: strong brand recognition; enhanced safety features; innovative and comprehensive product offerings; product lifecycle support; a reputation for high-quality products; ability to integrate refuse and recycling collection bodies with alternative fuel technology chassis; the offering of a fully integrated electric refuse vehicle; large-scale and high-efficiency manufacturing; and a nationwide network of independent dealers.
IMT is a manufacturer of field service vehicles and truck-mounted cranes for the construction, equipment dealer, rental, building supply, utility, tire service, railroad and mining industries. IMT’s principal field service vehicle competition is from Auto Crane Company (owned by Ramsey Industries, Inc.), Stellar Industries, Inc., Maintainer Corporation of Iowa, Inc., the Knapheide Manufacturing Company and other regional companies. Competition in truck-mounted cranes comes primarily from European companies including Palfinger AG, Cargotec Corporation and Fassi Group SpA. Principal methods of competition are product quality, price and service. The Company believes its competitive strengths include its high-quality products, global distribution network and low-cost manufacturing capabilities.
The Company also produces and sells command vehicles in the U.S. and abroad under the Frontline Communications brand. The principal competition for command vehicles is LDV, Inc., MBF Industries, Inc., Nomad Global Communication Solutions, Incorporated, Farber Specialty Vehicles, Inc. and Matthews Specialty Vehicles, Inc.
The Company produces front-discharge concrete mixers for the Americas under the Oshkosh S-Series brand. Competition for front-discharge concrete mixers includes Terex Corporation. Principal methods of competition are price, service, product features, product quality and product availability. The Company believes its competitive strengths include: strong brand recognition; large-scale and high-efficiency manufacturing; product innovation; high product quality; innovative control systems and a significant installed base of front-discharge concrete mixers in use in the marketplace.
Defense segment. Oshkosh Defense produces heavy, medium and light-payload tactical wheeled vehicles and provides next generation combat vehicle solutions for militaries around the world. Competition for sales of these vehicles includes, among others, Navistar Defense LLC (a subsidiary of Cerberus Capital Management, LP), General Dynamics Corporation, AM General LLC (a subsidiary of KPS Capital Partners, LP), Mack Defense LLC and BAE Systems plc. The principal method of competition for defense vehicles involves a competitive bid process that considers factors as determined by the customer, such as price, product performance, product lifecycle costs, small and disadvantaged business participation, product quality, adherence to bid specifications, production capability, project management capability, past performance and product support. Usually, the Company’s vehicle systems must also pass extensive testing. The Company believes that its competitive strengths include:
strategic global purchasing capabilities; extensive pricing/costing and defense contracting expertise; a significant installed base of vehicles currently in use throughout the world; flexible and high-efficiency vertically-integrated manufacturing capabilities; patented and/or proprietary vehicle components such as the TAK-4 family of independent suspension systems, Oshkosh power transfer cases and Command Zone integrated vehicle diagnostics; weapons and communications integration; ability to develop new and improved product capabilities responsive to the needs of its customers; product quality; and aftermarket parts sales and service capabilities.
The Weapon Systems Acquisition Reform Act requires competition for defense programs in certain circumstances. Accordingly, it is possible that the U.S. Army and U.S. Marine Corps will conduct competitions for programs for which the Company currently has contracts upon the expiration of the existing contracts. Competition for these and other domestic programs could result in future contracts being awarded based upon different competitive factors than those described above and would primarily include price, production capability and past performance. The U.S. government has become more aggressive in seeking to acquire the design rights to the Company’s current and potential future programs to facilitate competition for manufacturing our vehicles. The willingness of the bidders to license their design rights to the DoD was an evaluation factor in the JLTV and FMTV A2 contract competitions. Certain of the Company’s contracts with the DoD, including the JLTV and FMTV A2 contracts, require that the Company effectively transfer the “technical know-how” necessary to produce and support the vehicles and/or other deliverables within the contract to the customer.
The Competition in Contracting Act requires competition for U.S. defense programs in most circumstances. Competition for DoD programs currently supplied by the Company could result in the U.S. government awarding future contracts to another manufacturer or the U.S. government awarding the contracts to the Company at lower prices and operating margins than the Company experiences under current contracts.
Oshkosh Defense also produces postal delivery vehicles for the USPS. Competition for sales of delivery vehicles includes, among others, Utilimaster (a subsidiary of The Shyft Group), Morgan Olson (a subsidiary of JB Poindexter & Co., Inc.), Workhorse Group Incorporated and Rivian Automotive Inc.
Government Contracts
Approximately 20% of the Company's sales for 2024 were made to the U.S. government, a substantial majority of which were under multi-year contracts and programs in the defense vehicle market. Accordingly, a significant portion of the Company’s sales are subject to risks specific to doing business with the U.S. government, including uncertainty of economic conditions, changes in government policies and requirements that may reflect rapidly changing military and political developments, the availability of funds and the ability to meet specified performance thresholds. Multi-year contracts may be conditioned upon continued availability of congressional appropriations and are impacted by uncertainty regarding federal budget pressures. Variances between anticipated budget and congressional appropriations may result in a delay, reduction or termination of these contracts.
Oshkosh Defense’s sales are substantially dependent upon periodic awards of new contracts, the purchase of base vehicle quantities and the exercise of options under existing contracts. The funding of U.S. government programs is subject to an annual congressional budget authorization and appropriation process. In years when the U.S. government has not completed its budget process before the end of its fiscal year, government operations are typically funded pursuant to a “continuing resolution”, which allows federal government agencies to operate at spending levels approved in the previous budget cycle but does not authorize new spending initiatives. When the U.S. government operates under a continuing resolution, delays can occur in the procurement of the products, services and solutions that Oshkosh Defense provides and may result in new initiatives being delayed or canceled, or funds could be reprogrammed away from Oshkosh Defense’s programs to pay for higher priority operational needs. In years when the U.S. government fails to complete its budget process or to provide for a continuing resolution, a federal government shutdown may result. This could in turn result in the delay or cancellation of key programs, which could have a negative effect on the Company’s cash flows and adversely affect the Company’s future results. In addition, payments to contractors for services performed during a federal government shutdown may be delayed, which would have a negative effect on the Company’s cash flows.
Contract awards that Oshkosh Defense receives may be subject to protests by competing bidders. These protests, if successful, could result in the customer revoking part or all of any contract it awards to Oshkosh Defense and an inability on the part of Oshkosh Defense to recover amounts it has expended during the protest period in anticipation of initiating work under any such contract.
Under firm, fixed-price contracts with the U.S. government, the price paid to the Company is generally not subject to adjustment to reflect the Company’s actual costs, except costs incurred as a result of contract changes ordered by the U.S. government. The Company generally attempts to negotiate with the U.S. government the amount of increased compensation to which the Company is entitled for government-ordered changes that result in higher costs. If the Company is unable to negotiate a satisfactory agreement to provide such increased compensation, then the Company may file an appeal with the Armed Services Board of Contract Appeals or the U.S. Claims Court. The Company has no such appeals pending. The Company seeks to mitigate risks with respect to fixed-price contracts by executing firm, fixed-price contracts where possible with its suppliers of significant components for the duration of the Company’s contracts. The Company has also successfully negotiated certain contracts that include an Economic Price Adjustment (EPA) clause which provides for a price adjustment calculated on costs incurred or externally published indices.
U.S. government contracts generally permit the government to terminate a contract, in whole or part, at the government’s convenience. If the U.S. government exercises its rights under this clause, the contractor is entitled to payment for the allowable costs incurred and a reasonable profit on the work performed to date. The U.S. government can also terminate a contract for default. If a contract is terminated for default, the contractor is generally entitled to payment for work that has been accepted by the U.S. government. Termination for default may expose the Company to loss on work not yet accepted by the government and have a negative impact on the Company’s ability to obtain future orders and contracts. The U.S. government’s right to terminate its contracts has not had a material effect on the operations or financial condition of the Company.
The Company, as a U.S. government contractor, is subject to financial audits and other reviews by the U.S. government relating to the performance of, and the accounting and general practices relating to, U.S. government contracts. Like most large government contractors, the Company is audited and reviewed by the government on a continual basis. Costs and prices under such contracts may be subject to adjustment based upon the results of such audits and reviews. Additionally, such audits and reviews can lead to civil, criminal or administrative proceedings. Such proceedings could involve claims by the government for fines, penalties, compensatory and treble damages, restitution and/or forfeitures. Under government regulations, a company or one or more of its subsidiaries can also be suspended or debarred from government contracts or lose its export privileges based on the results of such proceedings. The Company believes that the outcome of all such audits and reviews that are now pending will not have a material effect on its financial condition, results of operations or cash flows.
Suppliers
The Company sources raw materials and components domestically and internationally to meet commitments to its customers. Components for the Company’s products are generally available from numerous suppliers, although some sole sourced components would require additional time to transition. The Company also purchases complete vehicle chassis from truck chassis suppliers in its Access and Vocational segments.
The Company has developed global sourcing strategies to meet its production needs while building upon long-term supplier relationships and leveraging the scale of its enterprise. The supply base is expected to maintain or continuously improve levels of quality, delivery time, cost and the agility to meet changes in market demands. The Company also maintains an extensive qualification, on-site inspection, assistance and performance measurement system to help control risks associated with reliance on suppliers. Risks are monitored by the Company to minimize the likelihood of a supply disruption, including supplier capacity, financial health, cybersecurity, geopolitical events and adverse weather conditions that would affect production and logistics.
The Company also invests in advanced technologies to provide visibility and improved orchestration of its supply chain. The Company believes these investments have improved and will continue to improve the overall efficiency and performance of the business’ global supply chain.
Environmental Matters
The Company is subject to a wide variety of local, state, and federal environmental laws in the U.S., as well as in other countries where the Company conducts business. Our facilities, operations and products are subject to increasingly stringent environmental laws and regulations globally, including laws and regulations governing air emissions, noise, releases to soil and discharges to water and the generation, handling, storage, transportation, treatment, and disposal of non-hazardous and hazardous waste materials. Some environmental laws impose strict, retroactive, and joint and several liability for the release of hazardous substances, even for conduct that was lawful at the time it occurred, or for the conduct of, or conditions caused by prior operators, predecessors or other third parties. With respect to acquired properties and businesses, the Company conducts due diligence into potential exposure to environmental liabilities but cannot be certain that it has identified or will identify all adverse environmental conditions.
The Company believes that its policies, practices, and procedures are properly designed to prevent unreasonable risk of environmental damage and the consequent financial liability to the Company. Nevertheless, the Company could incur substantial costs as a result of non-compliance with or liability for cleanup or other costs or damages under environmental laws.
The Company has established emissions reduction targets that were approved by the Science Based Targets Initiative (SBTi). The Company may also be subject to other more stringent environmental laws in the future. If more stringent environmental laws are enacted in the future, these laws could have a material adverse impact on our business, results of operations and financial condition
Human Capital Management
As of December 31, 2024, the Company had approximately 18,500 employees, approximately 11,800 of whom are production employees. Approximately 2,100 (14%) of the Company's U.S. employees were represented by unions. The United Auto Workers (UAW) Union, whose agreement expires in September 2027, represented the majority of these employees (1,338 employees), with the remaining being represented by the United Steelworkers, the Boilermakers, Iron Shipbuilders, Blacksmiths and Forgers Union (Boilermakers), International Brotherhood of Teamsters Union (Teamsters), Eastern Millwright Regional Council and International Brotherhood of Electrical Workers. In addition, approximately 63% of the Company’s 2,900 employees located outside of the U.S. are represented by separate works councils or unions.
People First Culture. The Company maintains an inclusive People First culture that supports team members’ safety, engagement, wellbeing, and personal and professional development. The Company believes its People First culture is a strength, and the Company intends to continue building upon that culture to foster innovation and drive long-term, sustainable performance across the business. In 2024, 60% of global production and office team members participated in the Company’s Global Engagement Survey. Engagement across the enterprise was 7.5 out of 10.
The Company has proactive programs to enhance an inclusive culture that leverages diverse backgrounds and perspectives and empowers engagement and innovation. The Company measures diversity of hires (i.e., ethnic, gender, veteran or disability) for full-time U.S. non-production positions. In 2024, 55% of the Company’s hires for full-time U.S. non-production positions fell into at least one of these categories.
The Company expects all team members to adhere to the highest ethical standards every day. The Company requires all team members to complete training on its Code of Conduct referred to as “The Oshkosh Way”. The Oshkosh Way provides specific guidance to team members, outlining how they are expected to act with the integrity that has defined Oshkosh since the Company was founded over 100 years ago. In addition, the Company maintains a global ethics and compliance helpline to allow for concerns of potential violations of the Code, global policies, or the law to be reported anonymously.
The Company’s connections to its communities through charitable giving, leadership and volunteering efforts have long been an important part of the Company’s culture and team member engagement. The Company’s teams creatively identified opportunities to volunteer in 2024 donating over 22,300 hours to the communities in which they live and work.
For the last 11 years, the Company has held the Oshkosh Excellence Awards (OEAs), an annual competition and recognition event that invites team members to submit innovative ideas to foster improvements for its culture, operations, products and customers. Over 600 OEA nominations were submitted in 2024.
Talent and Learning. The Company’s business strategy is enabled by its ability to attract, develop and retain world-class talent. The Company offers multiple programs of Lens of Leadership, its signature in-person development program for team members at the director level and above. The Company continued a series of executive leadership development events and expanded virtual learning opportunities to all managers on topics of leadership, fostering engagement and an inclusive culture and cultivating innovation and performance. Team members of the Company logged over 253,000 learning hours in 2024. The Company leveraged its recently upgraded enterprise Learning Management System to enable all team members to access learning content on its technology platform.
Strategic succession planning, future leader pipelines and critical role depth are regularly reviewed and updated. All leaders are expected to complete regular check-ins to provide feedback, review annual goal progress and hold career development conversations with team members to help ensure alignment, drive engagement and facilitate strong business outcomes.
Health and Safety. The Company focuses on protecting the health and safety of its team members. The Company takes a proactive collaborative approach to managing safety to ensure its workforce returns home safely every day. Safety Management System maturity, OSHA VPP Star progression, ergonomic advancements and active team member involvement have led to improved risk reduction within the Company's operations.
The Company offers a competitive benefit platform to help ensure that, no matter where team members are in their well-being journeys, they are supported in their physical, financial and emotional goals. In 2024, the Company cared for over 26,000 people, including team members and their families, on its medical plan. The Company expanded paid parental leave benefits to support team members as they grow their families. In addition, the Company supported team members’ investment in their health by providing a financial incentive to complete an annual preventive exam.
Seasonal Nature of Business
The Company’s Access segment tends to be seasonal with an increase in sales occurring in the spring and summer months that constitute the traditional construction season in the northern hemisphere. Sales are generally lower in the three months ended December 31 in all segments due to the relatively high number of holidays in the United States, which reduce available production and shipping days.
Available Information
The Company maintains a website with the address www.oshkoshcorp.com. The Company is not including the information contained on the Company’s website as a part of, or incorporating it by reference into, this Annual Report on Form 10-K. The Company makes available free of charge through its website its Annual Report on Form 10-K, quarterly reports on Form 10-Q and current reports on Form 8-K, and amendments to these reports, as soon as reasonably practicable after the Company electronically files such materials with, or furnishes such materials to, the Securities and Exchange Commission (SEC).
ITEM 1A. RISK FACTORS
The Company's financial position, results of operations and cash flows are subject to various risks, many of which are not exclusively within the Company's control, which may cause actual performance to differ materially from historical or projected future performance. Investors should carefully consider information in this Annual Report on Form 10-K in light of the risk factors described below.
Business and Operational Risks
Our markets are highly cyclical. Declines in these markets could have a material adverse effect on our operating performance.
The access equipment market is highly cyclical and impacted (i) by the strength of economies in general and customers’ perceptions concerning the timing of economic cycles, (ii) by residential and non-residential construction spending, (iii) by the ability of rental companies to obtain third-party financing to purchase revenue generating assets, (iv) by capital expenditures of rental companies in general, including the rate at which they replace aged rental equipment, (v) by the timing of regulatory standard changes, and (vi) by other factors, including oil and gas related activity and government spending. Municipal fire apparatus markets are cyclical later in an economic cycle and are impacted by the economy generally and by municipal tax
receipts. Refuse and recycling collection vehicle markets are also cyclical and impacted by the strength of economies in general, by municipal tax receipts and by the size and timing of capital expenditures, including replacement demand, by large waste haulers. Airport products markets are also cyclical and impacted by global demand for air transportation services. If demand for our products is lower than what we or the market expect, due to a recession or other factors, then there could be an adverse effect on our net sales, financial condition, profitability and/or cash flows. In addition, those impacts could be more than we anticipate.
Our performance under the United States Postal Service (USPS) contract may not be what we expect.
In 2021, the USPS selected us to build its Next Generation Delivery Vehicle (NGDV). The indefinite delivery, indefinite quantity (IDIQ) contract allows for the purchase of up to 165,000 units over 10 years. Through December 31, 2024, we have received orders for 51,500 vehicles. As of December 31, 2024, we have recorded an asset for deferred contract costs of $842.6 million that primarily relates to the NGDV program. Contract costs are amortized over the anticipated production volume of the related contract. The USPS contract and our performance under the contract are subject to the following risks, among others, that could have a material adverse effect on our results of operations, financial condition, and/or cash flows:
•The USPS ordering fewer units than we expect which could result in an impairment of our deferred contract asset.
•It may take longer or cost more than we anticipate to scale our production to full rate production, which may result from additional costs, product design changes, supplier product quality issues or delays in receiving products from suppliers, costs and other challenges associated with recruiting and training a new workforce or other challenges associated with scaling production.
•Our supply base may not be able to supply parts in a timely manner.
•Warranty costs may be higher than we anticipate.
•If additional orders are received, the mix of internal combustion engine and battery electric vehicles could be different from our expectations, which could reduce revenues that we expect under the contract and negatively affect anticipated margins.
•The USPS may exercise its right to terminate the contract for convenience.
Changes in trade policies and other factors beyond our control may adversely impact our results.
In 2024, we directly imported from Mexico, China and Canada approximately $600 million, $175 million and $100 million, respectively. Geopolitical tensions and trade disputes can disrupt supply chains and increase the cost of our products, which could cause our products to be more expensive for customers. Countries could adopt restrictive trade measures such as tariffs, taxation, foreign exchange controls, capital controls and controls on imports or exports of goods, technology or data, any of which could adversely affect our operations and supply chain or limit our ability to offer our products and services as intended. Changes in laws or regulations governing the terms of foreign trade, and in particular increased trade restrictions, tariffs or taxes on imports from countries where we manufacture products or from where we import products or raw materials (either directly or through our suppliers) could have a material adverse effect on our competitive position, results of operations, financial condition, and/or cash flows. For example, in June 2024, the European Commission imposed a tariff that applies to imports of certain access equipment into European Union countries from China, which resulted in additional costs and could result in lower sales and/or profitability of the Access segment in the European Union. Countries may implement additional restrictive trade actions, including tariffs, export controls, sanctions, legislation favoring domestic investment and other actions impacting the import and export of goods in jurisdictions in which we or our suppliers operate. These kinds of restrictions could be adopted with little to no advance notice and could escalate in response to tariffs or restrictions imposed by the U.S. or other countries, and we may not be able to effectively mitigate any adverse impacts from such measures. Political uncertainty surrounding trade or other international disputes also could have a negative impact on customer confidence, inflation, interest rates and the level of investments by our customers and on the economy in general. Any of these events could increase the cost of our products, impact demand for our products, create disruptions to supply chains or impair our ability to effectively operate and compete in countries where we do business.
Fluctuations in prices of raw materials and other inputs may adversely impact our results.
We purchase, directly and indirectly through component purchases, significant amounts of steel, aluminum and other commodities. Steel, aluminum and other commodity prices have historically been highly volatile. Costs for these items may increase in the future due to a variety of factors, including: the level of tariffs that the U.S. imposes on imported steel, aluminum and other commodities; an outbreak of conflicts in regions of the world that produce the commodities or the raw materials that go into the commodities or through which the commodities are transported; or a weakening U.S. dollar.
In addition, the cost of parts, materials, components or final assemblies has increased and may continue to increase for reasons other than changes in commodity prices. Factors such as the imposition of duties and tariffs and other trade barriers, supply and demand, the level of imports, freight costs, availability of transportation, the cost of manufacturing labor, availability of labor, inventory levels and general economic conditions may affect the price of our parts, materials, components or final assembly purchases.
Increases in parts, materials, components or final assemblies costs negatively impact the profitability of orders in backlog as prices on those orders are generally less flexible. If we are not able to recover cost increases through price increases to our customers, then such increases will have an adverse effect on our financial condition, profitability and/or cash flows. Furthermore, price increases may not be accepted by our customers, resulting in them choosing to order from our competitors instead of us. Any significant decrease in orders could have an adverse effect on our net sales, financial condition, profitability and/or cash flows. Additionally, if costs decrease and we are unable to negotiate timely component cost decreases commensurate with any decrease in costs, then our higher component costs could put us at a material disadvantage as compared to our competition which could have a material adverse effect on our net sales, financial condition, profitability and/or cash flows.
We are dependent upon third-party suppliers, making us vulnerable to supply shortages and price increases.
We have experienced, and in the future are likely to experience, significant disruption of the supply of some of our parts, materials, components and final assemblies that we obtain from suppliers or subcontractors. Delays in obtaining parts, materials, components and final assemblies may result from a number of factors affecting our suppliers including shipping disruptions, capacity constraints, labor constraints, supplier product quality issues, suppliers’ impaired financial condition and suppliers’ allocations to other purchasers. Such disruptions have resulted and could further result in higher manufacturing costs caused by an inefficient parts flow to our production lines or the need to procure parts from higher cost suppliers, could delay sales and could result in a material adverse effect on our results of operations, financial condition, and/or cash flows.
We are dependent on our suppliers of engines, chassis, batteries and other power sources to continue to timely deliver such components that meet applicable emissions regulations and customer preferences. If we fail to have adequate relationships with suppliers that will supply appropriate engines, chassis, batteries and other power sources to us or fail to timely receive appropriate components from our suppliers, that could result in us being placed in an uncompetitive position or without finished product when needed.
Labor issues may adversely impact our results.
Our production, or the production of our suppliers, could be disrupted by labor issues including availability of skilled workforce in locations in which we and our suppliers operate due to competition, absenteeism, public health issues, strikes or other factors. In addition, our production schedules assume the availability of sufficient workforce in areas in which our facilities operate at anticipated labor rates. If sufficient workforce is not available or rates are higher than we anticipate, it could have an adverse effect on our net sales, financial condition, profitability and/or cash flows.
Our dependency on contracts with U.S. and foreign government agencies subjects us to a variety of risks that could materially reduce our revenues or profits.
We are dependent on U.S. and foreign government contracts for a substantial portion of our business. Approximately 20% of our net sales in 2024 were to the U.S. government. That business is subject to the following risks, among others, that could have a material adverse effect on our operating performance:
•The Weapon Systems Acquisition Reform Act and the Competition in Contracting Act require competition for U.S. defense programs in most circumstances. Competition for U.S. Department of Defense (DoD) programs that we currently have has resulted and could in the future result in the U.S. government awarding future contracts to another manufacturer or could result in the U.S. government awarding the contracts to us at lower prices and operating margins than we experience under the current contracts. As an example, in February 2023, the DoD awarded the Joint Light Tactical Vehicles (JLTV) Family of Vehicles follow on contract to another company based on, at least in part, a lower price.
•We may not receive the contracts that we expect. While we anticipate our contract for the Family of Medium Tactical Vehicles (FMTV) program will be extended and that the extension would include higher pricing to reflect current material costs and more robust economic price adjustment clauses to protect us if we experience rapid inflation in the future, there is no assurance that the contract will be extended or that any extension will include an economic price adjustment clause sufficient to protect us from inflation in the future. In addition, although we believe there is demand from international customers for our tactical wheeled vehicles, there is no assurance that additional orders will materialize.
•Competitions for U.S. government contracts are intense, and we cannot provide any assurance that we will be successful in current or future procurement competitions in which we participate, as evidenced by the award of the JLTV follow on contract to another company. In addition, the U.S. government has become more aggressive in seeking to acquire the design rights to the Company’s current and potential future programs to facilitate competition for manufacturing our vehicles.
•Most of our contracts with the DoD are multi-year firm, fixed-price contracts. These contracts typically contain annual sales price increases. We attempt to limit the risk related to raw material price fluctuations for major defense components by obtaining firm pricing from suppliers at the time a contract is awarded. However, if these suppliers do not honor their contracts, then we could face profit margin pressure. Furthermore, if our actual costs on any of these contracts exceed our projected costs, it could result in profits lower than historically realized or than we anticipate.
•We must spend significant sums on product development and testing, bid and proposal activities, and pre-contract engineering, tooling and design activities in competitions to have the opportunity to be awarded these contracts.
•Our Defense segment results may fluctuate significantly from time to time as a result of the start and completion of existing and new domestic and international contract awards that we may receive. A majority of our contracts in the Defense segment are large in size and require significant personnel and production resources, and when our government customers allow such contracts to expire or significantly reduce their vehicle requirements under such contracts, we must make adjustments to personnel and production resources. Production on the domestic JLTV contract is expected to conclude early 2025. We may incur costs in connection with the completion and wind down of that program. In addition, while we expect NGDV sales to offset the reduction in JLTV sales, we may not be able to increase NGDV production to fully offset the decline in JLTV sales and operating income.
•Our business is susceptible to changes in the annual U.S. defense budget. Such changes may reduce revenues that we expect in our Defense segment, especially in light of federal budget pressures, lower levels of U.S. ground troops deployed in foreign conflicts and the level of defense funding that will be allocated to the DoD’s tactical wheeled vehicle strategy generally.
•Certain of our U.S. government contracts could be delayed or terminated, and all such contracts expire in the future and may not be replaced, which could reduce revenues that we expect under the contracts and negatively affect margins in our Defense segment.
•The funding of DoD programs is subject to an annual congressional budget authorization and appropriations process. In years when the U.S. government has not completed its budget process before the end of its fiscal year, which is currently the case for the U.S. government's fiscal 2025 budget, government operations are typically funded
pursuant to a “continuing resolution,” which allows federal government agencies to operate at spending levels approved in the previous budget cycle but does not authorize new spending initiatives. When the U.S. government operates under a continuing resolution, delays can occur in the procurement of the products, services and solutions that we provide and may result in new initiatives being delayed or canceled, or funds could be reprogrammed away from our programs to pay for higher priority operational needs. The current continuing resolution funding the U.S. government expires on March 14, 2025. Furthermore, in years when the U.S. government fails to complete its budget process or to provide for a continuing resolution, a federal government shutdown may result. This could in turn result in the delay or cancellation of key programs, which could have a negative effect on our cash flows and adversely affect our future results. In addition, payments to contractors for services performed during a federal government shutdown may be delayed, which would have a negative effect on our cash flows.
•As a U.S. government contractor, our DoD contracts and systems are subject to audit and review by the Defense Contract Audit Agency and the Defense Contract Management Agency. These agencies review our performance under our U.S. government contracts, our cost structure and our compliance with laws and regulations applicable to U.S. government contractors. Systems that are subject to review include, but are not limited to, our accounting systems, estimating systems, material management systems, earned value management systems, purchasing systems and government property systems. If improper or illegal activities, errors or system inadequacies come to the attention of the U.S. government, as a result of an audit or otherwise, then we may be subject to civil and criminal penalties, contract adjustments and/or agreements to upgrade existing systems as well as administrative sanctions that may include the termination of our U.S. government contracts, forfeiture of profits, suspension of payments, fines and, under certain circumstances, suspension or debarment from future U.S. government contracts for a period of time. Whether or not illegal activities are alleged and regardless of materiality, the U.S. government also has the ability to decrease or withhold certain payments when it deems systems subject to its review to be inadequate. These laws and regulations affect how we do business with our customers and, in many instances, impose added costs on our business.
•Defense tactical wheeled vehicles contract awards that we receive may be subject to protests or lawsuits by competing bidders, which protests or lawsuits, if successful, could result in the U.S. government customer revoking part or all of any defense tactical wheeled vehicle contracts it awards to us and our inability to recover amounts we have expended in anticipation of initiating production under any such contract.
Our results could be adversely affected by severe weather, natural disasters, and other events in the locations in which we or our customers or suppliers operate.
We have manufacturing and other operations in locations prone to severe weather and natural disasters, including tornados, earthquakes, floods, fires, hurricanes, tsunamis or severe snowstorms, that could disrupt our operations. Our suppliers and customers also have operations in such locations. Severe weather, a natural disaster or other conditions or events that result in a prolonged disruption to our operations, or the operations of our customers or suppliers, could delay delivery of parts, materials or components to us or sales to our customers and could have a material adverse effect on our net sales, financial condition, results of operations and/or cash flows.
Consolidation within our customer and dealer bases may impact our strategy, pricing and product margins.
Significant consolidation in our customer and dealer bases could enhance the influence of customers and dealers over our business strategy. Intensified consolidation in the industries we serve may provide our customers and dealers with additional leverage in negotiations around our product and service offerings. For example, the Access segment’s largest customers are rental companies that serve the end user equipment rental markets. Should access equipment customers consolidate through mergers and acquisitions, or should larger access equipment customers continue to grow through the acquisition of smaller rental companies, the buying influence of access equipment customers may grow and may impact the competitive environment within the industry. Similarly, the municipal fire apparatus market distribution channel is comprised of a relatively small number of dealers that, if they were to consolidate, may create additional pricing pressure, as well as concentrated credit exposures, as our reliance on a smaller group of larger individual dealerships increases. If that trend in customer and dealer consolidation continues, it could have an unfavorable impact on our pricing and product margins.
Disruptions within our dealer network could adversely affect our business.
Although we sell the majority of our products directly to the end user, we market, sell and service products through a network of independent dealers in the Vocational segment and in a limited number of markets in the Access segment. As a result, our business with respect to these products is influenced by our ability to establish and manage new and existing relationships with dealers. While we have relatively low turnover of dealers, from time to time, we or a dealer may choose to terminate the relationship as a result of difficulties that our independent dealers experience in operating their businesses due to economic conditions or other factors or as a result of an alleged failure by us or an independent dealer to comply with the terms of our dealer agreement. We do not believe our business is dependent on any single dealer, the loss of which would have a sustained material adverse effect upon our business. However, disruption of dealer coverage within a specific state or other geographic market could cause difficulties in marketing, selling or servicing our products and have an adverse effect on our net sales, financial condition, results of operations and/or cash flows.
In 2024, we transitioned our non-fleet refuse and recycling collection vehicle business from factory direct sales to a dealer network. There is no assurance that the dealers will be successful in selling refuse and recycling collection vehicles. If the transition of our refuse and recycling collection vehicle business is not as successful as we anticipate, it could have an adverse effect on our net sales, financial condition, results of operations and/or cash flows.
In addition, our ability to terminate our relationship with a dealer is limited due to state dealer laws, which generally provide that a manufacturer may not terminate or refuse to renew a dealer agreement unless it has first provided the dealer with required notices. Under many state laws, dealers may protest termination notices or petition for relief from termination actions. Responding to these protests and petitions may cause us to incur costs and, in some instances, could lead to litigation resulting in lost opportunities with other dealers or lost sales opportunities, which may have an adverse effect on our net sales, financial condition, results of operations and/or cash flows.
Competition and Strategy Risks
We face significant competition in the markets we serve.
The markets in which we operate are highly competitive. We compete worldwide with a number of other manufacturers that produce and sell similar products. Our products primarily compete on the basis of brand awareness, product innovation, performance, quality, reliability, availability, price, service and support, ability to meet customer specifications and the extent to which a company offers single-source customer solutions. Certain of our competitors have greater financial, marketing, manufacturing, distribution and governmental affairs resources than we do, which may put us at a competitive disadvantage. We also face pricing pressure from international competitors that attempt to gain domestic market share through importing and selling products at below market prices, particularly in the Access segment. If competition in our industry intensifies or if our current competitors lower their prices for competing products, we may lose sales or be required to lower the prices we charge for our products. We cannot provide any assurance that our products will continue to compete effectively with the products of competitors or that we will be able to retain our customer base or improve or maintain our profit margins on sales to our customers.
Our long-term license agreement with Caterpillar Inc. to produce Caterpillar branded telehandlers ended in the fourth quarter of 2024. Caterpillar-branded telehandlers accounted for $315 million in sales in 2024. If we are unable to replace the Caterpillar-branded revenue through sales of our other telehandlers, including our new agricultural telehandlers, then the expiration of the Caterpillar license could have a material adverse effect on our net sales, financial condition, results of operations and/or cash flows.
We may not realize all of the anticipated benefits of our acquisitions.
We are continuously evaluating potential acquisitions to support our business strategy. For example, in August 2023, we completed our acquisition of AeroTech, and in September 2024, we completed our acquisition of AUSACORP S.L. (AUSA). As part of this evaluation process, we perform due diligence to identify potential risks associated with the potential transaction.
We also make assumptions regarding future performance of the acquired business. We cannot provide any assurance we will be able to successfully achieve the benefits of any business acquisition due to a variety of risks, including the following:
•Our ability to identify acquisition targets and consummate transactions;
•Our failure to achieve the acquisition’s expected future financial performance or realize assumed efficiencies or assumed cost reductions;
•There may be a mismatch in workplace cultures between us and the acquired business;
•We may experience delays or unexpected difficulties in integrating the acquired business;
•We may incur unforeseen expenses or liabilities or may be subject to other unanticipated regulatory or government actions related to the acquired business; and
•We may incur higher transaction costs than expected.
If we are unable to continue to enhance existing products and develop new products that respond to customer needs and preferences, we may experience a decrease in demand for our products and our business could suffer.
One of our growth strategies is emphasizing our new product development as we seek to expand sales and margins by leading our core markets in the introduction of new or improved products and technologies or expanding our product portfolio into adjacent markets. Our ability to match product improvements and new product offerings to diverse global customers’ anticipated needs for different types of products and various product features and functions, at acceptable prices, is critical to our success. We may not be able to compete as effectively, and ultimately satisfy the needs and preferences of our customers, unless we can continue to improve existing products and develop new innovative products in the global markets in which we compete. While we spent $169 million for research and development in 2024, we cannot provide any assurance that this level of investment in research and development will be sufficient to maintain our competitive strength in product innovation, which could cause our business to suffer. Product improvements and new product introductions also require significant planning, design, development and testing at the technological, product and manufacturing process levels, and we may not be able to timely develop product improvements or new products. Our competitors’ new products may arrive in the market before our products arrive and be more attractive with more features and functions and/or lower prices than our products. If we are unable to provide continued technological improvements in our products that meet our customers’ or the industry’s expectations, then demand for our products could be adversely affected.
In response to legislative, regulatory, investment community and societal concerns regarding global climate change and related efforts to limit greenhouse gas emissions, including changes in customer preferences and changes in regulations, we face greater pressure to develop products that generate less greenhouse gas emissions. Many manufacturers foresee sales of electric-powered vehicles and mobile equipment becoming increasingly important to their businesses, and we may not have the expertise or resources to successfully address these pressures on a cost-effective basis. Continued development of enhanced propulsion choices will require us to spend additional funds on research and development and subject us to the risk that our competitors may respond to these pressures in a manner that gives them a competitive advantage. If we do not accurately predict, prepare for and respond to new kinds of technological innovations with respect to electric-powered vehicles or mobile equipment and other technologies that minimize emissions, competition from others could make our specialty vehicles or mobile equipment less desirable in the marketplace.
We are subject to fluctuations in exchange rates associated with our non-U.S. operations that could adversely affect our results of operations and may significantly affect the comparability of our results between financial periods.
Approximately 14% of our net sales in 2024 were attributable to products sold outside of the United States, of which approximately 40% involved export sales from the United States. The majority of export sales are denominated in U.S. dollars. Sales that originate outside the United States are typically transacted in the local currencies of those countries. Fluctuations in foreign currency can have an adverse impact on our sales and profits as amounts that are measured in foreign currency are translated to U.S. dollars. We have sales of inventory denominated in U.S. dollars to certain of our subsidiaries that have functional currencies other than the U.S. dollar. The exchange rates between many of these currencies and the U.S. dollar have fluctuated significantly in recent years and may fluctuate significantly in the future. Such fluctuations, in particular those with
respect to the Euro, the Chinese renminbi, the Canadian dollar, the Mexican peso, the Australian dollar and the British pound sterling may have a material effect on our net sales, financial condition, profitability and/or cash flows and may significantly affect the comparability of our results between financial periods. In addition, any further appreciation in the value of the U.S. dollar in relation to the value of the local currency of those countries where our products are sold will continue to increase our costs of goods in our foreign operations, to the extent such costs are payable in U.S. dollars, and impact the competitiveness of our product offerings in international markets.
We may not be able to expand international operations or increase sales and profitability consistent with our growth targets.
Expanding international operations and sales is a part of our growth strategy. International operations and sales are subject to various risks, including political, religious and economic instability, the imposition of foreign tariffs upon our products (which include tariffs in response to tariffs that the U.S. imposes) and other trade barriers, the impact of foreign government regulations and the effects of income and withholding taxes, sporadic order patterns, governmental expropriation, uncertainties or delays in collection of accounts receivable and differences in business practices. Changes in international trade policies could result in changes to our international operations and/or international growth strategy. We may incur increased costs, including increased supply chain costs, and experience delays or disruptions in production schedules, product deliveries or payments in connection with international manufacturing and sales that could cause loss of revenues and earnings. Among other things, there are additional logistical requirements associated with international sales, which increase the amount of time between the completion of production and our ability to recognize related revenue. In addition, expansion into foreign markets requires the establishment of distribution networks and may require modification of products to meet local requirements or preferences. Establishment of distribution networks or modification to the design of our products to meet local requirements and preferences may take longer or be more costly than we anticipate and could have a material adverse effect on our ability to achieve international sales growth. In addition, our entry into certain markets that we wish to enter may require us to establish a joint venture or face competition from foreign state-backed competitors. Identifying an appropriate joint venture partner and creating a joint venture could be more time consuming, more costly and more difficult than we anticipate. Local government policy and influence can also impact international competition, such as in China where a state-controlled economy favors local market participants.
Financial Risks
We are subject to changes in contract estimates.
We account for substantially all long-term contracts in the Defense segment utilizing the cost-to-cost method of percentage-of-completion accounting. This accounting requires judgment relative to assessing risks, estimating revenues and costs and making assumptions regarding the timing of receipt of delivery orders from our government customers and technical issues. Due to the size and nature of these contracts, the estimate of costs is complicated and subject to many variables. We must make assumptions regarding expected increases in material costs, wages and employee benefits, engineering hours, productivity and availability of labor and allocated fixed costs. Changes to production costs, overhead rates, learning curves and/or supplier performance can also impact these estimates. For example, cumulative catch-up adjustments on contracts in the Defense segment negatively impacted operating income by $47 million in 2024. Furthermore, under the revenue recognition accounting rules, we can only include units in our estimates of overall contract profitability after we have received a firm delivery order for those units. Because new orders have the potential to significantly change the overall profitability of cumulative orders received to date, the period in which we receive those orders from the government will impact the estimated life-to-date contract profitability. Changes in underlying assumptions, circumstances or estimates could have a material adverse effect on our net sales, financial condition and/or profitability.
We may experience losses in excess of our recorded reserves for doubtful accounts and guarantees of indebtedness of others.
As of December 31, 2024, we had consolidated gross receivables of $1.3 billion. In addition, we were subject to obligations to guarantee customer indebtedness to third parties of $596 million, under which we estimate our maximum exposure to be $96 million. We evaluate the collectability of receivables and our guarantees of indebtedness of others based on a combination of factors and establish reserves based on our estimates of potential current and future losses. In circumstances where we believe it is probable that a specific customer will have difficulty meeting its financial obligations, a specific reserve is recorded to reduce the net recognized receivable to the amount we expect to collect, and/or we recognize a liability for a guarantee we
expect to pay, taking into account any amounts that we would anticipate realizing if we are forced to repossess the equipment that supports the customer’s financial obligations to us. We also establish additional reserves based upon our perception of the quality of the current receivables, the current financial position of our customers, past collections experience, and existing and future market conditions. Prolonged or more severe economic weakness may result in additional requirements for reserves. During periods of economic weakness, the collateral underlying our guarantees of indebtedness of customers or receivables can decline sharply, thereby increasing our exposure to losses. We also face a concentration of credit risk as the Access segment’s ten largest debtors at December 31, 2024 represented approximately 22% of our consolidated gross receivables. Some of these customers are highly leveraged. We may incur losses in excess of our recorded reserves if the financial condition of our customers were to deteriorate or the full amount of any anticipated proceeds from the sale of the collateral supporting our customers’ financial obligations is not realized. Our cash flows and overall liquidity may be materially adversely affected if any of the financial institutions that finance our customer receivables become unable or unwilling, due to unfavorable economic conditions, a weakening of our or their financial position or otherwise, to continue providing such credit.
An impairment in the carrying value of goodwill and other indefinite-lived intangible assets could negatively affect our operating results.
We have a substantial amount of goodwill and other indefinite-lived intangible assets on our balance sheet as a result of acquisitions we have completed. At December 31, 2024, approximately 77% of these intangibles were concentrated in the Access segment. We evaluate goodwill and indefinite-lived intangible assets for impairment annually, or more frequently if potential interim indicators exist that could result in impairment. Events and conditions that could result in impairment include a prolonged period of global economic weakness, a decline in economic conditions or a slow, weak economic recovery, a sustained decline in the price of our common stock, adverse changes in the regulatory environment, adverse changes in the market share of our products, adverse changes in interest rates, or other factors leading to reductions in the long-term net sales or profitability that we expect. For example, in the second quarter of 2024, we identified interim indicators of impairment for the Pratt Miller reporting unit as a result of unfavorable performance compared to forecast and adverse market conditions leading to a decline in the Company's expectations for future performance of Pratt Miller. Our subsequent testing indicated that intangible asset impairments of $51.6 million were required. Determination of the fair value of a reporting unit includes developing estimates which are highly subjective and incorporate calculations that are sensitive to minor changes in underlying assumptions. Management’s assumptions change as more information becomes available. Changes in these events and conditions or other assumptions could result in an impairment charge in the future, which could have a significant adverse impact on our reported earnings.
Financing costs and restrictive covenants in our current debt facilities could limit our flexibility in managing our business and increase our vulnerability to general adverse economic and industry conditions.
Our access to debt financing at competitive risk-based interest rates is partly a function of our credit ratings. A downgrade to our credit ratings could increase our interest rates, could limit our access to public debt markets, could limit the institutions willing to provide us credit facilities, and could make any future credit facilities or credit facility amendments more costly and/or difficult to obtain. In addition, our revolving credit facility is subject to variable interest rates. An increase in general interest rates would also increase our cost of borrowing under our credit agreement.
Our credit agreement contains financial and restrictive covenants which, among other things, require us to maintain a leverage ratio. Our ability to meet the leverage ratio may be affected by a number of risks or events, including the risks described in this Annual Report on Form 10-K and events beyond our control. The indentures governing our senior notes also contain restrictive covenants. Any failure by us to comply with these restrictive covenants or the financial and restrictive covenants in our credit agreement could have a material adverse effect on our financial condition, results of operations and debt service capability.
Additional liabilities relating to changes in tax rates or exposure to additional income tax liabilities could adversely impact our financial condition and cash flow.
We are subject to income taxes in the U.S. and various non-U.S. jurisdictions. Our domestic and international tax liabilities are dependent upon the location of earnings among these different jurisdictions. Changes in our effective tax rate as a result of changes in tax laws or regulations and judicial or regulatory interpretations of those laws or regulations, the mix of earnings in
countries with differing statutory tax rates, changes in overall profitability, changes in U.S. generally accepted accounting principles, or changes in the valuation of deferred tax assets could adversely affect our future results of operations. In addition, certain tax policy efforts, including any tax law changes resulting from the Organization for Economic Cooperation and Development and the G20's inclusive framework on Base Erosion and Profit Sharing, could adversely impact our tax rate and subsequent tax expense. In addition, the amount of income taxes that the Company pays is subject to ongoing audits by U.S. federal, state and local tax authorities and by non-U.S. tax authorities. If these audits result in assessments different from amounts that the Company has reserved for potential tax liabilities, future financial results may include unfavorable adjustments to the Company’s tax liabilities, which could have a material adverse effect on the Company’s results of operations.
Cybersecurity Risks
Increased cybersecurity threats and more sophisticated computer crime pose a risk to our systems, networks, operations, products and services.
We rely extensively on information technology systems and networks, some of which third parties manage, supporting a variety of business activities. Operating these information technology systems and networks and processing and maintaining related data in a secure manner is critical to our business operations and strategy. Information technology security threats, from user error to cybersecurity attacks designed to gain unauthorized access to our systems, networks and data, are increasing in frequency and sophistication. Cybersecurity attacks may range from random attempts to coordinated and targeted attacks, including sophisticated computer crime and advanced persistent threats. These threats pose a risk to the security of our systems and networks and the confidentiality, availability and integrity of our data. Cybersecurity attacks could also include attacks targeting the security, integrity and/or reliability of the hardware and software that we have installed in our products. It is possible that our information technology systems and networks, or those that third parties manage or provide, could have vulnerabilities, which could go unnoticed for a period of time. Further, as a defense contractor, we face many cyber and security threats that can range from attacks common to most industries, which could have financial or reputational consequences, to advanced persistent threats on our defense programs, which could involve information that is considered a matter of national security. While we have utilized and continue to utilize various procedures and controls to mitigate such risks, we cannot assure that the actions and controls we have implemented and are implementing, or that we cause or have caused third-party service providers to implement, will be sufficient to protect our systems, information or other property. We have experienced cybersecurity threats and vulnerabilities in our systems and those of our third-party providers, and we have experienced viruses and attacks targeting our information technology systems and networks. Such prior events have not had a material impact on our financial condition, results of operations or liquidity. However, the potential consequences of a future material cybersecurity attack may include reputational damage, litigation with third parties, government enforcement actions, penalties, disruption to our systems or operations of our facilities, unauthorized release of confidential or otherwise protected information, corruption of data, diminution in the value of our investment in research, development and engineering, increased cybersecurity protection costs and unplanned investigation, remediation and other costs, which in turn could adversely affect our competitiveness, results of operations and financial condition.
Legal and Regulatory Risks
Our international sales and operations subject us to risks that may have a material adverse effect on our business.
As a result of our international operations and sales, we are subject to the Foreign Corrupt Practices Act (FCPA) and other laws that prohibit improper payments or offers of payments to foreign governments and their officials for the purpose of obtaining or retaining business. Our international activities create the risk of unauthorized payments or offers of payments in violation of the FCPA by one of our employees, consultants, sales agents or distributors, because these parties are not always subject to our control. Any violations of the FCPA could result in significant fines, criminal sanctions against us or our employees, and prohibitions on the conduct of our business, including our business with the U.S. government. We are also increasingly subject to export control regulations, including, but not limited to, the United States Export Administration Regulations and the International Traffic in Arms Regulations. Unfavorable changes in the political, regulatory or business climate could have a material adverse effect on our net sales, financial condition, profitability and/or cash flows.
We may be required to make material expenditures or incur additional liabilities to comply with changes in environmental laws or climate change regulations or to meet the increasing societal expectations on companies to address climate change.
Both our products and the operation of our manufacturing facilities are subject to statutory and regulatory requirements. These include environmental requirements applicable to manufacturing and vehicle emissions, government contracting regulations, regulations impacting our supply chain and domestic and international trade regulations. A significant change to these regulatory requirements could substantially increase manufacturing costs, which could make our business results more variable.
Climate change attributed to increased levels of greenhouse gases, including carbon dioxide, has led to significant legislative, regulatory, investment community and societal efforts to limit greenhouse gas emissions. These considerations may lead to new international, national, regional and/or local legislation or regulatory responses. The legislation or regulation of greenhouse gases could result in unfavorable financial impacts through various forms including taxation, emission allowances, fines, requirements for investments or facilities improvement, higher energy costs and higher compliance costs associated with complex and evolving federal, state and international public disclosures. The impact of any future greenhouse gas legislation, regulatory, or product standard requirements is unknown, and therefore, we are uncertain of the potential impact that future changes may have.
Our global facilities, operations and products are subject to increasingly stringent environmental laws and regulations, including laws and regulations governing air emissions, noise, releases to soil and discharges to water and the generation, handling, storage, transportation, treatment and disposal of non-hazardous and hazardous waste materials. Certain environmental laws impose strict, retroactive and joint and several liability for the release of hazardous substances, even for conduct that was lawful at the time it occurred, or for the conduct of, or conditions caused by, prior operators, predecessors or other third parties. We could be subject to fines, cleanup costs or other costs or damages under environmental laws if we are not in compliance with environmental regulations. We may be subject to other more stringent environmental laws in the future that could have a material adverse impact on our business, results of operations and financial condition.
The Company has no unresolved staff comments regarding its periodic or current reports from the staff of the SEC that were issued 180 days or more preceding December 31, 2024.
ITEM 1C. CYBERSECURITY
Risk Management and Strategy — The Company maintains a cybersecurity risk management program, led by a Chief Information Security Officer (CISO), who is responsible for the Company’s overall cybersecurity strategy, policy, architecture and cyber threat detection and response. The CISO, who reports to the Company’s Chief Information Officer (CIO), has a Bachelor's degree in Information Systems and Master of Business Administration degree and is a Certified Information Systems Security Professional with over a decade of professional cybersecurity experience. The Company's program is aligned to industry frameworks and controls from the National Institute of Standards and Technology that allow the Company to identify the fundamental security capabilities and controls necessary to maintain and enhance the program. The Company utilizes a wide range of capabilities to maintain cybersecurity, including threat intelligence, multi-factor authentication, endpoint detection and response and security automation.
As part of the cybersecurity risk management program, the Company has a set of Company-wide cybersecurity policies and procedures, including an Acceptable Use Policy as well as other policies covering subjects such as Access Control, Awareness and Training, Audit and Accountability, Configuration Management, Identification and Authentication, Media Protection, System and Communications Protection and Incident Response. These policies and procedures go through an internal review process and are approved by appropriate members of management. The Company requires all personnel, including contingent workers and business partners handling information on the Company’s behalf to follow its cybersecurity policies and procedures. Regular training modules educate the Company’s team members on relevant cyber threats and trends and help prepare them for real-life phishing threats.
The Company implements processes to assess and manage risks associated with using third-party information system service providers. This risk assessment process assesses both the service provider's security posture as well as the security controls available from the third-party information system. The service provider’s security posture assessment includes reviewing any third-party attestations as well as third-party controls in the following areas: assets, data flows, authentication, access, monitoring, response and recovery. Depending on the type of system or data, additional controls may be assessed.
The Company maintains an Incident Response Plan that includes processes for detecting, containing, and responding to incidents including processes for reporting incidents to management and the Board of Directors. The Company periodically performs simulations and tabletop exercises at a management level and incorporates external advisors as needed. The Company engages third-party service providers to conduct evaluations of its security controls, whether through penetration testing, independent audits or consulting on best practices to address cybersecurity risks.
Assessing, identifying and managing cybersecurity-related risks is integrated into the Company's overall Organization Risk Management (ORM) program. Cybersecurity related risks are included in the risk universe that the ORM program evaluates to assess top risks to the enterprise on an annual basis. To the extent the ORM process identifies a heightened cybersecurity related risk, risk owners are assigned to develop risk mitigation plans, which are then tracked to completion.
Governance — The Board of Directors is responsible for general oversight of the Company's risk management program, including cybersecurity risks. The Board of Directors receives an annual report from senior management through the ORM program and material risk assessments and mitigation strategies, including with respect to cybersecurity risks.
The Audit Committee of the Board of Directors oversees management's processes for identifying and mitigating risks, including cybersecurity risks, to help align the Company's risk exposure with its strategic objectives. The CIO provides periodic updates to the Audit Committee on the status of the Company’s cybersecurity risk management program; the Company’s information systems, cybersecurity, data privacy and other risks; and the steps management has taken to identify, monitor and mitigate such risks. The Audit Committee is also briefed on cyber crisis contingency planning, incident recovery capabilities and matters related to any material cybersecurity incident the company may experience.
The Company's business strategy, results of operations and financial condition have not been materially affected by risks from cybersecurity threats, including as a result of previously identified cybersecurity incidents, but the Company cannot provide assurance that it will not be materially affected in the future by cybersecurity risks, threats or incidents. See Item 1A under the caption "Increased cybersecurity threats and more sophisticated computer crime pose a risk to our systems, networks, operations, products and services." for additional information on cybersecurity risks applicable to the Company.
ITEM 2. PROPERTIES
The Company believes its equipment and buildings are well maintained and adequate for its present and anticipated needs. As of December 31, 2024, the Company operated in 31 manufacturing facilities. The locations of the Company’s manufacturing facilities are provided in the table below:
| | | | |
Segment | | U.S. Facilities (# of facilities) | | Facilities Outside the U.S. (# of facilities) |
Access | | McConnellsburg, Pennsylvania (3) (b) | | Tianjin, China (2) (c) |
| | Shippensburg, Pennsylvania (1) | | Leon, Mexico (1) |
| | Jefferson City, Tennessee (1) (a) | | Nogara, Italy (1) |
| | Greencastle, Pennsylvania (1) | | Manresa, Spain (1) |
| | | | Tonneins, France (1) (a) |
| | | | |
Vocational | | Appleton, Wisconsin (2) | | Saint-Georges, Quebec, Canada (1) |
| | Dodge Center, Minnesota (1) | | |
| | Ogden, Utah (1) | | |
| | Bradenton, Florida (1) | | |
| | Orlando, Florida (1) | | |
| | Garner, Iowa (1) | | |
| | Neenah, Wisconsin (1) (a) | | |
| | Kewaunee, Wisconsin (1) | | |
| | Clearwater, Florida (1) (a) | | |
| | Warrenton, Oregon (1) (a) | | |
| | Murfreesboro, Tennessee (1) (a) | | |
| | Riceville, Iowa (1) | | |
| | | | |
Defense | | Oshkosh, Wisconsin (4) | | |
| | Spartanburg, South Carolina (1) (a) | | |
(a)These facilities are leased.
(b)Two facilities are owned, and the other is leased.
(c)One facility is owned, and the other is leased.
The Company’s manufacturing facilities generally operate five days per week on one or two shifts, except for seasonal shutdowns for one- to three-week periods.
The Company also performs contract maintenance services out of multiple warehousing and service facilities owned and/or operated by the U.S. government and third parties, including locations in the U.S., Japan and multiple other countries in Europe and the Middle East.
ITEM 3. LEGAL PROCEEDINGS
The Company is subject to environmental matters and legal proceedings and claims, including patent, antitrust, product liability, warranty and state dealership regulation compliance proceedings that arise in the ordinary course of business. Although the final results of all such matters and claims cannot be predicted with certainty, the Company believes that the ultimate resolution of all such matters and claims will not have a material effect on the Company’s financial condition, results of operations or cash flows.
Personal injury actions and other. At December 31, 2024, the estimated net liabilities for product and general liability claims totaled $45.2 million. Although the final results of all such matters and claims cannot be predicted with certainty, the Company believes that the ultimate resolution of all such matters and claims, after considering the liabilities accrued with respect to all such matters and claims, will not have a material effect on the Company’s financial condition, results of operations or cash flows. Actual results could vary, among other things, due to the uncertainties involved in litigation.
ITEM 4. MINE SAFETY DISCLOSURES
Not applicable.
INFORMATION ABOUT OUR EXECUTIVE OFFICERS
The following table sets forth certain information, as of February 20, 2025, concerning the Company’s executive officers. All of the Company’s executive officers serve terms of one year and until their successors are elected and qualified.
| | | | |
Name | | Age | | Title |
John C. Pfeifer | | 59 | | President and Chief Executive Officer |
Ignacio A. Cortina | | 53 | | Executive Vice President, Chief Legal and Administrative Officer |
Matthew A. Field | | 52 | | Executive Vice President and Chief Financial Officer |
Jayanthi Iyengar | | 63 | | Executive Vice President and Chief Technology and Strategic Sourcing Officer |
Mahesh Narang | | 49 | | Executive Vice President and President, Access Segment |
Michael E. Pack | | 50 | | Executive Vice President and President, Vocational Segment |
Timothy S. Bleck | | 50 | | Senior Vice President and President, Defense Segment |
Bryan K. Brandt | | 56 | | Senior Vice President and Chief Marketing Officer |
Anupam Khare | | 60 | | Senior Vice President and Chief Information Officer |
John C. Pfeifer — Mr. Pfeifer joined the Company in 2019 as Executive Vice President and Chief Operating Officer. In May 2020, Mr. Pfeifer assumed the position of President and Chief Operating Officer of the Company. He was promoted to his current position of President and Chief Executive Officer on April 2, 2021. Prior to joining the Company, he served as Senior Vice President and President - Mercury Marine, of Brunswick Corporation, a designer, manufacturer and marketer of marine engines and marine parts and accessories, from 2014 to 2019. Mr. Pfeifer is a director of James Hardie Industries plc and the National Exchange Bank and Trust, and also serves on the board of trustees at Froedtert ThedaCare Health, Inc.
Ignacio A. Cortina — Mr. Cortina joined the Company in 2006 with the acquisition of JLG. He has held various roles of increasing responsibility, serving as the Company’s Vice President and Deputy General Counsel from 2011 to 2015 and Senior Vice President, General Counsel and Secretary from 2015 to 2016. He was appointed to Executive Vice President, General Counsel and Secretary in 2016. He was appointed Executive Vice President, Chief Legal Officer and Secretary in February 2023. In November 2024, his role expanded to include that of Chief Administrative Officer where he leads the Company's human resources, safety and facilities teams. Mr. Cortina is a director of Alliant Energy Corporation.
Matthew A. Field — Mr. Field joined the Company in December 2024 as Executive Vice President and Chief Financial Officer. Prior to joining the Company, he served as the Chief Financial Officer of Joby Aviation, Inc, an aviation company developing electric vertical takeoff and landing aircraft, since March 2021. Prior to joining Joby Aviation, Mr. Field worked at Ford Motor Company, an automobile manufacturer, for over 20 years. Most recently he served as Chief Financial Officer, North America of Ford from October 2018 through March 2021, Corporate General Auditor from January 2018 through October 2018, and Chief Financial Officer, Lincoln Motor Company from November 2014 through December 2017.
Jayanthi Iyengar — Ms. Iyengar joined the Company in January 2022 as Executive Vice President and Chief Technology and Strategic Sourcing Officer. Prior to joining the Company, she served as Chief Technology and Quality Officer - CNH Industrial N.V., a designer, manufacturer and marketer of agricultural machinery and construction equipment, from 2019 to January 2022. Prior to that, Ms. Iyengar served as Senior Vice President and Chief Innovation & Technology Officer - Xylem Inc., a water technology provider, from 2015 to 2019. Ms. Iyengar is a director of Array Technologies, Inc.
Mahesh Narang — Mr. Narang joined the Company in November 2023 as Executive Vice President and President, Access Segment. Prior to joining the Company, he previously served as Vice President - Cummins Inc., a designer, manufacturer, and distributor of a broad portfolio of power solutions, including as President - Components at Cummins Inc. from 2021 to October 2023. In this role, he was responsible for the strategic direction and led all operational aspects of the company’s global Components business. Components manufactures and sells filtration products, aftertreatment systems, turbochargers, electronics, fuel systems, automated transmissions, axles, drivelines, brakes and suspension systems. Prior to that role, Mr. Narang held positions of increasing responsibility since joining Cummins in 2003, including as President - Cummins Emission Solutions from 2017- 2021. Cummins Emission Solutions is a designer, integrator, manufacturer and distributor of exhaust aftermarket systems and components. Mr. Narang is a director of MOOG Inc.
Michael E. Pack — Mr. Pack joined the Company in 2006 as Senior Director of Financial Analysis and Controls and has served in various assignments in the Access and Vocational segments, including Vice President Finance - Fire & Emergency from 2012 to 2020 and as Executive Vice President and Chief Financial Officer from 2020 to 2024. He was appointed to his current position of Executive Vice President and President, Vocational Segment in June 2024. Mr. Pack is a director of Winnebago Industries, Inc.
Timothy S. Bleck — Mr. Bleck joined the Company in 2006. He has served in various positions of increasing responsibility, including Controller for the Defense segment from 2010 to 2015 and as Vice President Finance, Defense segment from 2015 to 2022. He was appointed to his current position of Senior Vice President and President, Defense Segment in November 2022.
Bryan K. Brandt — Mr. Brandt joined the Company in 2016 as Vice President, Global Branding and Communications. He was appointed to his current position of Senior Vice President and Chief Marketing Officer in September 2018. Prior to joining the Company, he spent more than twenty years with Bemis Company, Inc. (which was subsequently acquired by Amcor plc), a global supplier of flexible packaging, in numerous positions of increasing responsibility, most recently as Vice President of Marketing and Transformation for Bemis North America from 2014 to 2016.
Anupam Khare — Mr. Khare joined the Company in April 2018 as Senior Vice President and Chief Information Officer. He previously served as the Executive Director - Digital Technology at United Technologies Corporation, a global technology products and services company that serves the building systems and aerospace industries, from 2015 to April 2018.
PART II
ITEM 5. MARKET FOR REGISTRANT’S COMMON EQUITY, RELATED STOCKHOLDER MATTERS AND ISSUER PURCHASES OF EQUITY SECURITIES
Common Stock Repurchases
The following table sets forth information with respect to purchases of Common Stock made by the Company or on the Company’s behalf during the fourth quarter of 2024:
| | | | | | | | | | | | | | | | |
Period | | Total Number of Shares
Purchased | | | Average Price
Paid per Share | | | Total Number of Shares
Purchased as
Part of Publicly
Announced Plans or
Programs (1) | | | Maximum Number of
Shares that May Yet Be Purchased
Under the Plans or
Programs (1) | |
October 1 - October 31 | | | — | | | $ | — | | | | — | | | | 10,720,477 | |
November 1 - November 30 | | | — | | | $ | — | | | | — | | | | 10,720,477 | |
December 1 - December 31 | | | 494,069 | | | $ | 101.20 | | | | 494,069 | | | | 10,226,408 | |
Total | | | 494,069 | | | | | | | 494,069 | | | | |
(1)In May 2022, the Board of Directors approved a Common Stock repurchase authorization of 12,000,000 shares. At December 31, 2024, the Company had repurchased 1,773,592 shares under this authorization. As a result, the Company had 10,226,408 shares of Common Stock remaining available for repurchase under the repurchase authorization. The Company can use the current authorization at any time as there is no expiration date associated with the authorization. From time to time, the Company may enter into a Rule 10b5-1 trading plan for the purpose of repurchasing shares under this authorization.
Common Stock Information
The Company’s Common Stock is listed on the New York Stock Exchange (NYSE) under the symbol OSK. As of February 13, 2025, there were 1,850 holders of record of the Common Stock.
Item 12 of this Annual Report on Form 10-K contains certain information relating to the Company’s equity compensation plans.
The following information in this Item 5 is not deemed to be “soliciting material” or to be “filed” with the SEC or subject to Regulation 14A or 14C under the Securities Exchange Act of 1934 (Exchange Act) or to the liabilities of Section 18 of the Exchange Act, and will not be deemed to be incorporated by reference into any filing under the Securities Act of 1933 or the Exchange Act, except to the extent the Company specifically incorporates it by reference into such a filing. The SEC requires the Company to include a line graph presentation comparing cumulative five-year Common Stock returns with a broad-based stock index and either a nationally recognized industry index or an index of peer companies selected by the Company. The Company has chosen to use the Standard & Poor’s MidCap 400 market index as the broad-based index and the companies currently in the Standard Industry Classification Code 371 Index (motor vehicles and equipment) (the SIC Code 371 Index) as a more specific comparison.
The comparisons assume that $100 was invested on September 30, 2019 in each of: the Company’s Common Stock, the Standard & Poor’s MidCap 400 market index and the SIC Code 371 Index. The total return assumes reinvestment of dividends and is adjusted for stock splits. The 2024 return listed in the charts below is based on closing prices per share on December 31, 2024. On that date, the closing price for the Company’s Common Stock was $95.07.
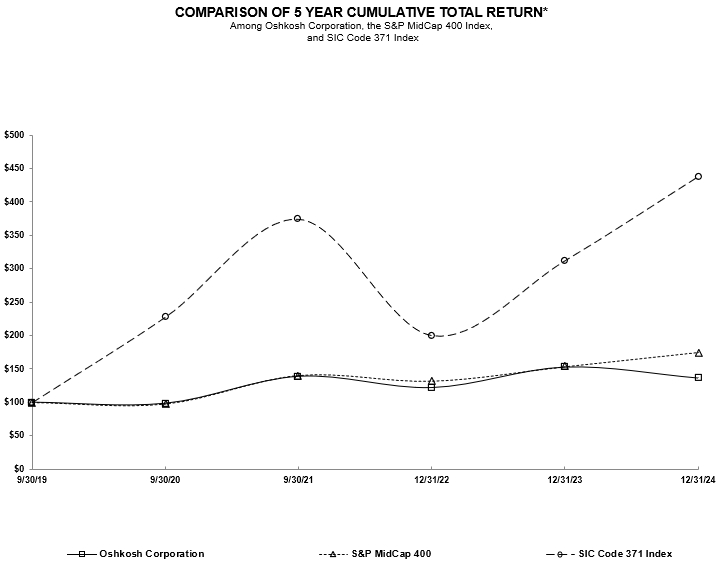
* $100 invested on September 30, 2019 in stock or index, including reinvestment of dividends.
| | | | | | | | | | | | | | | | | | | | |
| | September 30, | | December 31, | |
| | 2020 | | | 2021 | | | 2022 | | | 2023 | | | 2024 | |
Oshkosh Corporation | | $ | 98.48 | | | $ | 138.95 | | | $ | 121.99 | | | $ | 152.77 | | | $ | 136.22 | |
S&P MidCap 400 market index | | | 97.84 | | | | 140.58 | | | | 131.99 | | | | 153.68 | | | | 175.09 | |
SIC Code 371 Index | | | 227.98 | | | | 374.28 | | | | 200.11 | | | | 312.46 | | | | 438.39 | |
ITEM 6. RESERVED
ITEM 7. MANAGEMENT’S DISCUSSION AND ANALYSIS OF FINANCIAL CONDITION AND RESULTS OF OPERATIONS
GENERAL
Oshkosh Corporation is a global industrial technology company dedicated to moving the world forward. As an innovator and integrator, we specialize in the design, development and manufacturing of purpose-built vehicles and equipment, serving everyday heroes. The Company is an innovator, developing and leveraging disruptive technologies across our portfolio in the areas of electrification, autonomy and connectivity, making some of the most challenging jobs in the world safe, smart, connected, quiet, clean and productive — delivering both efficiency and impact. The Company is a leading global designer and manufacturer of aerial work platforms under the “JLG” brand name. The Company is among the worldwide leaders in the design and manufacturing of telehandlers under the “JLG” and “SkyTrak” brand names. Under the “Jerr-Dan” brand name, the Company is a leading domestic designer and manufacturer of towing and recovery equipment. Under the “Pierce” and "Maxi-Metal" brand names, the Company is among the leading global designers and manufacturers of municipal fire trucks assembled on both custom and commercial chassis. Under the “Jetway,” brand name, the Company is one of the leading global designers and manufacturers of aircraft passenger boarding bridges. Under the “Commander,” “LEKTRO” and "Tempest" brand names, the Company is one of the leading global designers and manufacturers of airport ground support equipment. The Company designs and manufactures Aircraft Rescue and Firefighting (ARFF) vehicles under the “Oshkosh” brand name. Under the “McNeilus” brand name, the Company designs and manufactures a wide range of automated, rear, front, side and top loading refuse and recycling collection vehicles. Under the “IMT” brand name, the Company is a leading domestic designer and manufacturer of field service vehicles and truck-mounted cranes. Under the “Frontline” brand name, the Company is a leading domestic designer, manufacturer and marketer of command vehicles. Under the “Oshkosh” brand name, the Company designs and manufactures front-discharge concrete mixers. The Company manufactures defense trucks under the “Oshkosh” brand name and is a leading designer and manufacturer of severe-duty, tactical wheeled vehicles for the U.S. Department of Defense (DoD) and other militaries. The Company also designs and manufactures delivery vehicles for the United States Postal Service (USPS) under the “Oshkosh” brand name.
Major products manufactured and marketed by each of the Company’s business segments are as follows:
Access — aerial work platforms and telehandlers used in a wide variety of construction, industrial, agricultural, vegetation management and maintenance applications to position workers and materials at elevated heights. Access customers include equipment rental companies, construction contractors, manufacturing companies and home improvement centers. The Access segment also manufactures carriers and wreckers sold to towing companies.
Vocational — custom and commercial firefighting vehicles and equipment; aviation ground support products, gate equipment and airport services provided to commercial airlines, airports, air-freight carriers, ground handling customers and the military; aircraft rescue and firefighting (ARFF) vehicles; refuse and recycling collection vehicles sold to commercial and municipal waste haulers; field service vehicles and truck-mounted cranes sold to mining, construction and other companies; simulators, mobile command and control vehicles and other emergency vehicles primarily sold to fire departments, airports and other governmental units and front-discharge concrete mixers sold to ready-mix companies.
Defense — tactical vehicles, trailers, weapons system integration and parts sold to the U.S. military and to other militaries around the world and delivery vehicles for the United States Postal Service (USPS).
All estimates referred to in this “Management’s Discussion and Analysis of Financial Condition and Results of Operations” refer to the Company’s estimates as of February 20, 2025.
BASIS OF PRESENTATION
In July 2024, the Company moved the reporting responsibility for Pratt Miller from its Defense segment to the Chief Technology and Strategic Sourcing Officer to better utilize Pratt Miller’s expertise across the entire Oshkosh Corporation enterprise. Pratt Miller results are now reported within "Corporate and other." All historical information has been recast to reflect this change.
OVERVIEW
The Company delivered another successful year in 2024, demonstrating significant progress in its strategy to drive meaningful growth across the Company's businesses and to position Oshkosh for long-term success and shareholder value creation. Net sales grew in each of the Company's segments during the year, led by the Vocational segment. The Company also significantly improved profitability during the year, delivering operating income of $1.01 billion, or 9.4% of sales, in 2024, compared to $0.84 billion, or 8.7% of sales, in 2023. Diluted earnings per share also increased 14% to $10.35 per share.
The Company's success in 2024 was also highlighted by its progress on strategic priorities, each of which advances the Company's purpose — to make a difference in the lives of those who build, serve and protect communities across the globe. In April 2024, the Company reached a significant milestone in its partnership with the USPS as the Company began shipping its Next Generation Delivery Vehicle (NGDV). The Company expects to increase NGDV production throughout 2025 to reach full rate production by the start of 2026. The NGDV program is expected to be a meaningful contributor to profitable growth for the remainder of the decade. In addition to NGDV, Oshkosh also expanded its product portfolio by launching its all-electric, fully integrated Volterra refuse and recycling vehicles. Oshkosh showcased these innovative products and its technology for everyday heroes during its inaugural appearance at the CES trade show in January 2025.
The Company also focused on its strategic acquisitions. The Vocational segment continued the integration of its AeroTech business, and AeroTech contributed meaningfully to the Company's growth and broadened the end markets that the Company serves. The strategic acquisition of AeroTech increased the Company's participation in the attractive air transportation support market, an industry that continues to have strong secular growth projections. The Company also completed the acquisition of AUSACORP S.L. (AUSA), a European manufacturer of specialty equipment including wheeled dumpers, rough terrain forklifts and telehandlers, for $114.5 million during the third quarter of 2024. The acquisition supports the Company's accelerated growth strategy, strengthens the Access segment's equipment portfolio and enhances the Company's ability to serve customers globally. AUSA is a market leader in Spain, which serves adjacent new markets for Oshkosh, including vegetation management, expands the Company's agricultural presence and complements the Access segment's traditional access equipment markets.
Oshkosh also continued investing in growth through capital expenditures of $281 million, which included continued investment in the Company's production capabilities at its facilities in Tennessee and South Carolina. The Company also invested $169 million in research and development, an increase of nearly 30% compared to the previous year. Oshkosh believes these investments help to position the Company for long-term success and shareholder value creation.
The Company announced an increase in its quarterly dividend rate of 10.9%, to $0.51 per share, beginning in the first quarter of 2025. This was the Company’s eleventh straight year of a double-digit percentage increase to its dividend rate.
2025 OUTLOOK
The Company estimates consolidated sales will be approximately $10.6 billion in 2025, compared to $10.7 billion in 2024. The Company expects consolidated operating income will be approximately $990 million, resulting in diluted earnings per share of approximately $10.30. Included in the Company's expectations is amortization of intangible assets of approximately $60 million, or $0.70 per share. Excluding amortization of intangible assets, the Company expects adjusted diluted earnings per share to be approximately $11.00. The Company's estimates assume that present levels of tariff rates, raw material prices and supply chain performance continue into 2025 without significant disruption.
The Company expects Access segment sales will be approximately $4.4 billion in 2025, a decrease of approximately 15% compared to 2024 sales reflecting market conditions in North America and Europe and conclusion of the agreement to produce Caterpillar-branded telehandlers. The Company expects operating margin in the Access segment in 2025 will be approximately 12.5%, down from 15.6% in 2024 as a result of adverse sales mix and the impact of lower sales levels on fixed costs.
The Company expects Vocational segment sales of approximately $3.8 billion in 2025, an increase of approximately 15% compared to 2024 sales reflecting expected increases in production volume and pricing. The Company expects Vocational segment operating margin in 2025 will be approximately 14.0%, compared to 12.0% in 2024. The segment's operating margin is expected to increase in 2025 as a result of expected continued favorable price/cost dynamics. Customer orders in backlog for delivery in 2025 were booked at significantly higher prices.
The Company expects Defense segment sales will be approximately $2.3 billion in 2025, an increase of approximately 7% compared to 2024 sales. The Company's estimates reflect the expected ramp-up of NGDV production, offset in part by the completion of production on the domestic Joint Light Tactical Vehicle (JLTV) contract in early 2025. The Company expects Defense segment operating margin will be approximately 4.0% in 2025, compared to 2.4% in 2024, as a result of lower adverse cumulative catch-up adjustments and the ramp-up of NGDV production.
The Company estimates corporate and other costs in 2025 will be approximately $185 million. The Company estimates net interest expense will be approximately $120 million in 2025, compared to $112 million in 2024. The Company estimates the tax rate for 2025 will be approximately 23.5% and the average share count will be approximately 65.0 million shares.
The Company expects earnings per share in the first quarter of 2025 will be approximately $1.75, reflecting the Company's expectations for softness and seasonality in the access equipment markets.
RESULTS OF OPERATIONS- 2024 COMPARED WITH 2023
CONSOLIDATED RESULTS
The following table presents consolidated results (in millions):
| | | | | | | | | | | | | | | | |
| | Year Ended December 31, | |
| | 2024 | | | 2023 | | | Change | | | % Change | |
Net sales | | $ | 10,730.2 | | | $ | 9,657.9 | | | $ | 1,072.3 | | | | 11.1 | % |
Cost of sales | | | 8,760.8 | | | | 7,977.1 | | | | 783.7 | | | | 9.8 | % |
Gross income | | | 1,969.4 | | | | 1,680.8 | | | | 288.6 | | | | 17.2 | % |
% of sales | | | 18.4 | % | | | 17.4 | % | | 100 bps | | | | |
Selling, general and administrative | | | 852.4 | | | | 810.4 | | | | 42.0 | | | | 5.2 | % |
Amortization of purchased intangibles | | | 54.7 | | | | 32.8 | | | | 21.9 | | | | 66.8 | % |
Intangible asset impairments | | | 51.6 | | | | — | | | | 51.6 | | | | 100.0 | % |
Operating income | | | 1,010.7 | | | | 837.6 | | | | 173.1 | | | | 20.7 | % |
% of sales | | | 9.4 | % | | | 8.7 | % | | 70 bps | | | | |
The following table presents net sales by geographic region based on product shipment destination (in millions):
| | | | | | | | | | | | | | | | |
| | Year Ended December 31, | |
| | 2024 | | | 2023 | | | Change | | | % Change | |
United States | | $ | 9,001.6 | | | $ | 7,830.2 | | | $ | 1,171.4 | | | | 15.0 | % |
Other North America | | | 468.6 | | | | 386.6 | | | | 82.0 | | | | 21.2 | % |
Europe, Africa and Middle East | | | 837.4 | | | | 948.6 | | | | (111.2 | ) | | | -11.7 | % |
Rest of the World | | | 422.6 | | | | 492.5 | | | | (69.9 | ) | | | -14.2 | % |
Consolidated | | $ | 10,730.2 | | | $ | 9,657.9 | | | $ | 1,072.3 | | | | 11.1 | % |
Consolidated sales increased as a result of higher organic volume in all three segments ($544 million), the inclusion of sales related to the AeroTech and AUSA acquisitions ($473 million) and higher pricing ($166 million), partially offset by the impact of the sale of the rear-discharge concrete mixer business ($65 million) and changes in cumulative catch-up adjustments on contracts in the Defense segment ($48 million).
The increase in consolidated gross margin was due to improved pricing (120 basis points), offset in part by changes in cumulative catch-up adjustments on contracts in the Defense segment (50 basis points).
The increase in consolidated selling, general and administrative expenses was primarily a result of operating costs related to acquired businesses ($52 million), offset in part by lower incentive compensation costs ($14 million).
Amortization of purchased intangible assets increased primarily due to the acquisitions of AeroTech in August 2023 and AUSA in September 2024.
Intangible asset impairment charges relate to the impairments of intangible assets at Pratt Miller recognized in the second quarter of 2024 as a result of unfavorable performance compared to forecast and adverse market conditions related to mobility and motorsports leading to a decline in the Company's expectations of future performance.
The increase in consolidated operating income was primarily due to improved pricing ($166 million), the impact of higher gross margin associated with higher sales volume ($134 million) and improved sales mix ($63 million), partially offset by intangible asset impairments ($52 million), the impact of changes in cumulative catch-up adjustments on contracts ($50 million), higher engineering costs ($47 million) and higher production costs ($43 million).
The following table presents consolidated non-operating changes (in millions):
| | | | | | | | | | | | |
| | Year Ended December 31, | |
| | 2024 | | | 2023 | | | Change | |
Interest expense, net of interest income | | $ | (111.9 | ) | | $ | (53.8 | ) | | $ | (58.1 | ) |
Miscellaneous, net | | | 4.2 | | | | 13.8 | | | | (9.6 | ) |
| | | | | | | | | |
Provision for income taxes | | | 210.0 | | | | 190.0 | | | | 20.0 | |
Effective tax rate | | | 23.3 | % | | | 23.8 | % | | | |
| | | | | | | | | |
Losses of unconsolidated affiliates | | $ | (11.6 | ) | | $ | (9.6 | ) | | $ | (2.0 | ) |
Interest expense, net of interest income increased due to increased borrowings on the Revolving Credit Facility (as defined in "Liquidity") primarily to fund the acquisitions of AeroTech in August 2023 and AUSA in September 2024.
Miscellaneous, net includes gains and losses on investments, net foreign currency transaction gains and losses, and non-service costs of the Company’s pension plans. Miscellaneous income, net decreased primarily due to changes in foreign currency transactions ($8 million) and the recognition of a gain on a settlement with the Company's pension advisor in 2023 ($5 million).
The lower effective tax rate in 2024 as compared to 2023 is the result of a higher foreign-derived intangible income deduction due to higher export sales. See Note 7 of the Notes to Consolidated Financial Statements for a reconciliation of the effective tax rate compared to the U.S. statutory tax rate.
Losses of unconsolidated affiliates primarily represented changes in the Company’s equity method investments. During 2024, the Company recorded an impairment of an equity method investment of $7 million. During 2023, the Company wrote down its investment in an equity interest in an entity in Mexico by $6 million based on the estimated fair market value of the entity and subsequently completed the sale of its interest in the entity, resulting in an additional loss of $2 million.
SEGMENT RESULTS
Access
The following table presents the Access segment results (in millions):
| | | | | | | | | | | | | | | | |
| | Year Ended December 31, | |
| | 2024 | | | 2023 | | | Change | | | % Change | |
Net sales | | $ | 5,164.7 | | | $ | 4,990.0 | | | $ | 174.7 | | | | 3.5 | % |
Cost of sales | | | 4,035.9 | | | | 3,954.0 | | | | 81.9 | | | | 2.1 | % |
Gross income | | | 1,128.8 | | | | 1,036.0 | | | | 92.8 | | | | 9.0 | % |
% of sales | | | 21.9 | % | | | 20.8 | % | | 110 bps | | | | |
Selling, general and administrative | | | 312.7 | | | | 288.6 | | | | 24.1 | | | | 8.4 | % |
Amortization of purchased intangibles | | | 10.7 | | | | 8.6 | | | | 2.1 | | | | 24.4 | % |
Operating income | | | 805.4 | | | | 738.8 | | | | 66.6 | | | | 9.0 | % |
% of sales | | | 15.6 | % | | | 14.8 | % | | 80 bps | | | | |
Access segment sales increased primarily as a result of improved sales volume in North America ($277 million) and the inclusion of sales related to the AUSA acquisition ($44 million), offset in part by lower sales volume in the Europe, Africa and Middle East ($103 million) and Rest of the World ($43 million) regions. The Company's long-term license agreement with Caterpillar Inc. to produce Caterpillar branded telehandlers ended in the fourth quarter of 2024. Caterpillar-branded telehandlers accounted for $315.4 million in sales in 2024.
The increase in Access segment gross margin was primarily due to improved product and customer mix (80 basis points).
The increase in Access segment selling, general and administrative expenses was generally a result of higher spending on outside services ($16 million), higher salaries ($11 million) and the inclusion of operating costs related to AUSA ($4 million), offset in part by lower incentive compensation costs ($8 million).
Amortization of purchased intangible assets increased primarily due to the acquisition of AUSA.
The increase in Access segment operating income was primarily due to improved sales mix ($48 million), the impact of higher gross margin associated with higher sales volume ($33 million), favorable absorption ($15 million) and lower litigation costs ($10 million), offset in part by higher selling, general and administrative expenses to support higher sales volume ($24 million) and higher engineering costs ($21 million).
Vocational
The following table presents the Vocational segment results (in millions):
| | | | | | | | | | | | | | | | |
| | Year Ended December 31, | |
| | 2024 | | | 2023 | | | Change | | | % Change | |
Net sales | | $ | 3,310.3 | | | $ | 2,578.1 | | | $ | 732.2 | | | | 28.4 | % |
Cost of sales | | | 2,630.7 | | | | 2,143.2 | | | | 487.5 | | | | 22.7 | % |
Gross income | | | 679.6 | | | | 434.9 | | | | 244.7 | | | | 56.3 | % |
% of sales | | | 20.5 | % | | | 16.9 | % | | 360 bps | | | | |
Selling, general and administrative | | | 242.8 | | | | 230.6 | | | | 12.2 | | | | 5.3 | % |
Amortization of purchased intangibles | | | 39.7 | | | | 18.8 | | | | 20.9 | | | | 111.2 | % |
Operating income | | | 397.1 | | | | 185.5 | | | | 211.6 | | | | 114.1 | % |
% of sales | | | 12.0 | % | | | 7.2 | % | | 480 bps | | | | |
Vocational segment sales increased due to the timing of the AeroTech acquisition ($429 million), improved organic sales volume ($212 million) and improved pricing in response to higher input costs ($160 million), offset in part by the impact of the sale of the rear-discharge concrete mixer business in the first quarter of 2023 ($65 million).
The increase in gross margin in the Vocational segment was primarily attributable to improved pricing.
The increase in Vocational segment selling, general and administrative expenses was generally a result of incremental operating costs related to the timing of the AeroTech acquisition ($48 million), offset in part by the absence of the loss on the sale of the rear-discharge concrete mixer business ($13 million), the absence of acquisition costs related to AeroTech ($13 million) and net gains related to the sale of its sales and service locations to dealers in conjunction with its change to a dealer network in North America ($8 million).
Amortization of purchased intangible assets increased primarily due to the acquisition of AeroTech.
The increase in operating income in the Vocational segment was primarily due to improved pricing ($160 million), the impact of higher gross margin associated with higher sales volume ($55 million), improved product mix ($31 million), the absence of the loss on the sale of the rear-discharge concrete mixer business ($13 million) and the absence of acquisition costs related to AeroTech ($13 million), offset in part by higher material costs ($25 million) and adverse production variances ($25 million).
Defense
The following table presents the Defense segment results (in millions):
| | | | | | | | | | | | | | | | |
| | Year Ended December 31, | |
| | 2024 | | | 2023 | | | Change | | | % Change | |
Net sales | | $ | 2,155.2 | | | $ | 2,001.4 | | | $ | 153.8 | | | | 7.7 | % |
Cost of sales | | | 1,996.1 | | | | 1,805.4 | | | | 190.7 | | | | 10.6 | % |
Gross income | | | 159.1 | | | | 196.0 | | | | (36.9 | ) | | | -18.8 | % |
% of sales | | | 7.4 | % | | | 9.8 | % | | -240 bps | | | | |
Selling, general and administrative | | | 107.7 | | | | 108.3 | | | | (0.6 | ) | | | -0.6 | % |
Operating income | | | 51.4 | | | | 87.7 | | | | (36.3 | ) | | | -41.4 | % |
% of sales | | | 2.4 | % | | | 4.4 | % | | -200 bps | | | | |
Defense segment sales increased primarily due to higher volume ($202 million), partially offset by unfavorable cumulative catch-up adjustments in 2024 compared to favorable cumulative catch-up adjustments in 2023 ($48 million). Higher volume included higher Family of Medium Tactical Vehicles sales ($110 million), the start of low-rate NGDV production for the USPS ($104 million) and higher aftermarket parts ($69 million), offset in part by lower JLTV sales associated with the wind down of the contract ($110 million). The U.S. Army, which purchased Government Purpose Rights to the Oshkosh JLTV design, conducted a full and open competition for follow-on JLTV production in which Oshkosh Defense participated. In February 2023, the DoD awarded the JLTV follow-on contract to another company. The Company expects to finish production of domestic JLTVs in early 2025. The JLTV contract accounted for $860 million of sales in 2024.
The decrease in gross margin in the Defense segment was primarily due to changes in cumulative catch-up adjustments on contracts (200 basis points) and adverse production variances (60 basis points).
Selling, general and administrative expenses in the Defense segment remained relatively flat in 2024 compared to 2023.
The decrease in operating income in the Defense segment was primarily a result of the impact of changes in cumulative catch-up adjustments on contracts ($50 million) and adverse production variances ($15 million), offset in part by the impact of higher gross margin associated with higher sales volume ($30 million). Changes in estimates on contracts accounted for under the cost-to-cost method resulted in cumulative catch-up adjustments on contract margins that decreased Defense segment operating income by $46.9 million in 2024 primarily as a result of significant costs to prepare units for acceptance and receiving orders that required loss reserves. Changes in estimates on contracts accounted for under the cost-to-cost method increased Defense segment operating income by $2.8 million in 2023.
Corporate and other
The following table presents corporate and other results (in millions):
| | | | | | | | | | | | | | | | |
| | Year Ended December 31, | |
| | 2024 | | | 2023 | | | Change | | | % Change | |
Net sales | | $ | 100.0 | | | $ | 88.4 | | | $ | 11.6 | | | | 13.1 | % |
Cost of sales | | | 98.1 | | | | 74.5 | | | | 23.6 | | | | 31.7 | % |
Gross income | | | 1.9 | | | | 13.9 | | | | (12.0 | ) | | | -86.3 | % |
Selling, general and administrative | | | 189.2 | | | | 182.9 | | | | 6.3 | | | | 3.4 | % |
Amortization of purchased intangibles | | | 4.3 | | | | 5.4 | | | | (1.1 | ) | | | -20.4 | % |
Intangible asset impairments | | | 51.6 | | | | — | | | | 51.6 | | | | 100.0 | % |
Operating loss | | | (243.2 | ) | | | (174.4 | ) | | | (68.8 | ) | | | 39.4 | % |
Net operating costs for corporate and other increased primarily due to the intangible asset impairments in the second quarter of 2024 at Pratt Miller ($52 million), higher share-based compensation expenses ($6 million), lower operating results at Pratt Miller ($6 million) and higher new product development investments ($5 million).
2023 COMPARED WITH 2022
The comparison of the year ended December 31, 2023 results with the year ended December 31, 2022 results can be found in the “Management’s Discussion and Analysis” section in the Company’s 2023 Annual Report on Form 10-K.
LIQUIDITY AND CAPITAL RESOURCES
The Company generates significant capital resources from operating activities, which is the expected primary source of funding for the Company. The Company expects cash flow from operations to be between $550 million and $650 million in 2025. In addition to cash generated from operations, the Company had other sources of liquidity available at December 31, 2024, including $204.9 million of cash and cash equivalents and $1.16 billion of unused available capacity under the Revolving Credit Facility (as defined in “Liquidity”). Borrowings under the Revolving Credit Facility could, as discussed below, be limited by a financial covenant contained in the Credit Agreement (as defined in “Liquidity”). The Company was in compliance and expects to remain in compliance with the financial covenant contained in the Credit Agreement.
The Company continues to actively monitor its liquidity position and working capital needs and prioritizes capital expenditures related to capacity and strategic investments. The Company believes that its liquidity position is adequate to meet its projected needs. To provide additional flexibility for working capital needs, organic and inorganic investments as well as share repurchases, the Company amended the Credit Agreement in April 2024 to increase the maximum aggregate amount of availability under the Revolving Credit Facility by $450 million to $1.55 billion.
Financial Condition at December 31, 2024
The Company’s capitalization was as follows (in millions):
| | | | | | | | |
| | December 31, | |
| | 2024 | | | 2023 | |
Cash and cash equivalents | | $ | 204.9 | | | $ | 125.4 | |
Total debt | | | 961.8 | | | | 772.5 | |
Total shareholders’ equity | | | 4,152.1 | | | | 3,705.3 | |
Total capitalization (debt plus equity) | | | 5,113.9 | | | | 4,477.8 | |
Debt to total capitalization | | | 18.8 | % | | | 17.3 | % |
The Company’s ratio of debt to total capitalization of 18.8% at December 31, 2024 remained within its targeted range. The increase in the debt to total capitalization compared to December 31, 2023 was primarily due to the acquisition of AUSA.
The Company’s goal is to maintain an investment-grade credit rating. The rating agencies periodically update the Company’s credit ratings as events or changes in economic conditions occur. At December 31, 2024, the long-term credit ratings assigned to the Company’s senior debt securities by the credit rating agencies engaged by the Company were as follows:
| | |
Rating Agency | | Rating |
Fitch Ratings | | BBB |
Moody’s Investor Services, Inc. | | Baa3 |
Standards & Poor’s | | BBB |
Consolidated days sales outstanding (defined as “Trade Receivables” at quarter end divided by “Net Sales” for the most recent quarter multiplied by 90 days) was 40 days at December 31, 2024, down from 44 days at December 31, 2023. Days sales outstanding for segments other than the Defense segment was 44 days at December 31, 2024, down from 49 days at December 31, 2023, primarily due to the impact of sales mix on average payment terms in the Access segment. Consolidated inventory turns (defined as “Cost of Sales” on an annualized basis, divided by the average “Inventory” at the past five quarter end periods) decreased from 4.2 times at December 31, 2023 to 3.9 times at December 31, 2024, primarily due to increases in inventory levels in the Vocational and Access segments. Consolidated days payables outstanding (defined as “Accounts Payable” at quarter end divided by material costs of sales for the most recent quarter multiplied by 90 days) was 65 days, down from 72 days at December 31, 2023, primarily due to the timing of cash disbursements.
Operating Cash Flows
Operating activities provided $550.1 million of cash in 2024 compared to $599.6 million in 2023. Cash used in operations in 2024 included cash paid for income taxes, net of refunds of $398.5 million, which increased by $236.8 million compared to 2023 primarily due to the Company's generation of significantly higher pre-tax income in 2023 compared to 2022. Cash used in operations during 2024 included the payment of 2023 incentive compensation, which was higher than 2022 incentive compensation due to the Company's improved performance.
Investing Cash Flows
Investing activities used cash of $388.8 million in 2024 compared to $1.29 billion in 2023. The Company used $113.5 million to fund the acquisition of AUSA in 2024 compared to $995.8 million to fund the acquisitions of AeroTech and Hinowa during 2023. Additions to property, plant and equipment of $281.0 million in 2024 decreased $44.3 million from 2023. The Company anticipates that it will spend $250 million on capital expenditures in 2025. Capital expenditures remains elevated due to efforts to expand production capacity in the Vocational segment.
Financing Cash Flows
Financing activities used cash of $75.1 million in 2024 compared to provided cash of $3.4 million in 2023. In 2024, the Company repurchased 1,058,474 shares of its Common Stock at an aggregate cost of $116.0 million. The Company's Board of Directors authorized the repurchase of 12 million shares in May 2022, of which approximately 10.2 million shares remained as of December 31, 2024. In 2023, the Company repurchased 265,795 shares of its Common Stock at an aggregate cost of $22.5 million.
Liquidity
Senior Credit Agreement
On March 23, 2022, the Company entered into a Third Amended and Restated Credit Agreement (the “Credit Agreement”). The Credit Agreement provides for an unsecured revolving credit facility (the “Revolving Credit Facility”) that matures in March 2027 with an initial maximum aggregate amount of availability of $1.10 billion. On April 3, 2024, the Company amended the Credit Agreement to increase the maximum aggregate amount of availability under the Revolving Credit Facility by $450 million to $1.55 billion. At December 31, 2024, borrowings under the Revolving Credit Facility of $360.0 million and specified outstanding letters of credit of $26.3 million reduced available capacity under the Revolving Credit Facility to $1.16 billion.
Under the Credit Agreement, the Company is obligated to pay (i) an unused commitment fee ranging from 0.080% to 0.225% per annum of the average daily unused portion of the aggregate revolving credit commitments under the Credit Agreement and (ii) a fee ranging from 0.4375% to 1.500% per annum of the maximum amount available to be drawn for each letter of credit issued and outstanding under the Credit Agreement.
Covenant Compliance
The Credit Agreement contains various restrictions and covenants, including a requirement that the Company maintain a leverage ratio at certain levels, subject to certain exceptions, restrictions on the ability of the Company and certain of its subsidiaries to consolidate or merge, create liens, incur additional subsidiary indebtedness and consummate acquisitions and a restriction on the disposition of all or substantially all of the assets of the Company and its subsidiaries taken as a whole. The Company was in compliance with the financial covenant contained in the Credit Agreement as of December 31, 2024 and expects to be able to meet the financial covenant contained in the Credit Agreement over the next twelve months.
Senior Notes
In May 2018, the Company issued $300.0 million of 4.60% unsecured senior notes due May 15, 2028 (the “2028 Senior Notes”). In February 2020, the Company issued $300.0 million of 3.10% unsecured senior notes due March 1, 2030 (the “2030 Senior Notes”). The 2028 Senior Notes and the 2030 Senior Notes were issued pursuant to an indenture (the “Indenture”) between the Company and a trustee. The Indenture contains customary affirmative and negative covenants. The Company has the option to redeem the 2028 and 2030 Senior Notes at any time for a premium.
Refer to Note 16 of the Notes to Consolidated Financial Statements for additional information regarding the Company’s debt as of December 31, 2024.
Contractual Obligations
The total amount of gross unrecognized tax benefits, including interest, for uncertain tax positions was $61.6 million as of December 31, 2024. Future settlements with tax authorities could result in payment of these obligations. Due to the difficulty in determining the timing of such settlements, these obligations are not included in the summary of the Company’s fixed contractual obligations. See Note 7 of the Notes to Consolidated Financial Statements for additional information regarding the Company’s unrecognized tax benefits as of December 31, 2024. Following is a summary of the Company’s contractual obligations and payments due by period following December 31, 2024 (in millions):
| | | | | | | | | | | | | | | | | | | | |
| | Payments Due by Period | |
| | | | | Less Than | | | | | | | | | More Than | |
| | Total | | | 1 Year | | | 1-3 Years | | | 3-5 Years | | | 5 Years | |
Long-term debt (including interest)(1) | | $ | 699.7 | | | $ | 25.4 | | | $ | 47.2 | | | $ | 324.3 | | | $ | 302.8 | |
Lease obligations | | | 301.5 | | | | 67.8 | | | | 99.3 | | | | 67.4 | | | | 67.0 | |
Purchase obligations(2) | | | 2,169.4 | | | | 2,096.3 | | | | 73.1 | | | | — | | | | — | |
Other non-current liabilities(3) | | | 440.0 | | | | 47.6 | | | | 79.3 | | | | 52.2 | | | | 260.9 | |
| | $ | 3,610.6 | | | $ | 2,237.1 | | | $ | 298.9 | | | $ | 443.9 | | | $ | 630.7 | |
(1)Interest was calculated based upon the interest rate in effect on December 31, 2024.
(2)The amounts for purchase obligations included above represent all obligations to purchase goods or services under agreements that are enforceable and legally binding and that specify all significant terms.
(3)Represents other non-current liabilities on the Company’s Consolidated Balance Sheet, including the current portion of these liabilities. The projected timing of cash flows associated with these obligations is based on management’s estimates, which are based largely on historical experience. This amount also includes all liabilities under the Company’s pension and other post-employment benefit plans. See Note 6 of the Notes to Consolidated Financial Statements for information regarding these liabilities and the plan assets available to satisfy them.
CRITICAL ACCOUNTING ESTIMATES
“Management’s Discussion and Analysis of Financial Condition and Results of Operations” is based on the Company’s Consolidated Financial Statements, which have been prepared in accordance with generally accepted accounting principles in the United States of America (U.S. GAAP). The preparation of financial statements in accordance with U.S. GAAP requires management to make estimates and judgments that affect reported amounts and related disclosures. On an ongoing basis, management evaluates and updates its estimates. Management employs judgment in making its estimates but they are based on historical experience and currently available information and various other assumptions that the Company believes to be reasonable under the circumstances. The results of these estimates form the basis for making judgments about the carrying values of assets and liabilities that are not readily available from other sources. Actual results could differ from those estimates.
Management believes that its judgment is applied consistently and produces financial information that fairly depicts the results of operations for all periods presented.
Estimate-at-Completion (EAC). The Company has concluded that control of substantially all of the Defense segment’s performance obligations transfers to the customer continuously and therefore revenue is recognized over time. The Defense segment recognizes revenue on its performance obligations that are satisfied over time by measuring progress using the cost-to-cost method of percentage-of-completion because it best depicts the transfer of control to the customer. Under the cost-to-cost method of percentage-of-completion, the Defense segment measures progress based on the ratio of costs incurred to date
to total estimated costs for the performance obligations. Due to the size and nature of these contracts, the estimation of total revenues and costs is complex and requires judgment by management. The Company must make assumptions regarding expected increases in wages and employee benefits, productivity and availability of labor, material costs and allocated fixed costs, as well as expected impacts on pricing related to certain economic price adjustment clauses. Each contract is evaluated at contract inception to identify risks and estimate revenue and costs. In performing this evaluation, the Defense segment considers risks of contract performance such as technical requirements, schedule, duration and key contract dependencies. Occasionally, the Company incurs production costs not planned or budgeted, or in excess of its original budget. The Company reviews such costs to determine if they are contributing and proportionate to the Company's progress in satisfying the performance obligation. Costs that are contributing but not proportionate to the Company's progress are reviewed to determine if they meet the definition of learning curve costs, which requires significant judgment. Learning curve costs are included in the cost-to-cost method of percentage-of-completion while costs that do not contribute to the Company's progress in satisfying the performance obligation are considered inefficiencies and expensed as incurred. The above considerations are then factored into the Company’s estimated revenue and costs. If a loss is expected on a performance obligation, the complete estimated loss is recorded in the period in which the loss is identified. Preliminary contract estimates are subject to change throughout the duration of the contract as additional information becomes available that impacts risks and estimated revenue and costs. Changes to production costs, overhead rates, learning curve and/or supplier performance can also impact these estimates. These estimates require significant judgment by management. The Company recognizes changes in estimated sales or costs and the resulting profit or loss on a cumulative basis. In addition, as contract modifications (e.g., new orders) are received, they are evaluated to determine if they represent a separate contract or a modification of the existing contract. As of December 31, 2024, the estimated remaining costs on the NGDV and FMTV A2 contracts represent the majority of the total estimated costs to complete in the Defense segment. Changes in estimates on contracts accounted for under the cost-to-cost method resulted in cumulative catch-up adjustments on contract margins that decreased Defense segment operating income by $46.9 million in 2024, increased operating income by $2.8 million in 2023 and decreased operating income by $45.7 million in 2022.
Goodwill. Goodwill reflects the cost of an acquisition in excess of the aggregate fair value assigned to identifiable net assets acquired. Goodwill is not amortized; however, it is assessed for impairment annually and as triggering events or “indicators of potential impairment” occur. The Company performs its annual impairment test at the beginning of the fourth quarter. The Company evaluates the recoverability of goodwill by estimating the fair value of the businesses to which the goodwill relates. Estimated cash flows and related goodwill are grouped at the reporting unit level. A reporting unit is an operating segment or, under certain circumstances, a component of an operating segment. When a reporting unit's fair value is less than its carrying value, an impairment loss is recognized for the difference between the fair value and carrying value of the reporting unit. The Company had $1.4 billion of goodwill at December 31, 2024.
The Company estimates the fair value of the reporting units utilizing the income approach and the market approach. The income approach is weighted more heavily (75%) as the Company believes the income approach more accurately considers long-term fluctuations in the U.S. and European construction markets compared to the market approach. Under the income approach, the Company estimates fair values based on discounted estimated future cash flows. Future cash flows are estimated based on the Company’s internal projection models, industry projections, terminal growth rates and other assumptions, including the Company's estimates for revenue growth and operating income margins. The Company estimates discounts rates based on the Company’s estimated weighted-average cost of capital, adjusted based on risk, which reflects the overall level of inherent risk of a reporting unit and the rate of return a market participant would expect to earn. Under the market approach, the Company estimates the fair value of its reporting units based on revenue and earnings multiples of comparable publicly traded companies. There are inherent uncertainties related to the Company’s estimates and assumptions and management uses significant judgment in estimating them. In evaluating the fair values of its reporting units, the Company also reconciles its total estimated fair value to within a reasonable range of the Company’s market capitalization.
During the second quarter of 2024, the Company determined that a triggering event occurred at Pratt Miller and assessed the reporting unit for impairment. For the income approach, a discount rate of 13.0% (14.0% at October 1, 2023) and a terminal growth rate of 3.0% (3.0% at October 1, 2023) were used. As a result of the assessment, the Company recorded an impairment charge of $38.7 million in the second quarter of 2024. Changes in estimates or the application of alternative assumptions could have produced significantly different results. At December 31, 2024, the Pratt Miller reporting unit had $5.7 million of goodwill remaining.
For the annual impairment test, the Company used discount rates, depending on reporting unit, of 13.0% to 17.0% (12.0% to 14.5% at October 1, 2023) and a terminal growth rate of 3.0% (3.0% at October 1, 2023). The Company’s annual impairment assessment indicated that no additional impairments to goodwill were required. The fair value of all but one reporting unit exceeded its carrying value by more than 10%. Changes in estimates or the application of alternative assumptions could have produced significantly different results. For example, an increase in the discount rate of 100 basis points or a decrease in the terminal growth rate of 200 basis points would likely cause impairment of a reporting unit in the Vocational segment. That reporting unit had $262.0 million of goodwill at December 31, 2024. See Note 12 of the Notes to Consolidated Financial Statements for information regarding the Company’s goodwill.
NEW ACCOUNTING STANDARDS
See Note 2 of the Notes to Consolidated Financial Statements regarding the impact or potential impact of recent accounting pronouncements on the Company’s consolidated financial statements.
CUSTOMERS AND BACKLOG
Sales to the U.S. government comprised approximately 20% of the Company’s net sales in 2024. No other single customer accounted for more than 10% of the Company’s net sales for this period. A substantial majority of the Company’s net sales are derived from the fulfillment of customer orders that are received prior to commencing production.
The Company’s backlog as of December 31, 2024 decreased 12.0% to $14.74 billion compared to $16.75 billion at December 31, 2023. Access segment backlog decreased 59.5% to $1.83 billion at December 31, 2024, compared to $4.53 billion at December 31, 2023. The decrease in backlog is believed to primarily be the result of the normalization of orders in connection with improved product availability and slowing demand in North America. Vocational segment backlog increased 15.6% to $6.32 billion at December 31, 2024, compared to $5.46 billion at December 31, 2023, due to strong demand for municipal fire apparatus and price increases. Unit backlog for municipal fire apparatus as of December 31, 2024 was up 3.8% compared to December 31, 2023. Unit backlog for refuse and recycling collection vehicles as of December 31, 2024 was up 5.3% compared to December 31, 2023. Defense segment backlog decreased 2.7% to $6.53 billion at December 31, 2024, compared to $6.71 billion at December 31, 2023, primarily due to the wind-down of production under the Company's domestic JLTV contract.
Backlog represents the dollar amount of revenues that the Company anticipates from customer contracts that have been awarded and/or are in progress. Reported backlog includes the original contract amount and any contract modifications that have been agreed upon. Reported backlog excludes purchase options, orders for which definitive contracts have not been executed and any potential future contract modifications. Backlog is comprised of fixed and variable priced contracts that may be canceled, modified or otherwise changed in the future. As a result, backlog may not be indicative of future operating results. Backlog information and comparisons thereof as of different dates may not be accurate indicators of future sales. Approximately 53% of the Company’s December 31, 2024 backlog is not expected to be filled in 2025.
NON-GAAP FINANCIAL MEASURES
The Company is forecasting earnings per share excluding items that affect comparability. When the Company forecasts earnings per share, excluding items, this is considered a non-GAAP financial measure. The Company believes excluding the impact of these items is useful to investors to allow a more accurate comparison of the Company’s operating performance to prior year results. However, while forecasted adjusted earnings per share excludes amortization of purchased intangibles, revenue and earnings of acquired companies are reflected in forecasted adjusted earnings per share and intangible assets contribute to the generation of revenue and earnings. Non-GAAP financial measures should be viewed in addition to, and not as an alternative for, the Company’s results or forecasts prepared in accordance with GAAP. The table below presents a reconciliation of the Company’s presented non-GAAP measure to the most directly comparable GAAP measure:
| | | | |
| | 2025 Expectations | |
Earnings per share-diluted (GAAP) | | $ | 10.30 | |
Amortization of purchased intangibles, net of tax | | | 0.70 | |
Adjusted earnings per share-diluted (non-GAAP) | | $ | 11.00 | |
ITEM 7A. QUANTITATIVE AND QUALITATIVE DISCLOSURES ABOUT MARKET RISK
The Company is exposed to market risk from changes in interest rates, certain commodity prices and foreign currency exchange rates. To mitigate the risk from changes in foreign currency exchange and interest rates, the Company selectively uses financial instruments. All hedging transactions are authorized and executed pursuant to clearly defined policies and procedures, which strictly prohibit the use of financial instruments for speculative purposes.
Interest Rate Risk. The Company’s earnings exposure related to adverse movements in interest rates is primarily derived from outstanding floating rate debt instruments that are indexed to short-term market interest rates. In this regard, changes in U.S. and offshore interest rates affect interest payable on the Company’s borrowings under the Credit Agreement. The Company had variable rate-based debt of $360.0 million outstanding on its Revolving Credit Facility at December 31, 2024 with an interest rate of 5.6%. This debt is classified as a current liability, resulting in limited exposure to adverse movements in interest rates given the short term expected maturity.
Commodity Price Risk. The Company is a purchaser of certain commodities, including steel, aluminum and composites. In addition, the Company is a purchaser of components and parts containing various commodities, including steel, aluminum, rubber and others which are integrated into the Company’s end products. The Company generally buys these commodities and components based upon market prices that are established with the vendor as part of the purchasing process. The Company does not use commodity financial instruments to hedge commodity prices.
The Company generally obtains firm quotations from its significant components’ suppliers for its orders under firm, fixed-price contracts in its Defense segment when possible. In the Company’s Access and Vocational segments, the Company generally attempts to obtain firm pricing from most of its suppliers, consistent with backlog requirements and/or forecasted annual sales. To the extent that commodity prices increase and the Company does not have firm pricing from its suppliers, or its suppliers are not able to honor such prices, then the Company may experience margin declines to the extent it is not able to increase selling prices of its products.
Foreign Currency Risk. The Company’s operations consist of manufacturing in the U.S., Mexico, Canada, France, Australia, the United Kingdom, Italy, Spain and China and sales and limited vehicle body mounting activities on five continents. International sales comprised approximately 14% of overall net sales in 2024, of which approximately 40% involved exports from the U.S. The majority of export sales in 2024 were denominated in U.S. dollars. As a result of the manufacture and sale of the Company’s products in foreign markets, the Company’s earnings are affected by fluctuations in the value of foreign currencies in which certain of the Company’s transactions are denominated as compared to the value of the U.S. dollar. The Company’s operating results are principally exposed to changes in exchange rates between the U.S. dollar and Euro, British pound sterling, Australian dollar, Mexican peso, Chinese renminbi and Canadian dollar.
ITEM 8. FINANCIAL STATEMENTS
REPORT OF INDEPENDENT REGISTERED PUBLIC ACCOUNTING FIRM
To the Shareholders and Board of Directors of Oshkosh Corporation
Opinion on the Financial Statements
We have audited the accompanying consolidated balance sheets of Oshkosh Corporation and subsidiaries (the "Company") as of December 31, 2024, and 2023, the related consolidated statements of income, comprehensive income, shareholders’ equity, and cash flows, for each of the three years in the period ended December 31, 2024, and the related notes (collectively referred to as the “financial statements”). In our opinion, the financial statements present fairly, in all material respects, the financial position of the Company as of December 31, 2024 and 2023 and the results of its operations and its cash flows for the three years in the period ended December 31, 2024, in conformity with accounting principles generally accepted in the United States of America.
We have also audited, in accordance with the standards of the Public Company Accounting Oversight Board (United States) (PCAOB), the Company's internal control over financial reporting as of December 31, 2024, based on criteria established in Internal Control — Integrated Framework (2013) issued by the Committee of Sponsoring Organizations of the Treadway Commission and our report dated February 20, 2025 expressed an unqualified opinion on the Company's internal control over financial reporting.
Basis for Opinion
These financial statements are the responsibility of the Company's management. Our responsibility is to express an opinion on the Company's financial statements based on our audits. We are a public accounting firm registered with the PCAOB and are required to be independent with respect to the Company in accordance with the U.S. federal securities laws and the applicable rules and regulations of the Securities and Exchange Commission and the PCAOB.
We conducted our audits in accordance with the standards of the PCAOB. Those standards require that we plan and perform the audit to obtain reasonable assurance about whether the financial statements are free of material misstatement, whether due to error or fraud. Our audits included performing procedures to assess the risks of material misstatement of the financial statements, whether due to error or fraud, and performing procedures that respond to those risks. Such procedures included examining, on a test basis, evidence regarding the amounts and disclosures in the financial statements. Our audits also included evaluating the accounting principles used and significant estimates made by management, as well as evaluating the overall presentation of the financial statements. We believe that our audits provide a reasonable basis for our opinion.
Critical Audit Matter
The critical audit matter communicated below is a matter arising from the current-period audit of the financial statements that was communicated or required to be communicated to the audit committee and that (1) relates to accounts or disclosures that are material to the financial statements and (2) involved our especially challenging, subjective, or complex judgments. The communication of critical audit matters does not alter in any way our opinion on the financial statements, taken as a whole, and we are not, by communicating the critical audit matter below, providing a separate opinion on the critical audit matter or on the accounts or disclosures to which it relates.
Goodwill Valuation – Refer to Notes 2 and 12 to the Financial Statements
Critical Audit Matter Description
The Company performed an impairment evaluation of goodwill by comparing the estimated fair values of reporting units to their carrying values. In order to estimate the fair values of the reporting units, management is required to make estimates and assumptions related to the discount rates and forecasts of future operating income margins, which involve significant judgment. Changes in these assumptions could have a significant impact on either the fair value, the amount of any goodwill impairment charge, or both. As of October 1, 2024, the Company’s measurement date, the Company determined that the fair values of the reporting units exceeded their carrying values and therefore no impairment was recognized.
We identified the impairment evaluation of goodwill for one reporting unit in the Vocational Segment as a critical audit matter because of the inherent subjectivity involved in management’s estimates and assumptions related to the discount rate and forecasts of future revenue growth and operating income. The audit procedures to evaluate the reasonableness of management’s estimates and assumptions related to the selection of the discount rates and forecast of future operating income required a high degree of auditor judgment and an increased extent of effort, including the involvement of our fair value specialists.
How the Critical Audit Matter Was Addressed in the Audit
Our audit procedures related to the selection of the discount rate, and forecasts of future revenue and operating income margins for a reporting unit in the Vocational Segment included the following, among others:
•We evaluated the design and effectiveness of the controls over management’s goodwill impairment evaluation, including those over the selection of the discount rates and management’s development of forecasts of future operating income margins and revenue.
•We evaluated the reasonableness of management's forecasts by comparing the forecasts to (1) historical results, (2) internal communications to management and the Board of Directors, and (3) forecasted information included in analyst and industry reports for the Company and certain of its peer companies.
•We assessed management's intent and/or ability to take specific actions included in management's forecasts.
•With the assistance of our fair value specialists, we evaluated the reasonableness of the discount rates by:
— Testing the source information underlying management's determination of the discount rates.
— Testing the mathematical accuracy of management's calculations.
— Developing a range of independent estimates and comparing those to the discount rates selected by management.
/s/ Deloitte & Touche LLP
Milwaukee, Wisconsin
February 20, 2025
We have served as the Company’s auditor since 2002.
REPORT OF INDEPENDENT REGISTERED PUBLIC ACCOUNTING FIRM
To the Shareholders and the Board of Directors of Oshkosh Corporation
Opinion on Internal Control over Financial Reporting
We have audited the internal control over financial reporting of Oshkosh Corporation and subsidiaries (the “Company”) as of December 31, 2024, based on criteria established in Internal Control — Integrated Framework (2013) issued by the Committee of Sponsoring Organizations of the Treadway Commission (COSO). In our opinion, the Company maintained, in all material respects, effective internal control over financial reporting as of December 31, 2024, based on criteria established in Internal Control — Integrated Framework (2013) issued by COSO.
We have also audited, in accordance with the standards of the Public Company Accounting Oversight Board (United States) (PCAOB), the consolidated financial statements as of and for the year ended December 31, 2024, of the Company and our report dated February 20, 2025, expressed an unqualified opinion on those financial statements.
Basis for Opinion
The Company’s management is responsible for maintaining effective internal control over financial reporting and for its assessment of the effectiveness of internal control over financial reporting, included in the accompanying Management’s Report on Internal Control over Financial Reporting. Our responsibility is to express an opinion on the Company’s internal control over financial reporting based on our audit. We are a public accounting firm registered with the PCAOB and are required to be independent with respect to the Company in accordance with the U.S. federal securities laws and the applicable rules and regulations of the Securities and Exchange Commission and the PCAOB.
We conducted our audit in accordance with the standards of the PCAOB. Those standards require that we plan and perform the audit to obtain reasonable assurance about whether effective internal control over financial reporting was maintained in all material respects. Our audit included obtaining an understanding of internal control over financial reporting, assessing the risk that a material weakness exists, testing and evaluating the design and operating effectiveness of internal control based on the assessed risk, and performing such other procedures as we considered necessary in the circumstances. We believe that our audit provides a reasonable basis for our opinion.
Definition and Limitations of Internal Control over Financial Reporting
A company’s internal control over financial reporting is a process designed to provide reasonable assurance regarding the reliability of financial reporting and the preparation of financial statements for external purposes in accordance with generally accepted accounting principles. A company’s internal control over financial reporting includes those policies and procedures that (1) pertain to the maintenance of records that, in reasonable detail, accurately and fairly reflect the transactions and dispositions of the assets of the company; (2) provide reasonable assurance that transactions are recorded as necessary to permit preparation of financial statements in accordance with generally accepted accounting principles, and that receipts and expenditures of the company are being made only in accordance with authorizations of management and directors of the company; and (3) provide reasonable assurance regarding prevention or timely detection of unauthorized acquisition, use, or disposition of the company’s assets that could have a material effect on the financial statements.
Because of its inherent limitations, internal control over financial reporting may not prevent or detect misstatements. Also, projections of any evaluation of effectiveness to future periods are subject to the risk that controls may become inadequate because of changes in conditions, or that the degree of compliance with the policies or procedures may deteriorate.
/s/ Deloitte & Touche LLP
Milwaukee, Wisconsin
February 20, 2025
OSHKOSH CORPORATION
CONSOLIDATED STATEMENTS OF INCOME
(Dollars in millions, except per share amounts)
| | | | | | | | | | | | |
| | Year Ended December 31, | |
| | 2024 | | | 2023 | | | 2022 | |
Net sales | | $ | 10,730.2 | | | $ | 9,657.9 | | | $ | 8,282.0 | |
Cost of sales | | | 8,760.8 | | | | 7,977.1 | | | | 7,227.6 | |
Gross income | | | 1,969.4 | | | | 1,680.8 | | | | 1,054.4 | |
| | | | | | | | | |
Operating expenses: | | | | | | | | | |
Selling, general and administrative | | | 852.4 | | | | 810.4 | | | | 662.8 | |
Amortization of purchased intangibles | | | 54.7 | | | | 32.8 | | | | 11.6 | |
Intangible asset impairments | | | 51.6 | | | | — | | | | 7.7 | |
Total operating expenses | | | 958.7 | | | | 843.2 | | | | 682.1 | |
Operating income | | | 1,010.7 | | | | 837.6 | | | | 372.3 | |
| | | | | | | | | |
Other income (expense): | | | | | | | | | |
Interest expense | | | (119.5 | ) | | | (68.6 | ) | | | (53.4 | ) |
Interest income | | | 7.6 | | | | 14.8 | | | | 9.5 | |
Miscellaneous, net | | | 4.2 | | | | 13.8 | | | | (52.8 | ) |
Income before income taxes and losses of unconsolidated affiliates | | | 903.0 | | | | 797.6 | | | | 275.6 | |
Provision for income taxes | | | 210.0 | | | | 190.0 | | | | 97.5 | |
Income before losses of unconsolidated affiliates | | | 693.0 | | | | 607.6 | | | | 178.1 | |
Losses of unconsolidated affiliates | | | (11.6 | ) | | | (9.6 | ) | | | (4.2 | ) |
Net income | | $ | 681.4 | | | $ | 598.0 | | | $ | 173.9 | |
| | | | | | | | | |
Earnings per share: | | | | | | | | | |
Basic | | $ | 10.41 | | | $ | 9.15 | | | $ | 2.65 | |
Diluted | | | 10.35 | | | | 9.08 | | | | 2.63 | |
The accompanying notes are an integral part of these financial statements.
OSHKOSH CORPORATION
CONSOLIDATED STATEMENTS OF COMPREHENSIVE INCOME
(Dollars in millions)
| | | | | | | | | | | | |
| | Year Ended December 31, | |
| | 2024 | | | 2023 | | | 2022 | |
Net income | | $ | 681.4 | | | $ | 598.0 | | | $ | 173.9 | |
Other comprehensive income (loss), net of tax: | | | | | | | | | |
Pension and post-employment benefits | | | 35.4 | | | | 1.9 | | | | 56.7 | |
Currency translation adjustments | | | (67.7 | ) | | | 27.1 | | | | (26.4 | ) |
Change in fair value of derivative instruments | | | 1.1 | | | | (8.7 | ) | | | 6.0 | |
Total other comprehensive income (loss), net of tax | | | (31.2 | ) | | | 20.3 | | | | 36.3 | |
Comprehensive income | | $ | 650.2 | | | $ | 618.3 | | | $ | 210.2 | |
The accompanying notes are an integral part of these financial statements.
OSHKOSH CORPORATION
CONSOLIDATED BALANCE SHEETS
(Dollars in millions, except share and per share amounts)
| | | | | | | | |
| | December 31, | |
| | 2024 | | | 2023 | |
Assets | | | | | | |
Current assets: | | | | | | |
Cash and cash equivalents | | $ | 204.9 | | | $ | 125.4 | |
Receivables, net | | | 1,254.7 | | | | 1,316.4 | |
Unbilled receivables, net | | | 636.5 | | | | 771.6 | |
Inventories | | | 2,265.7 | | | | 2,131.6 | |
Income taxes receivable | | | 51.2 | | | | 42.2 | |
Other current assets | | | 114.5 | | | | 93.6 | |
Total current assets | | | 4,527.5 | | | | 4,480.8 | |
Property, plant and equipment, net | | | 1,216.5 | | | | 1,069.5 | |
Goodwill | | | 1,410.1 | | | | 1,416.4 | |
Purchased intangible assets, net | | | 777.6 | | | | 830.2 | |
Deferred income taxes | | | 259.0 | | | | 262.0 | |
Deferred contract costs | | | 842.6 | | | | 710.7 | |
Other non-current assets | | | 389.8 | | | | 359.6 | |
Total assets | | $ | 9,423.1 | | | $ | 9,129.2 | |
| | | | | | |
Liabilities and Shareholders’ Equity | | | | | | |
Current liabilities: | | | | | | |
Revolving credit facilities and current maturities of long-term debt | | $ | 362.3 | | | $ | 175.0 | |
Accounts payable | | | 1,143.4 | | | | 1,214.5 | |
Customer advances | | | 648.8 | | | | 706.9 | |
Payroll-related obligations | | | 246.2 | | | | 242.5 | |
Income taxes payable | | | 140.1 | | | | 308.0 | |
Other current liabilities | | | 446.5 | | | | 442.7 | |
Total current liabilities | | | 2,987.3 | | | | 3,089.6 | |
Long-term debt, less current maturities | | | 599.5 | | | | 597.5 | |
Non-current customer advances | | | 1,154.4 | | | | 1,190.7 | |
Deferred income taxes | | | 26.9 | | | | 26.8 | |
Other non-current liabilities | | | 502.9 | | | | 519.3 | |
Commitments and contingencies | | | | | | |
Shareholders’ equity: | | | | | | |
Preferred Stock ($0.01 par value; 2,000,000 shares authorized;
none issued and outstanding) | | | — | | | | — | |
Common Stock ($0.01 par value; 300,000,000 shares authorized; 75,101,465 shares issued) | | | 0.7 | | | | 0.7 | |
Additional paid-in capital | | | 847.8 | | | | 823.0 | |
Retained earnings | | | 4,367.2 | | | | 3,805.8 | |
Accumulated other comprehensive loss | | | (103.2 | ) | | | (72.0 | ) |
Common Stock in treasury, at cost (10,499,458 and 9,627,658 shares, respectively) | | | (960.4 | ) | | | (852.2 | ) |
Total shareholders’ equity | | | 4,152.1 | | | | 3,705.3 | |
Total liabilities and shareholders’ equity | | $ | 9,423.1 | | | $ | 9,129.2 | |
The accompanying notes are an integral part of these financial statements.
OSHKOSH CORPORATION
CONSOLIDATED STATEMENTS OF SHAREHOLDERS’ EQUITY
(Dollars in millions, except per share amounts)
| | | | | | | | | | | | | | | | | | | | | | | | |
| | Common
Stock | | | Additional
Paid-In
Capital | | | Retained
Earnings | | | Accumulated
Other
Comprehensive
Income (Loss) | | | Common
Stock in
Treasury
at Cost | | | Total | |
Balance at December 31, 2021 | | | 0.7 | | | | 792.4 | | | | 3,238.5 | | | | (128.6 | ) | | | (698.7 | ) | | | 3,204.3 | |
Net income | | | — | | | | — | | | | 173.9 | | | | — | | | | — | | | | 173.9 | |
Pension and post-employment benefits, net of
tax of $17.3 | | | — | | | | — | | | | — | | | | 56.7 | | | | — | | | | 56.7 | |
Currency translation adjustments | | | — | | | | — | | | | — | | | | (26.4 | ) | | | — | | | | (26.4 | ) |
Derivative instruments, net of tax | | | — | | | | — | | | | — | | | | 6.0 | | | | — | | | | 6.0 | |
Cash dividends ($1.48 per share) | | | — | | | | — | | | | (97.3 | ) | | | — | | | | — | | | | (97.3 | ) |
Repurchases of Common Stock | | | — | | | | — | | | | — | | | | — | | | | (155.0 | ) | | | (155.0 | ) |
Exercise of stock options | | | — | | | | (0.3 | ) | | | — | | | | — | | | | 3.4 | | | | 3.1 | |
Stock-based compensation expense | | | — | | | | 28.6 | | | | — | | | | — | | | | — | | | | 28.6 | |
Payment of stock-based restricted and performance shares | | | — | | | | (14.0 | ) | | | — | | | | — | | | | 14.0 | | | | — | |
Shares tendered for taxes on stock-based compensation | | | — | | | | — | | | | — | | | | — | | | | (8.3 | ) | | | (8.3 | ) |
Other | | | — | | | | (0.7 | ) | | | (0.1 | ) | | | — | | | | 0.9 | | | | 0.1 | |
Balance at December 31, 2022 | | | 0.7 | | | | 806.0 | | | | 3,315.0 | | | | (92.3 | ) | | | (843.7 | ) | | | 3,185.7 | |
Net income | | | — | | | | — | | | | 598.0 | | | | — | | | | — | | | | 598.0 | |
Pension and post-employment benefits, net of
tax of $0.9 | | | — | | | | — | | | | — | | | | 1.9 | | | | — | | | | 1.9 | |
Currency translation adjustments | | | — | | | | — | | | | — | | | | 27.1 | | | | — | | | | 27.1 | |
Derivative instruments, net of tax | | | — | | | | — | | | | — | | | | (8.7 | ) | | | — | | | | (8.7 | ) |
Cash dividends ($1.64 per share) | | | — | | | | — | | | | (107.2 | ) | | | — | | | | — | | | | (107.2 | ) |
Repurchases of Common Stock | | | — | | | | — | | | | — | | | | — | | | | (22.5 | ) | | | (22.5 | ) |
Exercise of stock options | | | — | | | | 1.5 | | | | — | | | | — | | | | 7.7 | | | | 9.2 | |
Stock-based compensation expense | | | — | | | | 31.9 | | | | — | | | | — | | | | — | | | | 31.9 | |
Payment of stock-based restricted and performance shares | | | — | | | | (16.8 | ) | | | — | | | | — | | | | 16.8 | | | | — | |
Shares tendered for taxes on stock-based compensation | | | — | | | | — | | | | — | | | | — | | | | (11.0 | ) | | | (11.0 | ) |
Other | | | — | | | | 0.4 | | | | — | | | | — | | | | 0.5 | | | | 0.9 | |
Balance at December 31, 2023 | | | 0.7 | | | | 823.0 | | | | 3,805.8 | | | | (72.0 | ) | | | (852.2 | ) | | | 3,705.3 | |
Net income | | | — | | | | — | | | | 681.4 | | | | — | | | | — | | | | 681.4 | |
Pension and post-employment benefits, net of
tax of $11.0 | | | — | | | | — | | | | — | | | | 35.4 | | | | — | | | | 35.4 | |
Currency translation adjustments | | | — | | | | — | | | | — | | | | (67.7 | ) | | | — | | | | (67.7 | ) |
Derivative instruments, net of tax | | | — | | | | — | | | | — | | | | 1.1 | | | | — | | | | 1.1 | |
Cash dividends ($1.84 per share) | | | — | | | | — | | | | (120.0 | ) | | | — | | | | — | | | | (120.0 | ) |
Repurchases of Common Stock | | | — | | | | — | | | | — | | | | — | | | | (116.0 | ) | | | (116.0 | ) |
Exercise of stock options | | | — | | | | 1.1 | | | | — | | | | — | | | | 4.2 | | | | 5.3 | |
Stock-based compensation expense | | | — | | | | 38.1 | | | | — | | | | — | | | | — | | | | 38.1 | |
Payment of stock-based restricted and performance shares | | | — | | | | (14.2 | ) | | | — | | | | — | | | | 14.2 | | | | — | |
Shares tendered for taxes on stock-based compensation | | | — | | | | — | | | | — | | | | — | | | | (11.1 | ) | | | (11.1 | ) |
Other | | | — | | | | (0.2 | ) | | | — | | | | — | | | | 0.5 | | | | 0.3 | |
Balance at December 31, 2024 | | $ | 0.7 | | | $ | 847.8 | | | $ | 4,367.2 | | | $ | (103.2 | ) | | $ | (960.4 | ) | | $ | 4,152.1 | |
The accompanying notes are an integral part of these financial statements.
OSHKOSH CORPORATION
CONSOLIDATED STATEMENTS OF CASH FLOWS
(Dollars in millions)
| | | | | | | | | | | | |
| | Year Ended December 31, | |
| | 2024 | | | 2023 | | | 2022 | |
Operating activities: | | | | | | | | | |
Net income | | $ | 681.4 | | | $ | 598.0 | | | $ | 173.9 | |
Depreciation and amortization | | | 200.1 | | | | 159.9 | | | | 107.6 | |
Intangible asset impairments | | | 51.6 | | | | — | | | | 7.7 | |
Stock-based incentive compensation | | | 38.1 | | | | 31.9 | | | | 28.6 | |
Deferred income taxes | | | (17.9 | ) | | | (160.4 | ) | | | (53.5 | ) |
Unrealized (gain) loss on investments | | | (3.8 | ) | | | (1.4 | ) | | | 12.6 | |
Other non-cash adjustments | | | 7.0 | | | | 10.9 | | | | 7.4 | |
Changes in operating assets and liabilities: | | | | | | | | | |
Receivables, net | | | 65.9 | | | | (53.4 | ) | | | (200.4 | ) |
Unbilled receivables, net | | | 135.0 | | | | (131.2 | ) | | | (146.3 | ) |
Inventories | | | (112.4 | ) | | | (116.1 | ) | | | (330.8 | ) |
Accounts payable | | | (77.3 | ) | | | 11.8 | | | | 331.7 | |
Customer advances | | | (94.1 | ) | | | 157.0 | | | | 819.3 | |
Payroll-related obligations | | | (0.7 | ) | | | 109.0 | | | | 1.5 | |
Income taxes payable | | | (169.0 | ) | | | 215.3 | | | | 71.8 | |
Deferred contract costs | | | (131.9 | ) | | | (294.8 | ) | | | (342.6 | ) |
Other operating assets and liabilities | | | (21.9 | ) | | | 63.1 | | | | 112.8 | |
Total changes in operating assets and liabilities | | | (406.4 | ) | | | (39.3 | ) | | | 317.0 | |
Net cash provided by operating activities | | | 550.1 | | | | 599.6 | | | | 601.3 | |
| | | | | | | | | |
Investing activities: | | | | | | | | | |
Additions to property, plant and equipment | | | (281.0 | ) | | | (325.3 | ) | | | (269.5 | ) |
Acquisition of businesses, net of cash acquired | | | (121.3 | ) | | | (995.8 | ) | | | (19.7 | ) |
Proceeds from sale of businesses, net of cash sold | | | 7.0 | | | | 32.6 | | | | — | |
Other investing activities | | | 6.5 | | | | 2.9 | | | | (11.2 | ) |
Net cash used in investing activities | | | (388.8 | ) | | | (1,285.6 | ) | | | (300.4 | ) |
| | | | | | | | | |
Financing activities: | | | | | | | | | |
Proceeds from revolving credit facilities | | | 4,325.5 | | | | 1,616.5 | | | | 10.4 | |
Repayments of revolving credit facilities | | | (4,140.5 | ) | | | (1,451.2 | ) | | | — | |
Repayments of debt | | | (1.2 | ) | | | (15.8 | ) | | | (225.0 | ) |
Dividends paid | | | (120.0 | ) | | | (107.2 | ) | | | (97.3 | ) |
Repurchases of Common Stock | | | (116.0 | ) | | | (22.5 | ) | | | (155.0 | ) |
Other financing activities | | | (22.9 | ) | | | (16.4 | ) | | | (18.1 | ) |
Net cash provided by (used in) financing activities | | | (75.1 | ) | | | 3.4 | | | | (485.0 | ) |
Effect of exchange rate changes on cash and cash equivalents | | | (6.7 | ) | | | 2.1 | | | | (5.7 | ) |
Increase (decrease) in cash and cash equivalents | | | 79.5 | | | | (680.5 | ) | | | (189.8 | ) |
Cash and cash equivalents at beginning of period | | | 125.4 | | | | 805.9 | | | | 995.7 | |
Cash and cash equivalents at end of period | | $ | 204.9 | | | $ | 125.4 | | | $ | 805.9 | |
| | | | | | | | | |
Supplemental disclosures: | | | | | | | | | |
Cash paid for interest | | $ | 112.4 | | | $ | 60.0 | | | $ | 49.6 | |
Cash paid for income taxes, net of refunds | | | 398.5 | | | | 161.7 | | | | 6.5 | |
Property, plant and equipment additions - noncash | | | 31.6 | | | | 58.6 | | | | 69.0 | |
The accompanying notes are an integral part of these financial statements.
OSHKOSH CORPORATION
NOTES OF CONSOLIDATED FINANCIAL STATEMENTS
1. Nature of Operations
Oshkosh Corporation and its subsidiaries (the “Company”) is an industrial technology company specializing in the design, development and manufacture of purpose-built vehicles and equipment for the access, fire, refuse and recycling collection, airport ground support, concrete placement, defense and delivery vehicle markets. “Oshkosh” refers to Oshkosh Corporation, not including its subsidiaries. The Company is organized into three reportable segments — Access, Vocational and Defense. The Company’s Access segment is conducted through its wholly-owned subsidiary, JLG Industries, Inc. and its wholly-owned subsidiaries (JLG), JerrDan LLC (JerrDan), Hinowa S.p.A. (Hinowa) and AUSACORP S.L. (AUSA). The Company’s Vocational segment is principally conducted through its wholly-owned subsidiaries Pierce Manufacturing Inc. (Pierce), Maxi-Metal Inc. (Maxi-Metal), Kewaunee Fabrications, LLC (Kewaunee), Oshkosh AeroTech, LLC (AeroTech), McNeilus Companies, Inc. (McNeilus), Iowa Mold Tooling Co., Inc. (IMT) and Oshkosh Commercial Products, LLC (Oshkosh S-Series). The Company’s Defense segment is conducted through its wholly-owned subsidiary Oshkosh Defense, LLC (Oshkosh Defense).
In July 2024, the Company moved the reporting responsibility for Pratt & Miller Engineering & Fabrication, LLC (Pratt Miller) from its Defense Segment to the Chief Technology and Strategic Sourcing Officer to better utilize Pratt Miller’s expertise across the entire Oshkosh Corporation enterprise. Pratt Miller results are now reported within "Corporate and other." All historical information has been recast to reflect this change.
2. Summary of Significant Accounting Policies
Principles of Consolidation and Presentation — The consolidated financial statements include the accounts of Oshkosh and all of its majority-owned or controlled subsidiaries and are prepared in conformity with generally accepted accounting principles in the United States of America (U.S. GAAP). All intercompany accounts and transactions have been eliminated in consolidation.
Use of Estimates — The preparation of financial statements in conformity with U.S. GAAP requires management to make estimates and assumptions that affect the reported amounts of assets and liabilities and disclosure of contingent assets and liabilities at the date of the financial statements and the reported amounts of revenues and expenses during the reporting period. Actual results could differ from those estimates.
Revenue Recognition — The Company recognizes revenue when control of the goods or services promised under a contract are transferred to the customer either at a point in time (e.g., upon delivery) or over time (e.g., as the Company performs under the contract) in an amount that reflects the consideration to which the Company expects to be entitled to in exchange for the goods or services. The Company accounts for a contract when it has approval and commitment from both parties, the rights and payment terms of the parties are identified, the contract has commercial substance and collectability of consideration is probable. If collectability is not probable, the sale is deferred until collection becomes probable or payment is received.
Contracts are reviewed to determine whether there is one or multiple performance obligations. A performance obligation is a promise to transfer a distinct good or service to a customer and represents the unit of accounting for revenue recognition. For contracts with multiple performance obligations, the expected consideration (e.g., the transaction price) is allocated to each performance obligation identified in the contract based on the relative standalone selling price of each performance obligation, which is determinable based on observable standalone selling prices or is estimated using an expected cost plus a margin approach. Revenue is then recognized for the transaction price allocated to the performance obligation when control of the promised goods or services underlying the performance obligation is transferred. When the amount of consideration allocated to a performance obligation through this process differs from the invoiced amount, it results in a contract asset or liability. The identification of performance obligations within a contract requires significant judgment.
The Company has elected to apply the following practical expedients and accounting policy elections when determining revenue from contracts with customers and capitalization of related costs:
•Shipping and handling costs incurred after control of the related product has transferred to the customer are considered costs to fulfill the related promise and are included in “Cost of sales” in the Consolidated Statements of Income when incurred or when the related product revenue is recognized, whichever is earlier.
OSHKOSH CORPORATION
NOTES OF CONSOLIDATED FINANCIAL STATEMENTS
•Except for certain customer advances in the Vocational segment, the Company has elected to not adjust revenue for the effects of a significant finance component when the timing difference between receipt of payment and recognition of revenue is less than one year.
•Sales and similar taxes that are collected from customers are excluded from the transaction price.
•The Company has elected to expense incremental costs to obtain a contract when the amortization period of the related asset is expected to be less than one year.
•The Company has elected to not disclose unsatisfied performance obligations with an original contract duration of one year or less.
The following is a description of the primary activities from which the Company generates revenue.
Access and Vocational segments revenue
The Company derives revenue in the Access and Vocational segments (non-defense segments) through the sale of machinery, vehicles and related aftermarket parts and services. Customers include distributors, equipment rental providers and end-users. Contracts with customers generally exist upon the approval of a quote and/or purchase order by the Company and customer. Each contract is also assessed at inception to determine whether it is necessary to combine the contract with other existing contracts.
The Company’s non-defense segments offer various customer incentives within contracts, such as sales and marketing rebates, volume discounts and interest subsidies, some of which are variable and therefore must be estimated by the Company. Transaction prices may also be impacted by rights of return, primarily within the aftermarket parts business, which requires the Company to record a liability and asset representing its rights and obligations in the event a return occurs. The estimated return liability is based on historical experience rates.
Revenue for performance obligations consisting of machinery, vehicle and aftermarket parts (together, “product”) is recognized when the customer obtains control of the product, which typically occurs at a point in time, based on the shipping terms within the contract. Refuse and recycling collection vehicles are sold on both Company owned chassis and customer owned chassis. When performing work on a customer owned chassis, revenue is recognized over time based on the cost-to-cost method of percentage-of-completion, as the Company is enhancing a customer owned asset. Jet bridges are designed to customer specification. Revenue related to jet bridges is recognized over time based on the cost-to-cost method of percentage-of-completion as the Company's performance does not create an asset with an alternative use and the Company has an enforceable right to payment for its performance completed to date.
All non-defense segments offer aftermarket services related to their respective products such as repair, refurbishment and maintenance (together, “services”). The Company generally recognizes revenue on service performance obligations over time using the method that results in the most faithful depiction of transfer of control to the customer. Non-defense segments also offer extended warranty coverage as an option on most products. The Company considers extended warranties to be service-type warranties and therefore a separate performance obligation. Service-type warranties differ from the Company’s standard, assurance-type warranties, as they are generally separately priced and negotiated as part of the contract and/or provide additional coverage beyond what the customer or customer group that purchases the product would receive under an assurance-type warranty. The Company has concluded that its extended warranties are stand-ready obligations to perform and therefore recognizes revenue ratably over the coverage period. The Company also provides a standard warranty on its products and services at no additional cost to its customers in most instances.
Defense segment revenue
The majority of the Company’s Defense segment sales are derived through long-term contracts with the U.S. government to design, develop, manufacture or modify defense, delivery and other specialty vehicles. These contracts, which also include those under the U.S. Government-sponsored Foreign Military Sales (FMS) program, accounted for 96% of Defense segment revenue in 2024. Contracts with Defense segment customers are generally fixed-price, fixed-price with an economic price adjustment (EPA) or cost-reimbursement type contracts. Under fixed-price contracts, the price paid to the Company is generally
OSHKOSH CORPORATION
NOTES OF CONSOLIDATED FINANCIAL STATEMENTS
not adjusted to reflect the Company’s actual costs except for costs incurred as a result of contract modifications. Under fixed-price contracts with an EPA, the price paid to the Company can be adjusted upward or downward of the stated contract price based on cost indexes of labor or material that are specifically identified in the contract. Under cost-reimbursement contracts, the price paid to the Company is determined based on the allowable costs incurred to perform plus a fee. The fee component of cost-reimbursement contracts can be fixed based on negotiations at contract inception or can vary based on performance against target costs established at the time of contract inception. The Company also designs, develops and manufactures defense products for international customers through Direct Commercial Sale contracts. The Defense segment supports its products through the sale of aftermarket parts and services. Aftermarket contracts can range from long-term supply agreements to ad hoc purchase orders for replacement parts.
The Company evaluates Defense segment contracts at inception to identify performance obligations. The goods and services in Defense segment contracts are typically not distinct from one another as they are generally customized and have complex inter-relationships and the Company is responsible for overall management of the contract. As a result, Defense segment contracts are typically accounted for as a single performance obligation. The Defense segment provides standard warranties for its products for periods that typically range from one to three years. These assurance-type warranties typically cannot be purchased separately and do not meet the criteria to be considered a performance obligation.
The Company determines the transaction price for each contract at inception based on the consideration that it expects to receive for the goods and services promised under the contract. This determination is made based on the Company’s current rights, excluding the impact of any subsequent contract modifications (including unexercised options) until they become legally enforceable. Contract modifications frequently occur within the Defense segment. The Company evaluates each modification to identify changes that impact price or scope of its contracts, which are then assessed to determine if the modification should be accounted for as an adjustment to an existing contract or as a separate contract. Contract modifications within the Defense segment are generally accounted for as a cumulative catch-up adjustment to existing contracts as they are not distinct from the goods and services within the existing contract.
For Defense segment contracts that include a variable component in the sale price, the Company estimates variable consideration. Variable consideration is included within the contract’s transaction price to the extent it is probable that a significant reversal of revenue will not occur. The Company evaluates its estimates of variable consideration on an ongoing basis and any adjustments are accounted for as changes in estimates in the period identified. Common forms of variable consideration within Defense segment contracts include cost reimbursement contracts that contain incentives, EPA clauses, customer reimbursement rights and regulatory or customer negotiated penalties tied to contract performance.
The Company recognizes revenue on Defense segment contracts as performance obligations are satisfied and control of the underlying goods and services is transferred to the customer. In making this evaluation, the Defense segment considers contractual terms and whether there is an alternative use for the good or service. Through this process the Company has concluded that substantially all of the Defense segment’s performance obligations, including a majority of performance obligations for aftermarket goods and services, transfer control to the customer over time. For U.S. government and FMS program contracts, this determination is supported by the inclusion of clauses within contracts that allow the customer to terminate a contract at the customer's convenience. When these clauses are present, the Company is entitled to compensation for the work performed through the date of notification at a price that reflects actual costs plus a reasonable margin in exchange for transferring its work in process to the customer. For contracts that do not contain termination for convenience provisions, the Company generally transfers control over time as a result of enforceable payment rights and the customized nature of its goods and services, which create assets without an alternative use.
The Defense segment recognizes revenue on its performance obligations that are satisfied over time by measuring progress using the cost-to-cost method of percentage-of-completion because it best depicts the transfer of control to the customer. Under the cost-to-cost method of percentage-of-completion, the Defense segment measures progress based on the ratio of costs incurred to date to total estimated costs for the performance obligations. Due to the size and nature of these contracts, the estimation of total revenues and costs is highly complicated and judgmental. The Company must make assumptions regarding expected increases in wages and employee benefits, productivity and availability of labor, material costs and allocated fixed costs. Each contract is evaluated at contract inception to identify risks and estimate revenue and costs. In performing this
OSHKOSH CORPORATION
NOTES OF CONSOLIDATED FINANCIAL STATEMENTS
evaluation, the Defense segment considers risks of contract performance such as technical requirements, schedule, duration and key contract dependencies. Occasionally, the Company incurs production costs not planned or budgeted, or in excess of its original budget. The Company reviews such costs to determine if they are contributing and/or proportionate to the Company's progress in satisfying the performance obligation. Costs that are contributing but not proportionate to the Company's progress are reviewed to determine if they meet the definition of learning curve costs, which requires significant judgment. Learning curve costs are included in the cost-to-cost method of percentage-of-completion while costs that do not contribute to the Company's progress in satisfying the performance obligation are considered inefficiencies and expensed as incurred. The above considerations are then factored into the Company’s estimated revenue and costs. If a loss is expected on a performance obligation, the complete estimated loss is recorded in the period in which the loss is identified. The Company recognizes changes in estimated sales or costs and the resulting profit or loss on a cumulative basis.
The Company capitalizes costs of pre-production activities as costs to fulfill a contract are incurred, if such costs generate or enhance resources that will be used in satisfying performance obligations in the future and the costs are expected to be recovered. The Company has on occasion capitalized costs to fulfill a contract after the performance obligation has begun being satisfied if the fulfillment costs relate to future performance under the performance obligation, and not performance completed to date. The Company amortizes the deferred contract costs over the anticipated production volume of the contract.
Next Generation Delivery Vehicles (NGDV) contract with the United States Postal Service (USPS)
Under the NGDV contract with the USPS, the USPS made advance payments to the Company for pre-production activities, including product engineering, factory setup and development. The Company determined that these activities do not result in the transfer of distinct goods or services to the customer. There is an implicit assumption that without the customer making such advance payments to the Company, the Company would charge the customer a higher selling price for future sales of goods or services; therefore, these advance payments create a "material right", providing an option for the customer to acquire future goods or services, at a discount, that are dependent upon the pre-production activities. Revenue allocated to performance obligations that represent a material right for a customer to acquire goods or services at a discount in the future is recognized as those future goods or services are transferred or when the material right expires. Revenue related to material rights is recognized based on a percentage of actual units produced relative to the total number of units for which orders can be placed under the contract.
Assurance Warranty — Provisions for estimated assurance warranties are recorded in cost of sales at the time of sale and are periodically adjusted to reflect actual experience. The amount of warranty liability accrued reflects management’s best estimate of the expected future cost of honoring Company obligations under the warranty plans. Historically, the cost of fulfilling the Company’s warranty obligations has principally involved replacement parts, labor and sometimes travel for any field retrofit campaigns. The Company’s estimates are based on historical experience, the extent of pre-production testing, the number of units involved and the extent of features/components included in product models. Actual warranty claims experience is reviewed quarterly to determine if there are systemic defects that would require a field campaign.
Research and Development and Similar Costs — Except for customer sponsored research and development costs incurred pursuant to contracts (generally with the U.S. Department of Defense (DoD)) or engineering costs incurred pursuant to the NGDV contract with the USPS, research and development costs are expensed as incurred and included in cost of sales. Research and development costs charged to expense totaled $169.1 million, $133.6 million and $113.4 million in 2024, 2023 and 2022, respectively. Customer sponsored research and development costs incurred pursuant to contracts are accounted for as contract costs.
Advertising — Advertising costs are included in selling, general and administrative expense and are expensed as incurred. These expenses totaled $25.7 million, $25.8 million and $14.2 million in 2024, 2023 and 2022, respectively.
Debt Financing Costs — Debt issuance costs on term debt are amortized using the effective interest method over the term of the debt. Deferred financing costs on lines of credit are amortized on a straight-line basis over the term of the related lines of credit. Amortization expense was $1.6 million, $1.4 million and $1.6 million in 2024, 2023 and 2022, respectively.
OSHKOSH CORPORATION
NOTES OF CONSOLIDATED FINANCIAL STATEMENTS
Stock-Based Compensation — The Company recognizes stock-based compensation using the fair value provisions prescribed by Accounting Standards Codification (ASC) Topic 718, Compensation — Stock Compensation. Accordingly, compensation costs for awards of stock-based compensation settled in shares are determined based on the fair value of the share-based instrument at the time of grant and are recognized as expense over the vesting period of the share-based instrument, net of estimated forfeitures. See Note 5 for information regarding the Company’s stock-based incentive plans.
Income Taxes — Deferred income taxes are provided to recognize temporary differences between the financial reporting basis and the income tax basis of the Company’s assets and liabilities using currently enacted tax rates and laws. Valuation allowances are established when necessary to reduce deferred tax assets to the amount expected to be realized. In assessing the realizability of deferred tax assets, management considers whether it is more likely than not that some portion of the deferred tax assets will not be realized. The ultimate realization of deferred tax assets is dependent upon the generation of future taxable income during the periods in which those temporary differences become deductible. Management considers the scheduled reversal of deferred taxes, projected future taxable income and tax planning strategies in making this assessment.
The Company evaluates uncertain income tax positions in a two-step process. The first step is recognition, where the Company evaluates whether an individual tax position has a likelihood of greater than 50% of being sustained upon examination based on the technical merits of the position, including resolution of any related appeals or litigation processes. For tax positions that are currently estimated to have a less than 50% likelihood of being sustained, a tax benefit is not recorded. For tax positions that have met the recognition threshold, the Company performs the second step of measuring the benefit to be recorded. The actual benefits ultimately realized may differ from the Company’s estimates. In future periods, changes in facts and circumstances and new information may require the Company to change the recognition and measurement estimates with regard to individual tax positions. Changes in recognition and measurement estimates are recorded in results of operations and financial position in the period in which such changes occur.
Earnings Per Share — Earnings per share is computed by dividing net income by the weighted average number of common shares outstanding for the period. The calculation of diluted earnings per share reflects the effect of stock-based compensation awards, unless the effect of doing so would be antidilutive. The Company uses the treasury stock method to calculate the effect of outstanding stock-based compensation awards.
Fair Value of Financial Instruments — Based on Company estimates, the carrying amounts of cash equivalents, receivables, unbilled receivables, accounts payable, accrued liabilities and amounts outstanding under revolving credit facilities approximated fair value as of December 31, 2024 and 2023. See Notes 6, 14, 16, 22 and 23 for additional fair value information.
Cash and Cash Equivalents — The Company considers all highly liquid investments with a maturity of three months or less when purchased to be cash equivalents. Cash equivalents at December 31, 2024 consisted principally of bank deposits and money market instruments.
Receivables — Receivables consist of amounts billed and currently due from customers. The Company extends credit to customers in the normal course of business and maintains an allowance for estimated losses resulting from the inability or unwillingness of customers to make required payments. The accrual for expected losses is based on an estimate of the losses inherent in amounts billed, pools of receivables with similar risk characteristics, existing and future economic conditions, reasonable supportable forecasts that affect the collectability of the related receivable and any specific customer collection issues the Company has identified. Account balances are charged against the allowance when the Company determines it is probable the receivable will not be recovered.
OSHKOSH CORPORATION
NOTES OF CONSOLIDATED FINANCIAL STATEMENTS
Finance Receivables — Finance receivables represent sales-type leases resulting from the sale of the Company’s products and receivables purchased from lenders pursuant to customer defaults under program agreements with finance companies. Finance receivables originated by the Company generally include a residual value component. Residual values are determined based on the expectation that the underlying equipment will have a minimum fair market value at the end of the lease term. This residual value accrues to the Company at the end of the lease. The Company uses its experience and knowledge as an original equipment manufacturer and participant in end markets for the related products along with third-party studies to estimate residual values. The Company monitors these values for impairment on a continuous basis and reflects any resulting reductions in value in current earnings.
Unbilled Receivables — Unbilled receivables consist of unbilled costs and accrued profits related to revenues on contracts with customers that have been recognized for accounting purposes but not yet billed to customers. Amounts are billed as work progresses in accordance with agreed-upon contractual terms, either upon achievement of contractual milestones (e.g. acceptance of the vehicle) or at periodic intervals. Generally, billing occurs subsequent to revenue recognition, resulting in unbilled receivables.
Inventories — Inventories are stated at the lower of cost or net realizable value. Cost has been determined using primarily the first-in, first-out (FIFO) method.
Property, Plant and Equipment — Property, plant and equipment is recorded at cost. Depreciation expense is recognized over the estimated useful lives of the respective assets using straight-line and accelerated methods. The units-of-production depreciation method is also used for certain assets related to the production of delivery vehicles.
The Company's estimated useful lives are as follows:
| |
| Years |
Land improvements | 10 - 40 |
Buildings | 10 - 40 |
Machinery and equipment | 4 - 25 |
Software and related costs | 3 - 10 |
The Company capitalizes interest on borrowings during the active construction period of major capital projects. All capitalized interest has been added to the cost of the underlying assets and is amortized over the useful lives of the assets.
Goodwill — Goodwill reflects the cost of an acquisition in excess of the aggregate fair value assigned to identifiable net assets acquired. Goodwill is not amortized; however, it is assessed for impairment annually and as triggering events or “indicators of potential impairment” occur. The Company performs its annual impairment test at the beginning of the fourth quarter of each year. The Company evaluates the recoverability of goodwill by estimating the fair value of the businesses to which the goodwill relates. Estimated cash flows and related goodwill are grouped at the reporting unit level. A reporting unit is an operating segment or, under certain circumstances, a component of an operating segment. When a reporting unit's fair value is less than its carrying value, an impairment loss is recognized for the difference between the fair value of the reporting unit and its carrying value, limited to the carrying value of goodwill.
OSHKOSH CORPORATION
NOTES OF CONSOLIDATED FINANCIAL STATEMENTS
In evaluating the recoverability of goodwill, it is necessary to estimate the fair value of the reporting units. The Company evaluates the recoverability of goodwill utilizing the income approach and the market approach. The Company weighted the income approach more heavily (75%) as the Company believes the income approach more accurately considers long-term fluctuations in the U.S. and European construction markets than the market approach. Under the income approach, the Company determines fair value based on estimated future cash flows discounted by an estimated weighted-average cost of capital, which reflects the overall level of inherent risk of a reporting unit and the rate of return a market participant would expect to earn. Estimated future cash flows are based on the Company’s internal projection models, industry projections and other assumptions deemed reasonable by management. Rates used to discount estimated cash flows correspond to the Company’s cost of capital, adjusted for risk where appropriate, and are dependent upon interest rates at a point in time. There are inherent uncertainties related to these factors and management’s judgment in applying them to the analysis of goodwill recoverability. Under the market approach, the Company derives the fair value of its reporting units based on revenue and earnings multiples of comparable publicly traded companies. It is possible that assumptions underlying the impairment analysis will change in such a manner that impairment may occur in the future. See Note 12 for information regarding the Company’s impairment testing.
Purchased Intangible Assets — At acquisition, the Company estimates and records the fair values of purchased intangible assets, which primarily consist of trade names, customer relationships and technology. The fair values of purchased intangible assets are estimated principally based on projections of cash flows that will arise from identifiable intangible assets of acquired businesses, which include estimates of discount rates, revenue growth rates, EBITDA, royalty rates, customer attrition rates and technology obsolescence rates. Amortizable purchased intangible assets are amortized on a straight-line basis over their estimated useful lives.
Certain of the Company's trade names are considered to be indefinite-lived and therefore are not amortized. Non-amortizable trade names are assessed for impairment annually and as triggering events or “indicators of potential impairment” occur. The Company performs its annual impairment test in the fourth quarter of each year. The Company evaluates the potential impairment by estimating the fair value of the non-amortizing intangible assets using the “relief-from-royalty” method. When the fair value of the non-amortizable trade name is less than the carrying value of the trade name, an impairment is recognized for the difference between the fair value and the carrying value of the trade name, limited to its carrying value.
Impairment of Other Long-Lived Assets — Property, plant and equipment, ROU lease assets and amortizable intangible assets are reviewed for impairment whenever events or changes in circumstances indicate that the carrying amount may not be recoverable. If the sum of the expected undiscounted cash flows is less than the carrying value of the related asset or group of assets, an impairment is recognized for the difference between the fair value and carrying value of the asset or group of assets.
Leases — The Company leases certain real estate, information technology equipment, warehouse equipment, vehicles and other equipment through leases. The Company determines whether an arrangement contains a lease at inception. A lease liability and corresponding right of use asset are recognized for qualifying leased assets based on the present value of fixed and certain index-based lease payments at lease commencement. Variable payments, which are generally determined based on the usage rate of the underlying asset, are excluded from the present value of lease payments and are recognized in the period in which the payment is made. To determine the present value of lease payments, the Company uses the stated interest rate in the lease, when available, or more commonly a secured incremental borrowing rate that reflects risk, term and economic environment in which the lease is denominated. The incremental borrowing rate is determined using a portfolio approach based on the current rate of interest that the Company would have to pay to borrow an amount equal to the lease payments on a collateralized basis over a similar term. The Company has elected not to separate payments for lease components from payments for non-lease components in contracts that contain both components. Lease agreements may include options to extend or terminate the lease. Those options that are reasonably certain of exercise at lease commencement have been included in the term of the lease used to recognize the right of use assets and lease liabilities. The lease terms of the Company’s real estate and equipment leases extend up to 26 years and 20 years, respectively. The Company has elected not to recognize right-of-use (ROU) assets or lease liabilities for leases with a term of twelve months or less. Expense is recognized on a straight-line basis over the lease term for operating leases.
OSHKOSH CORPORATION
NOTES OF CONSOLIDATED FINANCIAL STATEMENTS
Customer Advances — Customer advances include amounts received in advance of the completion of goods or services. Certain advances in the Vocational segment bear interest at fixed rates determined at the time of the advance.
Other Non-current Liabilities — Other non-current liabilities are comprised principally of the portions of the Company’s lease liabilities, unrecognized tax benefits, pension and other post-employment benefit liabilities, accrued warranty and accrued product liability that are not expected to be settled in the subsequent twelve-month period.
Foreign Currency Translation — All balance sheet accounts have been translated into U.S. dollars using the exchange rates in effect at the balance sheet date. Income statement amounts have been translated using the average exchange rate during the period in which the transactions occurred. Resulting translation adjustments are included in “Other comprehensive income (loss).” Foreign currency transaction gains or losses are included in “Miscellaneous, net” in the Consolidated Statements of Income. The Company recorded a net foreign currency transaction loss of $2.8 million in 2024, a net foreign currency transaction gain of $4.7 million in 2023 and a net foreign currency transaction loss of $6.9 million in 2022.
Derivative Financial Instruments — The Company recognizes all derivative financial instruments, such as foreign exchange contracts, in the consolidated financial statements at fair value regardless of the purpose or intent for holding the instrument. Changes in the fair value of derivative financial instruments are either recognized periodically in income or in equity as a component of comprehensive income depending on whether the derivative financial instrument qualifies for hedge accounting, and if so, whether it qualifies as a fair value hedge or cash flow hedge. Generally, changes in fair values of derivatives accounted for as fair value hedges are recorded in income along with the portions of the changes in the fair values of the hedged items that relate to the hedged risks. Changes in fair values of derivatives accounted for as cash flow hedges, to the extent they are effective as hedges, are initially recorded in other comprehensive income, net of deferred income taxes. Changes in fair value of derivatives not qualifying as hedges are reported in income each period. Cash flows from derivatives that are accounted for as cash flow or fair value hedges are included in the Consolidated Statements of Cash Flows in the same category as the item being hedged.
Concentration of Credit Risk — Financial instruments that potentially subject the Company to significant concentrations of credit risk consist principally of cash equivalents, trade accounts receivable, unbilled receivables and guarantees of certain customers’ obligations under deferred payment contracts and lease purchase agreements.
The Company maintains cash and cash equivalents, and other financial instruments, with various major financial institutions. The Company performs periodic evaluations of the relative credit standing of these financial institutions and limits the amount of credit exposure with any institution.
Concentration of credit risk with respect to trade accounts and finance receivables is limited due to the large number of customers and their dispersion across many geographic areas. However, a significant amount of trade accounts receivable and unbilled receivables are with the U.S. government, rental companies globally, municipalities and several large waste haulers in the United States. The Company continues to monitor credit risk associated with its trade receivables.
Concentration of Supply of Labor — At December 31, 2024, approximately 22% of the Company’s workforce was covered under collective bargaining agreements.
Reclassifications — Certain reclassifications have been made to the prior period financial statements to conform with the 2024 presentation and improve comparability between periods. "Intangible asset impairments", which was previously presented within "Other non-cash adjustments" within the Consolidated Statement of Cash Flows, is now presented as a separate line item. "Deferred contract costs", which was previously presented within "Other non-current assets and liabilities" within the Consolidated Statement of Cash Flows, is now presented as a separate line item. "Other current assets" and "Other non-current assets and liabilities", which were previously presented as separate line items within the Consolidated Statements of Cash Flows, are now presented within "Other operating assets and liabilities".
OSHKOSH CORPORATION
NOTES OF CONSOLIDATED FINANCIAL STATEMENTS
Recent Accounting Pronouncements — In November 2023, the Financial Accounting Standards Board (FASB) issued Accounting Standards Update (ASU) 2023-07, Segment Reporting (Topic 280), Improvements to Reportable Segment Disclosures. The standard improves reportable segment disclosure requirements, primarily through enhanced disclosures about significant segment expenses. The Company adopted ASU 2023-07 for its 2024 annual report on Form 10-K. The adoption of ASU 2023-07 did not have a material impact on the Company’s consolidated financial statements.
In December 2023, the FASB issued ASU 2023-09, Income Taxes (Topic 740), Improvements to Income Tax Disclosures. The standard requires that public business entities (1) disclose specific categories in the income tax rate reconciliation and (2) provide additional information for reconciling items if the effect of those reconciling items is equal to or greater than 5% of the amount computed by multiplying pre-tax income or loss by the applicable statutory income tax rate. The standard also requires additional disclosures about income taxes paid, the allocation of income or loss from continuing operations disaggregated between domestic and foreign and income tax expense disaggregated by federal, state and foreign. The Company will be required to adopt ASU 2023-09 for its Annual Report on Form 10-K for the year ended December 31, 2025. The Company does not expect the adoption of ASU 2023-09 will have a material impact on the Company’s consolidated financial statements.
In November 2024, the FASB issued ASU 2024-03, Income Statement—Reporting Comprehensive Income—Expense Disaggregation Disclosures (Subtopic 220-40): Disaggregation of Income Statement Expenses, which is intended to improve disclosures about a public business entity's expenses and provide more detailed information to investors about the types of expenses in commonly presented expense captions. The Company will be required to adopt ASU 2024-03 for its Annual Report on Form 10-K for the year ended December 31, 2027. The ASU may be applied either prospectively or retrospectively. The Company is currently evaluating the impact of this ASU on its consolidated financial statements.
3. Acquisitions and Divestitures
Acquisition of AUSA
On September 3, 2024, the Company acquired 100% of AUSACORP S.L. (AUSA), a privately held Spanish manufacturer of wheeled dumpers, rough terrain forklifts and telehandlers, for €103.6 million ($114.5 million), net of cash acquired. AUSA is part of the Access segment. The results of AUSA have been included in the Company’s Consolidated Statements of Income from the date of acquisition. AUSA had sales of $43.9 million from the acquisition date to December 31, 2024. Pro forma results of operations have not been presented as the effect of the acquisition is not material to any periods presented.
The following table summarizes the preliminary fair values of the assets acquired and liabilities assumed as of the date of acquisition (in millions):
| | | | |
Assets Acquired: | | | |
Cash and cash equivalents | | $ | 11.1 | |
| | | |
Current assets, excluding cash and cash equivalents | | $ | 64.2 | |
Property, plant and equipment | | | 18.7 | |
Goodwill | | | 53.5 | |
Purchased intangible assets | | | 32.0 | |
Other non-current assets | | | 1.2 | |
Total assets, excluding cash and cash equivalents | | $ | 169.6 | |
| | | |
Liabilities Assumed: | | | |
Current liabilities | | $ | 44.3 | |
Deferred income taxes | | | 7.2 | |
Non-current liabilities | | | 3.6 | |
Total liabilities | | $ | 55.1 | |
Net assets acquired | | $ | 114.5 | |
OSHKOSH CORPORATION
NOTES OF CONSOLIDATED FINANCIAL STATEMENTS
The preliminary valuation of intangible assets consisted of the following assets subject to amortization (in millions, except weighted average useful life):
| | | | | | | | | | |
| | Fair
Value | | | Weighted-
Average
Useful Life | | Valuation
Methodology | | Key
Assumptions |
Customer relationships | | $ | 18.0 | | | 6.0 years | | Multi-period excess earnings | | Discount rate, customer attrition rate |
Technology-related | | | 5.5 | | | 4.0 years | | Relief-from-royalty | | Royalty rate, discount rate, obsolescence factor |
Trade name | | | 4.6 | | | 10.0 years | | Relief-from-royalty | | Royalty rate, discount rate |
Other | | | 3.9 | | | 1.3 years | | Multi-period excess earnings | | Discount rate |
The purchase price, net of cash acquired, was allocated based on the estimated fair value of the assets acquired and liabilities assumed at the date of acquisition with the excess purchase price recorded as goodwill, all of which was allocated to the Access segment. The goodwill is primarily the result of expected synergies, including leveraging JLG's brand, channel, e-commerce platform and parts distribution capabilities to increase both sales in North America and aftermarket part sales globally. Goodwill and purchased intangible assets are not deductible for income tax purposes. Amortization expense of purchased intangible assets is primarily recognized on a straight-line basis.
Due to the timing of the acquisition and the nature of the net assets acquired, the purchase price allocations are preliminary at December 31, 2024 and may be subsequently adjusted to reflect the finalization of appraisals and other valuation studies, as well as resolution of customary post-closing adjustments. The Company made certain measurement period adjustments in the fourth quarter of 2024 as a result of appraisals and valuation studies, the most significant of which resulted in an increase in property, plant and equipment of $5.8 million and a decrease in purchased intangible assets of $5.0 million. Selling, general and administrative expense in 2024 included $1.1 million of transaction costs related to the acquisition of AUSA.
Acquisition of AeroTech
On August 1, 2023, the Company acquired 100% of AeroTech from JBT Corporation for $804.6 million. AeroTech, a leading provider of aviation ground support products, gate equipment and airport services provided to commercial airlines, airports, air-freight carriers, ground handling customers and the military, is part of the Vocational segment. The purchase price included $808.0 million in cash, a receivable of $10.0 million for certain post-closing information technology integration costs, a payable of $5.1 million for certain post-closing working capital adjustments and a payable of $1.5 million for required equity replacement awards. During the first quarter of 2024, the Company paid JBT Corporation $5.1 million for post-closing working capital adjustments. The results of AeroTech have been included in the Company’s Consolidated Statements of Income from the date of acquisition. AeroTech had sales of $292.2 million and an operating loss of $5.7 million from the acquisition date to December 31, 2023.
OSHKOSH CORPORATION
NOTES OF CONSOLIDATED FINANCIAL STATEMENTS
The following table summarizes the fair values of the assets acquired and liabilities assumed as of the date of acquisition (in millions):
| | | | |
Assets Acquired: | | | |
Cash and cash equivalents | | $ | 9.3 | |
| | | |
Accounts receivable | | $ | 75.0 | |
Unbilled receivables | | | 57.8 | |
Inventory | | | 153.7 | |
Other current assets | | | 7.6 | |
Property, plant and equipment | | | 44.6 | |
Goodwill | | | 262.0 | |
Purchased intangible assets | | | 330.4 | |
Other non-current assets | | | 7.6 | |
Total assets, excluding cash and cash equivalents | | $ | 938.7 | |
| | | |
Liabilities Assumed: | | | |
Accounts payable | | $ | 63.2 | |
Customer advances | | | 24.8 | |
Payroll-related obligations | | | 13.8 | |
Other current liabilities | | | 19.5 | |
Deferred income taxes | | | 4.5 | |
Non-current liabilities | | | 8.3 | |
Total liabilities | | $ | 134.1 | |
Net assets acquired | | $ | 804.6 | |
The valuation of intangible assets consisted of the following assets subject to amortization (in millions, except weighted average useful life):
| | | | | | | | | | |
| | Fair
Value | | | Weighted-
Average
Useful Life | | Valuation
Methodology | | Key
Assumptions |
Customer relationships | | $ | 217.0 | | | 9.0 years | | Multi-period excess earnings | | Discount rate, customer attrition rates |
Trade names | | | 65.1 | | | 12.6 years | | Relief-from-royalty | | Royalty rate, discount rate |
Technology-related | | | 28.3 | | | 5.0 years | | Relief-from-royalty | | Royalty rate, discount rate, obsolescence factor |
Other | | | 20.0 | | | 2.1 years | | Multi-period excess earnings | | Discount rate |
The purchase price, net of cash acquired, was allocated based on the estimated fair value of the assets acquired and liabilities assumed at the date of acquisition with the excess purchase price recorded as goodwill, all of which was allocated to the Vocational segment. The majority of the goodwill is deductible for income tax purposes. The purchase price allocations were considered final as of June 30, 2024. Selling, general and administrative expense in 2023 included $12.9 million of transaction costs related to the acquisition of AeroTech.
Unaudited pro forma financial information
The following table presents the supplemental consolidated results of the Company for 2023 and 2022 on an unaudited pro forma basis as if the acquisition of AeroTech had been completed on January 1, 2022 (in millions). The primary adjustments reflected in the unaudited pro forma information related to (1) increase in interest expense for debt used to fund the acquisition and lower interest income due to less cash on hand available to be invested, (2) changes related to purchase accounting primarily related to amortization of purchased intangible assets recorded in conjunction with the acquisition and amortization of the inventory fair value step-up recorded as of the acquisition date, and (3) removal of transaction costs related to the acquisition from 2023 (and included in 2022). Adjustments to net income have been reflected net of income tax effects. The unaudited pro forma information does not include any anticipated cost savings or other effects of future integration efforts and does not purport to be indicative of results that actually would have been achieved if the operations were combined during the
OSHKOSH CORPORATION
NOTES OF CONSOLIDATED FINANCIAL STATEMENTS
periods presented and is not intended to be a projection. The unaudited pro forma financial information does not reflect any potential cost savings, operating efficiencies, debt pay down, financial synergies or other strategic benefits as a result of the acquisition or any restructuring costs to achieve those benefits.
| | | | | | | | |
| | Year Ended December 31, | |
| | 2023 | | | 2022 | |
Net sales | | $ | 10,002.4 | | | $ | 8,858.4 | |
Net income | | $ | 592.5 | | | $ | 143.5 | |
Acquisition of Hinowa
In January 2023, the Company acquired Hinowa S.p.A. (Hinowa), an Italian manufacturer of compact crawler booms and tracked equipment, for €171.8 million ($186.8 million), net of cash acquired. Hinowa is part of the Access segment. The results of Hinowa have been included in the Company’s Consolidated Statements of Income from the date of acquisition. Pro forma results of operations have not been presented as the effect of the acquisition is not material to any periods presented.
Divestitures
In March 2023, the Company completed the sale of its rear-discharge concrete mixer business for $32.9 million. As the sale price was below the carrying value of the business, a pre-tax loss of $13.3 million was recognized in selling, general and administrative expense during the first quarter of 2023. The rear-discharge concrete mixer business, which was included in the Vocational segment, had sales of $179.5 million in 2022.
In July 2023, the Company completed the sale of its snow removal apparatus business for $17.1 million. A pre-tax gain of $8.0 million was recognized in selling, general and administrative expense during the third quarter of 2023. The snow removal apparatus business, which was included in the Defense segment, had sales of $15.3 million in 2022.
4. Revenue Recognition
The Company utilizes the cost-to-cost method of percentage-of-completion to recognize revenue on the majority of its performance obligations that are satisfied over time because it best depicts the transfer of control to the customer. Under the cost-to-cost method of percentage-of-completion, the Company measures progress based on the ratio of costs incurred to date to total estimated costs for the performance obligation. The Company recognizes changes in estimated sales or costs and the resulting profit or loss on a cumulative basis. Contract adjustments represent the cumulative effect of the changes on prior periods. If a loss is expected on a performance obligation, the complete estimated loss is recorded in the period in which the loss is identified.
There is significant judgment involved in estimating costs, most notably within the Defense segment. Each contract is evaluated to identify risks and estimate revenue and costs. In performing this evaluation, the Defense segment considers risks of contract performance such as technical requirements, schedule, duration and key contract dependencies. Contract estimates are subject to change throughout the duration of the contract as additional information becomes available that impacts risks and estimated revenue and costs. In addition, as contract modifications such as new orders are received, the additional units are factored into the overall contract estimate of costs and transaction price. During 2024, the Company experienced significant costs to prepare units for acceptance as well as received orders that required loss reserves, resulting in significant unfavorable cumulative catch-up adjustments. During 2022, the Company experienced significant inflation in its material, labor and overhead costs. As some of the Company's contracts include fixed prices, these increases caused significant unfavorable
OSHKOSH CORPORATION
NOTES OF CONSOLIDATED FINANCIAL STATEMENTS
cumulative catch-up adjustments. Net contract adjustments impacted the Company’s results as follows (in millions, except per share amounts):
| | | | | | | | | | | | |
| | Year Ended December 31, | |
| | 2024 | | | 2023 | | | 2022 | |
Net sales | | $ | (27.3 | ) | | $ | 18.8 | | | $ | (33.9 | ) |
Operating income | | | (44.8 | ) | | | 2.9 | | | | (46.2 | ) |
Net income | | | (34.3 | ) | | | 2.2 | | | | (35.4 | ) |
Diluted earnings per share | | $ | (0.52 | ) | | $ | 0.03 | | | $ | (0.54 | ) |
The Defense segment incurs pre-production engineering, factory setup and other contract fulfillment costs related to products produced for its customers under long-term contracts. An asset is recognized for costs incurred to fulfill an existing contract or highly-probable anticipated contract if such costs generate or enhance resources that will be used in satisfying performance obligations in the future and the costs are expected to be recovered. Costs related to customer-owned tooling that will be used in production and for which the customer has provided a non-cancelable right to use the tooling to perform during the contract term are also recognized as a deferred contract cost asset. Deferred contract costs related to the NGDV contract with the USPS are amortized over the anticipated production volume of the NGDV contract. The Company periodically assesses its contract fulfillment and customer-owned tooling for impairment. The Company did not recognize any impairment losses on contract fulfillment or customer-owned tooling costs in 2024, 2023 or 2022.
Deferred contract costs, the majority of which are related to the NGDV contract, consisted of the following (in millions):
| | | | | | | | |
| | December 31, | |
| | 2024 | | | 2023 | |
Costs for anticipated contracts | | $ | 6.7 | | | $ | 6.2 | |
Engineering costs | | | 506.1 | | | | 439.6 | |
Factory setup costs | | | 52.5 | | | | 44.4 | |
Customer-owned tooling | | | 277.3 | | | | 220.5 | |
Deferred contract costs | | $ | 842.6 | | | $ | 710.7 | |
The Company estimates that approximately $155.0 million of the deferred contract costs would not be absorbed based on existing orders at December 31, 2024.
Changes in the Company’s deferred contract costs were as follows (in millions):
| | | | | | | | | | | | |
| | Year Ended December 31, | |
| | 2024 | | | 2023 | | | 2022 | |
Balance at beginning of period | | $ | 710.7 | | | $ | 415.8 | | | $ | 73.2 | |
Additions to deferred contract costs | | | 136.1 | | | | 305.7 | | | | 342.6 | |
Amortization of deferred contract costs | | | (4.2 | ) | | | (10.8 | ) | | | — | |
Balance at end of period | | $ | 842.6 | | | $ | 710.7 | | | $ | 415.8 | |
Disaggregation of Revenue
Consolidated net sales disaggregated by segment and timing of revenue recognition are as follows (in millions):
| | | | | | | | | | | | | | | | | | | | |
| | Year Ended December 31, 2024 | |
| | Access | | | Vocational | | | Defense | | | Corporate and Other | | | Total | |
Point in time | | $ | 5,097.8 | | | $ | 2,459.4 | | | $ | 16.6 | | | $ | (3.3 | ) | | $ | 7,570.5 | |
Over time | | | 66.9 | | | | 850.9 | | | | 2,138.6 | | | | 103.3 | | | | 3,159.7 | |
| | $ | 5,164.7 | | | $ | 3,310.3 | | | $ | 2,155.2 | | | $ | 100.0 | | | $ | 10,730.2 | |
OSHKOSH CORPORATION
NOTES OF CONSOLIDATED FINANCIAL STATEMENTS
| | | | | | | | | | | | | | | | | | | | |
| | Year Ended December 31, 2023 | |
| | Access | | | Vocational | | | Defense (a) | | | Corporate and Other (a) | | | Total | |
Point in time | | $ | 4,936.5 | | | $ | 2,001.4 | | | $ | 12.1 | | | $ | (8.4 | ) | | $ | 6,941.6 | |
Over time | | | 53.5 | | | | 576.7 | | | | 1,989.3 | | | | 96.8 | | | | 2,716.3 | |
| | $ | 4,990.0 | | | $ | 2,578.1 | | | $ | 2,001.4 | | | $ | 88.4 | | | $ | 9,657.9 | |
| | | | | | | | | | | | | | | | | | | | |
| | Year Ended December 31, 2022 | |
| | Access | | | Vocational | | | Defense (a) | | | Corporate and Other (a) | | | Total | |
Point in time | | $ | 3,923.4 | | | $ | 1,757.2 | | | $ | 13.0 | | | $ | (7.1 | ) | | $ | 5,686.5 | |
Over time | | | 48.7 | | | | 418.5 | | | | 2,046.1 | | | | 82.2 | | | | 2,595.5 | |
| | $ | 3,972.1 | | | $ | 2,175.7 | | | $ | 2,059.1 | | | $ | 75.1 | | | $ | 8,282.0 | |
(a)Results have been reclassified to reflect the change in responsibility for Pratt Miller.
See Note 24 for further disaggregated sales information.
Contract Assets and Contract Liabilities
The timing of billing does not always match the timing of revenue recognition. In instances where the Company recognizes revenue prior to billing, the Company records a contract asset. The Company reduces contract assets when the Company has an unconditional right to payment. The Company periodically assesses its contract assets for impairment. The Company did not record any impairment losses on contract assets in 2024, 2023 or 2022.
The Company is generally entitled to bill its customers upon satisfaction of its performance obligations, except for its long-term contracts in the Defense segment which typically allow for billing upon acceptance of the finished goods, payments received from customers in advance of performance, payments received for a material right to purchase future goods or services and extended warranties that are billed in advance of the warranty coverage period. Customer payment terms generally do not exceed one year. See Note 9 for additional information on the Company’s receivables balances.
With the exception of Pierce, the Company’s contracts typically do not contain a significant financing component. Pierce customers earn interest on customer advances at a rate determined in a separate financing transaction between Pierce and the customer at contract inception. Interest charges for amounts due on customer advances are recorded in “Interest expense” and were $39.2 million, $25.9 million and $23.4 million in 2024, 2023 and 2022, respectively.
In instances where a customer pays consideration in advance or when the Company is entitled to bill a customer in advance of recognizing the related revenue, the Company records a contract liability. The Company reduces contract liabilities when the Company transfers control of the promised goods and services. Contract assets and liabilities are determined on a net basis for each contract. Contract liabilities consisted of the following (in millions):
| | | | | | | | |
| | December 31, | |
| | 2024 | | | 2023 | |
Customer advances | | $ | 648.8 | | | $ | 706.9 | |
Other current liabilities | | | 113.6 | | | | 96.2 | |
Non-current customer advances | | | 1,154.4 | | | | 1,190.7 | |
Other non-current liabilities | | | 72.7 | | | | 68.5 | |
Total contract liabilities | | $ | 1,989.5 | | | $ | 2,062.3 | |
OSHKOSH CORPORATION
NOTES OF CONSOLIDATED FINANCIAL STATEMENTS
Revenue recognized during the period from beginning contract liabilities was as follows (in millions):
| | | | | | | | | | | | |
| | Year Ended December 31, | |
| | 2024 | | | 2023 | | | 2022 | |
Beginning liabilities recognized in revenue | | $ | 640.7 | | | $ | 582.7 | | | $ | 436.9 | |
The Company offers a variety of service-type warranties, including optionally priced extended warranty programs. Outstanding balances related to service-type warranties are included within contract liabilities. Revenue related to service-type warranties is deferred until after the expiration of the standard warranty period. The revenue is then recognized over the term of the service-type warranty period in proportion to the costs that are expected to be incurred. Changes in the Company’s service-type warranties were as follows (in millions):
| | | | | | | | | | | | |
| | Year Ended December 31, | |
| | 2024 | | | 2023 | | | 2022 | |
Balance at beginning of period | | $ | 85.4 | | | $ | 76.1 | | | $ | 66.9 | |
Deferred revenue for new service warranties | | | 43.7 | | | | 34.2 | | | | 31.5 | |
Amortization of service warranty revenue | | | (32.9 | ) | | | (25.1 | ) | | | (21.7 | ) |
Foreign currency translation | | | (0.2 | ) | | | 0.2 | | | | (0.6 | ) |
Balance at end of period | | $ | 96.0 | | | $ | 85.4 | | | $ | 76.1 | |
Classification of service-type warranties in the Consolidated Balance Sheets consisted of the following (in millions):
| | | | | | | | |
| | December 31, | |
| | 2024 | | | 2023 | |
Other current liabilities | | $ | 36.0 | | | $ | 30.9 | |
Other non-current liabilities | | | 60.0 | | | | 54.5 | |
| | $ | 96.0 | | | $ | 85.4 | |
Remaining Performance Obligations
As of December 31, 2024, the Company had unsatisfied performance obligations for contracts with an original duration greater than one year totaling $12.11 billion, of which $4.08 billion is expected to be satisfied and recognized in revenue in 2025, $4.01 billion is expected to be satisfied and recognized in revenue in 2026 and $4.02 billion is expected to be satisfied and recognized in revenue beyond 2026.
5. Stock-Based Compensation
In May 2024, the Company's shareholders approved the 2024 Incentive Stock and Awards Plan (the "2024 Stock Plan"). The 2024 Stock Plan replaced the 2017 Incentive Stock Awards Plan (as amended, the "2017 Stock Plan"). While no new awards will be granted under the 2017 Stock Plan, awards previously made under that plan that were outstanding as of the approval date of the 2024 Stock Plan will remain outstanding and continue to be governed by the provisions of that plan. At December 31, 2024, the Company had reserved 3,655,460 shares of Common Stock available for issuance to provide for the issuance of Common Stock under incentive compensation awards and the exercise of outstanding stock options, with 2,613,360 shares remaining available for issuance.
Under the 2024 Stock Plan, officers, directors, including non-employee directors, and employees of the Company may be granted stock options, stock appreciation rights (SAR), performance shares, performance units, shares of Common Stock, restricted stock, restricted stock units (RSU) or other stock-based awards. The 2024 Stock Plan provides for the granting of options to purchase shares of the Company’s Common Stock at not less than the fair market value of such shares on the date of grant. The market value of restricted stock unit awards are determined based on the closing market price of the Company’s Common Stock on the date of grant. Except to the extent vesting is accelerated upon early retirement and except for performance shares and performance units, vesting is based solely on continued service as an employee of the Company. The
OSHKOSH CORPORATION
NOTES OF CONSOLIDATED FINANCIAL STATEMENTS
Company recognizes stock-based compensation expense over the requisite service period for vesting of an award, or to an employee’s eligible retirement date, if earlier and applicable.
Total stock-based compensation expense was as follows (in millions):
| | | | | | | | | | | | |
| | Year Ended December 31, | |
| | 2024 | | | 2023 | | | 2022 | |
Stock awards | | $ | 30.2 | | | $ | 24.9 | | | $ | 25.7 | |
Performance share awards | | | 7.9 | | | | 7.0 | | | | 2.6 | |
Stock options | | | - | | | | - | | | | 0.3 | |
Cash-settled restricted stock unit awards | | | 0.6 | | | | 0.7 | | | | 0.9 | |
Cash-settled stock appreciation rights | | | (0.1 | ) | | | 0.2 | | | | (0.8 | ) |
Total stock-based compensation cost | | | 38.6 | | | | 32.8 | | | | 28.7 | |
Income tax benefit recognized for stock-based compensation | | | (4.8 | ) | | | (4.4 | ) | | | (4.2 | ) |
Stock-based compensation cost, net of tax | | $ | 33.8 | | | $ | 28.4 | | | $ | 24.5 | |
Stock Awards — A summary of the Company’s stock award activity (including shares and units) is as follows:
| | | | | | | | | | | | | | | | | | | | | | | | |
| | Year Ended December 31, | |
| | 2024 | | | 2023 | | | 2022 | |
| | Number of Shares | | | Weighted-
Average
Grant Date
Fair Value | | | Number of Shares | | | Weighted-
Average
Grant Date
Fair Value | | | Number of Shares | | | Weighted-
Average
Grant Date
Fair Value | |
Nonvested, beginning of period | | | 462,429 | | | $ | 98.28 | | | | 363,661 | | | $ | 103.86 | | | | 308,941 | | | $ | 90.10 | |
Granted | | | 327,976 | | | | 107.46 | | | | 344,484 | | | | 90.91 | | | | 255,375 | | | | 109.66 | |
Forfeited | | | (24,649 | ) | | | 103.79 | | | | (43,602 | ) | | | 97.85 | | | | (26,020 | ) | | | 97.24 | |
Vested | | | (228,101 | ) | | | 102.07 | | | | (202,114 | ) | | | 95.85 | | | | (174,635 | ) | | | 88.98 | |
Nonvested, end of period | | | 537,655 | | | $ | 102.02 | | | | 462,429 | | | $ | 98.28 | | | | 363,661 | | | $ | 103.86 | |
The total fair value of shares vested was $24.9 million, $18.4 million and $16.3 million in 2024, 2023 and 2022, respectively. The actual income tax benefit realized totaled $3.7 million, $2.8 million and $2.5 million in 2024, 2023 and 2022, respectively.
As of December 31, 2024, total unrecognized compensation cost related to stock awards was $18.8 million, net of estimated forfeitures, which the Company expects to be recognized over a weighted-average period of 2.2 years.
Performance Share Awards — A summary of the Company’s performance share awards activity is as follows.
| | | | | | | | | | | | | | | | | | | | | | | | |
| | Year Ended December 31, | |
| | 2024 | | | 2023 | | | 2022 | |
| | Number of Shares | | | Weighted-
Average
Grant Date
Fair Value | | | Number of Shares | | | Weighted-
Average
Grant Date
Fair Value | | | Number of Shares | | | Weighted-
Average
Grant Date
Fair Value | |
Nonvested, beginning of period | | | 123,959 | | | $ | 110.40 | | | | 97,600 | | | $ | 108.20 | | | | 72,475 | | | $ | 93.62 | |
Granted | | | 76,358 | | | | 124.76 | | | | 81,208 | | | | 100.08 | | | | 57,250 | | | | 126.60 | |
Forfeited | | | (21,947 | ) | | | 111.83 | | | | (9,733 | ) | | | 111.50 | | | | (3,748 | ) | | | 114.83 | |
Performance adjustments | | | (1,241 | ) | | | 117.61 | | | | 8,479 | | | | 81.06 | | | | 369 | | | | 107.45 | |
Vested | | | (51,725 | ) | | | 119.10 | | | | (53,595 | ) | | | 85.90 | | | | (28,746 | ) | | | 103.47 | |
Nonvested, end of period | | | 125,404 | | | $ | 113.25 | | | | 123,959 | | | $ | 110.40 | | | | 97,600 | | | | 108.20 | |
OSHKOSH CORPORATION
NOTES OF CONSOLIDATED FINANCIAL STATEMENTS
Performance share awards generally vest over a three-year service period following the grant date. Performance shares vest under three separate sets of measurement criteria. The first type vest only if the Company’s total shareholder return (TSR) over the three-year term of the awards compares favorably to that of a comparator group of companies. The second type vest only if the Company’s return on invested capital (ROIC) over the vesting period compares favorably to that of a comparator group of companies. The third type vest only if the Company’s actual results for Diversity, Equity and Inclusion and Environmental, Social and Governance (DEI/ESG) measures compare favorably to the targets set by the Company.
Potential payouts range from zero to 200% of the target awards and changes from target amounts are reflected as performance adjustments. Actual payouts for TSR performance share awards vesting were 65%, 108% and 83% of target levels in 2024, 2023 and 2022, respectively. Actual payout for the ROIC performance share awards vesting were 138%, 129% and 122% of target levels in 2024, 2023 and 2022, respectively. Actual payout for DEI/ESG awards vesting in 2024 was 67%. No DEI/ESG awards vested in 2023 or 2022.
The total fair value of performance shares vested was $5.1 million, $5.1 million and $2.3 million in 2024, 2023 and 2022, respectively. The actual income tax benefit realized totaled $0.1 million, $0.3 million and $0.1 million in 2024, 2023 and 2022, respectively.
As of December 31, 2024, the Company had $9.3 million of unrecognized compensation expense related to performance share awards, which will be recognized over a weighted-average period of 1.7 years.
The grant date fair values of the TSR performance share awards were estimated using a Monte Carlo simulation model utilizing the following weighted-average assumptions:
| | | | | | | | | | | | |
| | Year Ended December 31, | |
Total Shareholder Return Performance Shares Granted During | | 2024 | | | 2023 | | | 2022 | |
Weighted-average fair value | | $ | 146.49 | | | $ | 110.94 | | | $ | 146.99 | |
Assumptions: | | | | | | | | | |
Expected term (in years) | | | 2.86 | | | | 2.86 | | | | 2.86 | |
Expected volatility | | | 30.60 | % | | | 35.45 | % | | | 38.52 | % |
Risk-free interest rate | | | 4.41 | % | | | 4.32 | % | | | 1.64 | % |
The Company used its historical stock prices as the basis for the Company’s volatility assumption. The assumed risk-free interest rates were based on U.S. Treasury rates in effect at the time of grant. The expected term was based on the vesting period.
The grant date fair values of the ROIC and DEI/ESG awards were determined based on the Company’s stock price at the time of the grant and the anticipated awards expected to vest. Compensation expense is recorded ratably over the vesting period based on the amount of award that is expected to be earned under the plan formula, adjusted each reporting period based on current information.
Stock Options — No stock options were granted during 2024, 2023 or 2022. A summary of the Company’s stock option activity is as follows:
| | | | | | | | | | | | | | |
| | Year Ended December 31, 2024 | |
| | Options | | | Weighted-Average
Exercise Price | | | Weighted Average Remaining Contractual Life | | Aggregate Intrinsic Value
(in millions) | |
Outstanding, beginning of period | | | 245,423 | | | $ | 82.00 | | | | | | |
Exercised | | | (65,253 | ) | | | 81.37 | | | | | | |
Outstanding and exercisable, end of period | | | 180,170 | | | $ | 82.23 | | | 4.2 years | | $ | 2.3 | |
Aggregate intrinsic value represents the total pre-tax intrinsic value (difference between the Company’s closing stock price on the last trading day of 2024 and the exercise price, multiplied by the number of in-the-money options) that would have been received by the option holders had all option holders exercised their options on December 31, 2024.
OSHKOSH CORPORATION
NOTES OF CONSOLIDATED FINANCIAL STATEMENTS
The total intrinsic value of options exercised was $2.0 million, $3.1 million and $1.8 million in 2024, 2023 and 2022, respectively. The actual income tax benefit realized totaled $0.3 million, $0.6 million and $0.4 million in 2024, 2023 and 2022, respectively.
As of December 31, 2024, no unrecognized compensation cost remains related to outstanding stock options.
Cash-Settled Restricted Stock Units — The Company granted cash-settled RSUs to employees of 7,333, 8,860 and 11,850 in 2024, 2023 and 2022, respectively. Each RSU award provides recipients the right to receive cash equal to the value of a share of the Company’s Common Stock at predetermined vesting dates. Compensation cost for RSUs is remeasured at each reporting period and is recognized as an expense over the requisite service period. The total value of RSUs vested was $0.5 million, $0.9 million and $0.7 million in 2024, 2023 and 2022, respectively.
6. Employee Benefit Plans
Defined Benefit Plans — Oshkosh Defense and Pierce sponsor defined benefit pension plans for certain employees. The benefits provided are based primarily on years of service and a benefit dollar multiplier. The Company periodically amends the plans, including changing the benefit dollar multipliers and other revisions. In December 2012, salaried participants in the Pierce pension plan no longer receive service credit, other than for vesting purposes. In December 2013, the Pierce pension plan was amended to close participation in the plan for new production employees. In October 2016, the Oshkosh Defense hourly defined benefit pension plan was closed to new production employees.
On July 27, 2021, the Company’s Board of Directors approved a plan to terminate and settle the defined benefit plan related to salaried participants of an Oshkosh defined benefit pension plan. In the fourth quarter of 2022, the Company transferred plan assets to an insurance company that will provide for and pay the remaining benefits to participants and incurred a charge of $33.6 million associated with the settlement of this plan. The pre-tax balance in Accumulated Other Comprehensive Income associated with the plan, along with costs related to the settlement, were recorded as a component of “Miscellaneous, net”, with the related income tax effects recorded in “Provision for income taxes” in the Consolidated Statements of Income.
Determination of defined benefit pension and post-employment benefit plan obligations and their associated expenses requires the use of actuarial valuations to estimate the benefits that employees earn while working, as well as the present value of those benefits. The Company uses the services of independent actuaries to assist with these calculations. The Company determines the discount rate used each year based on the rate of return currently available on a portfolio of high-quality fixed-income investments with a maturity that is consistent with the projected benefit payout period. The Company’s long-term rate of return on assets is based on consideration of historical and forward-looking returns and the current asset allocation strategy. The plans’ expected returns on assets are based on the plans’ historical returns and expected returns for the asset classes in which the plans are invested.
Supplemental Executive Retirement Plans (SERP) — The Company maintains defined benefit and defined contribution SERPs for certain executive officers of Oshkosh and its subsidiaries. In fiscal 2013, the Oshkosh defined benefit SERP was amended to freeze benefits under the plan and executive officers in the defined benefit SERP at that time became eligible for the new Oshkosh defined contribution SERP. At the same time, the Company established a trust to fund obligations under the Oshkosh SERPs. As of December 31, 2024, the trust held assets of $13.6 million. The trust assets are subject to claims of the Company’s creditors. The trust assets are included in “Other current assets” and “Other non-current assets” in the Consolidated Balance Sheets. The Company made contributions to the Oshkosh defined contribution SERP of $1.0 million, $0.4 million and $0.3 million in 2024, 2023 and 2022, respectively.
Post-employment Benefit Plans — Oshkosh and certain of its subsidiaries sponsor multiple post-employment benefit plans for Oshkosh Defense, JLG, and Kewaunee hourly employees, retirees and their spouses. The plans generally provide health benefits based on years of service and date of birth. These plans are unfunded.
OSHKOSH CORPORATION
NOTES OF CONSOLIDATED FINANCIAL STATEMENTS
Changes in benefit obligations and plan assets, as well as the funded status of the Company’s defined benefit pension plans were as follows (in millions):
| | | | | | | | |
| | Year Ended December 31, | |
| | 2024 | | | 2023 | |
Accumulated benefit obligation at end of period | | $ | 322.1 | | | $ | 346.2 | |
Change in projected benefit obligation | | | | | | |
Benefit obligation at beginning of period | | $ | 350.4 | | | $ | 333.2 | |
Service cost | | | 6.2 | | | | 6.6 | |
Interest cost | | | 16.8 | | | | 16.6 | |
Actuarial loss (gain) | | | (32.7 | ) | | | 7.1 | |
Benefits paid | | | (15.3 | ) | | | (14.0 | ) |
Currency translation adjustments | | | (0.4 | ) | | | 0.9 | |
Benefit obligation at end of period | | $ | 325.0 | | | $ | 350.4 | |
Change in plan assets | | | | | | |
Fair value of plan assets at beginning of period | | $ | 325.9 | | | $ | 298.7 | |
Actual return on plan assets | | | 31.4 | | | | 39.4 | |
Company contributions | | | 2.0 | | | | 2.0 | |
Expenses paid | | | (0.6 | ) | | | (1.4 | ) |
Benefits paid | | | (15.3 | ) | | | (14.0 | ) |
Currency translation adjustments | | | (0.3 | ) | | | 1.2 | |
Fair value of plan assets at end of period | | $ | 343.1 | | | $ | 325.9 | |
Funded status of plan - at end of period | | $ | 18.1 | | | $ | (24.5 | ) |
| | | | | | | | |
| | December 31, | |
Recognized in consolidated balance sheet at end of period | | 2024 | | | 2023 | |
Prepaid benefit cost (non-current asset) | | $ | 46.4 | | | $ | 7.6 | |
Accrued benefit liability (current liability) | | | (2.0 | ) | | | (2.0 | ) |
Accrued benefit liability (non-current liability) | | | (26.3 | ) | | | (30.1 | ) |
| | $ | 18.1 | | | $ | (24.5 | ) |
| | | | | | | | |
| | December 31, | |
Recognized in accumulated other comprehensive income (loss) as of end of period (net of taxes) | | 2024 | | | 2023 | |
Net actuarial loss | | $ | 66.5 | | | $ | 35.2 | |
Prior service cost | | | (6.8 | ) | | | (8.1 | ) |
| | $ | 59.7 | | | $ | 27.1 | |
| | | | | | | | |
| | December 31, | |
Weighted-average assumptions as of end of period | | 2024 | | | 2023 | |
Discount rate | | | 5.63 | % | | | 4.89 | % |
Expected return on plan assets | | | 6.50 | % | | | 6.50 | % |
Pension benefit plans with accumulated benefit obligations in excess of plan assets consisted of the following (in millions):
| | | | | | | | |
| | December 31, | |
| | 2024 | | | 2023 | |
Projected benefit obligation | | $ | 28.4 | | | $ | 29.0 | |
Accumulated benefit obligation | | | 27.7 | | | | 28.6 | |
Fair value of plan assets | | | — | | | | — | |
OSHKOSH CORPORATION
NOTES OF CONSOLIDATED FINANCIAL STATEMENTS
Changes in benefit obligations and plan assets, as well as the funded status of the Company’s post-employment benefit plans were as follows (in millions):
| | | | | | | | |
| | Year Ended December 31, | |
| | 2024 | | | 2023 | |
Accumulated benefit obligation at end of period | | $ | 47.3 | | | $ | 52.1 | |
Change in projected benefit obligation | | | | | | |
Benefit obligation at beginning of period | | $ | 52.1 | | | $ | 44.6 | |
Service cost | | | 1.7 | | | | 1.7 | |
Interest cost | | | 2.5 | | | | 2.1 | |
Actuarial loss (gain) | | | (5.1 | ) | | | 7.5 | |
Benefits paid | | | (3.9 | ) | | | (3.8 | ) |
Benefit obligation at end of period | | $ | 47.3 | | | $ | 52.1 | |
Change in plan assets | | | | | | |
Company contributions | | $ | 3.9 | | | $ | 3.8 | |
Benefits paid | | | (3.9 | ) | | | (3.8 | ) |
Fair value of plan assets at end of period | | $ | — | | | $ | — | |
Funded status of plan - at end of period | | $ | (47.3 | ) | | $ | (52.1 | ) |
| | | | | | | | |
| | December 31, | |
Recognized in consolidated balance sheet at end of period | | 2024 | | | 2023 | |
Accrued benefit liability (current liability) | | $ | (3.9 | ) | | $ | (3.9 | ) |
Accrued benefit liability (non-current liability) | | | (43.4 | ) | | | (48.2 | ) |
| | $ | (47.3 | ) | | $ | (52.1 | ) |
| | | | | | | | |
| | December 31, | |
Recognized in accumulated other comprehensive income (loss) as of end of period (net of taxes) | | 2024 | | | 2023 | |
Net actuarial loss (gain) | | $ | 0.7 | | | $ | (3.1 | ) |
Prior service benefit | | | 8.0 | | | | 9.0 | |
| | $ | 8.7 | | | $ | 5.9 | |
| | | | | | | | |
| | December 31, | |
Weighted-average assumptions as of end of period | | 2024 | | | 2023 | |
Discount rate | | | 5.41 | % | | | 4.76 | % |
Expected return on plan assets | | n/a | | | n/a | |
OSHKOSH CORPORATION
NOTES OF CONSOLIDATED FINANCIAL STATEMENTS
The components of net periodic pension benefit cost and net periodic post-employment benefit cost were as follows (in millions):
| | | | | | | | | | | | |
| | Pension Benefits | |
| | Year Ended December 31, | |
| | 2024 | | | 2023 | | | 2022 | |
Components of net periodic pension benefit cost | | | | | | | | | |
Service cost | | $ | 6.2 | | | $ | 6.6 | | | $ | 10.3 | |
Interest cost | | | 16.8 | | | | 16.6 | | | | 17.0 | |
Expected return on plan assets | | | (20.7 | ) | | | (19.4 | ) | | | (20.6 | ) |
Amortization of prior service cost | | | 1.7 | | | | 1.9 | | | | 2.2 | |
Settlement | | | — | | | | — | | | | 33.6 | |
Amortization of net actuarial (gain) loss | | | (2.6 | ) | | | (2.4 | ) | | | 1.0 | |
Expenses paid | | | 0.7 | | | | 1.0 | | | | 3.0 | |
Net periodic pension benefit cost | | $ | 2.1 | | | $ | 4.3 | | | $ | 46.5 | |
Other changes in plan assets and benefit obligations recognized in other comprehensive income | | | | | | | | | |
Net actuarial gain | | $ | (43.5 | ) | | $ | (12.5 | ) | | $ | (26.2 | ) |
Amortization of prior service cost | | | (1.7 | ) | | | (1.9 | ) | | | (2.2 | ) |
Settlement | | | — | | | | — | | | | (33.6 | ) |
Amortization of net actuarial gain (loss) | | | 2.6 | | | | 2.4 | | | | (1.0 | ) |
| | $ | (42.6 | ) | | $ | (12.0 | ) | | $ | (63.0 | ) |
Weighted-average assumptions | | | | | | | | | |
Discount rate | | | 4.89 | % | | | 5.09 | % | | | 2.83 | % |
Expected return on plan assets | | | 6.50 | % | | | 6.50 | % | | | 4.31 | % |
| | | | | | | | | | | | |
| | Post-Employment Benefits | |
| | Year Ended December 31, | |
| | 2024 | | | 2023 | | | 2022 | |
Components of net periodic post-employment benefit cost | | | | | | | | | |
Service cost | | $ | 1.7 | | | $ | 1.7 | | | $ | 2.2 | |
Interest cost | | | 2.5 | | | | 2.1 | | | | 1.4 | |
Amortization of prior service cost | | | (1.5 | ) | | | (1.4 | ) | | | (1.4 | ) |
Amortization of net actuarial (gain) loss | | | — | | | | (0.2 | ) | | | 0.3 | |
Net periodic post-employment benefit cost | | $ | 2.7 | | | $ | 2.2 | | | $ | 2.5 | |
Other changes in plan assets and benefit obligations recognized in other comprehensive income | | | | | | | | | |
Net actuarial (gain) loss | | $ | (5.1 | ) | | $ | 7.5 | | | $ | (12.0 | ) |
Amortization of prior service cost | | | 1.5 | | | | 1.4 | | | | 1.4 | |
Amortization of net actuarial gain (loss) | | | — | | | | 0.2 | | | | (0.3 | ) |
| | $ | (3.6 | ) | | $ | 9.1 | | | $ | (10.9 | ) |
Weighted-average assumptions | | | | | | | | | |
Discount rate | | | 4.76 | % | | | 4.95 | % | | | 2.62 | % |
Expected return on plan assets | | n/a | | | n/a | | | n/a | |
Components of net periodic benefit cost other than “Service cost” and “Expenses paid” are included in “Miscellaneous, net” in the Consolidated Statements of Income.
Amounts expected to be recognized in pension and supplemental employee retirement plan net periodic benefit costs during 2025 included in “Accumulated other comprehensive loss” in the Consolidated Balance Sheet at December 31, 2024 are prior service costs of $1.6 million ($1.3 million net of tax) and unrecognized net actuarial gains of $5.7 million ($4.4 million net of tax).
OSHKOSH CORPORATION
NOTES OF CONSOLIDATED FINANCIAL STATEMENTS
The Company’s policy is to fund the pension plans in amounts that comply with contribution limits imposed by law. The Company does not expect to make contributions to its pension plans in 2025.
The Company’s Board of Directors has appointed an Investment Committee (Committee), which consists of members of management, to manage the investment of the Company’s pension plan assets. The Committee has established and operates under an Investment Policy. The Committee determines the asset allocation and target ranges based upon periodic asset/liability studies and capital market projections. The Committee retains external investment managers to invest the assets and an adviser to monitor the performance of the investment managers. The Investment Policy prohibits certain investment transactions, such as commodity contracts, margin transactions, short selling and investments in Company securities, unless the Committee gives prior approval.
The weighted average of the Company’s pension plan asset allocations and target allocations at December 31, 2024 by asset category for the Company's pension plans managed by the Committee, were as follows:
| | | | | | |
| | Target % | | Actual | |
Asset Category | | | | | |
Fixed income | | 30% - 40% | | | 34 | % |
Large-cap equity | | 25% - 40% | | | 34 | % |
Mid-cap equity | | 10% - 20% | | | 17 | % |
Small-cap equity | | 5% - 15% | | | 13 | % |
Other | | 0% - 5% | | | 2 | % |
| | | | | 100 | % |
The Company’s pension plan investment strategy is based on an expectation that, over time, equity securities will provide higher returns than debt securities. The plans primarily minimize the risk of larger losses under this strategy through diversification of investments by asset class, by investing in different styles of investment management within the classes and using several investment managers.
The fair value of plan assets by major category and level within the fair value hierarchy was as follows (in millions):
| | | | | | | | | | | | | | | | |
| | Quoted Prices for Identical
Assets
(Level 1) | | | Significant
Other
Observable
Inputs
(Level 2) | | | Significant
Unobservable
Inputs
(Level 3) | | | Total | |
December 31, 2024 | | | | | | | | | | | | |
Common stocks | | | | | | | | | | | | |
U.S. companies (a) | | $ | 96.1 | | | $ | — | | | $ | — | | | $ | 96.1 | |
International companies (b) | | | — | | | | 7.1 | | | | — | | | | 7.1 | |
Mutual funds (a) | | | 100.0 | | | | — | | | | — | | | | 100.0 | |
Government and agency bonds (c) | | | — | | | | 12.9 | | | | — | | | | 12.9 | |
Corporate bonds and notes (d) | | | — | | | | 5.9 | | | | — | | | | 5.9 | |
Money market funds (e) | | | 10.6 | | | | — | | | | — | | | | 10.6 | |
Other | | | — | | | | — | | | | 0.4 | | | | 0.4 | |
| | $ | 206.7 | | | $ | 25.9 | | | $ | 0.4 | | | | 233.0 | |
Investments measured at net asset value (NAV) (f) | | | | | | | | | | | | 110.1 | |
| | | | | | | | | | | $ | 343.1 | |
OSHKOSH CORPORATION
NOTES OF CONSOLIDATED FINANCIAL STATEMENTS
| | | | | | | | | | | | | | | | |
| | Quoted Prices for Identical
Assets
(Level 1) | | | Significant
Other
Observable
Inputs
(Level 2) | | | Significant
Unobservable
Inputs
(Level 3) | | | Total | |
December 31, 2023 | | | | | | | | | | | | |
Common stocks | | | | | | | | | | | | |
U.S. companies (a) | | $ | 88.6 | | | $ | — | | | $ | — | | | $ | 88.6 | |
International companies (b) | | | — | | | | 5.0 | | | | — | | | | 5.0 | |
Mutual funds (a) | | | 94.3 | | | | — | | | | — | | | | 94.3 | |
Government and agency bonds (c) | | | — | | | | 16.1 | | | | — | | | | 16.1 | |
Corporate bonds and notes (d) | | | — | | | | 6.9 | | | | — | | | | 6.9 | |
Money market funds (e) | | | 7.8 | | | | — | | | | — | | | | 7.8 | |
Other | | | — | | | | — | | | | 0.6 | | | | 0.6 | |
| | $ | 190.7 | | | $ | 28.0 | | | $ | 0.6 | | | | 219.3 | |
Investments measured at net asset value (NAV) (f) | | | | | | | | | | | | 106.6 | |
| | | | | | | | | | | $ | 325.9 | |
(a)Primarily valued using a market approach based on the quoted market prices of identical instruments that are actively traded on public exchanges.
(b)Valuation model looks at underlying security “best” price, exchange rate for underlying security’s currency against the U.S. dollar and ratio of underlying security to American depository receipt.
(c)These investments consist of debt securities issued by the U.S. Treasury, U.S. government agencies and U.S. government-sponsored enterprises and have a variety of structures, coupon rates and maturities. These investments are considered to have low default risk as they are guaranteed by the U.S. government. Fixed income securities are primarily valued using a market approach with inputs that include broker quotes, benchmark yields, base spreads and reported trades.
(d)These investments consist of debt obligations issued by a variety of private and public corporations. These are investment grade securities which historically have provided a steady stream of income. Fixed income securities are primarily valued using a market approach with inputs that include broker quotes, benchmark yields, base spreads and reported trades.
(e)These investments largely consist of short-term investment funds and are valued using a market approach based on the quoted market prices of identical instruments.
(f)These investments consist of common collective trusts that are valued based on NAV. NAV is based on the fair value of each fund’s underlying investments. In accordance with ASC Subtopic 820-10, certain investments that are measured at fair value using the NAV per share (or its equivalent) practical expedient have not been classified in the fair value hierarchy.
The Company’s estimated future benefit payments under Company sponsored plans were as follows (in millions):
| | | | | | | | | | | | |
| | Pension Benefits | | | Post-Employment | |
Year Ending December 31, | | Qualified | | | Non-Qualified | | | Benefits | |
2025 | | $ | 14.7 | | | $ | 2.0 | | | $ | 3.9 | |
2026 | | | 15.6 | | | | 2.1 | | | | 3.9 | |
2027 | | | 16.7 | | | | 2.3 | | | | 4.3 | |
2028 | | | 17.9 | | | | 2.3 | | | | 4.6 | |
2029 | | | 18.8 | | | | 2.3 | | | | 4.7 | |
2030-2034 | | | 105.6 | | | | 11.0 | | | | 21.4 | |
Multi-Employer Pension Plans — The Company participates in the Boilermaker-Blacksmith National Pension Trust (Employer Identification Number 48-6168020), a multi-employer defined benefit pension plan related to collective bargaining employees at the Company’s Kewaunee facility. The Company’s contributions and pension benefits payable under the plan and the administration of the plan are determined by the terms of the related collective-bargaining agreement, which expires on May 1, 2027. The multi-employer plan poses different risks to the Company than single-employer plans in the following respects:
OSHKOSH CORPORATION
NOTES OF CONSOLIDATED FINANCIAL STATEMENTS
1. The Company’s contributions to the multi-employer plan may be used to provide benefits to all participating employees of the program, including employees of other employers.
2. In the event that another participating employer ceases contributions to the multi-employer plan, the Company may be responsible for any unfunded obligations along with the remaining participating employers.
3. If the Company chooses to withdraw from the multi-employer plan, the Company may be required to pay a withdrawal liability based on the underfunded status of the plan at that time.
The plan-certified zone status (as defined by the Pension Protection Act of 2006) has been Red since January 2023. Accordingly, the plan has implemented a financial improvement plan. The Company’s contributions to the multi-employer plan did not exceed 5% of the total plan contributions. The Company made contributions to the plan of $1.2 million, $1.1 million and $1.2 million in 2024, 2023 and 2022, respectively.
401(k) and Defined Contribution Pension Replacement Plans — The Company has defined contribution 401(k) plans for substantially all domestic employees. The plans allow employees to defer 2% to 100% of their income on a pre-tax basis. Each employee who elects to participate is eligible to receive Company matching contributions, which are based on employee contributions to the plans, subject to certain limitations. For certain businesses, in addition to matching contributions, the company also contributes between 2% and 6% of an employee’s base pay, depending on age. Amounts expensed for Company matching and discretionary contributions were $61.2 million, $58.7 million and $50.2 million in 2024, 2023 and 2022, respectively.
7. Income Taxes
Pre-tax income was taxed in the following jurisdictions (in millions):
| | | | | | | | | | | | |
| | Year Ended December 31, | |
| | 2024 | | | 2023 | | | 2022 | |
Domestic | | $ | 829.2 | | | $ | 705.9 | | | $ | 243.1 | |
Foreign | | | 73.8 | | | | 91.7 | | | | 32.5 | |
| | $ | 903.0 | | | $ | 797.6 | | | $ | 275.6 | |
Significant components of the provision for income taxes were as follows (in millions):
| | | | | | | | | | | | |
| | Year Ended December 31, | |
| | 2024 | | | 2023 | | | 2022 | |
Allocated to Income Before Losses of Unconsolidated Affiliates | | | | | | | | | |
Current: | | | | | | | | | |
Federal | | $ | 173.6 | | | $ | 268.4 | | | $ | 98.1 | |
Foreign | | | 22.1 | | | | 29.9 | | | | 42.0 | |
State | | | 32.2 | | | | 52.1 | | | | 10.9 | |
Total current | | | 227.9 | | | | 350.4 | | | | 151.0 | |
Deferred: | | | | | | | | | |
Federal | | | (16.8 | ) | | | (126.0 | ) | | | (53.3 | ) |
Foreign | | | 3.7 | | | | (8.0 | ) | | | (1.4 | ) |
State | | | (4.8 | ) | | | (26.4 | ) | | | 1.2 | |
Total deferred | | | (17.9 | ) | | | (160.4 | ) | | | (53.5 | ) |
| | $ | 210.0 | | | $ | 190.0 | | | $ | 97.5 | |
Allocated to Other Comprehensive Income (Loss) | | | | | | | | | |
Deferred federal, state and foreign | | $ | (11.3 | ) | | $ | 1.8 | | | $ | (19.2 | ) |
OSHKOSH CORPORATION
NOTES OF CONSOLIDATED FINANCIAL STATEMENTS
The reconciliation of income tax computed at the U.S. federal statutory tax rates to income tax expense was:
| | | | | | | | | | | | |
| | Year Ended December 31, | |
| | 2024 | | | 2023 | | | 2022 | |
Effective Rate Reconciliation | | | | | | | | | |
U.S. federal tax rate | | | 21.0 | % | | | 21.0 | % | | | 21.0 | % |
State income taxes, net | | | 2.7 | % | | | 2.5 | % | | | 3.9 | % |
Foreign taxes | | | 1.1 | % | | | 1.0 | % | | | 13.7 | % |
Tax audit settlements | | | — | % | | | — | % | | | 0.1 | % |
Valuation allowance | | | 0.7 | % | | | 0.7 | % | | | -0.1 | % |
Domestic tax credits | | | -1.8 | % | | | -1.8 | % | | | -3.0 | % |
Foreign-derived intangible income deduction | | | -0.7 | % | | | -0.2 | % | | | -0.9 | % |
Global intangible low-taxed income, net | | | — | % | | | — | % | | | 0.6 | % |
Stock-based compensation | | | 0.3 | % | | | 0.4 | % | | | 0.3 | % |
CARES Act net operating loss carryback | | | 0.2 | % | | | 0.3 | % | | | -0.9 | % |
Other, net | | | -0.2 | % | | | -0.1 | % | | | 0.7 | % |
| | | 23.3 | % | | | 23.8 | % | | | 35.4 | % |
Foreign taxes in 2022 reflected a charge of $31.3 million as the Company revised its interpretation of certain foreign anti-hybrid tax legislation based upon comments from the corresponding taxing authorities, of which $18.1 million related to prior periods.
The Company recorded a net discrete tax benefit of $2.4 million in 2024 primarily as a result of a $3.2 million discrete tax benefit for the purchase of discounted federal tax credits. The Company recorded a net discrete tax benefit of $2.7 million in 2023 primarily as a result of the release of reserves due to the expiration of statutes of limitations in foreign jurisdictions. The Company recorded net discrete tax charges of $18.9 million in 2022, which included a discrete tax charge of $18.1 million related to anti-hybrid taxes.
Cash paid for income taxes, net of refunds disclosed on the Consolidate Statement of Cash Flows includes cash paid for the purchase of transferable tax credits of $68.3 million and $6.8 million in 2024 and 2023, respectively.
Deferred income tax assets and liabilities were comprised of the following (in millions):
| | | | | | | | |
| | December 31, | |
| | 2024 | | | 2023 | |
Deferred tax assets: | | | | | | |
Other non-current liabilities | | $ | 34.4 | | | $ | 35.0 | |
Research & development | | | 132.8 | | | | 87.8 | |
Losses and credits | | | 44.8 | | | | 37.6 | |
Other current liabilities | | | 32.0 | | | | 26.8 | |
Customer advances | | | 183.5 | | | | 182.0 | |
Payroll-related obligations | | | 29.8 | | | | 21.2 | |
Other | | | 58.7 | | | | 42.7 | |
Gross deferred tax assets | | | 516.0 | | | | 433.1 | |
Less valuation allowance | | | (17.9 | ) | | | (12.0 | ) |
Deferred tax assets, net | | | 498.1 | | | | 421.1 | |
Deferred tax liabilities: | | | | | | |
Intangible assets | | | (76.1 | ) | | | (81.7 | ) |
Property, plant and equipment | | | (111.3 | ) | | | (30.6 | ) |
Other | | | (78.6 | ) | | | (73.6 | ) |
Deferred tax liabilities | | | (266.0 | ) | | | (185.9 | ) |
Net deferred tax asset | | $ | 232.1 | | | $ | 235.2 | |
OSHKOSH CORPORATION
NOTES OF CONSOLIDATED FINANCIAL STATEMENTS
Deferred tax assets for research & development expenses have increased since 2022 due to changes in U.S. tax law related to the amortization of such costs. Deferred tax liabilities for property, plant and equipment increased in 2024 primarily due to accelerated tax depreciation for assets placed in service for the production of NGDVs.
The net deferred tax asset is classified in the Consolidated Balance Sheets as follows (in millions):
| | | | | | | | |
| | December 31, | |
| | 2024 | | | 2023 | |
Non-current net deferred tax asset | | $ | 259.0 | | | $ | 262.0 | |
Non-current net deferred tax liability | | | (26.9 | ) | | | (26.8 | ) |
Net deferred tax asset | | $ | 232.1 | | | $ | 235.2 | |
As of December 31, 2024, the Company had $24.2 million of net operating loss carryforwards available to reduce future taxable income of certain foreign subsidiaries in countries which allow such losses to be carried forward anywhere from five years to an unlimited period. In addition, the Company had $206.3 million of state net operating loss carryforwards, which can be carried forward anywhere from fifteen years to an unlimited period and state credit carryforwards of $30.7 million, which are subject to expiration in 2029 to 2039. Deferred tax assets for foreign net operating loss carryforwards, state net operating loss carryforwards, state tax credit carryforwards and foreign tax credit carryforwards were $6.1 million, $8.8 million, $19.1 million and $10.8 million, respectively, as of December 31, 2024. Amounts are reviewed for recoverability based on historical taxable income, the expected reversals of existing temporary differences, tax-planning strategies and projections of future taxable income. The Company maintains a valuation allowances against domestic deferred tax assets, state tax credit carryforwards, foreign net deferred tax assets, including net operating losses, and foreign tax credit deferred tax assets of $4.8 million, $0.2 million, $4.9 million and $8.0 million, respectively, as of December 31, 2024.
At December 31, 2024, the Company had undistributed earnings of $491.7 million from its investment in non-U.S. subsidiaries. The Company has not recognized deferred tax liabilities for temporary differences related to the Company’s foreign operations as the Company considers that its undistributed earnings are intended to be indefinitely reinvested. Should the Company’s undistributed earnings from its investment in non-U.S. subsidiaries be distributed in the future in the form of dividends or otherwise, the Company may be subject to foreign and domestic income taxes and withholding taxes estimated at $26.1 million, including the impact of the regulations discussed below.
On August 21, 2020, the U.S. Treasury Department and the U.S. Internal Revenue Service (IRS) released final regulations related to the Tax Reform Act (the “tax regulations”) and the foreign dividends received deduction and global intangible low-taxed income. The tax regulations contained language that modified certain provisions of the Tax Reform Act and previously issued guidance and are effective retroactively to the Company’s fiscal 2018 tax year and purport to cause certain intercompany transactions the Company engaged in during 2018 to produce U.S. taxable income upon a subsequent distribution from a controlled foreign corporation. The Company has analyzed the tax regulations and concluded that the U.S. Treasury Department exceeded regulatory authority and that the tax regulations are contrary to the congressional intent of the underlying statute. The Company believes it has strong arguments in favor of its position and that it has met the more likely than not recognition threshold that its position will be sustained. The Company intends to vigorously defend its position, however, due to the uncertainty involved in challenging the validity of regulations as well as a potential litigation process, there can be no assurances that the tax regulations will be invalidated, modified or that a court of law will rule in favor of the Company. An unfavorable resolution of this issue would result in $19.0 million of tax liability if the Company were to distribute the earnings to the United States, which is included in the $26.1 million disclosed withholding tax above.
OSHKOSH CORPORATION
NOTES OF CONSOLIDATED FINANCIAL STATEMENTS
A reconciliation of gross unrecognized tax benefits, excluding interest and penalties, was as follows (in millions):
| | | | | | | | | | | | |
| | Year Ended December 31, | |
| | 2024 | | | 2023 | | | 2022 | |
Balance at beginning of period | | $ | 64.3 | | | $ | 98.8 | | | $ | 41.5 | |
Additions for tax positions related to current year | | | 2.5 | | | | 5.0 | | | | 50.2 | |
Additions for tax positions related to prior years | | | 3.0 | | | | 0.7 | | | | 20.9 | |
Reductions for tax positions related to prior years | | | (5.1 | ) | | | (36.5 | ) | | | (10.0 | ) |
Foreign currency translation | | | (2.2 | ) | | | 0.3 | | | | (1.9 | ) |
Lapse of statutes of limitations | | | (0.9 | ) | | | (4.0 | ) | | | (1.9 | ) |
Balance at end of period | | $ | 61.6 | | | $ | 64.3 | | | $ | 98.8 | |
As of December 31, 2024, net unrecognized tax benefits of $52.9 million would affect the Company’s effective tax rate if recognized. The Company recognizes accrued interest and penalties, if any, related to unrecognized tax benefits in the “Provision for income taxes” in the Consolidated Statements of Income. The Company recognized net interest and penalties expense of $4.0 million, income of $0.3 million and expense of $0.1 million in 2024, 2023 and 2022, respectively. The Company had accruals for the payment of interest and penalties of $11.8 million and $7.9 million at December 31, 2024 and 2023, respectively. During 2025, it is reasonably possible that federal, state and foreign tax audit resolutions could reduce unrecognized tax benefits by $23.7 million, either because the Company’s tax positions are sustained on audit, because the Company agrees to their disallowance or the statute of limitations closes.
The Company files federal income tax returns, as well as multiple state, local and non-U.S. jurisdiction tax returns. The Company is regularly audited by federal, state and foreign tax authorities. As of December 31, 2024, tax years open for examination under applicable statutes were as follows:
| | |
Tax Jurisdiction | | Open Tax Years |
Australia | | 2020 - 2024 |
Belgium | | 2022 - 2024 |
Brazil | | 2020 - 2024 |
Canada | | 2020 - 2024 |
China | | 2019 - 2024 |
Mexico | | 2020 - 2024 |
Netherlands | | 2019 - 2024 |
United Kingdom | | 2023 - 2024 |
Other Non-U.S. Countries | | 2018 - 2024 |
United States (federal general) | | 2019 - 2024 |
United States (state and local) | | 2015 - 2024 |
OSHKOSH CORPORATION
NOTES OF CONSOLIDATED FINANCIAL STATEMENTS
8. Earnings Per Share
The following are the computations for basic and diluted earnings per share (in millions, except share and per share amounts):
| | | | | | | | | | | | |
| | Year Ended December 31, | |
| | 2024 | | | 2023 | | | 2022 | |
Net income | | $ | 681.4 | | | $ | 598.0 | | | $ | 173.9 | |
| | | | | | | | | |
Weighted-average common shares outstanding: | | | | | | | | | |
Basic | | | 65,458,797 | | | | 65,382,275 | | | | 65,699,693 | |
Dilutive stock-based compensation awards | | | 370,667 | | | | 481,688 | | | | 435,125 | |
Diluted | | | 65,829,464 | | | | 65,863,963 | | | | 66,134,818 | |
| | | | | | | | | |
Earnings per common share: | | | | | | | | | |
Basic | | $ | 10.41 | | | $ | 9.15 | | | $ | 2.65 | |
Diluted | | | 10.35 | | | | 9.08 | | | | 2.63 | |
Shares not included in the computation of diluted earnings per share attributable to common shareholders because they would have been anti-dilutive were 23,798, 50,337 and 152,698 in 2024, 2023 and 2022, respectively.
9. Receivables
Receivables consisted of the following (in millions):
| | | | | | | | |
| | December 31, | |
| | 2024 | | | 2023 | |
Trade receivables - U.S. government | | $ | 110.4 | | | $ | 67.7 | |
Trade receivables - other | | | 1,091.3 | | | | 1,160.6 | |
Other receivables | | | 85.9 | | | | 119.2 | |
Total receivables, gross | | | 1,287.6 | | | | 1,347.5 | |
Less allowance for doubtful accounts | | | (5.7 | ) | | | (7.4 | ) |
Total receivables, net | | $ | 1,281.9 | | | $ | 1,340.1 | |
Classification of receivables in the Consolidated Balance Sheets consisted of the following (in millions):
| | | | | | | | |
| | December 31, | |
| | 2024 | | | 2023 | |
Current receivables | | $ | 1,254.7 | | | $ | 1,316.4 | |
Non-current receivables | | | 27.2 | | | | 23.7 | |
Total receivables, net | | $ | 1,281.9 | | | $ | 1,340.1 | |
Changes in the Company’s allowance for doubtful accounts were as follows (in millions):
| | | | | | | | |
| | Year Ended December 31, | |
| | 2024 | | | 2023 | |
Allowance at beginning of period | | $ | 7.4 | | | $ | 6.7 | |
Acquisition of businesses | | | — | | | | 1.2 | |
Provision for doubtful accounts, net of recoveries | | | 0.8 | | | | 0.5 | |
Charge-off of accounts | | | (2.3 | ) | | | (1.0 | ) |
Foreign currency translation | | | (0.2 | ) | | | — | |
Allowance at end of period | | $ | 5.7 | | | $ | 7.4 | |
OSHKOSH CORPORATION
NOTES OF CONSOLIDATED FINANCIAL STATEMENTS
10. Inventories
Inventories consisted of the following (in millions):
| | | | | | | | |
| | December 31, | |
| | 2024 | | | 2023 | |
Raw materials | | $ | 1,202.8 | | | $ | 1,271.0 | |
Work in process | | | 460.3 | | | | 438.9 | |
Finished products | | | 602.6 | | | | 421.7 | |
Total inventories | | $ | 2,265.7 | | | $ | 2,131.6 | |
11. Property, Plant and Equipment
Property, plant and equipment consisted of the following (in millions):
| | | | | | | | |
| | December 31, | |
| | 2024 | | | 2023 | |
Land and land improvements | | $ | 106.5 | | | $ | 100.5 | |
Buildings | | | 514.1 | | | | 478.3 | |
Machinery and equipment | | | 1,318.5 | | | | 1,013.4 | |
Software and related costs | | | 245.3 | | | | 222.0 | |
Construction in progress | | | 210.2 | | | | 348.4 | |
Property, plant and equipment, gross | | | 2,394.6 | | | | 2,162.6 | |
Less accumulated depreciation | | | (1,178.1 | ) | | | (1,093.1 | ) |
Property, plant and equipment, net | | $ | 1,216.5 | | | $ | 1,069.5 | |
Depreciation expense was $115.0 million, $103.2 million and $84.7 million in 2024, 2023 and 2022, respectively.
12. Goodwill and Purchased Intangible Assets
The following table presents changes in goodwill by segment (in millions):
| | | | | | | | | | | | | | | | |
| | Access | | | Vocational | | | Corporate and Other | | | Total | |
Net goodwill at December 31, 2022 | | $ | 865.8 | | | $ | 131.8 | | | $ | 44.4 | | | $ | 1,042.0 | |
Acquisitions | | | 107.0 | | | | 260.3 | | | | — | | | | 367.3 | |
Foreign currency translation | | | 7.1 | | | | — | | | | — | | | | 7.1 | |
Net goodwill at December 31, 2023 | | | 979.9 | | | | 392.1 | | | | 44.4 | | | | 1,416.4 | |
Acquisitions | | | 53.5 | | | | 1.7 | | | | — | | | | 55.2 | |
Impairment | | | — | | | | — | | | | (38.7 | ) | | | (38.7 | ) |
Foreign currency translation | | | (22.4 | ) | | | (0.4 | ) | | | — | | | | (22.8 | ) |
Net goodwill at December 31, 2024 | | $ | 1,011.0 | | | $ | 393.4 | | | $ | 5.7 | | | $ | 1,410.1 | |
See Note 3 for additional information regarding goodwill related to acquisitions.
OSHKOSH CORPORATION
NOTES OF CONSOLIDATED FINANCIAL STATEMENTS
The following table presents details of the Company’s goodwill allocated to the reportable segments (in millions):
| | | | | | | | | | | | | | | | | | | | | | | | |
| | December 31, 2024 | | | December 31, 2023 | |
| | Gross | | | Accumulated
Impairment | | | Net | | | Gross | | | Accumulated
Impairment | | | Net | |
Access | | $ | 1,943.1 | | | $ | (932.1 | ) | | $ | 1,011.0 | | | $ | 1,912.0 | | | $ | (932.1 | ) | | $ | 979.9 | |
Vocational | | | 562.8 | | | | (169.4 | ) | | | 393.4 | | | | 561.5 | | | | (169.4 | ) | | | 392.1 | |
Corporate and other | | | 44.4 | | | | (38.7 | ) | | | 5.7 | | | | 44.4 | | | | — | | | | 44.4 | |
| | $ | 2,550.3 | | | $ | (1,140.2 | ) | | $ | 1,410.1 | | | $ | 2,517.9 | | | $ | (1,101.5 | ) | | $ | 1,416.4 | |
Goodwill and other indefinite-lived intangible assets are not amortized but are assessed for impairment annually or more frequently if potential interim indicators exist that could result in impairment. The Company performs its annual impairment test in the fourth quarter.
The Company assessed the Pratt Miller reporting unit for impairment during the second quarter of 2024 as a result of unfavorable performance compared to forecast and adverse market conditions related to mobility and motorsports leading to a decline in the Company's expectations of future performance. For the income approach, a discount rate of 13.0% (14.0% at October 1, 2023) and a terminal growth rate of 3.0% (3.0% at October 1, 2023) were used. Changes in estimates or the application of alternative assumptions could have produced significantly different results. As a result of the assessment, the Company recorded a goodwill impairment charge of $38.7 million in the second quarter of 2024 within "Intangible asset impairments" in the Consolidated Statement of Income.
The Company performed its annual impairment review relative to goodwill and indefinite-lived intangible assets (principally non-amortizable trade names) as of October 1, 2024. To derive the fair value of its reporting units, the Company utilized both the income and market approaches. For the annual impairment testing, the Company used a discount rate, depending on the reporting unit, of 13.0% to 17.0% (12.0% to 14.5% at October 1, 2023) and a terminal growth rate of 3.0% (3.0% at October 1, 2023). Under the market approach, the Company derived the fair value of its reporting units based on revenue and earnings multiples of comparable publicly traded companies. As a corroborative source of information, the Company reconciles its estimated fair value to within a reasonable range of its market capitalization, which includes an assumed control premium (an adjustment reflecting an estimated fair value on a controlling basis), to verify the reasonableness of the fair value of its reporting units obtained through the aforementioned methods. The control premium is estimated based upon control premiums observed in comparable market transactions. To derive the fair value of its trade names, the Company utilized the “relief-from-royalty” approach. The Company’s annual impairment assessment indicated that no further impairments to goodwill or indefinite-lived intangible assets were required. The estimated fair value exceeded the carrying value by more than 10% for all reporting units except one. Changes in estimates or the application of alternative assumptions could have produced significantly different results. For example, an increase in the discount rate of 100 basis points or a decrease in the terminal growth rate of 200 basis points would likely have caused impairment of a reporting unit in the Vocational segment. That reporting unit had $262.0 million of goodwill at December 31, 2024.
At December 31, 2024, approximately 77% of the Company’s recorded goodwill and indefinite-lived intangible assets were concentrated within the JLG reporting unit in the Access segment. Assumptions utilized in the impairment analysis are highly judgmental. While the Company currently believes that an impairment of intangible assets at JLG is unlikely, events and conditions that could result in the impairment of intangibles at JLG include a sharp prolonged decline in economic conditions, significantly increased pricing pressure on JLG’s margins or other factors leading to reductions in expected long-term sales or profitability at JLG.
OSHKOSH CORPORATION
NOTES OF CONSOLIDATED FINANCIAL STATEMENTS
Details of the Company’s purchased intangible assets are as follows (in millions):
| | | | | | | | | | | | | | | | | | | | | | | | | | | | |
| | December 31, 2024 | | | December 31, 2023 | |
| | Weighted-
Average
Life | | | Gross | | | Accumulated
Amortization | | | Net | | | Gross | | | Accumulated
Amortization | | | Net | |
Amortizable intangible assets: | | | | | | | | | | | | | | | | | | | | | |
Customer relationships | | | 11.4 | | | $ | 829.8 | | | $ | (604.6 | ) | | $ | 225.2 | | | $ | 819.5 | | | $ | (574.6 | ) | | $ | 244.9 | |
Trade names | | | 12.5 | | | | 120.2 | | | | (19.3 | ) | | | 100.9 | | | | 118.6 | | | | (7.5 | ) | | | 111.1 | |
Technology-related | | | 9.2 | | | | 158.9 | | | | (107.4 | ) | | | 51.5 | | | | 166.5 | | | | (108.2 | ) | | | 58.3 | |
Distribution network | | | 39.2 | | | | 55.3 | | | | (39.8 | ) | | | 15.5 | | | | 55.3 | | | | (38.4 | ) | | | 16.9 | |
Other | | | 4.4 | | | | 33.1 | | | | (27.4 | ) | | | 5.7 | | | | 37.5 | | | | (25.2 | ) | | | 12.3 | |
| | | 12.3 | | | | 1,197.3 | | | | (798.5 | ) | | | 398.8 | | | | 1,197.4 | | | | (753.9 | ) | | | 443.5 | |
Non-amortizable trade names | | | | | | 378.8 | | | | — | | | | 378.8 | | | | 386.7 | | | | — | | | | 386.7 | |
| | | | | $ | 1,576.1 | | | $ | (798.5 | ) | | $ | 777.6 | | | $ | 1,584.1 | | | $ | (753.9 | ) | | $ | 830.2 | |
In conjunction with Pratt Miller's goodwill impairment testing, Pratt Miller's purchased intangibles were also assessed for impairment. The Company used the relief-from-royalty and multiple-period excess earnings approaches to estimate the fair value of a trade name and customer relationship, respectively. As a result of the assessments, the Company recorded impairment charges of $8.8 million related to the trade name and $4.1 million related to the customer relationship within "Intangible asset impairments" in the Consolidated Statement of Income during the second quarter of 2024.
Amortization of purchased intangible assets was $64.9 million (including $10.2 million that was recognized in "Cost of sales" in the Consolidated Statements of Income), $41.7 million (including $8.9 million that was recognized in "Cost of sales" in the Consolidated Statements of Income) and $11.6 million in 2024, 2023 and 2022, respectively.
Estimated future amortization expense for purchased intangible assets for the next five years are as follows (in millions):
| | | | |
Years: | | | |
2025 | | $ | 58.4 | |
2026 | | | 53.9 | |
2027 | | | 53.9 | |
2028 | | | 49.7 | |
2029 | | | 45.5 | |
13. Leases
The components of lease costs were as follows (in millions):
| | | | | | | | | | | | |
| | Year Ended December 31, | |
| | 2024 | | | 2023 | | | 2022 | |
Operating lease cost | | $ | 52.3 | | | $ | 58.6 | | | $ | 54.0 | |
Finance lease cost - amortization | | | 20.1 | | | | 13.8 | | | | 9.9 | |
Finance lease cost - interest | | | 2.9 | | | | 1.4 | | | | 0.6 | |
Variable lease cost | | | 21.9 | | | | 31.7 | | | | 31.9 | |
Short-term lease cost | | | 13.5 | | | | 11.1 | | | | 11.1 | |
OSHKOSH CORPORATION
NOTES OF CONSOLIDATED FINANCIAL STATEMENTS
Supplemental information related to leases was as follows (in millions, except term and rate amounts):
| | | | | | | | | | | | | | | | | | | | | | | | | | |
| | | | December 31, 2024 | | | December 31, 2023 | |
| | Balance Sheet Classification | | Operating leases | | | Finance leases | | | Total | | | Operating leases | | | Finance leases | | | Total | |
Lease right of use assets | | Other non-current assets | | $ | 200.1 | | | $ | 57.2 | | | $ | 257.3 | | | $ | 205.9 | | | $ | 58.4 | | | $ | 264.3 | |
Current lease liabilities | | Other current liabilities | | | 40.5 | | | | 16.2 | | | | 56.7 | | | | 38.6 | | | | 15.4 | | | | 54.0 | |
Non-current lease liabilities | | Other non-current liabilities | | | 167.1 | | | | 42.7 | | | | 209.8 | | | | 178.1 | | | | 43.9 | | | | 222.0 | |
| | | | | | | | | | | | | | | | | | | | |
Weighted average remaining lease term | | | | 6.4 years | | | 5.2 years | | | | | | 7.2 years | | | 5.7 years | | | | |
| | | | | | | | | | | | | | | | | | | | |
Weighted average discount rates | | | | | 4.1 | % | | | 4.3 | % | | | | | | 3.8 | % | | | 3.9 | % | | | |
The supplemental cash flow information related to leases is as follows (in millions):
| | | | | | | | | | | | |
| | Year Ended December 31, | |
| | 2024 | | | 2023 | | | 2022 | |
Cash paid for amounts included in the measurement of lease liabilities: | | | | | | | | | |
Cash paid for operating lease liabilities | | $ | 55.0 | | | $ | 54.5 | | | $ | 49.8 | |
Cash paid for finance lease liabilities | | | 20.8 | | | | 14.6 | | | | 10.3 | |
Right of use assets obtained in exchange for lease liabilities | | | | | | | | | |
Operating leases | | $ | 38.2 | | | $ | 45.2 | | | $ | 56.0 | |
Finance leases | | | 18.0 | | | | 44.2 | | | | 8.8 | |
The table below presents the right of use asset balance for leases disaggregated by type of lease (in millions):
| | | | | | | | |
| | December 31, | |
| | 2024 | | | 2023 | |
Operating Leases | | | | | | |
Real estate leases | | $ | 185.3 | | | $ | 191.5 | |
Equipment leases | | | 14.8 | | | | 14.4 | |
| | $ | 200.1 | | | $ | 205.9 | |
Finance Leases | | | | | | |
Real estate leases | | $ | 8.6 | | | $ | 11.9 | |
Equipment leases | | | 48.6 | | | | 46.5 | |
| | $ | 57.2 | | | $ | 58.4 | |
OSHKOSH CORPORATION
NOTES OF CONSOLIDATED FINANCIAL STATEMENTS
Maturities of lease liabilities at December 31, 2024 and minimum payments for leases having initial or remaining non-cancelable terms in excess of one year were as follows (in millions):
| | | | | | | | | | | | |
Amounts due in | | Operating leases | | | Finance leases | | | Total | |
2025 | | $ | 49.3 | | | $ | 18.5 | | | $ | 67.8 | |
2026 | | | 36.8 | | | | 15.1 | | | | 51.9 | |
2027 | | | 36.4 | | | | 11.0 | | | | 47.4 | |
2028 | | | 33.8 | | | | 6.8 | | | | 40.6 | |
2029 | | | 23.2 | | | | 3.6 | | | | 26.8 | |
Thereafter | | | 56.0 | | | | 11.0 | | | | 67.0 | |
Total lease payments | | | 235.5 | | | | 66.0 | | | | 301.5 | |
Less: imputed interest | | | 27.9 | | | | 7.1 | | | | 35.0 | |
Present value of lease liability | | $ | 207.6 | | | $ | 58.9 | | | $ | 266.5 | |
14. Investments in Unconsolidated Affiliates
Equity method investments — Investments in equity securities where the Company’s ownership interest exceeds 20% and the Company does not have a controlling interest or where the ownership is less than 20% and for which the Company has significant influence are accounted for using the equity method. Investments in limited partnerships or limited liability companies that maintain separate ownership accounts are also accounted for using the equity method unless the Company's interest is so minor that it has virtually no influence over the investee's operating and financial policies.
Investments in unconsolidated affiliates accounted for under the equity method consisted of the following (in millions):
| | | | | | | | | | | | |
| | | | | December 31, | |
| | Ownership % | | | 2024 | | | 2023 | |
AutoTech Fund II, L.P. | | | 7 | % | | $ | 7.8 | | | $ | 8.5 | |
AutoTech Fund III, L.P. | | | 6 | % | | | 3.3 | | | | 1.2 | |
BME Fire Trucks LLC | | | 25 | % | | | 1.8 | | | | 2.8 | |
Carnegie Foundry LLC | | | 6 | % | | | 4.5 | | | | 4.7 | |
Construction Robotics, LLC | | | 9 | % | | | 2.3 | | | | 2.3 | |
Eatron Technologies | | | 3 | % | | | 1.9 | | | | — | |
Forterra (previously Robotic Research LLC) | | | 1 | % | | | 2.4 | | | | 11.2 | |
Westly Capital Partners Fund IV, L.P. | | | 3 | % | | | 4.1 | | | | 3.8 | |
| | | | | $ | 28.1 | | | $ | 34.5 | |
Recorded investments generally represent the Company’s maximum exposure to loss as a result of the Company’s ownership interest. Earnings or losses are reflected in “Losses of unconsolidated affiliates” in the Consolidated Statements of Income. Due to the timing and availability of information, earnings or losses from unconsolidated affiliates accounted for using the equity method are recorded on a three-month lag.
In the second quarter of 2024, the Company recorded an impairment related to its investment in Forterra (previously Robotic Research LLC) of $6.6 million. In the first quarter of 2023, the Company wrote down its 49% interest in the Mezcladoras Trailers de Mexico, S.A. de C.V. (Mezcladoras) joint venture by $5.9 million based on the estimated fair market value of the investment. In the third quarter of 2023, the Company completed the sale of Mezcladoras for $2.9 million, resulting in an additional loss of $1.9 million, primarily to eliminate the cumulative translation adjustments related to Mezcladoras upon liquidation of the investment.
OSHKOSH CORPORATION
NOTES OF CONSOLIDATED FINANCIAL STATEMENTS
Investments in equity securities — Investments in equity securities where the Company does not have a controlling interest or significant influence are recorded at fair value to the extent it is readily determinable. Investments in equity securities without a readily determinable fair value are recorded at cost and adjusted for any impairments and any observable price changes in orderly transactions for the identical or a similar investment of the same issuer should they occur. Gains or losses are reflected in “Miscellaneous, net” in the Consolidated Statements of Income.
Investments in unconsolidated affiliates not accounted for under the equity method with a readily determinable fair value consisted of the following (in millions):
| | | | | | | | | | | | |
| | Cost Basis | | | Unrealized
Gain (Loss) | | | Fair Value | |
December 31, 2024 | | $ | 25.0 | | | $ | (19.8 | ) | | $ | 5.2 | |
December 31, 2023 | | | 25.0 | | | | (21.5 | ) | | | 3.5 | |
Investments in unconsolidated affiliates not accounted for under the equity method without a readily determinable fair value consisted of the following (in millions):
| | | | | | | | | | | | |
| | Cost Basis | | | Accumulated
Impairment and Adjustments | | | Carrying Value | |
December 31, 2024 | | $ | 5.3 | | | $ | (0.2 | ) | | $ | 5.1 | |
December 31, 2023 | | | 5.5 | | | | (0.2 | ) | | | 5.3 | |
15. Other Non-Current Assets
Other non-current assets consisted of the following (in millions):
| | | | | | | | |
| | December 31, | |
| | 2024 | | | 2023 | |
Lease right of use assets (See Note 13) | | $ | 257.3 | | | $ | 264.3 | |
Prepaid benefit cost (See Note 6) | | | 46.4 | | | | 7.6 | |
Investments in affiliates (See Note 14) | | | 38.4 | | | | 43.3 | |
Rabbi trust, less current portion | | | 9.7 | | | | 12.3 | |
Other | | | 38.0 | | | | 32.1 | |
Other non-current assets | | $ | 389.8 | | | $ | 359.6 | |
The rabbi trust holds investments to fund certain of the Company's obligations under its nonqualified SERP. Rabbi trust investments include money market and mutual funds. The rabbi trust assets are subject to claims of the Company's creditors.
OSHKOSH CORPORATION
NOTES OF CONSOLIDATED FINANCIAL STATEMENTS
16. Debt
The Company was obligated under the following debt instruments (in millions):
| | | | | | | | |
| | December 31, | |
| | 2024 | | | 2023 | |
4.600% Senior notes due May 2028 | | $ | 300.0 | | | $ | 300.0 | |
3.100% Senior notes due March 2030 | | | 300.0 | | | | 300.0 | |
Other long-term debt | | | 5.2 | | | | 1.7 | |
Total long-term debt | | | 605.2 | | | | 601.7 | |
Current maturities of long-term debt | | | (2.3 | ) | | | — | |
Debt issuance costs | | | (3.4 | ) | | | (4.2 | ) |
Total long-term debt, less current maturities (net of debt issuance costs) | | $ | 599.5 | | | $ | 597.5 | |
| | | | | | |
Revolving credit facilities | | $ | 360.0 | | | $ | 175.0 | |
Current maturities of long-term debt | | | 2.3 | | | | — | |
Total revolving credit facilities and current maturities of long-term debt | | $ | 362.3 | | | $ | 175.0 | |
On March 23, 2022, the Company entered into a Third Amended and Restated Credit Agreement with various lenders (the “Credit Agreement”). The Credit Agreement provides for an unsecured revolving credit facility (the “Revolving Credit Facility”) that matures in March 2027 with an initial maximum aggregate amount of availability of $1.10 billion. On April 3, 2024, the Company amended the Credit Agreement to increase the maximum aggregate amount of availability under the Revolving Credit Facility to $1.55 billion. At December 31, 2024, borrowings under the Revolving Credit Facility of $360.0 million and specified outstanding letters of credit of $26.3 million reduced available capacity under the Revolving Credit Facility to $1.16 billion.
Under the Credit Agreement, the Company is obligated to pay (i) an unused commitment fee ranging from 0.080% to 0.225% per annum of the average daily unused portion of the aggregate revolving credit commitments under the Credit Agreement and (ii) a fee ranging from 0.438% to 1.500% per annum of the maximum amount available to be drawn for each letter of credit issued and outstanding under the Credit Agreement.
Borrowings under the Credit Agreement bear interest for dollar-denominated loans at a variable rate equal to (i) Term SOFR (the forward-looking secured overnight financing rate) plus a specified margin, which may be adjusted upward or downward depending on whether certain criteria are satisfied, or (ii) the base rate (which is the highest of (x) Bank of America, N.A.’s prime rate, (y) the federal funds rate plus 0.50% or (z) the sum of 1.00% plus one-month Term SOFR) plus a specified margin, which may be adjusted upward or downward depending on whether certain criteria are satisfied. At December 31, 2024, the interest spread on the Revolving Credit Facility was 112.5 basis points, resulting in an interest rate of 5.6%.
The Credit Agreement contains various restrictions and covenants, including a requirement that the Company maintain a leverage ratio at certain levels, subject to certain exceptions, restrictions on the ability of the Company and certain of its subsidiaries to consolidate or merge, create liens, incur additional subsidiary indebtedness and consummate acquisitions and a restriction on the disposition of all or substantially all of the assets of the Company and its subsidiaries taken as a whole.
The Credit Agreement requires the Company to maintain a maximum leverage ratio (defined as, with certain adjustments, the ratio of the Company’s consolidated indebtedness to the Company’s consolidated net income for the previous four quarters before interest, taxes, depreciation, amortization, non-cash charges and certain other items (EBITDA)) as of the last day of any quarter of 3.75 to 1.00, subject to the Company’s right to temporarily increase the maximum leverage ratio to 4.25 to 1.00 in connection with certain material acquisitions. The Company was in compliance with the financial covenant contained in the Credit Agreement as of December 31, 2024.
As of December 31, 2024, AUSA has outstanding debt of €2.9 million ($3.0 million) with a weighted average interest rate of 0.05%. As of December 31, 2024, Hinowa has outstanding debt of €2.2 million ($2.2 million) with a weighted average interest rate of 1.38%.
OSHKOSH CORPORATION
NOTES OF CONSOLIDATED FINANCIAL STATEMENTS
In September 2019, the Company entered into an uncommitted line of credit to provide short-term finance support to operations in China. The line of credit carries a maximum availability of 426.0 million Chinese renminbi. There were no amounts outstanding on the line of credit as of December 31, 2024 or December 31, 2023. The line of credit carries a variable interest rate that is set by the lender, which was 3.6% at December 31, 2024.
In May 2018, the Company issued $300.0 million of 4.60% unsecured senior notes due May 15, 2028 (the “2028 Senior Notes”). In February 2020, the Company issued $300.0 million of 3.10% unsecured senior notes due March 1, 2030 (the “2030 Senior Notes”). The 2028 Senior Notes and the 2030 Senior Notes were issued pursuant to an indenture (the “Indenture”) between the Company and a trustee. The Indenture contains customary affirmative and negative covenants. The Company has the option to redeem the 2028 and 2030 Senior Notes at any time for a premium.
The fair value of the long-term debt is estimated based upon Level 2 inputs to reflect the market rate of the Company’s debt. At December 31, 2024, the fair value of the 2028 Senior Notes and the 2030 Senior Notes was estimated to be $296 million ($295 million at December 31, 2023) and $273 million ($269 million at December 31, 2023), respectively. The fair values of the Revolving Credit Facility approximated its carrying values at December 31, 2024 and 2023. See Note 23 for the definition of a Level 2 input.
17. Warranties
The Company’s products generally carry standard warranties that extend from six months to five years, based on terms that are generally accepted in the marketplace. Selected components (such as engines, transmissions, batteries, tires, etc.) included in the Company’s end products may include manufacturers’ warranties. These manufacturers’ warranties are generally passed on to the end customer of the Company’s products, and the customer would generally deal directly with the component manufacturer. Warranty costs were $67.8 million, $51.8 million and $50.8 million in 2024, 2023 and 2022, respectively.
Provisions for estimated warranty and other related costs are recorded at the time of sale and are periodically adjusted to reflect actual experience. Certain warranty and other related claims involve matters of dispute that ultimately are resolved by negotiation, arbitration or litigation. At times, warranty issues arise that are beyond the scope of the Company’s historical experience. It is reasonably possible that additional warranty and other related claims could arise from disputes or other matters in excess of amounts accrued; however, the Company does not expect that any such amounts, while not determinable, would have a material effect on the Company's consolidated financial condition, results of operations or cash flows.
Changes in the Company’s assurance-type warranty liabilities were as follows (in millions):
| | | | | | | | | | | | |
| | Year Ended December 31, | |
| | 2024 | | | 2023 | | | 2022 | |
Balance at beginning of period | | $ | 64.2 | | | $ | 58.8 | | | $ | 65.7 | |
Warranty provisions | | | 67.3 | | | | 52.1 | | | | 49.3 | |
Settlements made | | | (60.1 | ) | | | (51.3 | ) | | | (57.7 | ) |
Changes in liability for pre-existing warranties, net | | | 0.5 | | | | (0.3 | ) | | | 1.5 | |
Acquisition of businesses | | | 1.1 | | | | 4.8 | | | | 0.2 | |
Foreign currency translation | | | (0.2 | ) | | | 0.1 | | | | (0.2 | ) |
Balance at end of period | | $ | 72.8 | | | $ | 64.2 | | | $ | 58.8 | |
The liabilities associated with service-type warranties are disclosed in Note 4.
18. Guarantees
Customers of the Company, from time to time, may fund purchases from the Company through third-party finance companies. In certain instances, the Company may be requested to provide support for these arrangements through credit or residual value guarantees, by which the Company agrees to make payments to the finance companies in certain circumstances as further described below.
OSHKOSH CORPORATION
NOTES OF CONSOLIDATED FINANCIAL STATEMENTS
Credit Guarantees: The Company is party to multiple agreements whereby at December 31, 2024, the Company guaranteed an aggregate of $596.1 million in indebtedness of customers. At December 31, 2024, the Company estimated that its maximum loss exposure under these contracts was $95.5 million. Terms of these guarantees coincide with the financing arranged by the customer and generally do not exceed five years. Under the terms of these agreements and upon the occurrence of certain events, the Company generally has the ability to, among other things, take possession of the underlying collateral. If the financial condition of the customers were to deteriorate and result in their inability to make payments, then loss provisions in excess of amounts provided for at inception may be required. Given the Company’s position as original equipment manufacturer and its knowledge of end markets, the Company, when called upon to fulfill a guarantee, generally has been able to liquidate the financed equipment at a minimal loss, if any, to the Company. While the Company does not expect to experience losses under these agreements that are materially in excess of the amounts reserved, it cannot provide any assurance that the financial condition of the third parties will not deteriorate resulting in the third parties’ inability to meet their obligations. In the event that this occurs, the Company cannot guarantee that the collateral underlying the agreements will be sufficient to avoid losses materially in excess of the amounts reserved. Any losses under these guarantees would generally be mitigated by the value of any underlying collateral, including financed equipment. During periods of economic weakness, collateral values generally decline and can contribute to higher exposure to losses.
Residual Value Guarantees: The Company is party to multiple agreements whereby at December 31, 2024, the Company guaranteed to support an aggregate of $101.2 million of customer equipment value. At December 31, 2024, the Company estimated that its maximum loss exposure under these contracts was $11.4 million. Terms of these guarantees coincide with the financing arranged by the customer and generally do not exceed five years. Under the terms of these agreements, the Company guarantees that a piece of equipment will have a minimum residual value at a future date. If the counterparty is not able to recover the agreed upon residual value through sale, or alternative disposition, the Company is responsible for a portion of the shortfall. The Company is generally able to mitigate a portion of the risk associated with these guarantees by staggering the maturity terms of the guarantees, diversification of the portfolio and leveraging knowledge gained through the Company’s own experience in the used equipment markets. There can be no assurance the Company’s historical experience in used equipment markets will be indicative of future results. The Company’s ability to recover losses experienced from its guarantees may be affected by economic conditions in used equipment markets at the time of loss. During periods of economic weakness, residual values generally decline and can contribute to higher exposure to losses.
The Company’s stand ready obligations (non-contingent) to perform under guarantees were $12.1 million and $12.4 million at December 31, 2024 and 2023, respectively.
The contingent portion of the guarantee liabilities that relates to credit losses is recognized separately and is recorded within “Other current liabilities” and “Other non-current liabilities” in the Company’s Consolidated Balance Sheets. The Company’s off-balance sheet credit loss exposure (contingent) related to its guarantees were $5.3 million and $5.8 million at December 31, 2024 and 2023, respectively.
19. Commitments and Contingencies
Personal Injury Actions and Other — Product and general liability claims are made against the Company from time to time in the ordinary course of business. The Company is generally self-insured for claims up to $10.0 million per claim ($5.0 million per claim prior to April 1, 2024) and a reserve is maintained for the estimated costs of such claims. At December 31, 2024 and 2023, the estimated net liabilities for product and general liability claims totaled $45.2 million and $50.1 million, respectively. There is inherent uncertainty as to the eventual resolution of unsettled claims. Management, however, believes that any losses in excess of established reserves will not have a material effect on the Company’s financial condition, results of operations or cash flows.
Market Risks — The Company was contingently liable under bid, performance and specialty bonds totaling $2.86 billion and $2.58 billion at December 31, 2024 and 2023, respectively. Outstanding letters of credit issued by the Company’s banks in favor of third parties totaled $46.5 million and $18.2 million at December 31, 2024 and 2023, respectively.
OSHKOSH CORPORATION
NOTES OF CONSOLIDATED FINANCIAL STATEMENTS
Other Matters — The Company is subject to environmental matters and legal proceedings and claims, including patent, antitrust, product liability, warranty and state dealership regulation compliance proceedings that arise in the ordinary course of business. Although the final results of such matters and claims cannot be predicted with certainty, management believes that the ultimate resolution will not have a material effect on the Company’s financial condition, results of operations or cash flows. Actual results could vary, among other things, due to the uncertainties involved in litigation.
Certain risks are inherent in doing business with the DoD, including technological changes and changes in levels of defense spending. The USPS and all DoD contracts contain a provision that they may be terminated at any time at the convenience of the customer. In such an event, the Company is entitled to recover allowable costs plus a reasonable profit earned to the date of termination. Major contracts for defense, delivery and other specialty vehicles and mobility systems are performed over extended periods of time and are subject to changes in scope of work and delivery schedules. Pricing negotiations on changes and settlement of claims often extend over prolonged periods of time. The Company’s ultimate profitability on such contracts may depend on the eventual outcome of an equitable settlement of contractual issues with the Company’s customers.
Because the Company is a relatively large defense contractor, the Company’s U.S. government contract operations are subject to extensive annual audit processes and to U.S. government investigations of business practices and cost classifications from which legal or administrative proceedings can result. Based on U.S. government procurement regulations, under certain circumstances the Company could be fined, as well as suspended or debarred from U.S. government contracting. During a suspension or debarment, the Company would also be prohibited from selling equipment or services to customers that depend on loans or financial commitments from the Export-Import Bank, Overseas Private Investment Corporation and similar U.S. government agencies.
20. Shareholders’ Equity
Changes to the Company's common shares outstanding were as follows (in shares):
| | | | | | | | | | | | |
| | Year Ended December 31, | |
| | 2024 | | | 2023 | | | 2022 | |
Outstanding at beginning of period | | | 65,473,807 | | | | 65,472,148 | | | | 66,812,118 | |
Repurchases of Common Stock | | | (1,058,474 | ) | | | (265,795 | ) | | | (1,508,467 | ) |
Exercise of stock options | | | 65,253 | | | | 122,128 | | | | 47,504 | |
Payment of stock-based restricted and performance shares | | | 216,778 | | | | 255,927 | | | | 199,545 | |
Shares tendered for taxes on stock-based compensation | | | (101,920 | ) | | | (118,310 | ) | | | (91,666 | ) |
Other | | | 6,563 | | | | 7,709 | | | | 13,114 | |
Outstanding at end of period | | | 64,602,007 | | | | 65,473,807 | | | | 65,472,148 | |
In May 2022, the Board of Directors authorized the Company to repurchase of 12,000,000 shares of Common Stock. As of December 31, 2024, 10,226,408 shares of Common Stock remain under this authority.
OSHKOSH CORPORATION
NOTES OF CONSOLIDATED FINANCIAL STATEMENTS
21. Accumulated Other Comprehensive Income (Loss)
Changes in accumulated other comprehensive income (loss) by component, net of tax, were as follows (in millions):
| | | | | | | | | | | | | | | | |
| | Pension and
Post-Employment
Benefits | | | Cumulative
Translation
Adjustments | | | Derivative Instruments | | | Accumulated Other
Comprehensive
Income (Loss) | |
Balance at December 31, 2021 | | | (25.6 | ) | | | (105.2 | ) | | | 2.2 | | | | (128.6 | ) |
Other comprehensive income (loss) before reclassifications | | | 29.3 | | | | (31.0 | ) | | | 6.2 | | | | 4.5 | |
Amounts reclassified from accumulated other comprehensive income (loss) | | | 27.4 | | | | 4.6 | | | | (0.2 | ) | | | 31.8 | |
Net current period other comprehensive income (loss) | | | 56.7 | | | | (26.4 | ) | | | 6.0 | | | | 36.3 | |
Balance at December 31, 2022 | | | 31.1 | | | | (131.6 | ) | | | 8.2 | | | | (92.3 | ) |
Other comprehensive income (loss) before reclassifications | | | 3.5 | | | | 24.2 | | | | (0.5 | ) | | | 27.2 | |
Amounts reclassified from accumulated other comprehensive income (loss) | | | (1.6 | ) | | | 2.9 | | | | (8.2 | ) | | | (6.9 | ) |
Net current period other comprehensive income (loss) | | | 1.9 | | | | 27.1 | | | | (8.7 | ) | | | 20.3 | |
Balance at December 31, 2023 | | | 33.0 | | | | (104.5 | ) | | | (0.5 | ) | | | (72.0 | ) |
Other comprehensive income (loss) before reclassifications | | | 37.2 | | | | (67.7 | ) | | | 0.6 | | | | (29.9 | ) |
Amounts reclassified from accumulated other comprehensive income (loss) | | | (1.8 | ) | | | — | | | | 0.5 | | | | (1.3 | ) |
Net current period other comprehensive income (loss) | | | 35.4 | | | | (67.7 | ) | | | 1.1 | | | | (31.2 | ) |
Balance at December 31, 2024 | | $ | 68.4 | | | $ | (172.2 | ) | | $ | 0.6 | | | $ | (103.2 | ) |
Reclassifications out of accumulated other comprehensive income (loss) included in the computation of net periodic pension and post-employment benefit cost (See Note 6 for additional details regarding employee benefit plans) are included within "Miscellaneous, net" within the Consolidated Statements of Income and were as follows (in millions):
| | | | | | | | | | | | |
| | Year Ended December 31, | |
| | 2024 | | | 2023 | | | 2022 | |
Amortization of pension and post-employment benefits items | |
Prior service costs | | $ | 0.2 | | | $ | 0.5 | | | $ | 0.8 | |
Settlement | | | — | | | | — | | | | 33.6 | |
Actuarial (gains) losses | | | (2.6 | ) | | | (2.6 | ) | | | 1.3 | |
Total before tax | | | (2.4 | ) | | | (2.1 | ) | | | 35.7 | |
Tax expense (benefit) | | | 0.6 | | | | 0.5 | | | | (8.3 | ) |
Net of tax | | $ | (1.8 | ) | | $ | (1.6 | ) | | $ | 27.4 | |
22. Derivative Financial Instruments and Hedging Activities
The Company uses forward foreign currency exchange contracts (derivatives) to reduce the exchange rate risk of specific foreign currency denominated transactions. These derivatives typically require the exchange of a foreign currency for U.S. dollars at a fixed rate at a future date. At times, the Company has designated these hedges as either cash flow hedges or fair value hedges under FASB ASC Topic 815, Derivatives and Hedging, as follows:
Fair Value Hedging Strategy: The Company enters into forward foreign exchange contracts to hedge firm commitments denominated in foreign currencies. The purpose of the Company’s foreign currency hedging activities is to protect the Company from risk that the eventual U.S. dollar-equivalent cash flows from the sale of products to international customers will be adversely affected by changes in exchange rates.
OSHKOSH CORPORATION
NOTES OF CONSOLIDATED FINANCIAL STATEMENTS
Cash Flow Hedging Strategy: To protect against the impact of movements in foreign exchange rates on forecasted purchases or sales transactions denominated in foreign currency, the Company has a foreign currency cash flow hedging program. The Company hedges portions of its forecasted transactions denominated in foreign currency with forward contracts.
At December 31, 2024, the total notional U.S. dollar equivalent of outstanding forward foreign exchange contracts designated as hedges in accordance with ASC Topic 815 was $29.4 million. Net gains or losses related to these contracts are recorded within the same line item in the Consolidated Statements of Income impacted by the hedged item. The maximum length of time the Company is hedging its exposure to the variability in future cash flows is two years.
The Company enters into forward foreign currency exchange contracts to create economic hedges to manage foreign exchange risk exposure associated with non-functional currency denominated receivables and payables resulting from global sales and sourcing activities. The Company has not designated these derivative contracts as hedge transactions under FASB ASC Topic 815, and accordingly, the mark-to-market impact of these derivatives is recorded each period in current earnings within “Miscellaneous, net” in the Consolidated Statements of Income. The fair value of foreign currency related derivatives is included in the Consolidated Balance Sheets in “Other current assets” and “Other current liabilities.” At December 31, 2024, the U.S. dollar equivalent of these outstanding forward foreign exchange contracts totaled $79.4 million in notional amounts covering a variety of foreign currency exposures.
The fair values of all open derivative instruments were as follows (in millions):
| | | | | | | | | | | | |
| | December 31, 2024 | |
| | Other
Current Assets | | | Other Current Liabilities | | | Other Non-Current Liabilities | |
Cash flow hedges: | | | | | | | | | |
Foreign exchange contracts | | $ | 0.9 | | | $ | 0.2 | | | $ | — | |
| | | | | | | | | |
Not designated as hedging instruments: | | | | | | | | | |
Foreign exchange contracts | | | 0.8 | | | | 0.8 | | | | — | |
| | $ | 1.7 | | | $ | 1.0 | | | $ | — | |
| | | | | | | | | | | | |
| | December 31, 2023 | |
| | Other
Current Assets | | | Other Current Liabilities | | | Other Non-Current Liabilities | |
Cash flow hedges: | | | | | | | | | |
Foreign exchange contracts | | $ | — | | | $ | 0.7 | | | $ | — | |
| | | | | | | | | |
Not designated as hedging instruments: | | | | | | | | | |
Foreign exchange contracts | | | 0.5 | | | | 2.5 | | | | 0.2 | |
| | $ | 0.5 | | | $ | 3.2 | | | $ | 0.2 | |
The pre-tax effects of derivative instruments consisted of the following (in millions):
| | | | | | | | | | | | | | |
| | Classification of | | Year Ended December 31, | |
| | Gains (Losses) | | 2024 | | | 2023 | | | 2022 | |
Cash flow hedges: | | | | | | | | | | | |
Foreign exchange contracts | | Net Sales | | $ | — | | | $ | 9.6 | | | $ | — | |
Foreign exchange contracts | | Cost of sales | | | (0.5 | ) | | | 2.3 | | | | 1.4 | |
| | | | | | | | | | | |
Not designated as hedging instruments: | | | | | | | | | |
Foreign exchange contracts | | Miscellaneous, net | | | 0.9 | | | | 2.7 | | | | 0.9 | |
| | | | $ | 0.4 | | | $ | 14.6 | | | $ | 2.3 | |
OSHKOSH CORPORATION
NOTES OF CONSOLIDATED FINANCIAL STATEMENTS
23. Fair Value Measurement
FASB ASC Topic 820, Fair Value Measurements and Disclosures, defines fair value as the price that would be received to sell an asset or paid to transfer a liability (i.e., exit price) in an orderly transaction between market participants at the measurement date. FASB ASC Topic 820 requires disclosures that categorize assets and liabilities measured at fair value into one of three different levels depending on the assumptions (i.e., inputs) used in the valuation. Level 1 provides the most reliable measure of fair value, while Level 3 generally requires significant management judgment.
The three levels are defined as follows:
Level 1: Unadjusted quoted prices in active markets for identical assets or liabilities.
Level 2: Observable inputs other than quoted prices in active markets for identical assets or liabilities, such as quoted prices for similar assets or liabilities in active markets or quoted prices for identical assets or liabilities in inactive markets.
Level 3: Unobservable inputs reflecting management’s own assumptions about the inputs used in pricing the asset or liability.
The fair values of the Company’s financial assets and liabilities were as follows (in millions):
| | | | | | | | | | | | | | | | |
| | Level 1 | | | Level 2 | | | Level 3 | | | Total | |
December 31, 2024 | | | | | | | | | | | | |
Assets: | | | | | | | | | | | | |
Rabbi trust (a) | | $ | 13.6 | | | $ | — | | | $ | — | | | $ | 13.6 | |
Investments in equity securities (b) | | | 5.2 | | | | — | | | | — | | | | 5.2 | |
Foreign currency exchange derivatives (c) | | | — | | | | 1.7 | | | | — | | | | 1.7 | |
Liabilities: | | | | | | | | | | | | |
Foreign currency exchange derivatives (c) | | $ | — | | | $ | 1.0 | | | $ | — | | | $ | 1.0 | |
| | | | | | | | | | | | | | | | |
| | Level 1 | | | Level 2 | | | Level 3 | | | Total | |
December 31, 2023 | | | | | | | | | | | | |
Assets: | | | | | | | | | | | | |
Rabbi trust (a) | | $ | 14.1 | | | $ | — | | | $ | — | | | $ | 14.1 | |
Investments in equity securities (b) | | | 3.5 | | | | — | | | | — | | | | 3.5 | |
Foreign currency exchange derivatives (c) | | | — | | | | 0.5 | | | | — | | | | 0.5 | |
Liabilities: | | | | | | | | | | | | |
Foreign currency exchange derivatives (c) | | $ | — | | | $ | 3.4 | | | $ | — | | | $ | 3.4 | |
(a)Represents investments held in a rabbi trust for the Company’s non-qualified supplemental executive retirement plan (SERP). The fair values of these investments are determined using a market approach. Investments include money markets and mutual funds for which quoted prices in active markets are available. Rabbi trust assets are subject to claims of the Company's creditors. The Company records changes in the fair value of investments in “Miscellaneous, net” in the Consolidated Statements of Income.
(b)Represents investments in equity securities for which quoted prices in active markets are available. The Company records changes in the fair value of investments in “Miscellaneous, net” in the Consolidated Statements of Income.
(c)Based on observable market transactions of forward currency prices.
See Notes 6, 14 and 16 for fair value information related to pension assets, investments and debt.
Items Measured at Fair Value on a Nonrecurring Basis — In addition to items that are measured at fair value on a recurring basis, the Company also has assets and liabilities in its balance sheet that are measured at fair value on a nonrecurring basis. As these assets and liabilities are not measured at fair value on a recurring basis, they are not included in the tables above. Assets and liabilities that are measured at fair value on a nonrecurring basis include long-lived assets (See Note 3 for fair value of assets acquired and liabilities assumed through acquisitions and Note 12 for impairment valuation analysis of intangible assets). The
OSHKOSH CORPORATION
NOTES OF CONSOLIDATED FINANCIAL STATEMENTS
Company has determined that the fair value measurements related to each of these assets rely primarily on Company-specific inputs and the Company’s assumptions about the use of the assets, as observable inputs are not available. As such, the Company has determined that each of these fair value measurements reside within Level 3 of the fair value hierarchy.
24. Business Segment Information
The Chief Executive Officer is the Company's Chief Operating Decision Maker (CODM). The CODM uses operating income to measure performance of the Company's segments, allocate resources and make operating decisions. Operating income is utilized during the Company’s budgeting and forecasting process to assess segment profitability and enable decision making regarding strategic initiatives, capital investments and other resources. The CODM regularly evaluates operating income compared to prior year and forecasted results. The Company’s reportable segments, which are organized on the basis of similar products, markets and operating factors, are as follows:
Access: This segment consists of the JLG and Jerr-Dan brands. JLG designs and manufactures mobile aerial work platforms and telehandlers and low-level access solutions that are sold worldwide for use in a wide variety of construction, industrial, institutional and general maintenance applications to position workers and materials at elevated heights. JerrDan designs and manufactures towing and recovery vehicles. Access customers include equipment rental companies, construction contractors, manufacturing companies, home improvement centers and towing companies.
Vocational: This segment includes the Pierce, Maxi-Metal, Oshkosh AeroTech, Oshkosh Airport Products, McNeilus, IMT, Frontline and Oshkosh S-Series brands. Pierce and Maxi-Metal design and manufacture commercial and customer fire apparatus vehicles primarily for fire departments, airports and other governmental units. Oshkosh AeroTech and Oshkosh Airport Products design and manufacture aviation ground support products, gate equipment and aircraft rescue and firefighting vehicles and provide airport services to commercial airlines, airports, air-freight carriers, ground handling customers and militaries. McNeilus designs and manufactures refuse and recycling collection vehicles. IMT designs and manufactures field service vehicles and truck-mounted cranes for niche markets. Frontline designs and manufactures simulators, command vehicles and other communication vehicles. Oshkosh S-Series designs and manufactures front-discharge concrete mixer vehicles.
Defense: This segment consists of the Oshkosh Defense brand. Oshkosh Defense designs and manufactures tactical wheeled vehicles and supply parts and services for the U.S. military and for other militaries around the world, as well as delivery vehicles for the USPS. Sales to the U.S. Government accounted for 96%, 84% and 95% of the segment's sales in 2024, 2023 and 2022, respectively.
In accordance with FASB ASC Topic 280, Segment Reporting, for purposes of business segment performance measurement, the Company does not allocate to individual business segments costs or items that are of a non-operating nature or organizational or functional expenses of a corporate nature. The caption “Corporate and other” includes Pratt Miller, corporate office expenses, certain new product development costs, stock-based compensation, costs of certain business initiatives and shared services or operations benefiting multiple segments and results of insignificant operations.
The accounting policies of the reportable segments are the same as those described in Note 2.
OSHKOSH CORPORATION
NOTES OF CONSOLIDATED FINANCIAL STATEMENTS
Selected financial information relating to the Company’s reportable segments and product lines is as follows (in millions):
| | | | | | | | | | | | |
| | Year Ended December 31, | |
| | 2024 | | | 2023 | | | 2022 | |
Net sales: | | | | | | | | | |
Access | | | | | | | | | |
Aerial work platforms | | $ | 2,443.9 | | | $ | 2,461.6 | | | $ | 1,949.0 | |
Telehandlers | | | 1,569.0 | | | | 1,480.2 | | | | 1,174.8 | |
Other | | | 1,151.8 | | | | 1,048.2 | | | | 848.3 | |
Total Access | | | 5,164.7 | | | | 4,990.0 | | | | 3,972.1 | |
| | | | | | | | | |
Vocational | | | | | | | | | |
Municipal fire apparatus(a) | | | 1,290.5 | | | | 1,102.1 | | | | 993.5 | |
Airport products(a) | | | 862.5 | | | | 376.7 | | | | 92.5 | |
Refuse and recycling vehicles | | | 686.2 | | | | 590.7 | | | | 536.4 | |
Other(a) | | | 471.1 | | | | 508.6 | | | | 553.3 | |
Total Vocational | | | 3,310.3 | | | | 2,578.1 | | | | 2,175.7 | |
| | | | | | | | | |
Defense(b) | | | | | | | | | |
Defense | | | 2,051.5 | | | | 2,001.4 | | | | 2,059.1 | |
Delivery vehicles | | | 103.7 | | | | — | | | | — | |
Total Defense | | | 2,155.2 | | | | 2,001.4 | | | | 2,059.1 | |
| | | | | | | | | |
Corporate and Other(b) | | | 100.0 | | | | 88.4 | | | | 75.1 | |
Consolidated | | $ | 10,730.2 | | | $ | 9,657.9 | | | $ | 8,282.0 | |
(d)Results for 2023 and 2022 have been reclassified to reflect the separate presentation of the airport products product line.
(e)Results for 2023 and 2022 have been reclassified to reflect the move of Pratt Miller from the Defense segment to Corporate and Other.
| | | | | | | | | | | | | | | | | | | | |
| | Year Ended December 31, 2024 | |
| | Access | | | Vocational | | | Defense | | | Corporate and Other | | | Consolidated | |
Net Sales | | $ | 5,164.7 | | | $ | 3,310.3 | | | $ | 2,155.2 | | | $ | 100.0 | | | $ | 10,730.2 | |
Cost of sales (excluding R&D) | | | 3,951.4 | | | | 2,583.4 | | | | 1,977.9 | | | | 79.0 | | | | 8,591.7 | |
Research and development | | | 84.5 | | | | 47.3 | | | | 18.2 | | | | 19.1 | | | | 169.1 | |
Gross income | | | 1,128.8 | | | | 679.6 | | | | 159.1 | | | | 1.9 | | | | 1,969.4 | |
Employee compensation | | | 161.3 | | | | 128.6 | | | | 54.4 | | | | 166.7 | | | | 511.0 | |
Amortization of purchased intangibles | | | 10.7 | | | | 39.7 | | | | — | | | | 4.3 | | | | 54.7 | |
Intangible asset impairments | | | — | | | | — | | | | — | | | | 51.6 | | | | 51.6 | |
Other segment items(a) | | | 151.4 | | | | 114.2 | | | | 53.3 | | | | 22.5 | | | | 341.4 | |
Operating income(b) | | | 805.4 | | | | 397.1 | | | | 51.4 | | | | (243.2 | ) | | | 1,010.7 | |
Interest expense, net of interest income | | | | | | | | | | | | | | | (111.9 | ) |
Miscellaneous, net | | | | | | | | | | | | | | | 4.2 | |
Income before income taxes and losses of unconsolidated affiliates | | | | | | | | | | | | | | $ | 903.0 | |
(a)Includes outside services and consulting, software and information technology, travel, office expenses, depreciation, advertising, lease expense and other miscellaneous SG&A expenses.
(b)Access results include $4.2 million of amortization of inventory fair value step-up.
OSHKOSH CORPORATION
NOTES OF CONSOLIDATED FINANCIAL STATEMENTS
| | | | | | | | | | | | | | | | | | | | |
| | Year Ended December 31, 2023 | |
| | Access | | | Vocational | | | Defense(a) | | | Corporate and Other(a) | | | Consolidated | |
Net Sales | | $ | 4,990.0 | | | $ | 2,578.1 | | | $ | 2,001.4 | | | $ | 88.4 | | | $ | 9,657.9 | |
Cost of sales (excluding R&D) | | | 3,885.7 | | | | 2,107.2 | | | | 1,790.7 | | | | 59.9 | | | | 7,843.5 | |
Research and development | | | 68.3 | | | | 36.0 | | | | 14.7 | | | | 14.6 | | | | 133.6 | |
Gross income | | | 1,036.0 | | | | 434.9 | | | | 196.0 | | | | 13.9 | | | | 1,680.8 | |
Employee compensation | | | 158.5 | | | | 109.8 | | | | 63.9 | | | | 155.9 | | | | 488.1 | |
Amortization of purchased intangibles | | | 8.6 | | | | 18.8 | | | | — | | | | 5.4 | | | | 32.8 | |
Intangible asset impairments | | | — | | | | — | | | | — | | | | — | | | | — | |
Other segment items(b) | | | 130.1 | | | | 120.8 | | | | 44.4 | | | | 27.0 | | | | 322.3 | |
Operating income(c) | | | 738.8 | | | | 185.5 | | | | 87.7 | | | | (174.4 | ) | | | 837.6 | |
Interest expense, net of interest income | | | | | | | | | | | | | | | (53.8 | ) |
Miscellaneous, net(d) | | | | | | | | | | | | | | | 13.8 | |
Income before income taxes and losses of unconsolidated affiliates | | | | | | | | | | | | | | $ | 797.6 | |
(a)Results have been reclassified to reflect the move of Pratt Miller from the Defense segment to Corporate and Other.
(b)Includes outside services and consulting, software and information technology, travel, office expenses, depreciation, advertising, lease expense and other miscellaneous SG&A expenses.
(c)Vocational results include a loss of $13.3 million on the sale of the rear-discharge mixer business, acquisition costs of $12.9 million related to the acquisition of AeroTech, $7.1 million of amortization of inventory fair value step-up and restructuring costs of $3.0 million. Defense results include a gain of $8.0 million on the sale of the snow removal apparatus business.
(d)Includes a gain of $4.7 million on the settlement of a claim with the Company's pension advisor.
| | | | | | | | | | | | | | | | | | | | |
| | Year Ended December 31, 2022 | |
| | Access | | | Vocational | | | Defense(a) | | | Corporate and Other(a) | | | Consolidated | |
Net Sales | | $ | 3,972.1 | | | $ | 2,175.7 | | | $ | 2,059.1 | | | $ | 75.1 | | | $ | 8,282.0 | |
Cost of sales (excluding R&D) | | | 3,376.9 | | | | 1,817.2 | | | | 1,872.3 | | | | 47.8 | | | | 7,114.2 | |
Research and development | | | 55.3 | | | | 25.0 | | | | 22.6 | | | | 10.5 | | | | 113.4 | |
Gross income | | | 539.9 | | | | 333.5 | | | | 164.2 | | | | 16.8 | | | | 1,054.4 | |
Employee compensation | | | 127.9 | | | | 87.1 | | | | 55.5 | | | | 123.2 | | | | 393.7 | |
Amortization of purchased intangibles | | | 0.4 | | | | 5.1 | | | | — | | | | 6.1 | | | | 11.6 | |
Intangible asset impairments | | | — | | | | 2.1 | | | | — | | | | 5.6 | | | | 7.7 | |
Other segment items(b) | | | 98.4 | | | | 84.8 | | | | 55.5 | | | | 30.4 | | | | 269.1 | |
Operating income(c) | | | 313.2 | | | | 154.4 | | | | 53.2 | | | | (148.5 | ) | | | 372.3 | |
Interest expense, net of interest income | | | | | | | | | | | | | | | (43.9 | ) |
Miscellaneous, net(d) | | | | | | | | | | | | | | | (52.8 | ) |
Income before income taxes and losses of unconsolidated affiliates | | | | | | | | | | | | | | $ | 275.6 | |
(a)Results have been reclassified to reflect the move of Pratt Miller from the Defense segment to Corporate and Other.
(b)Includes outside services and consulting, software and information technology, travel, office expenses, depreciation, advertising, lease expense and other miscellaneous SG&A expenses.
(c)Access results include expense of $4.6 million to eliminate cumulative translation adjustments for liquidation of foreign entities.
(d)Includes a $33.6 million charge from the settlement of a frozen pension plan.
OSHKOSH CORPORATION
NOTES OF CONSOLIDATED FINANCIAL STATEMENTS
| | | | | | | | | | | | |
| | Year Ended December 31, | |
| | 2024 | | | 2023 | | | 2022 | |
Depreciation and amortization: | | | | | | | | | |
Access | | $ | 66.3 | | | $ | 55.1 | | | $ | 37.4 | |
Vocational | | | 83.1 | | | | 52.2 | | | | 25.3 | |
Defense(a) | | | 25.6 | | | | 29.5 | | | | 22.3 | |
Corporate and Other(a) | | | 25.1 | | | | 23.1 | | | | 22.6 | |
Consolidated | | $ | 200.1 | | | $ | 159.9 | | | $ | 107.6 | |
Capital expenditures(b): | | | | | | | | | |
Access | | $ | 117.0 | | | $ | 112.3 | | | $ | 65.7 | |
Vocational | | | 87.3 | | | | 73.0 | | | | 42.2 | |
Defense(a) | | | 77.1 | | | | 139.4 | | | | 165.6 | |
Corporate and Other(a) | | | 6.9 | | | | 5.2 | | | | 6.2 | |
Consolidated | | $ | 288.3 | | | $ | 329.9 | | | $ | 279.7 | |
(a)Results for 2023 and 2022 have been reclassified to reflect the move of Pratt Miller from the Defense segment to Corporate and Other.
(b)Capital expenditures include both the purchase of property, plant and equipment and equipment held for rental.
The following tables provide long-lived asset by country in which the Company operates. Long-lived assets include property, plant and equipment, deferred contract costs and right of use assets.
| | | | | | | | | | | | | | | | | | | | |
| | December 31, 2024 | |
| | Access | | | Vocational | | | Defense | | | Corporate and Other | | | Total | |
Identifiable assets: | | | | | | | | | | | | | | | |
United States | | $ | 394.8 | | | $ | 371.2 | | | $ | 1,280.4 | | | $ | 118.0 | | | $ | 2,164.4 | |
China | | | 25.3 | | | | — | | | | — | | | | — | | | | 25.3 | |
Netherlands | | | 25.2 | | | | — | | | | — | | | | — | | | | 25.2 | |
Mexico | | | 24.7 | | | | 0.4 | | | | — | | | | — | | | | 25.1 | |
Other | | | 69.5 | | | | 6.8 | | | | 0.1 | | | | — | | | | 76.4 | |
Total | | $ | 539.5 | | | $ | 378.4 | | | $ | 1,280.5 | | | $ | 118.0 | | | $ | 2,316.4 | |
| | | | | | | | | | | | | | | | | | | | |
| | December 31, 2023 | |
| | Access | | | Vocational | | | Defense(a) | | | Corporate and Other(a) | | | Total | |
Identifiable assets: | | | | | | | | | | | | | | | |
United States | | $ | 303.8 | | | $ | 344.5 | | | $ | 1,116.7 | | | $ | 130.3 | | | $ | 1,895.3 | |
China | | | 34.8 | | | | — | | | | — | | | | — | | | | 34.8 | |
Netherlands | | | 27.9 | | | | — | | | | — | | | | — | | | | 27.9 | |
Mexico | | | 30.0 | | | | 0.4 | | | | — | | | | — | | | | 30.4 | |
Other | | | 49.7 | | | | 6.0 | | | | 0.2 | | | | — | | | | 55.9 | |
Total | | $ | 446.2 | | | $ | 350.9 | | | $ | 1,116.9 | | | $ | 130.3 | | | $ | 2,044.3 | |
(a)Results have been reclassified to reflect the move of Pratt Miller from the Defense segment to Corporate and Other.
Total assets by segment are not disclosed as the Company's chief operating decision maker does not use total assets by segment to evaluate segment performance or allocate resources and capital.
OSHKOSH CORPORATION
NOTES OF CONSOLIDATED FINANCIAL STATEMENTS
The following tables present net sales by geographic region based on product shipment destination (in millions):
| | | | | | | | | | | | | | | | | | | | |
| | Year Ended December 31, 2024 | |
| | Access | | | Vocational | | | Defense | | | Corporate and Other | | | Total | |
Net sales: | | | | | | | | | | | | | | | |
United States | | $ | 4,054.1 | | | $ | 2,959.3 | | | $ | 1,896.0 | | | $ | 92.2 | | | $ | 9,001.6 | |
Other North America | | | 251.1 | | | | 215.9 | | | | — | | | | 1.6 | | | | 468.6 | |
Europe, Africa and Middle East | | | 514.8 | | | | 73.5 | | | | 245.1 | | | | 4.0 | | | | 837.4 | |
Rest of the World | | | 344.7 | | | | 61.6 | | | | 14.1 | | | | 2.2 | | | | 422.6 | |
Consolidated | | $ | 5,164.7 | | | $ | 3,310.3 | | | $ | 2,155.2 | | | $ | 100.0 | | | $ | 10,730.2 | |
| | | | | | | | | | | | | | | | | | | | |
| | Year Ended December 31, 2023 | |
| | Access | | | Vocational | | | Defense(a) | | | Corporate and Other(a) | | | Total | |
Net sales: | | | | | | | | | | | | | | | |
United States | | $ | 3,778.6 | | | $ | 2,306.9 | | | $ | 1,657.4 | | | $ | 87.3 | | | $ | 7,830.2 | |
Other North America | | | 189.7 | | | | 195.7 | | | | 0.1 | | | | 1.1 | | | | 386.6 | |
Europe, Africa and Middle East | | | 573.8 | | | | 32.0 | | | | 342.8 | | | | — | | | | 948.6 | |
Rest of the World | | | 447.9 | | | | 43.5 | | | | 1.1 | | | | — | | | | 492.5 | |
Consolidated | | $ | 4,990.0 | | | $ | 2,578.1 | | | $ | 2,001.4 | | | $ | 88.4 | | | $ | 9,657.9 | |
| | | | | | | | | | | | | | | | | | | | |
| | Year Ended December 31, 2022 | |
| | Access | | | Vocational | | | Defense(a) | | | Corporate and Other(a) | | | Total | |
Net sales: | | | | | | | | | | | | | | | |
United States | | $ | 3,160.7 | | | $ | 1,893.7 | | | $ | 1,965.4 | | | $ | 74.9 | | | $ | 7,094.7 | |
Other North America | | | 138.2 | | | | 235.2 | | | | 0.1 | | | | — | | | | 373.5 | |
Europe, Africa and Middle East | | | 353.0 | | | | 9.5 | | | | 92.5 | | | | 0.2 | | | | 455.2 | |
Rest of the World | | | 320.2 | | | | 37.3 | | | | 1.1 | | | | — | | | | 358.6 | |
Consolidated | | $ | 3,972.1 | | | $ | 2,175.7 | | | $ | 2,059.1 | | | $ | 75.1 | | | $ | 8,282.0 | |
(a)Results have been reclassified to reflect the move of Pratt Miller from the Defense segment to Corporate and Other.
The Company derived a significant portion of its revenue from the U.S. Government, as follows (in millions):
| | | | | | | | | | | | |
| | Year Ended December 31, | |
| | 2024 | | | 2023 | | | 2022 | |
DoD | | $ | 1,862.2 | | | $ | 1,664.8 | | | $ | 1,995.8 | |
Foreign military sales | | | 163.0 | | | | 156.6 | | | | 76.2 | |
USPS | | | 103.7 | | | | — | | | | — | |
Total U.S. Government | | $ | 2,128.9 | | | $ | 1,821.4 | | | $ | 2,072.0 | |
No other customer represented more than 10% of sales.
ITEM 9. CHANGES IN AND DISAGREEMENTS WITH ACCOUNTANTS ON ACCOUNTING AND FINANCIAL DISCLOSURE
None.
ITEM 9A. CONTROLS AND PROCEDURES
Evaluation of Disclosure Controls and Procedures. In accordance with Rule 13a-15(b) of the Exchange Act, the Company’s management evaluated, with the participation of the Company’s President and Chief Executive Officer and Executive Vice President and Chief Financial Officer, the effectiveness of the design and operation of the Company’s disclosure controls and procedures (as defined in Rule 13a-15(e) under the Exchange Act) as of December 31, 2024. Based upon their evaluation of these disclosure controls and procedures, the President and Chief Executive Officer and the Executive Vice President and Chief Financial Officer concluded that the disclosure controls and procedures were effective as of December 31, 2024 to ensure that information required to be disclosed by the Company in the reports it files or submits under the Exchange Act is recorded, processed, summarized and reported, within the time period specified in the Securities and Exchange Commission rules and forms, and to ensure that information required to be disclosed by the Company in the reports it files or submits under the Exchange Act is accumulated and communicated to the Company’s management, including its principal executive and principal financial officers, as appropriate, to allow timely decisions regarding required disclosure.
Management’s Report on Internal Control Over Financial Reporting. The Company’s management is responsible for establishing and maintaining adequate internal control over financial reporting, as such term is defined in Rule 13a-15(f) of the Exchange Act. The Company’s internal control over financial reporting is designed to provide reasonable assurance regarding the reliability of financial reporting and the preparation of published financial statements in accordance with generally accepted accounting principles.
The Company’s management, with the participation of the Company’s President and Chief Executive Officer and Executive Vice President and Chief Financial Officer, has assessed the effectiveness of the Company’s internal control over financial reporting based on the framework in Internal Control-Integrated Framework (2013) issued by the Committee of Sponsoring Organizations of the Treadway Commission.
Based on this assessment, the Company’s management has concluded that, as of December 31, 2024, the Company’s internal controls over financial reporting were effective based on that framework.
Because of its inherent limitations, internal control over financial reporting may not prevent or detect misstatements. Also, projections of any evaluation of the effectiveness to future periods are subject to the risk that the controls may become inadequate because of changes in conditions, or that the degree of compliance with the policies or procedures may deteriorate.
Deloitte & Touche LLP, the Company’s independent registered public accounting firm, issued an attestation report on the effectiveness of the Company’s internal control over financial reporting as of December 31, 2024, which is included herein.
Attestation Report of Independent Registered Public Accounting Firm. The attestation report required under this Item 9A is contained in Item 8 of Part II of this Annual Report on Form 10-K under the heading “Report of Independent Registered Public Accounting Firm.”
Changes in Internal Control over Financial Reporting. There were no changes in the Company’s internal control over financial reporting during the quarter ended December 31, 2024, that have materially affected, or are reasonably likely to materially affect, the Company’s internal control over financial reporting.
ITEM 9B. OTHER INFORMATION
(b) During the three months ended December 31, 2024, no director or Section 16 officer of the Company adopted or terminated a “Rule 10b5-1 trading arrangement” or “non-Rule 10b5-1 trading arrangement,” as each term is defined in Item 408(a) of Regulation S-K.
ITEM 9C. DISCLOSURE REGARDING FOREIGN JURISDICTIONS THAT PREVENT INSPECTIONS
Not applicable.
PART III
ITEM 10. DIRECTORS, EXECUTIVE OFFICERS AND CORPORATE GOVERNANCE
The information to be included under the captions “Proposal 1: Election of Directors,” “Governance of the Company — Audit Committee” and “Stock Ownership — Delinquent Section 16(a) Reports”, if applicable, in the Company’s definitive proxy statement for the 2025 annual meeting of shareholders, to be filed with the Securities and Exchange Commission, is hereby incorporated by reference in answer to this item. Reference is also made to the information under the heading “Information about our Executive Officers” included under Part I of this report.
The Company has adopted the Oshkosh Corporation Code of Ethics Applicable to Directors and Senior Executives, including the Company’s President and Chief Executive Officer, the Company’s Executive Vice President and Chief Financial Officer, the Company’s Executive Vice President, Chief Legal and Administrative Officer, the Company’s Senior Vice President Finance and Controller and the Presidents, Vice Presidents of Finance and Controllers of the Company’s business units, or persons holding positions with similar responsibilities at business units, and other officers elected by the Company’s Board of Directors at the vice president level or higher. The Company has posted a copy of the Oshkosh Corporation Code of Ethics Applicable to Directors and Senior Executives on the Company’s website at www.oshkoshcorp.com, and any such Code of Ethics is available in print to any shareholder who requests it from the Company’s Secretary. The Company intends to satisfy the disclosure requirements under Item 10 of Form 10-K regarding amendments to, or waivers from, the Oshkosh Corporation Code of Ethics Applicable to Directors and Senior Executives by posting such information on its website at www.oshkoshcorp.com.
The Company is not including the information contained on its website as part of, or incorporating it by reference into, this report.
The Company has adopted a comprehensive insider trading policy governing the purchase, sale and other dispositions of its securities by the Company and its directors, officers, employees, and other designated individuals, which is reasonably designed to promote compliance with all applicable insider trading laws, rules and regulations and NYSE listing standards. A copy of this policy is filed as Exhibit 19 to this Annual Report on Form 10-K.
ITEM 11. EXECUTIVE COMPENSATION
The information to be included under the captions “Compensation Discussion and Analysis,” “Compensation Tables,” “Compensation Agreements” and “Director Compensation” contained in the Company’s definitive proxy statement for the 2025 annual meeting of shareholders, to be filed with the Securities and Exchange Commission, is hereby incorporated by reference in answer to this item.
ITEM 12. SECURITY OWNERSHIP OF CERTAIN BENEFICIAL OWNERS AND MANAGEMENT AND RELATED STOCKHOLDER MATTERS
The information to be included under the caption “Stock Ownership — Stock Ownership of Directors, Executive Officers and Other Large Shareholders” in the Company’s definitive proxy statement for the 2025 annual meeting of shareholders, to be filed with the Securities and Exchange Commission, is hereby incorporated by reference in answer to this item.
Equity Compensation Plan Information
The following table provides information about the Company’s equity compensation plans as of December 31, 2024.
| | | | | | | | | | | | |
Plan Category | | Number of Securities to be Issued Upon Exercise of Outstanding Options, Warrants and Rights(1) | | | Weighted-Average Exercise Price of Outstanding Options, Warrants and Rights | | | Number of Securities Remaining Available for Future Issuance Under Equity Compensation Plans (Excluding Securities Reflected in First Column) | |
Equity compensation plans approved by security holders | | | 1,042,100 | | | $ | 82.23 | | | | 2,613,360 | |
Equity compensation plans not approved by security holders | | | — | | | | — | | | | — | |
| | | 1,042,100 | | | $ | 82.23 | | | | 2,613,360 | |
(1)Represents stock awards (including shares and units), performance share awards and options to purchase shares of the Company’s Common Stock granted under the 2024 and 2017 Incentive Stock and Award Plans, which were approved by the Company’s shareholders.
ITEM 13. CERTAIN RELATIONSHIPS AND RELATED TRANSACTIONS AND DIRECTOR INDEPENDENCE
The information to be included under the caption “Governance of the Company — Board of Directors Independence,” “Governance of the Company — Audit Committee,” “Governance of the Company — Governance Committee,” “Governance of the Company — Human Resources Committee” and “Governance of the Company — Policies and Procedures Regarding Related Person Transactions” in the Company’s definitive proxy statement for the 2025 annual meeting of shareholders, to be filed with the Securities and Exchange Commission, is hereby incorporated by reference in answer to this item.
ITEM 14. PRINCIPAL ACCOUNTANT FEES AND SERVICES
The information to be included under the caption “Proposal 2: Ratification of the Appointment of Independent Auditor for Year Ending December 31, 2025 — Audit and Non-Audit Fees” in the Company’s definitive proxy statement for the 2025 annual meeting of shareholders, to be filed with the Securities and Exchange Commission, is hereby incorporated by reference in answer to this item.
PART IV
ITEM 15. EXHIBITS AND FINANCIAL STATEMENT SCHEDULES
(a)
1. Financial Statements:
The following consolidated financial statements of the Company and the report of the Independent Registered Public Accounting Firm included in the Annual Report to Shareholders for the year ended December 31, 2024, are contained in Item 8:
|
Report of Deloitte & Touche LLP, Independent Registered Public Accounting Firm |
Consolidated Statements of Income for the years ended December 31, 2024, 2023 and 2022. |
Consolidated Statements of Comprehensive Income for the years ended December 31, 2024, 2023 and 2022 |
Consolidated Balance Sheets at December 31, 2024 and 2023 |
Consolidated Statements of Shareholders’ Equity for the years ended December 31, 2024, 2023 and 2022 |
Consolidated Statements of Cash Flows for the years ended December 31, 2024, 2023 and 2022 |
Notes to Consolidated Financial Statements |
2. Financial Statement Schedules:
All schedules are omitted because they are not applicable, or the required information is included in the consolidated financial statements or notes thereto.
3. Exhibits:
The exhibits listed in the following Exhibit Index are filed as part of this Annual Report on Form 10-K. Each management contract or compensatory plan or arrangement required to be filed as an exhibit to this report is identified in the Exhibit Index by an asterisk following the Exhibit Number.
EXHIBIT INDEX
| |
3.1 | Articles of Incorporation of Oshkosh Corporation (incorporated by reference to Exhibit 3.1 to the Company’s Current Report on Form 8-K dated June 30, 2014 (File No. 1-31371)). |
| |
3.2 | By-Laws of Oshkosh Corporation, as amended July 22, 2024. |
| |
4.1 | Third Amended and Restated Credit Agreement, dated March 23, 2022, among Oshkosh Corporation, various subsidiaries of Oshkosh Corporation party thereto as borrowers and various lenders and agents party thereto (incorporated by reference to Exhibit 4.1 the Company’s Current Report on Form 8-K dated March 24, 2022 (File No. 1-31371)). |
| |
4.2 | Second Amendment to Third Amended and Restated Credit Agreement and Revolving Credit Facility Increase Agreement, dated as of April 3, 2024, among Oshkosh Corporation, the various lenders party thereto, and Bank of America, N.A., as administrative agent (incorporated by reference to Exhibit 4.1 to the Company’s Current Report on Form 8-K dated April 3, 2024 (File No. 1-31371)). |
| |
4.3 | Indenture, dated as of May 17, 2018, between Oshkosh Corporation and Computershare Trust Company, National Association, as trustee (as successor to Wells Fargo Bank, National Association) (incorporated by reference to the Exhibit 4.1 to the Company’s Current Report on Form 8-K dated May 21, 2018 (File No. 1-31371)). |
| |
| |
4.4 | Supplemental Indenture, dated May 17, 2018, between Oshkosh Corporation and Computershare Trust Company, National Association, as trustee (as successor to Wells Fargo Bank, National Association) (incorporated by reference to Exhibit 4.2 to the Company’s Current Report on Form 8-K, dated May 21, 2018 (File No. 1-31371)). |
4.5 | Second Supplemental Indenture, dated February 26, 2020, between Oshkosh Corporation and Computershare Trust Company, National Association, as trustee (as successor to Wells Fargo Bank, National Association) (incorporated by reference to Exhibit 4.2 to the Company’s Current Report on Form 8-K dated February 26, 2020 (File No. 1-31371)). |
| |
4.6 | Description of Registrants Securities (incorporated by reference to Exhibit 4.7 to the Company’s Annual Report on Form 10-K for the fiscal year ended September 30, 2019 (File No. 1-31371)). |
| |
10.1 | Oshkosh Corporation Executive Retirement Plan, amended and restated effective December 31, 2008 (incorporated by reference to Exhibit 10.7 to the Company’s Annual Report on Form 10-K for the year ended September 30, 2008 (File No. 1-31371)).* |
| |
10.2 | Form of Key Executive Employment and Severance Agreement between Oshkosh Corporation and each of Timothy S. Bleck, Bryan K. Brandt, Ignacio A. Cortina, Matthew A. Field, Jayanthi Iyengar, Anupam Khare, Mahesh Narang, Michael E. Pack, and John C. Pfeifer, (each of the persons identified has signed this form or a substantially similar form) (incorporated by reference to Exhibit 10.3 to the Company’s Quarterly Report on Form 10-Q for the quarter ended March 31, 2011 (File No. 1-31371)).* |
| |
10.3 | Summary of Cash Compensation for Non-Employee Directors.* |
| |
10.4 | Oshkosh Corporation Deferred Compensation Plan for Directors and Executive Officers (incorporated by reference to Exhibit 10.2 to the Company’s Quarterly Report on Form 10-Q for the quarter ended March 31, 2008 (File No. 1-31371)).* |
| |
10.5 | Oshkosh Corporation KEESA Rabbi Trust Agreement, dated as of January 31, 2013, between Oshkosh Corporation and Wells Fargo Bank, National Association, as Trustee (incorporated by reference to Exhibit 10.1 to the Company’s Quarterly Report on Form 10-Q for the quarter ended March 31, 2013 (File No. 1-31371)).* |
| |
10.6 | Oshkosh Corporation Supplemental Retirement Plans Rabbi Trust Agreement, dated as of January 31, 2013, between Oshkosh Corporation and Wells Fargo Bank, National Association, as Trustee (incorporated by reference to Exhibit 10.2 to the Company’s Quarterly Report on Form 10-Q for the quarter ended March 31, 2013 (File No. 1-31371)).* |
| |
10.7 | Oshkosh Corporation Defined Contribution Executive Retirement Plan, as amended and restated effective June 1, 2014 (incorporated by reference to Exhibit 10.1 to the Company’s Quarterly Report on Form 10-Q for the quarter ended June 30, 2014 (File No. 1-31371)).* |
| |
10.8 | Oshkosh Corporation 2017 Incentive Stock and Awards Plan (incorporated by reference to Attachment B to Oshkosh Corporation’s definitive proxy statement on Schedule 14A for the Oshkosh Corporation Annual Meeting of Shareholders held on February 7, 2017 (File No. 1-31371)).* |
| |
10.9 | Framework for Awards of Performance Share based on Total Shareholder Return under the Oshkosh Corporation 2017 Incentive Stock and Awards Plan (incorporated by reference to Exhibit 10.27 to the Company’s Annual Report on Form 10-K for the year ended September 30, 2017 (File No. 1-31371)).* |
| |
10.10 | Framework for Awards of Performance Shares based on Return on Invested Capital under the Oshkosh Corporation 2017 Incentive Stock Awards Plan (incorporated by reference to Exhibit 10.3 to the Company’s Quarterly Report on Form 10-Q for the quarter ended March 31, 2022 (File No. 1-31371)).* |
| |
| |
10.11 | Form of Oshkosh Corporation 2017 Incentive Stock and Awards Plan Stock Options Award Agreement (incorporated by reference to Exhibit 10.29 to the Company’s Annual Report on Form 10-K for the year ended September 30, 2017 (File No. 1-31371)).* |
| |
10.12 | Form of Oshkosh Corporation 2017 Incentive Stock and Awards Plan Stock Appreciation Rights Award Agreement (incorporated by reference to Exhibit 10.30 to the Company’s Annual Report on Form 10-K for the year ended September 30, 2017 (File No. 1-31371)).* |
| |
10.13 | Form of Oshkosh Corporation 2017 Incentive Stock and Awards Plan Restricted Stock Unit Award Agreements (Retirement Vesting) (incorporated by reference to Exhibit 10.31 to the Company’s Annual Report on Form 10-K for the year ended September 30, 2017 (File No. 1-31371)).* |
| |
10.14 | Form of Oshkosh Corporation 2017 Incentive Stock and Awards Plan Restricted Stock Unit Award Agreement (International) (incorporated by reference to Exhibit 10.32 to the Company’s Annual Report on Form 10-K for the year ended September 30, 2017 (File No. 1-31371)).* |
| |
10.15 | Form of Oshkosh Corporation 2017 Incentive Stock and Awards Plan Restricted Stock Unit Award Agreement (Stock Settled on Vesting - General) (incorporated by reference to Exhibit 10.33 to the Company’s Annual Report on Form 10-K for the year ended September 30, 2017 (File No. 1-31371)).* |
| |
10.16 | Framework for Awards of Performance Shares based on ESG/DEI under the Oshkosh Corporation 2017 Incentive Stock Awards Plan (incorporated by reference to Exhibit 10.2 to the Company’s Quarterly Report on Form 10-Q for the quarter ended March 31, 2022 (File No. 1-31371)).* |
| |
10.17 | Severance Agreement between Oshkosh Corporation and John P. Pfeifer dated April 2, 2021 (incorporated by reference to Exhibit 10.2 to the Company’s Quarterly Report on Form 10-Q for the quarter ended June 30, 2023).* |
| |
10.18 | Oshkosh Corporation Severance Policy (which currently applies to all of the Company’s executive officers other than Mr. Pfeifer as eligible) (incorporated by reference to Exhibit 10.3 to the Company’s Quarterly Report on Form 10-Q for the quarter ended June 30, 2023).* |
| |
10.19 | Oshkosh Corporation 2024 Incentive Stock and Awards Plan (incorporated by reference to Exhibit A to Oshkosh Corporation’s definitive proxy statement on Schedule 14A for the Oshkosh Corporation Annual Meeting of Shareholders held on May 7, 2024 (File No. 1-31371)).* |
| |
10.20 | Framework for Awards of Performance Share based on Total Shareholder Return under the Oshkosh Corporation 2024 Incentive Stock and Awards Plan.* |
| |
10.21 | Framework for Awards of Performance Shares based on Return on Invested Capital under the Oshkosh Corporation 2024 Incentive Stock Awards Plan.* |
| |
10.22 | Form of Oshkosh Corporation 2024 Incentive Stock and Awards Plan Restricted Stock Unit Award Agreements (Retirement Vesting).* |
| |
10.23 | Form of Oshkosh Corporation 2024 Incentive Stock and Awards Plan Restricted Stock Unit Award Agreement (International).* |
| |
10.24 | Form of Oshkosh Corporation 2024 Incentive Stock and Awards Plan Restricted Stock Unit Award Agreement (Stock Settled on Vesting - General).* |
| |
19 | Oshkosh Corporation Insider Trading and Confidentiality Notice. |
| |
| |
21 | Subsidiaries of Registrant. |
| |
23 | Consent of Deloitte & Touche LLP. |
| |
31.1 | Certification by the President and Chief Executive Officer, pursuant to Section 302 of the Sarbanes-Oxley Act, dated February 20, 2025. |
| |
31.2 | Certification by the Executive Vice President and Chief Financial Officer, pursuant to Section 302 of the Sarbanes-Oxley Act, dated February 20, 2025. |
| |
32.1 | Written Statement of the President and Chief Executive Officer, pursuant to 18 U.S.C. ss. 1350, dated February 20, 2025. |
| |
32.2 | Written Statement of the Executive Vice President and Chief Financial Officer, pursuant to 18 U.S.C. ss. 1350, dated February 20, 2025. |
| |
97 | Oshkosh Corporation Recovery Policy (incorporated by reference to Exhibit 97 to the Company’s Annual Report on Form 10-K for the year ended December 31, 2023 (File No. 1-31371)). |
| |
101.INS | The instance document does not appear in the interactive data file because its XBRL (Extensible Business Reporting Language) tags are embedded within the Inline XBRL document. |
| |
101.SCH | Inline XBRL Taxonomy Extension Schema Document. |
101.CAL | Inline XBRL Taxonomy Extension Calculations Linkbase Document. |
101.DEF | Inline XBRL Taxonomy Extension Definitions Linkbase Document. |
101.LAB | Inline XBRL Taxonomy Extension Label Linkbase Document. |
101.PRE | Inline XBRL Taxonomy Extension Presentations Linkbase Document. |
104 | Cover Page Interactive Data File (embedded within the Inline XBRL document). |
| |
* Denotes a management contract or compensatory plan or arrangement.
ITEM 16. FORM 10-K SUMMARY
None.
SIGNATURES
Pursuant to the requirements of Section 13 or 15(d) of the Securities Exchange Act of 1934, the registrant has duly caused this report to be signed on its behalf by the undersigned, thereunto duly authorized.
| | |
| | OSHKOSH CORPORATION |
| | |
February 20, 2025 | By | /s/ John C. Pfeifer |
| | John C. Pfeifer, President and Chief Executive Officer |
Pursuant to the requirements of the Securities Exchange Act of 1934, this report has been signed below by the following persons on behalf of the registrant and in the capacities on the dates indicated.
| | |
| | |
February 20, 2025 | By | /s/ John C. Pfeifer |
|
| John C. Pfeifer, President, Chief Executive Officer and Director (Principal Executive Officer) |
|
|
|
February 20, 2025 | By | /s/ Matthew A. Field |
|
| Matthew A. Field, Executive Vice President and Chief Financial Officer (Principal Financial Officer) |
|
|
|
February 20, 2025 | By | /s/ James C. Freeders |
|
| James C. Freeders, Senior Vice President Finance and Controller (Principal Accounting Officer) |
|
|
|
February 20, 2025 | By | /s/ Keith J. Allman |
|
| Keith J. Allman, Director |
| | |
February 20, 2025 | By | /s/ William J. Burns |
| | William J. Burns, Director |
| | |
February 20, 2025 | By | /s/ Annette K. Clayton |
| | Annette K. Clayton, Director |
|
|
|
February 20, 2025 | By | /s/ Douglas L. Davis |
|
| Douglas L. Davis, Director |
| | |
February 20, 2025 | By | /s/ Tyrone M. Jordan |
|
| Tyrone M. Jordan, Director |
|
|
|
February 20, 2025 | By | /s/ Kimberley Metcalf-Kupres |
|
| Kimberley Metcalf-Kupres, Director |
|
|
|
February 20, 2025 | By | /s/ Stephen D. Newlin |
|
| Stephen D. Newlin, Chairman of Board |
|
|
|
February 20, 2025 | By | /s/ Duncan J. Palmer |
|
| Duncan J. Palmer, Director |
|
|
|
February 20, 2025 | By | /s/ David G. Perkins |
|
| David G. Perkins, Director |
| | |
February 20, 2025 | By | /s/ Sandra E. Rowland |
| | Sandra E. Rowland, Director |