UNITED STATES
SECURITIES AND EXCHANGE COMMISSION
Washington, D.C. 20549
FORM N-CSR
CERTIFIED SHAREHOLDER REPORT OF REGISTERED
MANAGEMENT INVESTMENT COMPANIES
Investment Company Act file number 811-4395
Legg Mason Partners Municipal Funds
(Exact name of registrant as specified in charter)
| | |
| 125 Broad Street, New York, NY | | 10004 |
|
| (Address of principal executive offices) | | (Zip code) |
Robert I. Frenkel, Esq.
Legg Mason & Co., LLC
300 First Stamford Place, 4th Fl.
Stamford, CT 06902
(Name and address of agent for service)
Registrant’s telephone number, including area code: (800) 451-2010
Date of fiscal year end: March 31
Date of reporting period: March 31, 2006
| ITEM 1. | REPORT TO STOCKHOLDERS. |
The Annual Report to Stockholders is filed herewith.
[INSERT SHAREHOLDER REPORT]
ANNUAL REPORT
MARCH 31, 2006

Legg Mason Partners Municipal Funds
Legg Mason Partners Limited Term Municipals Fund
INVESTMENT PRODUCTS: NOT FDIC INSURED • NO BANK GUARANTEE • MAY LOSE VALUE
Legg Mason Partners
Municipal Funds
Legg Mason Partners
Limited Term Municipals Fund
Annual Report • March 31, 2006
What’s
Inside
Fund Objective
The Fund seeks to pay its shareholders as high a level of income exempt from regular federal income tax* as is consistent with prudent investing.
* Certain investors may be subject to the Federal Alternative Minimum Tax, and state and local taxes may apply. Capital gains, if any, are fully taxable. Please consult your personal tax adviser.
“Smith Barney” and Salomon Brothers” are service marks of Citigroup, licensed for use by Legg Mason as the names of funds and investment advisers, Legg Mason and its affiliates, as well as the Fund’s investment manager, are not affiliated with Citigroup.
Letter from the Chairman

R. Jay Gerken, CFA
Chairman, President and Chief Executive Officer
Dear Shareholder,
Despite a temporary setback at the end of 2005, the U.S. economy was strong during the reporting period. After advancing 3.3% and 4.1% in the second and third quarters of 2005, respectively, fourth quarter gross domestic product (“GDP”)i growth slipped to 1.7%. This marked the first quarter in which GDP growth did not surpass 3.0% since the first three months of 2003. However, as expected, the economy rebounded sharply in the first quarter of 2006, with a preliminary estimate of 4.8% GDP growth. The economic turnaround was prompted by both strong consumer and business spending. In addition, the U.S. Labor Department reported that unemployment hit a five-year low in March.
As expected, the Federal Reserve Board (“Fed”)ii continued to raise interest rates during the reporting period. Despite the changing of the guard from Fed Chairman Alan Greenspan to Ben Bernanke in early 2006, it was “business as usual” for the Fed, as it raised short-term interest rates eight times during the period. Since it began its tightening campaign in June 2004, the Fed has raised rates 15 consecutive times, bringing the federal funds rateiii from 1.00% to 4.75% — its highest level since April 2001. After the end of the Fund’s reporting period, at its May meeting, the Fed once again raised the federal funds rate by an additional 0.25% to 5.00%.
As expected, both short- and long-term yields rose over the reporting period. During the one-year period ended March 31, 2006, two-year Treasury yields increased from 3.75% to 4.82%. Over the same period, 10-year Treasury yields moved from 4.46% to 4.86%. During most of the last three months of the reporting period the yield curve was inverted, with the yield on two-year Treasuries surpassing that of 10-year Treasuries. This anomaly has historically foreshadowed an economic slowdown or recession. However, some experts, including new
Legg Mason Partners Limited Term Municipals Fund I
Chairman Bernanke, believe the inverted yield curve is largely a function of strong foreign demand for longer-term bonds. Looking at the municipal market, yields of both short- and longer-term securities also rose over the reporting period. However, unlike the Treasury yield curve, the municipal bond curve retained a positive slope.
Please read on for a more detailed look at prevailing economic and market conditions during the Fund’s fiscal year and to learn how those conditions have affected Fund performance.
Special Shareholder Notice
On December 1, 2005, Citigroup Inc. (“Citigroup”) completed the sale of substantially all of its asset management business to Legg Mason, Inc. (“Legg Mason”). As a result, the Fund’s investment adviser (the “Manager”), previously an indirect wholly-owned subsidiary of Citigroup, has become a wholly-owned subsidiary of Legg Mason. Completion of the sale caused the Fund’s then existing investment management contract to terminate. The Fund’s shareholders previously approved a new investment management contract between the Fund and the Manager, which became effective on December 1, 2005.
Information About Your Fund
As you may be aware, several issues in the mutual fund industry have come under the scrutiny of federal and state regulators. The Fund’s Manager and some of its affiliates have received requests for information from various government regulators regarding market timing, late trading, fees, and other mutual fund issues in connection with various investigations. The regulators appear to be examining, among other things, the Fund’s response to market timing and shareholder exchange activity, including compliance with prospectus disclosure related to these subjects. The Fund has been informed that the Manager and its affiliates are responding to those information requests, but are not in a position to predict the outcome of these requests and investigations.
II Legg Mason Partners Limited Term Municipals Fund
Important information concerning the Fund and its Manager with regard to recent regulatory developments is contained in the Notes to Financial Statements included in this report.
As always, thank you for your confidence in our stewardship of your assets. We look forward to helping you continue to meet your financial goals.
Sincerely,

R. Jay Gerken, CFA
Chairman, President and Chief Executive Officer
May 10, 2006
| i | | Gross domestic product is a market value of goods and services produced by labor and property in a given country. |
| ii | | The Federal Reserve Board is responsible for the formulation of a policy designed to promote economic growth, full employment, stable prices, and a sustainable pattern of international trade and payments. |
| iii | | The federal funds rate is the interest rate that banks with excess reserves at a Federal Reserve district bank charge other banks that need overnight loans. |
Legg Mason Partners Limited Term Municipals Fund III
Manager Overview
| | | | |
 | |  | | JOSEPH P. DEANE (left)
Vice President and Investment Officer DAVID T. FARE (right)
Vice President and Investment Officer |
Special Shareholder Notices
Effective January 3, 2006, the Board has appointed Joseph P. Deane and David T. Fare as Co-Portfolio Managers of the Fund. Messrs. Deane and Fare have been elected Vice Presidents and Investment Officers of the Fund.
Prior to April 7, 2006, the Fund operated under the name Smith Barney Muni Funds-Limited Term Portfolio. The Fund’s investment strategy and objective have not changed.
Q. What were the overall market conditions during the Fund’s reporting period?
A. Despite a variety of significant headwinds, the municipal bond market generated positive returns during the one-year period ended March 31, 2006 and outperformed the overall taxable bond market. Over that period, the Lehman Brothers Municipal Bond Indexi gained 3.81%, while the Lehman Brothers U.S. Aggregate Indexii rose 2.26%.
Over the last year, the bond market has been impacted by a strong economy, numerous inflationary pressures, and continued rate hikes by the Federal Reserve Board (“Fed”)iii. To gain some perspective on how far we’ve come in terms of interest rates, consider the following. In May 2004, a barometer of short-term interest rates, in this case the federal funds rate,iv was a mere 1.00%, its lowest level in more than 40 years. This was due, in part, to the Fed’s attempt to stimulate the economy in the aftermath of September 11th.
Then, in June 2004, the economy appeared to be on solid footing and the Fed officially ended its accommodative monetary policy by instituting its first rate hike in four years, bringing the federal funds rate from 1.00% to 1.25%. At that time, the Fed telegraphed what it had in mind for short-term rates as it said, “policy accommodation can be removed at a pace that is likely to be measured.” The Fed certainly has been true to its word, as it has now instituted 15 straight 0.25% rate hikes through the end of March 2006 and the federal funds rate now stands at 4.75%. After the end of the Fund’s reporting period, at its May meeting, the Fed once again raised the federal funds rate by an additional 0.25% to 5.00%.
Given the solid economy and rising rate environment, both short- and long-term Treasury yields rose over the reporting period. During the one-year period ended March 31, 2006, two-year Treasury yields increased from 3.75% to 4.82%. Over the same period,
Legg Mason Partners Limited Term Municipals Fund 2006 Annual Report 1
10-year Treasury yields moved from 4.46% to 4.86%. During the reporting period, both short- and longer-term municipal yields also rose, albeit to a lesser extent than equal durationv Treasuries. This, coupled with improving balance sheets in many states, helped municipal securities to outperform taxable bonds over the last year.vi
Performance Review
For the 12 months ended March 31, 2006, Class A shares of the Legg Mason Partners Limited Term Municipals Fund, excluding sales charges, returned 2.78%. These shares outperformed the Fund’s Lipper Intermediate Municipal Debt Funds Category Average1, which increased 2.45% over the same time frame. The Fund’s unmanaged benchmark, the Lehman Brothers Municipal Bond Index, returned 3.81% for the same period.
Certain investors may be subject to the federal Alternative Minimum Tax, and state and local taxes will apply. Capital gains, if any, are fully taxable. Please consult your personal tax or legal adviser.
| | | | |
| Performance Snapshot as of March 31, 2006 (excluding sales charges) (unaudited) |
| | |
| | | 6 Months | | 12 Months |
Legg Mason Partners Limited Term Municipals Fund — Class A Shares | | 1.61% | | 2.78% |
|
Lehman Brothers Municipal Bond Index | | 0.98% | | 3.81% |
|
Lipper Intermediate Municipal Debt Funds Category Average | | 0.45% | | 2.45% |
|
| The performance shown represents past performance. Past performance is no guarantee of future results and current performance may be higher or lower than the performance shown above. Principal value and investment returns will fluctuate and investors’ shares, when redeemed, may be worth more or less than their original cost. To obtain performance data current to the most recent month-end, please visit our website at www.leggmason.com/InvestorServices. |
| Performance figures reflect reimbursements and/or fee waivers, without which the performance would have been lower. |
| All share class returns assume the reinvestment of all distributions, including returns of capital, if any, at net asset value and the deduction of all Fund expenses. Returns have not been adjusted to include sales charges that may apply when shares are purchased or the deduction of taxes that a shareholder would pay on Fund distributions. Excluding sales charges, Class B shares returned 1.33%, Class C shares returned 1.29% and Class O shares returned 1.49% over the six months ended March 31, 2006. Excluding sales charges, Class B shares returned 2.24%, Class C shares returned 2.15% and Class O shares returned 2.69% over the 12 months ended March 31, 2006. |
| Lipper, Inc. is a major independent mutual-fund tracking organization. Returns are based on the period ended March 31, 2006, including the reinvestment of distributions, including returns of capital, if any, calculated among the 155 funds for the six-month period and among the 150 funds for the 12-month period in the Fund’s Lipper category and excluding sales charges. |
| 1 | | Lipper, Inc. is a major independent mutual-fund tracking organization. Returns are based on the 12-month period ended March 31, 2006, including the reinvestment of distributions, including returns of capital, if any, calculated among the 150 funds in the Fund’s Lipper category, and excluding sales charges. |
2 Legg Mason Partners Limited Term Municipals Fund 2006 Annual Report
Q. What were the most significant factors affecting Fund performance?
What were the leading contributors to performance?
A. Given the rising interest rate environment and expectations for further Fed tightening during the reporting period, we maintained a defensive approach in terms of the Fund’s maturity. As such, the Fund’s duration was generally shorter than its benchmark index. This proved to be beneficial, as bond prices generally fall when interest rates rise. In addition, we were able to use the proceeds from our securities that matured and reinvest that money into municipal bonds offering higher coupons.
Throughout the reporting period, we also emphasized a well-diversified portfolio, with holdings from a diverse array of market segments that we believed had favorable risk/reward characteristics.
What were the leading detractors from performance?
A. During the reporting period, we continued to maintain a high quality portfolio. This was somewhat a drag on returns, as lower-rated, more speculative municipals generated better results over the period. However, given the prevailing market environment and the Fund’s investment objective, we believed a higher quality approach was appropriate.
Q. Were there any significant changes to the Fund during the reporting period?
A. There were no significant changes during the reporting period as we maintained a high quality portfolio for the Fund and it was defensively positioned.
Thank you for your investment in the Legg Mason Partners Limited Term Municipals Fund. As ever, we appreciate that you have chosen us to manage your assets and we remain focused on achieving the Fund’s investment goals.
Sincerely,
| | |
 | |  |
| Joseph P. Deane | | David T. Fare |
Vice President and
Investment Officer | | Vice President and
Investment Officer |
May 10, 2006
Legg Mason Partners Limited Term Municipals Fund 2006 Annual Report 3
The information provided is not intended to be a forecast of future events, a guarantee of future results or investment advice. Views expressed may differ from those of the firm as a whole.
RISKS: Keep in mind that the Fund’s investments are subject to interest rate and credit risks. As interest rates rise, bond prices fall, reducing the value of the Fund’s share price. The Fund may use derivatives, such as options and futures, which can be illiquid, may disproportionately increase losses, and have a potentially large impact on fund performance. Please see the Fund’s prospectus for more information on these and other risks.
All index performance reflects no deduction for fees, expenses or taxes. Please note an investor cannot invest directly in an index.
| i | | The Lehman Brothers Municipal Bond Index is a broad measure of the municipal bond market with maturities of at least one year. |
| ii | | The Lehman Brothers U.S. Aggregate Index is a broad-based bond index comprised of government, corporate, mortgage and asset-backed issues, rated investment grade or higher, and having at least one year to maturity. |
| iii | | The Federal Reserve Board is responsible for the formulation of a policy designed to promote economic growth, full employment, stable prices, and a sustainable pattern of international trade and payments. |
| iv | | The federal funds rate is the interest rate that banks with excess reserves at a Federal Reserve district bank charge other banks that need overnight loans. |
| v | | Duration is a common gauge of the price sensitivity of a fixed income asset or portfolio to a change in interest rates. |
| vi | | Source: Edwards, Chris. Busting the State Tax-Revenue Boom, Nationalreview.com, February 1, 2006. Please note that this is not a complete discussion of all differences between the investments being shown. An investor should consider all risks and differences between these investments before choosing to invest in any one. U.S. Treasury notes are backed by the full faith and credit of the United States government and offer a return of principal value if held to maturity. |
4 Legg Mason Partners Limited Term Municipals Fund 2006 Annual Report
Fund at a Glance (unaudited)
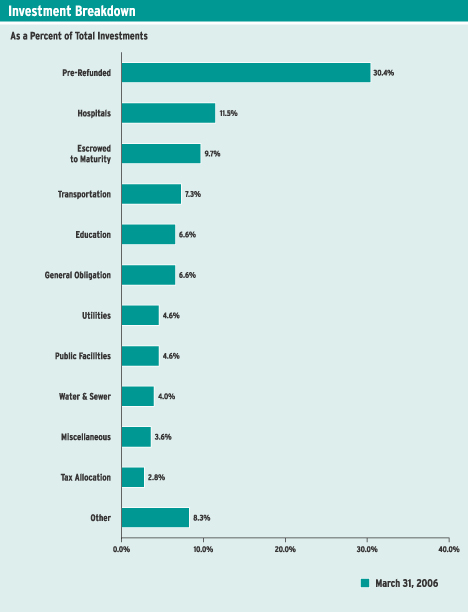
Legg Mason Partners Limited Term Municipals Fund 2006 Annual Report 5
Fund Expenses (unaudited)
Example
As a shareholder of the Fund, you may incur two types of costs: (1) transaction costs, including front-end and back-end sales charges (loads) on purchase payments; and (2) ongoing costs, including management fees; distribution and/or service (12b-1) fees; and other Fund expenses. This example is intended to help you understand your ongoing costs (in dollars) of investing in the Fund and to compare these costs with the ongoing costs of investing in other mutual funds.
This example is based on an investment of $1,000 invested on October 1, 2005 and held for the six months ended March 31, 2006.
Actual Expenses
The table below titled “Based on Actual Total Return” provides information about actual account values and actual expenses. You may use the information provided in this table, together with the amount you invested, to estimate the expenses that you paid over the period. To estimate the expenses you paid on your account, divide your ending account value by $1,000 (for example, an $8,600 ending account value divided by $1,000 = 8.6), then multiply the result by the number under the heading entitled “Expenses Paid During the Period”.
| | | | | | | | | | | | | | | |
| Based on Actual Total Return(1) | | | | | | | | | |
| | | | | |
| | | Actual Total Return Without Sales Charges(2) | | | Beginning
Account
Value | | Ending Account
Value | | Annualized
Expense
Ratio | | | Expenses Paid During the Period(3) |
Class A | | 1.61 | % | | $ | 1,000.00 | | $ | 1,016.10 | | 0.69 | % | | $ | 3.47 |
|
Class B | | 1.33 | | | | 1,000.00 | | | 1,013.30 | | 1.24 | | | | 6.22 |
|
Class C | | 1.29 | | | | 1,000.00 | | | 1,012.90 | | 1.32 | | | | 6.62 |
|
Class O | | 1.49 | | | | 1,000.00 | | | 1,014.90 | | 0.91 | | | | 4.57 |
|
| (1) | | For the six months ended March 31, 2006. |
| (2) | | Assumes reinvestment of all distributions, including returns of capital, if any, at net asset value and does not reflect the deduction of the applicable sales charge with respect to Class A shares or the applicable contingent deferred sales charges (“CDSC”) with respect to Class B and O shares. Total return is not annualized, as it may not be representative of the total return for the year. Performance figures reflect voluntary fee waivers and/or expense reimbursements. Past performance is no guarantee of future results. In the absence of voluntary fee waivers and/or expense reimbursements, the total return would have been lower. |
| (3) | | Expenses (net of voluntary fee waivers and/or expense reimbursements) are equal to each class’ respective annualized expense ratio multiplied by the average account value over the period, multiplied by the number of days in the most recent fiscal half-year, then divided by 365. |
6 Legg Mason Partners Limited Term Municipals Fund 2006 Annual Report
Fund Expenses (unaudited) (continued)
Hypothetical Example for Comparison Purposes
The table below titled “Based on Hypothetical Total Return” provides information about hypothetical account values and hypothetical expenses based on the actual expense ratio and an assumed rate of return of 5.00% per year before expenses, which is not the Fund’s actual return. The hypothetical account values and expenses may not be used to estimate the actual ending account balance or expenses you paid for the period. You may use the information provided in this table to compare the ongoing costs of investing in the Fund and other funds. To do so, compare the 5.00% hypothetical example relating to the Fund with the 5.00% hypothetical examples that appear in the shareholder reports of the other funds.
Please note that the expenses shown in the table below are meant to highlight your ongoing costs only and do not reflect any transactional costs, such as front-end or back-end sales charges (loads). Therefore, the table is useful in comparing ongoing costs only, and will not help you determine the relative total costs of owning different funds. In addition, if these transaction costs were included, your costs would have been higher.
| | | | | | | | | | | | | | | |
| Based on Hypothetical Total Return(1) | | | | | | | | | |
| | | | | |
| | | Hypothetical
Annualized
Total Return | | | Beginning
Account
Value | | Ending
Account
Value | | Annualized
Expense
Ratio | | | Expenses Paid During the Period(2) |
Class A | | 5.00 | % | | $ | 1,000.00 | | $ | 1,021.49 | | 0.69 | % | | $ | 3.48 |
|
Class B | | 5.00 | | | | 1,000.00 | | | 1,018.75 | | 1.24 | | | | 6.24 |
|
Class C | | 5.00 | | | | 1,000.00 | | | 1,018.35 | | 1.32 | | | | 6.64 |
|
Class O | | 5.00 | | | | 1,000.00 | | | 1,020.39 | | 0.91 | | | | 4.58 |
|
| (1) | | For the six months ended March 31, 2006. |
| (2) | | Expenses (net of voluntary fee waivers and/or expense reimbursements) are equal to each class’ respective annualized expense ratio multiplied by the average account value over the period, multiplied by the number of days in the most recent fiscal half-year, then divided by 365. |
Legg Mason Partners Limited Term Municipals Fund 2006 Annual Report 7
Fund Performance
| | | | | | | | | | | | |
| Average Annual Total Returns(1) (unaudited) | | | | | | | |
| |
| | | Without Sales Charges(2)
| |
| | | Class A | | | Class B | | | Class C | | | Class O | |
Twelve Months Ended 3/31/06 | | 2.78 | % | | 2.24 | % | | 2.15 | % | | 2.69 | % |
|
|
Five Years Ended 3/31/06 | | 4.07 | | | N/A | | | N/A | | | 3.83 | |
|
|
Ten Years Ended 3/31/06 | | 4.49 | | | N/A | | | N/A | | | 4.24 | |
|
|
Inception* through 3/31/06 | | 5.58 | | | 2.65 | | | 3.43 | | | 4.52 | |
|
|
| |
| | | With Sales Charges(3)
| |
| | | Class A | | | Class B | | | Class C | | | Class O | |
Twelve Months Ended 3/31/06 | | 0.74 | % | | (2.69 | )% | | 2.15 | % | | 1.70 | % |
|
|
Five Years Ended 3/31/06 | | 3.66 | | | N/A | | | N/A | | | 3.83 | |
|
|
Ten Years Ended 3/31/06 | | 4.29 | | | N/A | | | N/A | | | 4.24 | |
|
|
Inception* through 3/31/06 | | 5.46 | | | 2.08 | | | 3.43 | | | 4.52 | |
|
|
| | | | | | |
| Cumulative Total Returns(1) (unaudited) | | |
| | | | | Without Sales Charges(2) | | |
Class A (3/31/96 through 3/31/06) | | | | 55.15% | | |
|
Class B (Inception* through 3/31/06) | | | | 8.76 | | |
|
Class C (Inception* through 3/31/06) | | | | 15.53 | | |
|
Class O (3/31/96 through 3/31/06) | | | | 51.55 | | |
|
| (1) | | All figures represent past performance and are not a guarantee of future results. Investment return and principal value of an investment will fluctuate so that an investor’s shares, when redeemed, may be worth more or less than their original cost. The returns shown do not reflect the deduction of taxes that a shareholder would pay on Fund distributions or the redemption of Fund shares. Performance figures may reflect voluntary fee waivers and/or expense reimbursements. In the absence of voluntary fee waivers and/or expense reimbursements, the total return would have been lower. |
| (2) | | Assumes reinvestment of all distributions, including returns of capital, if any, at net asset value and does not reflect the deduction of the applicable sales charge with respect to Class A shares or the applicable contingent deferred sales charges (“CDSC”) with respect to Class B and O shares. |
| (3) | | Assumes reinvestment of all distributions, including returns of capital, if any, at net asset value. In addition, Class A shares reflect the deduction of the maximum sales charge of 2.00%; Class B shares reflect the deduction of a 5.00% CDSC, which applies if shares are redeemed within one year from purchase payment. This CDSC declines by 1.00% per year until no CDSC is incurred. In addition, Class O shares also reflect the deduction of a 1.00% CDSC, which applies if shares are redeemed within one year from purchase payment. |
| * | | Inception dates for Class A, B, C and O shares are November 28, 1988, January 13, 2003, December 19, 2001 and January 5, 1993, respectively. |
8 Legg Mason Partners Limited Term Municipals Fund 2006 Annual Report
Historical Performance (unaudited)
Value of $10,000 Invested in Class A Shares of the Legg Mason Partners Limited Term Municipals Fund vs. Lehman Brothers Municipal Bond Index and Lipper Intermediate Municipal Debt Funds Average† (March 1996 — March 2006)
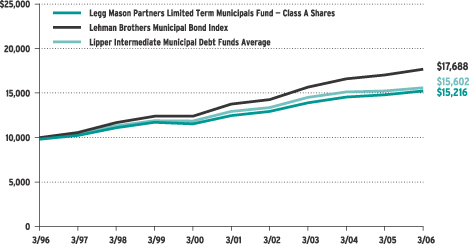
| † | | Hypothetical illustration of $10,000 invested in Class A shares on March 31, 1996, assuming deduction of the 2.00% maximum initial sales charge at the time of investment and reinvestment of all distributions, including returns of capital, if any, at net asset value through March 31, 2006. The Lehman Brothers Municipal Bond Index is a broad measure of the municipal bond market with maturities of at least one year. The index is unmanaged and is not subject to the same management and trading expenses of a mutual fund. Please note that an investor cannot invest directly in an index. The Lipper Intermediate Municipal Debt Funds Average is composed of the Fund’s peer group of mutual funds (150 funds as of March 31, 2006). The Index is unmanaged and is not subject to the same management and trading expenses of a mutual fund. The performance of the Fund’s other classes may be greater or less than the Class A shares’ performance indicated on this chart, depending on whether greater or lesser sales charges and fees were incurred by shareholders investing in the other classes. |
All figures represent past performance and are not a guarantee of future results. Investment return and principal value of an investment will fluctuate so that an investor’s shares, when redeemed, may be worth more or less than their original cost. The returns shown do not reflect the deduction of taxes that a shareholder would pay on Fund distributions or the redemption of Fund shares. Performance figures may reflect voluntary fee waivers and/or expense reimbursements. In the absence of voluntary fee waivers and/or expense reimbursements, the total return would have been lower.
Legg Mason Partners Limited Term Municipals Fund 2006 Annual Report 9
Schedule of Investments (March 31, 2006)
LEGG MASON PARTNERS LIMITED TERM MUNICIPALS FUND
| | | | | | |
| | | |
Face
Amount | | Rating‡ | | Security | | Value |
| | | | | | | |
| | | | | | | | |
| | MUNICIPAL BONDS — 97.1% | | | |
| | Alabama — 2.9% | | | | | |
| $ | 5,000,000 | | AAA | | Alabama State Public School & College Authority, FSA-Insured,
5.125% due 11/1/15 (a) | | $ | 5,228,800 |
| | 3,040,000 | | AAA | | Birmingham, AL, Airport Authority, Airport Revenue, MBIA-Insured, 5.500% due 7/1/16 | | | 3,113,903 |
| | 7,000,000 | | AAA | | Jefferson County, AL, Sewer Revenue, Refunding, Series B 8,
5.250% due 2/1/16 (a) | | | 7,332,150 |
| | 1,000,000 | | A- | | Marshall County, AL, Health Care Authority Revenue, Series A,
6.250% due 1/1/22 | | | 1,065,020 |
| | 1,785,000 | | AAA | | Mobile, AL, 10.875% due 11/1/07 (b) | | | 1,918,589 |
| | 1,000,000 | | AAA | | Saraland, AL, GO, MBIA-Insured, 5.250% due 1/1/14 | | | 1,064,820 |
|
|
| | | | | | Total Alabama | | | 19,723,282 |
|
|
| | Alaska — 0.1% | | | | | |
| | 1,000,000 | | NR | | Alaska Industrial Development & Export Authority Revenue, Williams Lynxs Alaska Cargo Port LLC, 8.000% due 5/1/23 (c) | | | 995,310 |
|
|
| | American Samoa — 0.2% | | | |
| | 1,000,000 | | A | | Territory of American Samoa, ACA-Insured, 6.000% due 9/1/08 | | | 1,038,640 |
|
|
| | Arizona — 0.7% | | | |
| | | | | | Arizona State Health Facilities Authority: | | | |
| | 660,000 | | A- | | Catholic Healthcare West, Series A,
Call 7/1/06 @ 100, 6.125% due 7/1/09 (d) | | | 685,040 |
| | 770,000 | | A- | | Unrefunded Balance, Catholic Healthcare West, Series A,
6.125% due 7/1/09 | | | 799,353 |
| | 1,000,000 | | AAA | | Arizona State University, Revenue Bonds, FGIC-Insured,
Call 7/1/12 @ 100, 5.500% due 7/1/21 (d) | | | 1,090,680 |
| | | | | | Maricopa County, AZ, Hospital Revenue: | | | |
| | 95,000 | | AAA | | Intercommunity Healthcare, Sun City Project, 8.625% due 1/1/10 (b) | | | 104,798 |
| | | | | | St. Lukes Medical Center: | | | |
| | 1,100,000 | | AAA | | 8.750% due 2/1/10 (b) | | | 1,219,559 |
| | 230,000 | | AAA | | 10.250% due 2/1/11 (b) | | | 269,719 |
| | 470,000 | | NR | | Maricopa County, AZ, IDA, MFH Revenue, Stanford Court Apartments, Series B, 5.750% due 7/1/08 (e)(f) | | | 47,000 |
| | 346,000 | | AAA | | Pima County, AZ, Hospital Revenue, Tucson Medical Center,
10.375% due 4/1/07 (b) | | | 357,754 |
|
|
| | | | | | Total Arizona | | | 4,573,903 |
|
|
| | Arkansas — 1.0% | | | |
| | 495,000 | | AAA | | Arkansas Housing Development Agency, Single-Family Mortgage,
FHA/VA-Insured, 8.375% due 7/1/10 (b) | | | 541,565 |
| | | | | | Arkansas State Development Finance Authority Hospital Revenue, Washington Regional Medical Center, Call 2/1/10 @ 100: | | | |
| | 1,500,000 | | BBB | | 7.000% due 2/1/15 (d) | | | 1,670,850 |
| | 2,500,000 | | BBB | | 7.250% due 2/1/20 (d) | | | 2,806,800 |
| | 475,000 | | AAA | | Pulaski County, AR, Hospital Revenue, Arkansas Children’s Hospital, 9.250% due 3/1/10 (b) | | | 533,230 |
See Notes to Financial Statements.
10 Legg Mason Partners Limited Term Municipals Fund 2006 Annual Report
Schedule of Investments (March 31, 2006) (continued)
| | | | | | | | |
| | | |
Face
Amount | | Rating‡ | | Security | | Value |
| | | | | | | | | |
| | Arkansas — 1.0% (continued) | | | |
| $ | 1,000,000 | | BB | | Warren County, AR, Solid Waste Disposal Revenue, Potlatch Corp. Project, 7.000% due 4/1/12 (c) | | $ | 1,084,130 |
|
|
| | | | | | Total Arkansas | | | 6,636,575 |
|
|
| | California — 4.8% | | | |
| | 3,000,000 | | NR | | Barona, CA, Band of Mission Indians, GO, 8.250% due 1/1/20 | | | 3,113,010 |
| | 4,000,000 | | A3(g) | | California Health Facilities Financing Authority Revenue, Cedars Sinai Medical Center, 5.000% due 11/15/20 (a) | | | 4,135,520 |
| | | | | | California State: | | | |
| | 5,000,000 | | AAA | | Department Water Resources Power Supply Revenue, Series A,
Call 5/1/12 @ 101, 5.375% due 5/1/18 (a)(d) | | | 5,488,750 |
| | 5,000,000 | | AA- | | Economic Recovery, Series A, 5.000% due 7/1/16 (a) | | | 5,241,150 |
| | 4,245,000 | | A- | | Public Works Board Lease Revenue, Department of Corrections,
Series A, 5.250% due 9/1/16 (a) | | | 4,428,851 |
| | | | | | Los Angeles, CA: | | | |
| | 360,000 | | NR | | COP, Hollywood Presbyterian Medical Center, INDLC-Insured, 9.625% due 7/1/13 (b) | | | 435,751 |
| | 8,000,000 | | AAA | | USD, RITES, MBIA-Insured, 5.375% due 7/1/17 (a)(h) | | | 8,721,680 |
| | 125,000 | | Aaa(g) | | Pleasant Valley Hospital Building Corp., Camarillo California Hospital Revenue, 9.700% due 12/15/07 (b) | | | 133,686 |
| | 215,000 | | AAA | | San Leandro, CA, Hospital Revenue, Vesper Memorial Hospital, 11.500% due 5/1/11 (b) | | | 258,783 |
| | 755,000 | | AAA | | Santa Rosa, CA, Hospital Revenue, Santa Rosa Hospital Memorial Project, 10.300% due 3/1/11 (b) | | | 892,214 |
|
|
| | | | | | Total California | | | 32,849,395 |
|
|
| | Colorado — 1.8% | | | |
| | 1,025,000 | | BBB- | | Colorado Educational & Cultural Facilities Authority Revenue Charter School, Bromley East Project, Series A, Call 9/15/11 @ 100, 7.000% due 9/15/20 (d) | | | 1,181,108 |
| | 860,000 | | NR | | Colorado Health Facilities Authority, Hospital Revenue, Weld County General Hospital Project, 9.375% due 7/1/09 (b) | | | 942,534 |
| | 265,000 | | AA | | Colorado HFA, Single-Family Mortgage Program, Senior Bonds,
Series D-2, 6.900% due 4/1/29 (c) | | | 274,418 |
| | | | | | Denver, CO, City & County: | | | |
| | 3,000,000 | | AAA | | Excise Tax Revenue, Refunding, Series A, FSA-Insured, 5.500% due 9/1/14 | | | 3,165,300 |
| | 1,480,000 | | AAA | | Wastewater Revenue, FGIC-Insured, 5.250% due 11/1/14 | | | 1,587,714 |
| | 2,200,000 | | AAA | | Longmont, CO, Sales & Use Tax Revenue, Call 11/15/10 @ 100, 5.750% due 11/15/19 (d) | | | 2,388,518 |
| | 2,500,000 | | AAA | | Northwest Parkway Public Highway Authority, Series A, 5.500% due 6/15/16 | | | 2,697,700 |
|
|
| | | | | | Total Colorado | | | 12,237,292 |
|
|
See Notes to Financial Statements.
Legg Mason Partners Limited Term Municipals Fund 2006 Annual Report 11
Schedule of Investments (March 31, 2006) (continued)
| | | | | | | | |
| | | |
Face
Amount | | Rating‡ | | Security | | Value |
| | | | | | | | | |
| | Connecticut — 3.3% | | | |
| $ | 5,000,000 | | AA | | Connecticut State, Series D, Call 11/15/12 @ 100, 5.375% due 11/15/19 (a)(d) | | $ | 5,441,100 |
| | | | | | Connecticut State GO: | | | |
| | 2,500,000 | | AAA | | AMBAC-Insured, Series B, 5.250% due 6/1/18 | | | 2,755,275 |
| | 5,000,000 | | AA | | Series C, 5.000% due 12/15/11 (a) | | | 5,312,250 |
| | 2,000,000 | | A | | Connecticut State Special Obligation Parking Revenue, Bradley International Airport, Series A, ACA-Insured, 6.375% due 7/1/12 (c) | | | 2,182,280 |
| | | | | | Connecticut State Special Tax Obligation Revenue: | | | |
| | | | | | RITES: | | | |
| | 2,000,000 | | AAA | | Series A, FSA-Insured, 6.815% due 10/1/09 (h) | | | 2,293,080 |
| | 2,000,000 | | AAA | | Series B, FSA-Insured, 6.815% due 10/1/09 (h) | | | 2,274,720 |
| | 2,000,000 | | AAA | | Transportation Infrastructure, Series A, FSA-Insured, Call 7/1/12 @ 100, 5.375% due 7/1/16 (d) | | | 2,167,600 |
|
|
| | | | | | Total Connecticut | | | 22,426,305 |
|
|
| | Delaware — 0.3% | | | |
| | | | | | Delaware State: | | | |
| | 404,000 | | AAA | | Series A, Call 7/1/10 @ 100, 5.000% due 7/1/13 (d) | | | 424,244 |
| | 1,596,000 | | AAA | | GO, Series A, 5.000% due 7/1/13 | | | 1,668,331 |
|
|
| | | | | | Total Delaware | | | 2,092,575 |
|
|
| | Florida — 6.4% | | | |
| | 580,000 | | NR | | Bonita Springs, FL, Vasari Community Development District Revenue, Capital Improvement, Series B, 6.200% due 5/1/09 | | | 583,689 |
| | 3,000,000 | | NR | | Capital Projects Finance Authority, Florida Student Housing Revenue, Cafra Capital Corp., Series A, Call 8/15/10 @ 103,
7.750% due 8/15/20 (d) | | | 3,494,040 |
| | 90,000 | | NR | | Capital Region Community Development, Florida Development District Revenue, Capital Improvement, 5.950% due 5/1/06 | | | 90,136 |
| | 145,000 | | NR | | Fishhawk Community Development District II Special Assessment Revenue, Series B, 5.000% due 11/1/07 | | | 144,372 |
| | | | | | Florida Municipal Loan Council Revenue, Series A, MBIA-Insured: | | | |
| | 1,790,000 | | AAA | | 5.250% due 11/1/13 | | | 1,907,675 |
| | 3,175,000 | | AAA | | 5.250% due 11/1/16 | | | 3,426,555 |
| | 1,500,000 | | AAA | | Florida State Board of Education GO, Series A, Call 6/1/10 @ 101, 5.500% due 6/1/16 (d) | | | 1,617,720 |
| | 995,000 | | NR | | Gateway Services Community Development District, Florida Special Assessment Revenue, Sun City Center, Fort Meyers Project, Series B, 5.500% due 5/1/10 | | | 1,003,278 |
| | 880,000 | | NR | | Greyhawk Landing Community Development District, Florida Special Assessment Revenue, Series B, 6.250% due 5/1/09 | | | 890,208 |
| | | | | | Hillsborough County, FL: | | | |
| | 2,185,000 | | AA | | EFA Revenue, Refunding, University of Tampa Project, Radian-Insured, 5.750% due 4/1/18 | | | 2,302,968 |
| | 3,500,000 | | AAA | | School District Sales Tax Revenue, AMBAC-Insured, Call 10/1/11 @ 100, 5.375% due 10/1/15 (a)(d) | | | 3,776,185 |
See Notes to Financial Statements.
12 Legg Mason Partners Limited Term Municipals Fund 2006 Annual Report
Schedule of Investments (March 31, 2006) (continued)
| | | | | | | | |
| | | |
Face
Amount | | Rating‡ | | Security | | Value |
| | | | | | | | | |
| | Florida — 6.4% (continued) | | | |
| | | | | | Jacksonville Beach, FL, Utility Revenue: | | | |
| $ | 2,305,000 | | AAA | | 7.900% due 10/1/14 (b) | | $ | 2,696,620 |
| | 2,145,000 | | Aaa(g) | | 5.000% due 4/1/18 | | | 2,236,806 |
| | 1,235,000 | | NR | | Killarney Community Development District Special Assessment Revenue, Series B, 5.125% due 5/1/09 | | | 1,232,555 |
| | 315,000 | | NR | | Mediterra North Community Development District, Florida Capital Improvement Revenue, Series B, 6.000% due 5/1/08 | | | 316,477 |
| | 6,855,000 | | AAA | | Miami, FL, Homeland and Defense/Neighborhood GO,
5.250% due 1/1/18 (a) | | | 7,333,616 |
| | 2,000,000 | | A+ | | Orange County, FL, Health Facilities Authority Revenue, Hospital Adventist Health Systems, 6.250% due 11/15/24 | | | 2,213,760 |
| | 1,470,000 | | AA | | Orlando, FL, Utilities Commission Water & Electric Revenue, Series A, 5.250% due 10/1/13 | | | 1,558,259 |
| | 10,000 | | NR | | Panther Trace Community Development District, Florida Special Assessment Revenue, Series B, 6.500% due 5/1/09 | | | 10,054 |
| | 60,000 | | NR | | Parklands West Community Development District, Florida Special Assessment Revenue, Series B, 6.000% due 5/1/06 | | | 59,999 |
| | 325,000 | | NR | | Port Saint Lucie, FL, Special Assessment Revenue, Series A,
6.375% due 9/1/11 | | | 334,454 |
| | 595,000 | | NR | | Renaissance Community Development District, Florida Capital Improvement Revenue, Series B, 6.250% due 5/1/08 | | | 599,433 |
| | 755,000 | | NR | | Reunion East Community Development District, Florida Special Assessment Revenue, Series B, 5.900% due 11/1/07 | | | 757,650 |
| | 3,500,000 | | NR | | Sterling Hill, FL, Community Development District, Series B,
5.500% due 11/1/10 | | | 3,516,660 |
| | 820,000 | | NR | | Sumter Landing Community Development District Special Assessment Revenue, 6.250% due 5/1/13 | | | 821,632 |
| | 170,000 | | AAA | | Tamarac, FL, Water & Sewer Utilities Revenue, AMBAC-Insured, 9.250% due 10/1/10 (b) | | | 191,797 |
| | 270,000 | | NR | | Village Community Development District North 5, Florida Special Assessment Revenue, Series B, 5.000% due 5/1/08 | | | 270,297 |
| | 135,000 | | NR | | Waterlefe Community Development District, Florida Capital Improvement Revenue, Series B, 6.250% due 5/1/10 | | | 135,761 |
|
|
| | | | | | Total Florida | | | 43,522,656 |
|
|
| | Georgia — 1.4% | | | |
| | 1,980,000 | | AAA | | East Point, GA, Building Authority Revenue, FSA-Insured,
zero coupon bond to yield 6.249% due 2/1/20 | | | 924,264 |
| | 1,630,000 | | AAA | | Fulton County, GA, Water and Sewer Revenue,
5.000% due 1/1/16 (a) | | | 1,690,049 |
| | | | | | Municipal Electronic Authority Revenue,
Combustion Turbine Project, Series A: | | | |
| | 2,415,000 | | AAA | | MBIA-Insured, 5.250% due 11/1/19 | | | 2,476,051 |
| | 85,000 | | AAA | | Unrefunded Balance, MBIA-Insured, Call 11/1/07 @ 100,
5.250% due 11/1/19 (d) | | | 87,189 |
| | 2,500,000 | | Aaa(g) | | Rockdale County, GA, Water & Sewer Authority Revenue,
5.000% due 7/1/20 | | | 2,659,575 |
See Notes to Financial Statements.
Legg Mason Partners Limited Term Municipals Fund 2006 Annual Report 13
Schedule of Investments (March 31, 2006) (continued)
| | | | | | | | |
| | | |
Face
Amount | | Rating‡ | | Security | | Value |
| | | | | | | | | |
| | Georgia — 1.4% (continued) | | | |
| $ | 1,320,000 | | NR | | Savannah, GA, EDA, College of Art and Design Inc. Project,
6.200% due 10/1/09 (b) | | $ | 1,371,295 |
|
|
| | | | | | Total Georgia | | | 9,208,423 |
|
|
| | Hawaii — 0.6% | | | |
| | | | | | Hawaii State, Series CW, FGIC-Insured: | | | |
| | 2,895,000 | | AAA | | 5.375% due 8/1/15 | | | 3,095,421 |
| | 1,105,000 | | AAA | | Call 8/1/11 @ 100, 5.375% due 8/1/15 (d) | | | 1,189,742 |
|
|
| | | | | | Total Hawaii | | | 4,285,163 |
|
|
| | Idaho — 0.2% | | | |
| | 10,000 | | Aaa(g) | | Idaho Falls, ID, Electric Revenue, 10.250% due 4/1/06 (b) | | | 10,000 |
| | 1,500,000 | | BB | | Nez Perce County, ID, PCR, Refunding, Potlatch Corp. Project,
6.125% due 12/1/07 | | | 1,533,075 |
|
|
| | | | | | Total Idaho | | | 1,543,075 |
|
|
| | Illinois — 6.0% | | | |
| | 140,000 | | AA | | Chicago Heights, IL, Single-Family Mortgage Revenue,
7.600% due 5/1/10 (b) | | | 151,290 |
| | | | | | Chicago, IL: | | | |
| | 120,000 | | AAA | | GO, 5.375% due 1/1/16 | | | 129,160 |
| | 2,000,000 | | AA+ | | Metropolitan Water Reclamation District Greater Chicago,
Capital Improvement, Series A, Call 12/1/12 @ 101,
5.500% due 12/1/14 (d) | | | 2,207,540 |
| | 1,500,000 | | AAA | | O’Hare International Airport, Second Lien Passenger Facility,
Series B, AMBAC-Insured, 5.500% due 1/1/16 | | | 1,611,285 |
| | 3,880,000 | | AAA | | Project and Refunding, Series A, AMBAC-Insured,
Call 7/1/12 @ 100, 5.375% due 1/1/16 (a)(d) | | | 4,205,144 |
| | 1,500,000 | | AAA | | Series A, FGIC-Insured, Call 7/1/10 @ 101,
6.000% due 1/1/14 (d) | | | 1,646,325 |
| | | | | | Cicero, IL: | | | |
| | 2,415,000 | | AAA | | MBIA-Insured, 5.625% due 12/1/16 | | | 2,678,670 |
| | 1,250,000 | | AAA | | Tax Increment, Series A, XLCA-Insured, 5.250% due 1/1/20 | | | 1,336,600 |
| | 3,000,000 | | Aaa(g) | | Cook Kane Lake and Mc Henry Counties, IL, Community College, District North 512, William Rainey Harper College, Series A,
Call 12/1/10 @ 100, 5.500% due 12/1/15 (d) | | | 3,227,520 |
| | 4,560,000 | | AAA | | Glendale Heights, IL, Hospital Revenue, Refunding Glendale Heights Project, Series B, 7.100% due 12/1/15 (a)(b) | | | 5,267,119 |
| | 2,000,000 | | Aaa(g) | | Illinois DFA Revenue, Revolving Fund-Master Trust, 5.500% due 9/1/17 | | | 2,166,800 |
| | | | | | Illinois Health Facilities Authority Revenue: | | | |
| | 515,000 | | AAA | | Methodist Medical Center of Illinois Project, 9.000% due 10/1/10 (b) | | | 574,390 |
| | 5,000,000 | | A | | Order of St. Francis Healthcare System, Call 11/15/09 @ 101,
6.250% due 11/15/19 (a)(d) | | | 5,462,000 |
| | 1,140,000 | | A | | Passavant Memorial Area Hospital, 6.250% due 10/1/17 | | | 1,237,344 |
| | 20,000 | | A | | Victory Memorial Hospital Area Hospital Association Project,
7.500% due 10/1/06 (b) | | | 20,394 |
| | 5,000,000 | | AAA | | Illinois State, GO, First Series, 5.375% due 7/1/19 (a) | | | 5,370,250 |
See Notes to Financial Statements.
14 Legg Mason Partners Limited Term Municipals Fund 2006 Annual Report
Schedule of Investments (March 31, 2006) (continued)
| | | | | | | | |
| | | |
Face
Amount | | Rating‡ | | Security | | Value |
| | | | | | | | | |
| | Illinois — 6.0% (continued) | | | |
| $ | 2,440,000 | | AAA | | Kane County, IL, GO, FGIC-Insured, 5.500% due 1/1/15 | | $ | 2,647,449 |
| | 930,000 | | AAA | | Northern, IL, University Revenue, Call 10/01/09 @ 100,
10.400% due 4/1/13 (d) | | | 1,079,525 |
|
|
| | | | | | Total Illinois | | | 41,018,805 |
|
|
| | Indiana — 3.0% | | | |
| | 1,720,000 | | AAA | | Evansville Vanderburgh Public Library Leasing Corp., First Mortgage, MBIA-Insured, Call 1/15/12 @ 100, 5.750% due 7/15/18 (d) | | | 1,891,484 |
| | 2,500,000 | | AAA | | Hamilton County, IN, County Optional Income Tax Revenue,
FSA-Insured, 5.250% due 1/10/20 | | | 2,594,525 |
| | 585,000 | | AAA | | Indiana Bond Bank, Special Program, Series A, AMBAC-Insured, 9.750% due 8/1/09 (b) | | | 640,341 |
| | 3,920,000 | | AAA | | Indiana State Toll Road Commission Toll Road Revenue,
9.000% due 1/1/15 (a)(b) | | | 5,038,376 |
| | 3,000,000 | | AAA | | Indianapolis Local Public Improvement Bond Bank, Waterworks Project, Series A, Call 7/1/12 @ 100, 5.500% due 7/1/19 (d) | | | 3,272,040 |
| | 1,000,000 | | AAA | | Lawrence Township, IN, Metropolitan School District, First Mortgage, IBC/MBIA-Insured, 6.750% due 7/5/13 | | | 1,156,210 |
| | | | | | Madison County, IN, Hospital Authority Facilities Revenue: | | | |
| | 565,000 | | AAA | | Community Hospital of Anderson Project, 9.250% due 1/1/10 (b) | | | 629,969 |
| | 290,000 | | Aaa(g) | | St. Johns Hickey Memorial Hospital Project, 9.000% due 12/1/09 (b) | | | 320,549 |
| | 1,075,000 | | AAA | | Mishawaka, IN, School Building Corp., First Mortgage,
AMBAC-Insured, Call 7/15/11 @ 100, 5.500% due 7/15/18 (d) | | | 1,163,182 |
| | 2,000,000 | | NR | | North Manchester, IN, Industrial Revenue, Peabody Retirement Community Project, Series A, 7.125% due 7/1/22 | | | 2,075,020 |
| | 1,670,000 | | AAA | | St. Joseph County, IN, Hospital Authority Facilities Revenue,
Memorial Hospital South Bend, 9.400% due 6/1/10 (b) | | | 1,867,177 |
|
|
| | | | | | Total Indiana | | | 20,648,873 |
|
|
| | Iowa — 1.3% | | | |
| | 3,000,000 | | A1(g) | | Iowa Finance Authority, Health Care Facilities Revenue,
Genesis Medical Center, 6.250% due 7/1/20 | | | 3,229,050 |
| | 3,795,000 | | AAA | | Muscatine, IA, Electric Revenue, 9.700% due 1/1/13 (a)(b) | | | 4,578,819 |
| | 1,085,000 | | AAA | | University of Iowa Facilities Corp., Medical Education and Biomed Research Facilities Project, AMBAC-Insured, 5.375% due 6/1/18 | | | 1,134,346 |
|
|
| | | | | | Total Iowa | | | 8,942,215 |
|
|
| | Kansas — 0.6% | | | |
| | 4,000,000 | | BBB | | Burlington, KS, Environmental Improvement Revenue, Kansas City Power & Light Project, Refunding, 4.750% due 10/1/07 (a)(i)(j) | | | 4,037,720 |
|
|
| | Kentucky — 0.8% | | | |
| | 5,000,000 | | AAA | | Kentucky Property & Buildings, Call 10/1/11 @ 100,
5.375% due 10/1/19 (a)(d) | | | 5,394,550 |
|
|
| | Louisiana — 1.3% | | | |
| | 435,000 | | Aaa(g) | | Jefferson Parish, LA, Home Mortgage Authority, Single-Family Mortgage Revenue, Series G, GNMA/FNMA-Collateralized,
6.300% due 6/1/32 (c) | | | 452,826 |
See Notes to Financial Statements.
Legg Mason Partners Limited Term Municipals Fund 2006 Annual Report 15
Schedule of Investments (March 31, 2006) (continued)
| | | | | | | | |
| | | |
Face
Amount | | Rating‡ | | Security | | Value |
| | | | | | | | | |
| | Louisiana — 1.3% (continued) | | | |
| $ | 515,000 | | NR | | Lafayette, LA, Public Trust Financing Authority, Single-Family Mortgage Revenue, FHA-Insured, 7.200% due 4/1/10 (b) | | $ | 543,196 |
| | 1,480,000 | | AAA | | Louisiana Local Government Environmental Facilities and Community Development Authority Revenue, Series A, AMBAC-Insured, Parking Facilities Corp. Garage Project, 5.625% due 10/1/17 | | | 1,600,487 |
| | 385,000 | | AAA | | Louisiana Public Facilities Authority Hospital Revenue, Southern Baptist Hospital Inc. Project, Aetna-Insured, 8.000% due 5/15/12 (b) | | | 429,017 |
| | 5,555,000 | | AAA | | State of Louisiana, Series A, FGIC-Insured, 5.250% due 5/1/19 (a) | | | 5,978,069 |
|
|
| | | | | | Total Louisiana | | | 9,003,595 |
|
|
| | Maryland — 0.6% | | | |
| | 3,000,000 | | AA+ | | Anne Arundel County, MD, GO, Call 3/1/12 @ 100,
5.375% due 3/1/14 (d) | | | 3,246,090 |
| | 1,000,000 | | A+ | | Maryland State Health & Higher EFA Revenue, University of Maryland Medical System, 6.000% due 7/1/22 | | | 1,085,820 |
|
|
| | | | | | Total Maryland | | | 4,331,910 |
|
|
| | Massachusetts — 3.9% | | | |
| | 1,340,000 | | AAA | | Boston, MA, Water & Sewer Commission Revenue,
10.875% due 1/1/09 (b)(k) | | | 1,497,276 |
| | 1,140,000 | | Aaa(g) | | Massachusetts Rail Connections Inc., Route 128, Parking Garage Revenue, Series A, Call 7/1/09 @ 102, 6.000% due 7/1/13 (d) | | | 1,241,346 |
| | | | | | Massachusetts State: | | | |
| | 1,500,000 | | AAA | | GO, RITES, Series PA 993-R, MBIA-Insured, 7.042% due 5/1/09 (h) | | | 1,742,910 |
| | 3,500,000 | | AAA | | RITES, Series PA 964-R, MBIA-Insured, 7.065% due 11/1/09 (a)(h) | | | 4,066,790 |
| | 585,000 | | BBB- | | Massachusetts State DFA Revenue, First Mortgage, Edgecombe Project, Series A, 6.000% due 7/1/11 | | | 608,148 |
| | | | | | Massachusetts State HEFA Revenue: | | | |
| | 2,000,000 | | AAA | | Berkshire Health Systems, Series F, 5.000% due 10/1/19 | | | 2,078,100 |
| | | | | | Caritas Christi Obligation, Series B: | | | |
| | 2,000,000 | | BBB | | 6.500% due 7/1/12 | | | 2,167,840 |
| | 3,000,000 | | BBB | | 6.750% due 7/1/16 | | | 3,344,520 |
| | 1,000,000 | | AAA | | Harvard University, Series Z, 5.000% due 1/15/16 | | | 1,050,070 |
| | 1,300,000 | | AAA | | University of Massachusetts, Series C, 5.500% due 10/1/18 | | | 1,401,231 |
| | 1,240,000 | | AAA | | Massachusetts State IFA Revenue, University Commons Nursing, Series A, FHA-Insured, 6.550% due 8/1/18 | | | 1,340,837 |
| | 1,515,000 | | AAA | | Massachusetts State Port Authority Revenue, 13.000% due 7/1/13 (b) | | | 2,044,356 |
| | 2,000,000 | | Aa3(g) | | Massachusetts State, GAN, Series A, 5.750% due 6/15/15 | | | 2,167,020 |
| | 2,000,000 | | AAA | | Pittsfield, MA, GO, MBIA-Insured, 5.500% due 4/15/17 | | | 2,179,500 |
|
|
| | | | | | Total Massachusetts | | | 26,929,944 |
|
|
| | Michigan — 1.7% | | | | | |
| | 1,165,000 | | NR | | Allen Academy COP, 7.000% due 6/1/15 | | | 1,160,969 |
| | 1,000,000 | | AAA | | Carman-Ainsworth, MI, Community School District GO, FGIC-Insured, Call 5/1/12 @ 100, 5.500% due 5/1/19 (d) | | | 1,090,820 |
| | 1,775,000 | | AA | | Chippewa Valley, MI, Schools Administration Building, Q-SBLF-Insured, Call 5/1/12 @ 100, 5.500% due 5/1/18 (d) | | | 1,936,206 |
See Notes to Financial Statements.
16 Legg Mason Partners Limited Term Municipals Fund 2006 Annual Report
Schedule of Investments (March 31, 2006) (continued)
| | | | | | | | |
| | | |
Face
Amount | | Rating‡ | | Security | | Value |
| | | | | | | | | |
| | Michigan — 1.7% (continued) | | | |
| $ | 1,000,000 | | AAA | | Holland, MI, Area Community Swimming Pool Authority GO,
FGIC-Insured, Call 5/1/06 @ 100, 5.125% due 5/1/19 (d) | | $ | 1,001,230 |
| | 1,000,000 | | AAA | | Michigan Municipal Bond Authority Revenue, School District City of Detroit, 5.000% due 6/1/16 | | | 1,061,010 |
| | 2,000,000 | | A- | | Michigan State Strategic Fund Limited Obligation Revenue, Refunding, Dow Chemical Project, 4.600% due 6/1/08 (i)(j) | | | 2,027,340 |
| | 1,000,000 | | AA | | Mount Clemens, MI, Community School District, Q-SBLF-Insured,
Call 11/1/11 @ 100, 5.500% due 5/1/16 (d) | | | 1,086,190 |
| | 2,000,000 | | AAA | | Southfield, MI, Library Building Authority GO, MBIA-Insured,
Call 5/1/10 @ 100, 5.500% due 5/1/24 (d) | | | 2,137,220 |
|
|
| | | | | | Total Michigan | | | 11,500,985 |
|
|
| | Minnesota — 0.3% | | | |
| | 1,000,000 | | A- | | Minneapolis, MN, Health Care System Revenue, Allina Health Systems, Series A, 6.000% due 11/15/18 | | | 1,099,890 |
| | 1,000,000 | | A | | Saint Paul, MN, Housing & Redevelopment Authority, Hospital Revenue, Health East Project, Series B, ACA/CBI-Insured, 5.850% due 11/1/17 | | | 1,034,380 |
|
|
| | | | | | Total Minnesota | | | 2,134,270 |
|
|
| | Missouri — 0.7% | | | | | |
| | 15,000 | | AAA | | Chillicothe, MO, Electric Revenue, AMBAC-Insured, 10.250% due 9/1/06(b) | | | 15,403 |
| | 1,000,000 | | A-(l) | | Lees Summit, MO, IDA Health Facilities Revenue, John Knox Village, 5.750% due 8/15/11 | | | 1,051,600 |
| | 1,500,000 | | Aaa(g) | | Missouri State Environmental Improvement & Energy Resource Authority, Water Pollution State Revolving Funds Programs, Series A,
5.250% due 1/1/16 | | | 1,583,580 |
| | 910,000 | | AA | | Missouri State Housing Development Community, MFH Revenue, Series I, 5.500% due 12/1/15 | | | 952,251 |
| | 25,000 | | BBB- | | Nevada, MO, Waterworks Systems Revenue, 10.000% due 10/1/07 (b) | | | 26,502 |
| | 1,000,000 | | AAA | | Saint Louis, MO, Airport Revenue, Airport Development Program, Series A, MBIA-Insured, Call 7/1/11 @ 100, 5.625% due 7/1/16 (d) | | | 1,089,860 |
|
|
| | | | | | Total Missouri | | | 4,719,196 |
|
|
| | Montana — 0.0% | | | |
| | 75,000 | | AAA | | Montana State Board of Regents Revenue, MBIA-Insured,
10.000% due 11/15/08 (b) | | | 82,392 |
|
|
| | Nebraska — 0.0% | | | |
| | 15,000 | | Aaa(g) | | Douglas County, NE, Hospital Authority No. 2, Archbishop Bergan Mercy Hospital, 9.500% due 7/1/10 (b) | | | 16,841 |
|
|
| | Nevada — 1.2% | | | |
| | 1,185,000 | | BBB | | Carson City, NV, Hospital Revenue, Carson-Tahoe Hospital Project, 6.000% due 9/1/14 | | | 1,280,831 |
| | 3,000,000 | | AAA | | Clark County, NV, School District, Building Renovation, Series B, FGIC-Insured, Call 6/15/07@ 101, 5.250% due 6/15/17 (d) | | | 3,087,720 |
See Notes to Financial Statements.
Legg Mason Partners Limited Term Municipals Fund 2006 Annual Report 17
Schedule of Investments (March 31, 2006) (continued)
| | | | | | | | |
| | | |
Face
Amount | | Rating‡ | | Security | | Value |
| | | | | | | | | |
| | Nevada — 1.2% (continued) | | | |
| $ | 2,500,000 | | AAA | | Las Vegas New Convention & Visitors Authority Revenue, AMBAC-Insured, Call 7/1/09 @ 101, 6.000% due 7/1/14 (d) | | $ | 2,700,000 |
| | 865,000 | | AAA | | Nevada Housing Division, Multi-Unit Housing, Saratoga Palms, FNMA-Collateralized, 6.250% due 10/1/16 (c) | | | 882,793 |
|
|
| | | | | | Total Nevada | | | 7,951,344 |
|
|
| | New Hampshire — 0.9% | | | |
| | | | | | New Hampshire HEFA: | | | |
| | 3,470,000 | | A | | Covenant Healthcare System, 6.500% due 7/1/17 (a) | | | 3,870,230 |
| | | | | | University Systems of New Hampshire, AMBAC-Insured: | | | |
| | 305,000 | | AAA | | 5.375% due 7/1/16 | | | 327,854 |
| | 595,000 | | AAA | | Call 7/1/11 @ 101, 5.375% due 7/1/16 (d) | | | 646,348 |
| | 1,000,000 | | AA | | New Hampshire State, GO, Capital Improvement, Series A,
5.125% due 10/1/17 | | | 1,040,040 |
|
|
| | | | | | Total New Hampshire | | | 5,884,472 |
|
|
| | New Jersey — 3.5% | | | |
| | | | | | New Jersey Health Care Facilities Financing Authority Revenue: | | | |
| | 320,000 | | AAA | | Hackensack Hospital, 8.750% due 7/1/09 (b) | | | 338,640 |
| | 3,000,000 | | BBB- | | Trinitas Hospital Obligation Group, 7.375% due 7/1/15 | | | 3,345,420 |
| | 3,500,000 | | AAA | | New Jersey State EDA Lease Revenue, Office Building Projects, Series A, 5.000% due 6/15/18 (a) | | | 3,714,270 |
| | | | | | New Jersey State Transportation Trust Fund Authority: | | | |
| | | | | | RITES, MBIA-Insured: | | | |
| | 2,500,000 | | AAA | | Series PA 958R, 8.053% due 12/15/09 (h) | | | 3,066,300 |
| | 1,000,000 | | AAA | | Series PA 958R-B, 8.053% due 12/15/09 (h) | | | 1,226,520 |
| | | | | | Transportation Systems, Series B, MBIA-Insured: | | | |
| | 5,350,000 | | AAA | | 5.250% due 12/15/14 (a) | | | 5,804,001 |
| | 1,890,000 | | AAA | | Call 12/15/11 @ 100, 6.000% due 12/15/19 (d) | | | 2,104,062 |
| | | | | | New Jersey State Turnpike Authority Revenue: | | | |
| | 530,000 | | AAA | | 6.750% due 1/1/09 (b) | | | 539,916 |
| | 265,000 | | AAA | | 6.000% due 1/1/14 (b) | | | 281,989 |
| | 3,095,000 | | Aaa(g) | | Passaic Valley, NJ, Sewage Commissioners Sewer System, Series E, AMBAC-Insured, 5.625% due 12/1/17 | | | 3,321,678 |
| | 180,000 | | AAA | | Ringwood Boro, NJ, Sewage Authority, 9.875% due 1/1/14 (b) | | | 220,372 |
|
|
| | | | | | Total New Jersey | | | 23,963,168 |
|
|
| | New Mexico — 0.5% | | | |
| | | | | | Bernalillo County, NM, Gross Receipts Tax Revenue, AMBAC-Insured: | | | |
| | 1,925,000 | | AAA | | 5.250% due 10/1/17 | | | 2,113,246 |
| | 1,100,000 | | AAA | | 5.250% due 10/1/21 | | | 1,219,911 |
| | 95,000 | | AAA | | Farmington, NM, Utilities Systems Revenue, AMBAC-Insured,
9.875% due 1/1/08 (b) | | | 100,878 |
|
|
| | | | | | Total New Mexico | | | 3,434,035 |
|
|
See Notes to Financial Statements.
18 Legg Mason Partners Limited Term Municipals Fund 2006 Annual Report
Schedule of Investments (March 31, 2006) (continued)
| | | | | | | | |
| | | |
Face
Amount | | Rating‡ | | Security | | Value |
| | | | | | | | | |
| | New York — 4.8% | | | |
| $ | 1,000,000 | | Baa3(g) | | Albany, NY, IDA, Civic Facility Revenue, Charitable Leadership Project, Series A, 6.000% due 7/1/19 | | $ | 1,066,380 |
| | 2,500,000 | | A+ | | New York City, NY, GO, Series A, 6.250% due 8/1/08 | | | 2,557,850 |
| | 1,000,000 | | AAA | | New York City, NY, Health & Hospital Corp. Revenue, Health Systems, Series A, FSA-Insured, 5.500% due 2/15/19 | | | 1,082,520 |
| | 1,090,000 | | NR | | New York City, NY, IDA, Special Needs Facilities Pooled Program A-1, 6.100% due 7/1/12 | | | 1,111,364 |
| | | | | | New York State Dormitory Authority Revenue: | | | |
| | 1,000,000 | | AAA | | Columbia University, Series B, Call 7/1/12 @ 100,
5.250% due 7/1/17 (d) | | | 1,079,810 |
| | 1,780,000 | | AA | | Marymount Manhattan College, Radian-Insured, 6.375% due 7/1/14 | | | 1,938,046 |
| | 5,000,000 | | AAA | | Mental Health Services Facilities, 5.000% due 2/15/18 (a) | | | 5,293,150 |
| | 2,500,000 | | AAA | | School Districts Financing Programs, Series D, MBIA-Insured,
5.500% due 10/1/17 | | | 2,724,375 |
| | | | | | State University Educational Facilities: | | | |
| | 1,715,000 | | AAA | | MBIA-Insured, 6.000% due 5/15/15 | | | 1,874,015 |
| | 2,000,000 | | AAA | | Third Generation, Series A, FGIC-Insured, 5.500% due 5/15/17 | | | 2,244,000 |
| | | | | | Tobacco Settlement Financing Corp., New York, Asset-Backed, Series C-1: | | | |
| | 6,000,000 | | AA- | | 5.500% due 6/1/14 (a) | | | 6,291,180 |
| | 5,000,000 | | AA- | | 5.500% due 6/1/16 (a) | | | 5,294,050 |
|
|
| | | | | | Total New York | | | 32,556,740 |
|
|
| | North Carolina — 3.4% | | | |
| | 745,000 | | NR | | Asheville, NC, HDC, First Lien Revenue, Asheville Gardens, HUD Section 8-Insured, Call 11/1/09 @ 100, 10.500% due 5/1/11 (d) | | | 852,414 |
| | 3,000,000 | | AAA | | Guilford County, NC, GO, Public Improvement, Series B, Call 10/1/10 @ 102, 5.250% due 10/1/15 (d) | | | 3,240,300 |
| | 550,000 | | A | | North Carolina Eastern Municipal Power Agency, Power Systems Revenue, Series B, ACA/CBI-Insured, 5.650% due 1/1/16 | | | 579,766 |
| | | | | | North Carolina Municipal Power Agency No. 1, Catawba Electricity Revenue: | | | |
| | 3,140,000 | | AAA | | 10.500% due 1/1/10 (b)(k) | | | 3,590,590 |
| | 3,000,000 | | A | | Series B, ACA-CBI-Insured, 6.375% due 1/1/13 | | | 3,274,080 |
| | 5,000,000 | | AAA | | Series B, MBIA-Insured, 5.250% due 1/1/18 (a) | | | 5,335,250 |
| | | | | | North Carolina State: | | | |
| | 3,000,000 | | AAA | | Public Improvement, Series A, Call 9/1/10 @ 102,
5.100% due 9/1/16 (d) | | | 3,218,970 |
| | 3,000,000 | | AAA | | Series A, Call 3/1/09 @ 102, 5.250% due 3/1/18 (d) | | | 3,186,810 |
|
|
| | | | | | Total North Carolina | | | 23,278,180 |
|
|
| | Ohio — 6.6% | | | |
| | 5,450,000 | | AAA | | Butler County, OH, Transportation Improvement District, Series A, Call 4/1/08 @ 102, 5.125% due 4/1/17 (a)(d) | | | 5,712,908 |
| | 1,750,000 | | AAA | | Cleveland, OH, Public Power Systems Revenue, AMBAC-Insured, 5.500% due 11/15/15 | | | 1,883,420 |
See Notes to Financial Statements.
Legg Mason Partners Limited Term Municipals Fund 2006 Annual Report 19
Schedule of Investments (March 31, 2006) (continued)
| | | | | | | | |
| | | |
Face
Amount | | Rating‡ | | Security | | Value |
| | | | | | | | | |
| | Ohio — 6.6% (continued) | | | |
| | | | | | Cuyahoga County, OH, Hospital Facilities Revenue, Canton, Inc. Project: | | | |
| $ | 1,880,000 | | BBB | | 6.750% due 1/1/10 | | $ | 1,970,334 |
| | 3,400,000 | | AA+ | | GO, 5.000% due 12/1/15 | | | 3,644,596 |
| | 2,280,000 | | NR | | Franklin County, OH, Hospital Revenue, Children Hospital Project, 10.375% due 6/1/13 (b) | | | 2,810,830 |
| | 1,500,000 | | Aaa(g) | | Hamilton County, OH, Sales Tax Revenue, Series B, AMBAC-Insured, 5.250% due 12/1/18 | | | 1,584,720 |
| | 1,240,000 | | AAA | | Jackson, OH, Local School District, Stark & Summit Counties, FSA-Insured, 5.000% due 12/1/18 | | | 1,312,751 |
| | 915,000 | | AAA | | Lake County, OH, Hospital Improvement Revenue, Lake County Memorial Hospital Project, 8.625% due 11/1/09 (b) | | | 1,002,099 |
| | 95,000 | | AAA | | Lima, OH, Hospital Revenue, St. Rita Hospital of Lima,
7.500% due 11/1/06 (b) | | | 97,185 |
| | 1,410,000 | | Aaa(g) | | Logan Hocking, OH, Local School District, Construction & Improvement, MBIA-Insured, Call 12/1/11 @ 100, 5.500% due 12/1/16 (d) | | | 1,516,765 |
| | 2,775,000 | | AA | | Montgomery County, OH, Revenue, Catholic Health Initiatives,
5.500% due 9/1/14 | | | 2,961,535 |
| | 5,000,000 | | BBB- | | Ohio State Air Quality Development Authority Revenue, Cleveland Pollution Control, Series A, 6.000% due 12/1/13 (a) | | | 5,195,350 |
| | | | | | Ohio State Building Authority, Series A: | | | |
| | 3,000,000 | | AAA | | Call 10/1/09 @ 101, 5.375% due 10/1/14 (d) | | | 3,194,520 |
| | 3,600,000 | | AAA | | State Facilities-Administration Building Fund, FSA-Insured,
5.500% due 10/1/14 (a) | | | 3,889,512 |
| | | | | | Ohio State Water Development Authority Revenue: | | | |
| | 4,620,000 | | AAA | | 9.375% due 12/1/10 (b) | | | 5,124,735 |
| | 750,000 | | AAA | | Safe Water, Series 3, 9.000% due 12/1/10 (b) | | | 823,943 |
| | 1,960,000 | | AAA | | University of Akron, OH, General Receipts Bonds, AMBAC-Insured,
Call 1/1/07 @ 102, 5.250% due 1/1/17 (d) | | | 2,022,171 |
|
|
| | | | | | Total Ohio | | | 44,747,374 |
|
|
| | Oklahoma — 0.7% | | | |
| | 2,750,000 | | AA | | Oklahoma DFA Revenue, Refunding, St. John’s Health Systems,
5.750% due 2/15/18 | | | 2,935,625 |
| | 1,725,000 | | AAA | | Tulsa, OK, Airport Improvement Trust General Revenue, Series A,
6.000% due 6/1/14 (c) | | | 1,850,994 |
|
|
| | | | | | Total Oklahoma | | | 4,786,619 |
|
|
| | Oregon — 2.0% | | | |
| | 1,000,000 | | AA | | Clackamas County, OR, Hospital Facilities Authority Revenue, Legacy Health System, 5.750% due 5/1/16 | | | 1,080,120 |
| | 1,500,000 | | BBB | | Klamath Falls, OR, Intercommunity Hospital Authority Revenue, Merle West Medical Center Project, 6.125% due 9/1/22 | | | 1,612,605 |
| | 3,320,000 | | Aa2(g) | | Multnomah County, OR, Series A, Call 4/1/10 @ 100,
5.250% due 4/1/14 (d) | | | 3,512,992 |
| | | | | | Oregon State Department Administrative Services Lottery Revenue: | | | |
| | 1,375,000 | | AAA | | Series A, FSA-Insured, Call 4/1/12 @ 100, 5.500% due 4/1/14 (d) | | | 1,498,379 |
| | 3,500,000 | | AAA | | Series B, 5.250% due 4/1/15 | | | 3,678,430 |
See Notes to Financial Statements.
20 Legg Mason Partners Limited Term Municipals Fund 2006 Annual Report
Schedule of Investments (March 31, 2006) (continued)
| | | | | | | | |
| | | |
Face
Amount | | Rating‡ | | Security | | Value |
| | | | | | | | | |
| | Oregon — 2.0% (continued) | | | |
| $ | 2,065,000 | | NR | | Wasco County, OR, Solid Waste Disposal Revenue, Waste Connections Inc. Project, 7.000% due 3/1/12 (c) | | $ | 2,175,539 |
|
|
| | | | | | Total Oregon | | | 13,558,065 |
|
|
| | Pennsylvania — 8.7% | | | |
| | 3,000,000 | | AAA | | Allegheny County, PA, Port Authority Special Revenue, FGIC-Insured, 5.500% due 3/1/16 | | | 3,217,680 |
| | 1,195,000 | | NR | | Berks County Municipal Authority, Phoebe Berks Village Inc. Project,
Call 5/15/06 @ 102, 7.500% due 5/15/13 (d) | | | 1,223,967 |
| | 2,175,000 | | BBB- | | Carbon County, PA, IDA, Panther Creek Partners Project,
6.650% due 5/1/10 (c) | | | 2,296,996 |
| | 2,500,000 | | Aaa(g) | | Central Bucks, PA, School District, FGIC-Insured, 5.500% due 5/15/19 | | | 2,708,450 |
| | 1,070,000 | | A | | Chester County, PA, School Authority, School Lease Revenue,
5.375% due 6/1/17 | | | 1,149,918 |
| | 1,320,000 | | NR | | Dauphin County, PA, General Authority Revenue, Office and Packaging, 5.500% due 1/1/08 | | | 1,305,916 |
| | 3,440,000 | | AAA | | Delaware River Port Authority Pennsylvania and New Jersey, RITES, Series 964, FSA-Insured, 6.808% due 1/1/10 (a)(h) | | | 3,997,005 |
| | 1,750,000 | | AAA | | Greater Johnstown, PA, GO, School District, Series B, MBIA-Insured, 5.375% due 8/1/14 | | | 1,879,412 |
| | 2,000,000 | | AAA | | Pennsylvania State Department of General Services, COP, FSA-Insured, 5.250% due 5/1/16 | | | 2,125,760 |
| | | | | | Pennsylvania State Higher EFA, Health Services Revenue, Series A: | | | |
| | 1,000,000 | | A+ | | Allegheny Delaware Valley Obligation Group, MBIA-Insured, 6.250% due 1/15/18 | | | 1,100,590 |
| | 3,330,000 | | AAA | | University of Pittsburg Medical Center Health System, 5.600% due 11/15/09 | | | 3,467,562 |
| | | | | | Pennsylvania State, Second Series: | | | |
| | 4,000,000 | | AAA | | Call 5/1/12 @ 100, 5.500% due 5/1/15 (a)(d) | | | 4,363,280 |
| | 5,000,000 | | AAA | | Call 10/1/09 @ 101, 5.750% due 10/1/17 (a)(d) | | | 5,385,100 |
| | | | | | Philadelphia, PA: | | | |
| | 2,000,000 | | AAA | | GO, FSA-Insured, 5.250% due 9/15/18 | | | 2,104,680 |
| | | | | | School District: | | | |
| | | | | | Series A, FSA-Insured, Call 2/1/12 @ 100: | | | |
| | 2,000,000 | | AAA | | 5.500% due 2/1/20 (d) | | | 2,174,880 |
| | 1,865,000 | | AAA | | 5.500% due 2/1/21 (d) | | | 2,028,076 |
| | 2,000,000 | | AAA | | Series B, Call 8/1/12 @ 100, 5.625% due 8/1/18 (d) | | | 2,197,420 |
| | | | | | Philadelphia, PA, Authority for Industrial Development: | | | |
| | 1,000,000 | | AAA | | Lease Revenue, Series B, FSA-Insured, 5.500% due 10/1/19 | | | 1,066,530 |
| | 2,000,000 | | AAA | | Series B, 5.500% due 10/1/15 | | | 2,149,320 |
| | | | | | Philadelphia, PA, Gas Works Revenue, Third Series, Call 8/1/11 @ 100: | | | |
| | 1,675,000 | | AAA | | 5.500% due 8/1/17 (d) | | | 1,813,455 |
| | 3,240,000 | | AAA | | FSA-Insured, 5.500% due 8/1/19 (d) | | | 3,507,818 |
| | | | | | Philadelphia, PA, Parking Authority Revenue, Parking Revenue, FSA-Insured: | | | |
| | 2,000,000 | | AAA | | 5.625% due 9/1/15 | | | 2,132,420 |
| | 1,500,000 | | AAA | | 5.625% due 9/1/19 | | | 1,589,445 |
See Notes to Financial Statements.
Legg Mason Partners Limited Term Municipals Fund 2006 Annual Report 21
Schedule of Investments (March 31, 2006) (continued)
| | | | | | | | |
| | | |
Face
Amount | | Rating‡ | | Security | | Value |
| | | | | | | | | |
| | Pennsylvania — 8.7% (continued) | | | |
| $ | 1,140,000 | | NR | | Pittsburgh, PA, Public Parking Authority, Parking Revenue, St, Francis General Hospital, 6.625% due 10/1/12 (b) | | $ | 1,246,795 |
| | 1,445,000 | | AA | | Southcentral, PA, General Authority Revenue, Hanover Hospital Inc., Radian-Insured, 5.500% due 12/1/18 | | | 1,548,303 |
| | 1,000,000 | | AAA | | West View, PA, Municipal Authority, 9.500% due 11/15/14 (b) | | | 1,261,280 |
| | 480,000 | | AAA | | Westmoreland County, PA, Municipal Authority, Special Obligation, 9.125% due 7/1/10 (b) | | | 512,554 |
|
|
| | | | | | Total Pennsylvania | | | 59,554,612 |
|
|
| | Puerto Rico — 0.3% | | | |
| | 2,100,000 | | AAA | | Puerto Rico Highway and Transportation Authority Highway Revenue, Refunding, Series AA, 5.000% due 7/1/10 (i)(j) | | | 2,201,871 |
|
|
| | Rhode Island — 0.6% | | | |
| | 1,000,000 | | AAA | | Cranston, RI, FGIC-Insured, Call 11/15/09 @ 101, 6.375% due 11/15/14 (d) | | | 1,100,140 |
| | 1,000,000 | | AAA | | Providence, RI, Public Building Authority, General Revenue, Series A, MBIA-Insured, 5.375% due 12/15/21 | | | 1,070,920 |
| | 2,000,000 | | Aaa (g) | | Woonsocket, RI, GO, FGIC-Insured, 5.375% due 10/1/20 | | | 2,132,100 |
|
|
| | | | | | Total Rhode Island | | | 4,303,160 |
|
|
| | South Carolina — 1.5% | | | |
| | 905,000 | | AAA | | Charleston, SC, Waterworks & Sewer Revenue, 10.375% due 1/1/10 (b) | | | 1,031,202 |
| | | | | | Greenville County, SC, School District Installment Purchase Revenue, Building Equity Sooner for Tomorrow, Call 12/1/12 @ 101: | | | |
| | 1,000,000 | | AA- | | 5.875% due 12/1/19 (d) | | | 1,122,470 |
| | 3,000,000 | | AA- | | 6.000% due 12/1/21 (d) | | | 3,334,474 |
| | 4,530,000 | | AAA | | South Carolina Transportation Infrastructure Bank Revenue, Series A,
Call 10/1/08 @ 101, 5.000% due 10/1/15 (a)(d) | | | 4,724,428 |
|
|
| | | | | | Total South Carolina | | | 10,212,574 |
|
|
| | South Dakota — 0.4% | | | |
| | 2,635,000 | | Aa2(g) | | Minnehaha County, SD, Limited Tax Certificates,
Call 12/1/10 @ 100, 5.625% due 12/1/19 (d) | | | 2,824,351 |
|
|
| | Tennessee — 1.6% | | | |
| | 5,000,000 | | AAA | | Elizabethton, TN, Health & Educational Facilities Board Revenue, Series B, 5.750% due 7/1/23 (a) | | | 5,369,850 |
| | 255,000 | | Aaa(g) | | Greeneville, TN, Health & Educational Facilities Board, Hospital Revenue, Southern Adventist Health System, 8.700% due 10/1/09 (b) | | | 278,835 |
| | 2,000,000 | | A | | Memphis, TN, General Improvement, Call 4/1/08 @ 101,
5.250% due 4/1/16 (d) | | | 2,080,640 |
| | | | | | Memphis-Shelby County, TN: | | | |
| | 1,000,000 | | AAA | | Airport Authority, Airport Revenue, Series D, AMBAC-Insured,
6.250% due 3/1/14 (c) | | | 1,086,860 |
| | 2,000,000 | | AAA | | Sports Authority Inc. Revenue, Memphis Arena Project, Series A, 5.500% due 11/1/18 | | | 2,185,100 |
|
|
| | | | | | Total Tennessee | | | 11,001,285 |
|
|
See Notes to Financial Statements.
22 Legg Mason Partners Limited Term Municipals Fund 2006 Annual Report
Schedule of Investments (March 31, 2006) (continued)
| | | | | | | | |
| | | |
Face
Amount | | Rating‡ | | Security | | Value |
| | | | | | | | | |
| | Texas — 10.4% | | | |
| | | | | | Austin, TX: | | | |
| $ | 1,000,000 | | BBB- | | Convention Enterprises Inc., Convention Center, First Tier, Series A, 6.600% due 1/1/21 | | $ | 1,061,050 |
| | 2,620,000 | | AA+ | | Public Improvement, Call 9/1/09 @ 100, 5.500% due 9/1/19 (d) | | | 2,769,497 |
| | 700,000 | | Aaa(g) | | Bexar County, TX, Housing Finance Corp. MFH Revenue, Series A, The Waters At Northern Hill Apartments, MBIA-Insured,
5.800% due 8/1/21 | | | 704,200 |
| | 2,000,000 | | AAA | | Bexar County, TX, Metropolitan Water District Waterworks, AMBAC-Insured, Call 5/1/15 @ 100, 5.000% due 5/1/19 (d) | | | 2,133,600 |
| | 40,000 | | AAA | | Brownsville, TX, Utilities Systems Revenue, AMBAC-Insured,
9.400% due 1/1/13 (b) | | | 47,847 |
| | 3,000,000 | | CCC | | Dallas-Fort Worth, TX, International Airport Facility, Improvement Corp. Revenue, Refunding, American Airlines, Series C,
6.150% due 11/1/07 (c)(i)(j) | | | 2,969,010 |
| | 2,370,000 | | AAA | | Duncanville, TX, Hospital Authority, Methodist Hospitals of Dallas Project, 9.000% due 1/1/10 (b) | | | 2,628,496 |
| | | | | | El Paso County, TX, Housing Finance Corp.: | | | |
| | 415,000 | | A3(g) | | La Plaza Apartments, 6.700% due 7/1/20 | | | 430,758 |
| | | | | | MFH Revenue, Series A, American Village Communities: | | | |
| | 1,250,000 | | A3(g) | | 6.250% due 12/1/20 | | | 1,287,525 |
| | 1,000,000 | | A3(g) | | 6.250% due 12/1/24 | | | 1,022,800 |
| | | | | | Fort Bend, TX, ISD, PSFG: | | | |
| | 390,000 | | AAA | | 5.500% due 2/15/16 | | | 408,443 |
| | 610,000 | | AAA | | Call 2/15/09 @ 100, 5.500% due 2/15/16 (d) | | | 640,707 |
| | 2,000,000 | | AA | | Fort Worth, TX, Water & Sewer Revenue, Call 2/15/12 @ 100,
5.625% due 2/15/18 (d) | | | 2,183,480 |
| | 1,000,000 | | AAA | | Grand Prairie, TX, Housing Finance Corp., MFH Revenue, Landings of Carrier Project, Series A, GNMA-Collateralized, 6.750% due 9/20/32 | | | 1,109,250 |
| | 5,000,000 | | BBB- | | Gulf Coast of Texas, IDA, Solid Waste Disposal Revenue, CITGO Petroleum Corp. Project, 7.500% due 9/30/12 (a)(c)(i)(j) | | | 5,527,850 |
| | | | | | Harlandale, TX: | | | |
| | 10,000 | | AAA | | GO, ISD, Refunding, PSFG-Insured, Unrefunded Balance,
6.000% due 8/15/16 | | | 10,876 |
| | 990,000 | | AAA | | ISD, Refunding, PSFG-Insured, Call 8/15/10 @ 100,
6.000% due 8/15/16 (d) | | | 1,078,377 |
| | | | | | Harris County, TX, Houston Sports Authority Revenue, Series G: | | | |
| | 1,125,000 | | AAA | | 5.250% due 11/15/16 | | | 1,193,265 |
| | 3,000,000 | | AAA | | MBIA-Insured, 5.750% due 11/15/19 | | | 3,242,610 |
| | 3,410,000 | | AAA | | Houston, TX, Airport Systems Revenue, 9.500% due 7/1/10 (a)(b) | | | 3,836,420 |
| | | | | | Houston, TX, FSA-Insured: | | | |
| | 910,000 | | AAA | | Call 9/1/10 @ 100, 5.750% due 3/1/18 (d) | | | 979,033 |
| | 90,000 | | AAA | | Unrefunded Balance, 5.750% due 3/1/18 | | | 96,714 |
| | 4,000,000 | | AAA | | Houston, TX, ISD, Refunding, Series A, Call 2/15/09 @ 100, 5.250% due 2/15/18 (a)(d) | | | 4,174,400 |
| | | | | | Houston, TX, Water & Sewer Systems Revenue, Refunding, Jr. Lien: | | | |
| | 1,000,000 | | AAA | | Series A, FSA-Insured, 5.500% due 12/1/17 | | | 1,077,820 |
See Notes to Financial Statements.
Legg Mason Partners Limited Term Municipals Fund 2006 Annual Report 23
Schedule of Investments (March 31, 2006) (continued)
| | | | | | | | |
| | | |
Face
Amount | | Rating‡ | | Security | | Value |
| | | | | | | | | |
| | Texas — 10.4% (continued) | | | |
| $ | 4,545,000 | | AAA | | Series B, Call 12/1/10 @ 100, 5.750% due 12/1/16 (a)(d) | | $ | 4,927,734 |
| | 2,765,000 | | NR | | Midlothian, TX, Development Authority Tax, Increment Contact Revenue, 7.875% due 11/15/21 | | | 3,057,979 |
| | | | | | Midlothian, TX, ISD: | | | |
| | 3,455,000 | | Aaa(g) | | GO, Call 2/15/07 @ 54.303, PSF-GTD-Insured, zero coupon bond to yield 6.166% due 2/15/17 (d) | | | 1,817,848 |
| | 60,000 | | Aaa(g) | | Unrefunded Balance, Refunding, PSF-GTD-Insured, zero coupon bond to yield 6.166% due 2/15/17 | | | 31,583 |
| | 1,800,000 | | AAA | | Montgomery, TX, GO, ISD, PSFG, 5.500% due 2/15/17 | | | 1,923,858 |
| | 1,230,000 | | A | | North Forest ISD, ACA-Insured, 6.500% due 8/15/17 | | | 1,412,557 |
| | 755,000 | | Aaa(g) | | Panhandle, TX, Regional Housing Finance, Series A, GNMA-Collateralized, 6.500% due 7/20/21 | | | 835,219 |
| | 525,000 | | AAA | | Southeast Texas HFA, Memorial Hospital System Project,
8.500% due 12/1/08 (b) | | | 564,580 |
| | | | | | Tarrant County, TX, Health Facilities Development Corp., Hospital Revenue: | | | |
| | 4,000,000 | | AA- | | Baylor Health Care Systems Project, 5.750% due 11/15/19 (a) | | | 4,371,360 |
| | 2,000,000 | | A2(g) | | Call 11/15/10 @ 101, 6.625% due 11/15/20 (d) | | | 2,257,260 |
| | 110,000 | | AAA | | Tarrant County, TX, Hospital Authority Revenue, St. Joseph Hospital Project, 8.750% due 2/1/10 (b) | | | 121,956 |
| | 2,000,000 | | AAA | | Texas Technical University Revenue Financing System, Seventh Series, MBIA-Insured, Call 2/15/12 @ 100, 5.500% due 8/15/18 (d) | | | 2,175,940 |
| | 3,500,000 | | AAA | | Texas Water Development Board Revenue, Revolving Fund, Senior Lien, Series B, 5.250% due 7/15/17 | | | 3,676,820 |
| | 2,000,000 | | AAA | | University of Texas Revenue Financing System, Series B, Call 8/15/11 @ 100, 5.375% due 8/15/18 (d) | | | 2,154,400 |
| | 1,000,000 | | AAA | | Wichita Falls, TX, Water & Sewer Revenue, Priority Lien, AMBAC-Insured,
5.375% due 8/1/19 | | | 1,064,780 |
|
|
| | | | | | Total Texas | | | 71,007,902 |
|
|
| | Utah — 1.6% | | | |
| | 2,000,000 | | Aaa(g) | | Davis County, UT, School District, School Board Guarantee Program, Refunding, Series B, 5.000% due 6/1/16 | | | 2,148,180 |
| | | | | | Intermountain Power Agency Utah: | | | |
| | 830,000 | | AAA | | Power Supply Revenue, Series B, Call 7/1/07 @ 102, MBIA-Insured, 5.750% due 7/1/19 (d) | | | 867,782 |
| | 1,670,000 | | AAA | | Unrefunded, Series B, MBIA-Insured, 5.750% due 7/1/19 | | | 1,744,766 |
| | | | | | Provo, UT, Electric Revenue: | | | |
| | 895,000 | | AAA | | 10.125% due 4/1/15 (b) | | | 1,136,918 |
| | 970,000 | | AAA | | MBIA-Insured, 10.125% due 4/1/15 (b) | | | 1,232,191 |
| | 10,000 | | AAA | | Series A, AMBAC-Insured, 10.375% due 9/15/15 (b) | | | 13,067 |
| | 1,500,000 | | AAA | | Salt Lake County, UT, Hospital Revenue, IHC Health Services, Inc., AMBAC-Insured, 5.500% due 5/15/13 | | | 1,608,780 |
| | | | | | Spanish Fork City, UT, Water Revenue: | | | |
| | 240,000 | | Aaa(g) | | FSA-Insured, Call 6/1/12 @ 100, 5.500% due 6/1/17 (d) | | | 262,056 |
| | 760,000 | | Aaa(g) | | Unrefunded Balance, FSA-Insured, 5.500% due 6/1/17 | | | 822,905 |
See Notes to Financial Statements.
24 Legg Mason Partners Limited Term Municipals Fund 2006 Annual Report
Schedule of Investments (March 31, 2006) (continued)
| | | | | | | | |
| | | |
Face
Amount | | Rating‡ | | Security | | Value |
| | | | | | | | | |
| | Utah — 1.6% (continued) | | | |
| $ | 1,000,000 | | AAA | | Utah State Board Regents, Utah State University Hospital, MBIA-Insured, Call 8/1/11 @ 100, 5.500% due 8/1/18 (d) | | $ | 1,082,660 |
|
|
| | | | | | Total Utah | | | 10,919,305 |
|
|
| | Vermont — 0.2% | | | |
| | 1,415,000 | | BBB+ | | Vermont Educational & Health Buildings Financing Agency Revenue, Developmental & Mental Health, Series A, 5.500% due 6/15/12 | | | 1,435,617 |
|
|
| | Virginia — 2.2% | | | |
| | 1,445,000 | | AA | | Chesapeake, VA, GO, Public Improvement, 5.500% due 12/1/17 | | | 1,548,375 |
| | 1,305,000 | | AA | | Fauquier County, VA, IDA, Hospital Revenue, Fauquier Hospital Foundation Inc., Radian-Insured, 5.500% due 10/1/15 | | | 1,429,784 |
| | 1,000,000 | | AAA | | Harrisonburg, VA, Redevelopment & Housing Authority, MFH Revenue, Greens of Salem Run Project, FSA-Insured, 6.000% due 4/1/12 (c) | | | 1,035,060 |
| | 750,000 | | A | | Norton, VA, IDA Hospital Revenue, Norton Community Hospital,
ACA-Insured, 6.000% due 12/1/22 | | | 795,585 |
| | 1,750,000 | | AA+ | | Virginia State Public Building Authority, Public Facilities Revenue,
Series A, Call 8/1/10 @ 100, 5.750% due 8/1/20 (d) | | | 1,887,638 |
| | 5,035,000 | | AAA | | Virginia State Resources Authority, Clean Water Reserve, Revolving Fund, Call 10/1/10 @ 100, 5.400% due 10/1/18 (a)(d) | | | 5,383,875 |
| | 3,000,000 | | BBB | | York County, VA, IDA, PCR, Virginia Electrical & Power Co., Remarketed 11/8/02, 5.500% due 7/1/09 | | | 3,064,830 |
|
|
| | | | | | Total Virginia | | | 15,145,147 |
|
|
| | Washington — 1.4% | | | |
| | 4,000,000 | | AAA | | Energy Northwest Washington Electric Revenue, Refunding,
Project No. 1, Series A, 5.500% due 7/1/14 (a) | | | 4,307,520 |
| | 2,000,000 | | AAA | | Pierce County, WA, School District North 10 Tacoma, FGIC-Insured,
Call 12/1/11 @ 100, 5.375% due 12/1/14 (d) | | | 2,162,020 |
| | | | | | Radford Court Properties, WA, Student Housing Revenue, MBIA-Insured: | | | |
| | 1,695,000 | | AAA | | 6.000% due 6/1/17 | | | 1,849,448 |
| | 1,000,000 | | AAA | | 5.375% due 6/1/19 | | | 1,060,200 |
|
|
| | | | | | Total Washington | | | 9,379,188 |
|
|
| | Wisconsin — 0.7% | | | |
| | 115,000 | | AAA | | Oshkosh, WI, Hospital Facility Revenue, Mercy Medical Center,
Call 7/1/07 @ 100, 7.375% due 7/1/09 (d) | | | 118,958 |
| | | | | | Wisconsin State HEFA Revenue: | | | |
| | 1,000,000 | | A- | | Agnesian Health Care, Inc., 6.000% due 7/1/17 | | | 1,062,050 |
| | 1,500,000 | | A | | Wheaton Franciscan Services, Inc., 6.000% due 8/15/15 | | | 1,637,580 |
| | 2,000,000 | | AA- | | Wisconsin State, Series B, Call 5/1/11 @ 100, 5.500% due 5/1/14 (d) | | | 2,158,320 |
|
|
| | | | | | Total Wisconsin | | | 4,976,908 |
|
|
| | | | | | TOTAL MUNICIPAL BONDS
(Cost — $646,507,163) | | | 663,015,807 |
|
|
See Notes to Financial Statements.
Legg Mason Partners Limited Term Municipals Fund 2006 Annual Report 25
Schedule of Investments (March 31, 2006) (continued)
| | | | | | | | |
| | | |
Face
Amount | | Rating‡ | | Security | | Value |
| | CONVERTIBLE BOND — 0.1% | | | |
| | Airlines — 0.1% | | | |
| $ | 791,350 | | NR | | UAL Corp., 5.000% due 2/1/21 (Cost — $759,274) | | $ | 866,528 |
|
|
| | | | | | TOTAL INVESTMENTS BEFORE SHORT-TERM INVESTMENTS
(Cost — $647,266,437) | | | 663,882,335 |
|
|
| | SHORT-TERM INVESTMENTS(m) — 0.6% | | | |
| | Georgia — 0.1% | | | |
| | 400,000 | | A-1+ | | Burke County, GA, Development Authority, PCR, Oglethorpe Power Corp., Vogtle, AMBAC-Insured, SPA-JPMorgan Chase,
3.180%, 4/3/06 | | | 400,000 |
|
|
| | Texas — 0.5% | | | |
| | 3,100,000 | | A-1+ | | Harris County, TX, Health Facilities Development Corp. Revenue, Refunding, The Methodist Hospital Systems, Series B, 3.170%, 4/3/06 | | | 3,100,000 |
| | 300,000 | | A-1+ | | Texas Water Development Board Revenue, Refunding, State Revolving Fund, SPA-JPMorgan Chase, 3.130%, 4/3/06 | | | 300,000 |
|
|
| | | | | | Total Texas | | | 3,400,000 |
|
|
| | | | | | TOTAL SHORT-TERM INVESTMENTS (Cost — $3,800,000) | | | 3,800,000 |
|
|
| | | | | | TOTAL INVESTMENTS — 97.8% (Cost — $651,066,437#) | | | 667,682,335 |
| | | | | | Other Assets in Excess of Liabilities — 2.2% | | | 15,063,743 |
|
|
| | | | | | TOTAL NET ASSETS — 100.0% | | $ | 682,746,078 |
|
|
| ‡ | | All ratings are by Standard & Poor’s Ratings Service, unless otherwise noted. All ratings are unaudited. |
| (a) | | All or a portion of this security is segregated for open futures contracts. |
| (b) | | Bonds are escrowed to maturity by government securities and/or U.S. government agency securities and are considered by the Manager to be triple-A rated even if issuer has not applied for new ratings. |
| (c) | | Income from this issue is considered a preference item for purposes of calculating the alternative minimum tax (“AMT”). |
| (d) | | Pre-Refunded bonds are escrowed with government obligations and/or government agency securities and are considered by the Manager to be triple-A rated even if issuer has not applied for new ratings. |
| (e) | | Security is valued in good faith at fair value by or under the direction of the Board of Trustees (See Note 1). |
| (f) | | Security is currently in default. |
| (g) | | Rating by Moody’s Investors Service. All ratings are unaudited. |
| (h) | | Residual interest tax-exempt securities—coupon varies inversely with level of short-term tax-exempt interest rates. |
| (i) | | Maturity date shown represents the mandatory tender date. |
| (j) | | Variable rate security. Interest rate disclosed is that which is in effect at March 31, 2006. |
| (k) | | All or a portion of this security is held at the broker as collateral for open futures contracts. |
| (l) | | Rating by Fitch Ratings Service. All ratings are unaudited. |
| (m) | | Variable rate demand obligations have a demand feature under which the Fund can tender them back to the issuer on no more than 7 days notice. Date shown is the date of the next interest rate change. |
| # | | Aggregate cost for federal income tax purposes is $651,257,664. |
See pages 28 and 29 for definitions of ratings.
See Notes to Financial Statements.
26 Legg Mason Partners Limited Term Municipals Fund 2006 Annual Report
Schedule of Investments (March 31, 2006) (continued)
| | |
|
Abbreviations used in this schedule:
|
| ACA | | — American Capital Assurance |
| AMBAC | | — Ambac Assurance Corporation |
| CBI | | — Certificate of Bond Insurance |
| COP | | — Certificate of Participation |
| DFA | | — Development Finance Agency |
| EDA | | — Economic Development Authority |
| EFA | | — Educational Facilities Authority |
| FGIC | | — Financial Guaranty Insurance Company |
| FHA | | — Federal Housing Administration |
| FNMA | | — Federal National Mortgage Association |
| FSA | | — Financial Security Assurance |
| GAN | | — Grant Anticipation Notes |
| GNMA | | — Government National Mortgage Association |
| GO | | — General Obligation |
| GTD | | — Guaranteed |
| HDC | | — Housing Development Corporation |
| HEFA | | — Health & Educational Facilities Authority |
| HFA | | — Housing Finance Authority |
| IBC | | — Insured Bond Certificates |
| IDA | | — Industrial Development Authority |
| IFA | | — Industrial Finance Agency |
| INDLC | | — Industrial Indemnity Company |
| ISD | | — Independent School District |
| MBIA | | — Municipal Bond Investors Assurance Corporation |
| MFH | | — Multi — Family Housing |
| PCR | | — Pollution Control Revenue |
| PSF | | — Permanent School Fund |
| PSFG | | — Permanent School Fund Guaranty |
| Q-SBLF | | — Qualified School Bond Loan Fund |
| RITES | | — Residual Interest Tax — Exempt Securities |
| Radian | | — Radian Assets Assurance |
| SPA | | — Standby Bond Purchase Agreement |
| USD | | — Unified School District |
| VA | | — Veterans Administration |
| XLCA | | — XL Capital Assurance |
Summary of Investments by Industry* (unaudited)
| | | |
Pre-Refunded | | 30.4 | % |
Hospitals | | 11.5 | |
Escrowed to Maturity | | 9.7 | |
Transportation | | 7.3 | |
Education | | 6.6 | |
General Obligation | | 6.6 | |
Utilities | | 4.6 | |
Public Facilities | | 4.6 | |
Water & Sewer | | 4.0 | |
Miscellaneous | | 3.6 | |
Tax Allocation | | 2.8 | |
Other | | 8.3 | |
|
|
| | | 100.0 | % |
|
|
| * | | As a percentage of total investments. Please note the Fund holdings as at March 31, 2006 are subject to change. |
See Notes to Financial Statements.
Legg Mason Partners Limited Term Municipals Fund 2006 Annual Report 27
Bond Ratings (unaudited)
The definitions of the applicable rating symbols are set forth below:
Standard & Poor’s Ratings Service (“Standard & Poor’s”) — Ratings from “AA” to “CCC” may be modified by the addition of a plus (+) or minus (–) sign to show relative standings within the major rating categories.
AAA | — Bonds rated “AAA” have the highest rating assigned by Standard & Poor’s. Capacity to pay interest and repay principal is extremely strong. |
AA | — Bonds rated “AA” have a very strong capacity to pay interest and repay principal and differ from the highest rated issues only in a small degree. |
A | — Bonds rated “A” have a strong capacity to pay interest and repay principal although they are somewhat more susceptible to the adverse effects of changes in circumstances and economic conditions than debt in higher rated categories. |
BBB | — Bonds rated “BBB” are regarded as having an adequate capacity to pay interest and repay principal. Whereas they normally exhibit adequate protection parameters, adverse economic conditions or changing circumstances are more likely to lead to a weakened capacity to pay interest and repay principal for bonds in this category than in higher rated categories. |
BB, B,
CCC,
CC and C | — Bonds rated “BB”, “B”, “CCC”, “CC” and “C” are regarded, on balance, as predominantly speculative with respect to capacity to pay interest and repay principal in accordance with the terms of the obligation. “BB” represents the lowest degree of speculation and “C” the highest degree of speculation. While such bonds will likely have some quality and protective characteristics, these are outweighed by large uncertainties or major risk exposures to adverse conditions. |
D | — Bonds rated “D” are in default and payment of interest and/or repayment of principal is in arrears. |
Moody’s Investors Service (“Moody’s”) — Numerical modifiers 1, 2 and 3 may be applied to each generic rating from “Aa” to “Caa”, where 1 is the highest and 3 the lowest ranking within its generic category.
Aaa | — Bonds rated “Aaa” are judged to be of the best quality. They carry the smallest degree of investment risk and are generally referred to as “gilt edge.” Interest payments are protected by a large or by an exceptionally stable margin and principal is secure. While the various protective elements are likely to change, such changes as can be visualized are most unlikely to impair the fundamentally strong position of such issues. |
Aa | — Bonds rated “Aa” are judged to be of high quality by all standards. Together with the “Aaa” group they comprise what are generally known as high grade bonds. They are rated lower than the best bonds because margins of protection may not be as large as in “Aaa” securities or fluctuation of protective elements may be of greater amplitude or there may be other elements present which make the long-term risks appear somewhat larger than in “Aaa” securities. |
A | — Bonds rated “A” possess many favorable investment attributes and are to be considered as upper medium grade obligations. Factors giving security to principal and interest are considered adequate but elements may be present which suggest a susceptibility to impairment some time in the future. |
Baa | — Bonds rated “Baa” are considered as medium grade obligations, i.e., they are neither highly protected nor poorly secured. Interest payments and principal security appear adequate for the present but certain protective elements may be lacking or may be characteristically unreliable over any great length of time. Such bonds lack outstanding investment characteristics and in fact have speculative characteristics as well. |
Ba | — Bonds rated “Ba” are judged to have speculative elements; their future cannot be considered as well assured. Often the protection of interest and principal payments may be very moderate and therefore not well safeguarded during both good and bad times over the future. Uncertainty of position characterizes bonds in this class. |
B | — Bonds rated “B” are generally lack characteristics of desirable investments. Assurance of interest and principal payments or of maintenance of other terms of the contract over any long period of time may be small. |
Caa | — Bonds rated “Caa” are of poor standing. These may be in default, or present elements of danger may exist with respect to principal or interest. |
Ca | — Bonds rated “Ca” represent obligations which are speculative in a high degree. Such issues are often in default or have other marked short-comings. |
C | — Bonds rated “C” are the lowest class of bonds and issues so rated can be regarded as having extremely poor prospects of ever attaining any real investment standing. |
28 Legg Mason Partners Limited Term Municipals Fund 2006 Annual Report
Bond Ratings (unaudited) (continued)
Fitch Ratings Service (“Fitch”) — Ratings from “AA” to “CCC” may be modified by the addition of a plus (+) or minus (–) sign to show relative standings within the major rating categories.
AAA | — Bonds rated “AAA” have the highest rating assigned by Fitch. Capacity to pay interest and repay principal is extremely strong. |
AA | — Bonds rated “AA” have a very strong capacity to pay interest and repay principal and differ from the highest rated issues only in a small degree. |
A | — Bonds rated “A” have a strong capacity to pay interest and repay principal although they are somewhat more susceptible to the adverse effects of changes in circumstances and economic conditions than debt in higher rated categories. |
BBB | — Bonds rated “BBB” are regarded as having an adequate capacity to pay interest and repay principal. Whereas they normally exhibit adequate protection parameters, adverse economic conditions or changing circumstances are more likely to lead to a weakened capacity to pay interest and repay principal for bonds in this category than in higher rated categories. |
BB, B,
CCC
and CC | — Bonds rated “BB”, “B”, “CCC” and “CC” are regarded, on balance, as predominantly speculative with respect to capacity to pay interest and repay principal in accordance with the terms of the obligation. “BB” represents a lower degree of speculation than “B”, and “CC” the highest degree of speculation. While such bonds will likely have some quality and protective characteristics, these are outweighed by large uncertainties or major risk exposures to adverse conditions. |
NR | — Indicates that the bond is not rated by Standard & Poor’s, Moody’s, or Fitch. |
Short-Term Security Ratings (unaudited)
SP-1 | — Standard & Poor’s highest rating indicating very strong or strong capacity to pay principal and interest; those issues determined to possess overwhelming safety characteristics are denoted with a plus (+) sign. |
A-1 | — Standard & Poor’s highest commercial paper and variable-rate demand obligation (VRDO) rating indicating that the degree of safety regarding timely payment is either overwhelming or very strong; those issues determined to possess overwhelming safety characteristics are denoted with a plus (+) sign. |
VMIG 1 | — Moody’s highest rating for issues having a demand feature — VRDO. |
P-1 | — Moody’s highest rating for commercial paper and for VRDO prior to the advent of the VMIG 1 rating. |
F-1 | — Fitch’s highest rating indicating the strongest capacity for timely payment of financial commitments; those issues determined to possess overwhelming strong credit feature are denoted with a plus (+) sign. |
Legg Mason Partners Limited Term Municipals Fund 2006 Annual Report 29
Statement of Assets and Liabilities (March 31, 2006)
| | | | |
| ASSETS: | | | | |
Investments, at value (Cost — $651,066,437) | | $ | 667,682,335 | |
Cash | | | 7,057,254 | |
Interest receivable | | | 11,370,428 | |
Receivable for Fund shares sold | | | 1,080,307 | |
Receivable for securities sold | | | 695,000 | |
Other assets | | | 65,000 | |
Prepaid expenses | | | 42,171 | |
|
|
Total Assets | | | 687,992,495 | |
|
|
| LIABILITIES: | | | | |
Payable for Fund shares repurchased | | | 3,806,618 | |
Distributions payable | | | 770,912 | |
Investment management fee payable | | | 293,790 | |
Payable to broker — variation margin on open futures contracts | | | 161,719 | |
Distribution fees payable | | | 103,658 | |
Deferred compensation payable | | | 12,608 | |
Trustees’ fees payable | | | 1,685 | |
Accrued expenses | | | 95,427 | |
|
|
Total Liabilities | | | 5,246,417 | |
|
|
Total Net Assets | | $ | 682,746,078 | |
|
|
| NET ASSETS: | | | | |
Par value (Note 6) | | $ | 107,825 | |
Paid-in capital in excess of par value | | | 716,751,235 | |
Undistributed net investment income | | | 165,134 | |
Accumulated net realized loss on investments and futures contracts | | | (51,961,358 | ) |
Net unrealized appreciation on investments and futures contracts | | | 17,683,242 | |
|
|
Total Net Assets | | $ | 682,746,078 | |
|
|
Shares Outstanding: | | | | |
Class A | | | 63,862,172 | |
| |
Class B | | | 631,818 | |
| |
Class C | | | 40,000,180 | |
| |
Class O | | | 3,331,166 | |
| |
Net Asset Value: | | | | |
Class A (and redemption price) | | | $6.33 | |
| |
Class B * | | | $6.32 | |
| |
Class C (and redemption price) | | | $6.34 | |
| |
Class O * | | | $6.34 | |
| |
Maximum Public Offering Price Per Share: | | | | |
Class A (based on maximum sales charge of 2.00%) | | | $6.46 | |
|
|
| * | | Redemption price is NAV of Class B and O shares reduced by a 5.00% and 1.00% CDSC, respectively, if shares are redeemed within one year from purchase payment (See Note 2). |
See Notes to Financial Statements.
30 Legg Mason Partners Limited Term Municipals Fund 2006 Annual Report
Statement of Operations (For the year ended March 31, 2006)
| | | | |
| INVESTMENT INCOME: | | | | |
Interest | | $ | 35,746,638 | |
|
|
| EXPENSES: | | | | |
Investment management fee (Note 2) | | | 3,769,915 | |
Distribution fees (Notes 2 and 4) | | | 2,965,202 | |
Transfer agent fees (Notes 2 and 4) | | | 149,753 | |
Registration fees | | | 84,107 | |
Custody fees | | | 76,127 | |
Shareholder reports (Note 4) | | | 57,878 | |
Legal fees | | | 24,878 | |
Insurance | | | 24,480 | |
Audit and tax | | | 21,372 | |
Trustees’ fees | | | 11,326 | |
Miscellaneous expenses | | | 9,553 | |
|
|
Total Expenses | | | 7,194,591 | |
Less: Fee waivers and/or expense reimbursements (Note 2) | | | (15,643 | ) |
|
|
Net Expenses | | | 7,178,948 | |
|
|
Net Investment Income | | | 28,567,690 | |
|
|
REALIZED AND UNREALIZED GAIN (LOSS) ON
INVESTMENTS AND FUTURES CONTRACTS
(NOTES 1 AND 3): | | | | |
Net Realized Loss From: | | | | |
Investment transactions | | | (3,327,692 | ) |
Futures contracts | | | (2,345,922 | ) |
|
|
Net Realized Loss | | | (5,673,614 | ) |
|
|
Change in Net Unrealized Appreciation/Depreciation From: | | | | |
Investments | | | (4,184,025 | ) |
Futures contracts | | | 88,511 | |
|
|
Change in Net Unrealized Appreciation/Depreciation | | | (4,095,514 | ) |
|
|
Net Loss on Investments and Futures Contracts | | | (9,769,128 | ) |
|
|
Increase in Net Assets From Operations | | $ | 18,798,562 | |
|
|
See Notes to Financial Statements.
Legg Mason Partners Limited Term Municipals Fund 2006 Annual Report 31
Statements of Changes in Net Assets (For the years ended March 31,)
| | | | | | | | |
| | |
| | | 2006 | | | 2005 | |
| OPERATIONS: | | | | | | | | |
Net investment income | | $ | 28,567,690 | | | $ | 29,983,145 | |
Net realized loss | | | (5,673,614 | ) | | | (11,889,662 | ) |
Change in net unrealized appreciation/depreciation | | | (4,095,514 | ) | | | (8,389,733 | ) |
|
|
Increase in Net Assets From Operations | | | 18,798,562 | | | | 9,703,750 | |
|
|
DISTRIBUTIONS TO SHAREHOLDERS
FROM (NOTES 1 AND 5): | | | | | | | | |
Net investment income | | | (29,386,994 | ) | | | (29,762,364 | ) |
|
|
Decrease in Net Assets From
Distributions to Shareholders | | | (29,386,994 | ) | | | (29,762,364 | ) |
|
|
| FUND SHARE TRANSACTIONS (NOTE 6): | | | | | | | | |
Net proceeds from sale of shares | | | 272,364,021 | | | | 322,569,099 | |
Reinvestment of distributions | | | 19,024,705 | | | | 18,426,303 | |
Cost of shares repurchased | | | (367,784,483 | ) | | | (324,434,811 | ) |
|
|
Increase (Decrease) in Net Assets From Fund Share Transactions | | | (76,395,757 | ) | | | 16,560,591 | |
|
|
Decrease in Net Assets | | | (86,984,189 | ) | | | (3,498,023 | ) |
NET ASSETS: | | | | | | | | |
Beginning of year | | | 769,730,267 | | | | 773,228,290 | |
|
|
End of year* | | $ | 682,746,078 | | | $ | 769,730,267 | |
|
|
* Includes undistributed net investment income of: | | | $165,134 | | | | $992,664 | |
|
|
See Notes to Financial Statements.
32 Legg Mason Partners Limited Term Municipals Fund 2006 Annual Report
Financial Highlights
For a share of each class of beneficial interest outstanding throughout each year ended March 31:
| | | | | | | | | | | | | | | | | | | | |
| | | | |
| | | | | |
| Class A Shares(1) | | 2006 | | | 2005 | | | 2004 | | | 2003 | | | 2002 | |
Net Asset Value, Beginning of Year | | $ | 6.42 | | | $ | 6.59 | | | $ | 6.57 | | | $ | 6.40 | | | $ | 6.51 | |
|
|
Income (Loss) From Operations: | | | | | | | | | | | | | | | | | | | | |
Net investment income | | | 0.26 | | | | 0.28 | | | | 0.29 | | | | 0.31 | | | | 0.34 | |
Net realized and unrealized gain (loss) | | | (0.09 | ) | | | (0.17 | ) | | | 0.01 | | | | 0.17 | | | | (0.10 | ) |
|
|
Total Income From Operations | | | 0.17 | | | | 0.11 | | | | 0.30 | | | | 0.48 | | | | 0.24 | |
|
|
Less Distributions From: | | | | | | | | | | | | | | | | | | | | |
Net investment income | | | (0.26 | ) | | | (0.28 | ) | | | (0.28 | ) | | | (0.31 | ) | | | (0.35 | ) |
|
|
Total Distributions | | | (0.26 | ) | | | (0.28 | ) | | | (0.28 | ) | | | (0.31 | ) | | | (0.35 | ) |
|
|
Net Asset Value, End of Year | | $ | 6.33 | | | $ | 6.42 | | | $ | 6.59 | | | $ | 6.57 | | | $ | 6.40 | |
|
|
Total Return(2) | | | 2.78 | % | | | 1.68 | % | | | 4.67 | % | | | 7.64 | % | | | 3.70 | % |
|
|
Net Assets, End of Year (millions) | | | $404 | | | | $403 | | | | $376 | | | | $364 | | | | $284 | |
|
|
Ratios to Average Net Assets: | | | | | | | | | | | | | | | | | | | | |
Gross expenses | | | 0.70 | % | | | 0.70 | % | | | 0.70 | % | | | 0.75 | % | | | 0.72 | % |
Net expenses(3) | | | 0.70 | (4) | | | 0.69 | (4) | | | 0.70 | | | | 0.75 | | | | 0.72 | |
Net investment income | | | 4.05 | | | | 4.31 | | | | 4.36 | | | | 4.64 | | | | 5.26 | |
|
|
Portfolio Turnover Rate | | | 11 | % | | | 19 | % | | | 27 | % | | | 57 | % | | | 53 | % |
|
|
| (1) | | Per share amounts have been calculated using the average shares method. |
| (2) | | Performance figures may reflect voluntary fee waivers and/or expense reimbursements. Past performance is no guarantee of future results. In the absence of voluntary fee waivers and/or expense reimbursements, the total return would have been lower. |
| (3) | | As a result of a voluntary expense limitation, the ratio of expenses to average net assets of Class A will not exceed 0.85%. |
| (4) | | The investment manager voluntarily waived a portion of its fees. |
See Notes to Financial Statements.
Legg Mason Partners Limited Term Municipals Fund 2006 Annual Report 33
Financial Highlights (continued)
For a share of each class of beneficial interest outstanding throughout each year ended March 31, unless otherwise noted:
| | | | | | | | | | | | | | | | |
| | | | |
| Class B Shares(1) | | 2006 | | | 2005 | | | 2004 | | | 2003(2) | |
Net Asset Value, Beginning of Year | | $ | 6.41 | | | $ | 6.59 | | | $ | 6.57 | | | $ | 6.57 | |
|
|
Income (Loss) From Operations: | | | | | | | | | | | | | | | | |
Net investment income | | | 0.22 | | | | 0.25 | | | | 0.26 | | | | 0.05 | |
Net realized and unrealized gain (loss) | | | (0.08 | ) | | | (0.18 | ) | | | 0.01 | | | | 0.02 | |
|
|
Total Income From Operations | | | 0.14 | | | | 0.07 | | | | 0.27 | | | | 0.07 | |
|
|
Less Distributions From: | | | | | | | | | | | | | | | | |
Net investment income | | | (0.23 | ) | | | (0.25 | ) | | | (0.25 | ) | | | (0.07 | ) |
|
|
Total Distributions | | | (0.23 | ) | | | (0.25 | ) | | | (0.25 | ) | | | (0.07 | ) |
|
|
Net Asset Value, End of Year | | $ | 6.32 | | | $ | 6.41 | | | $ | 6.59 | | | $ | 6.57 | |
|
|
Total Return(3) | | | 2.24 | % | | | 1.03 | % | | | 4.18 | % | | | 1.07 | % |
|
|
Net Assets, End of Year (000s) | | | $3,996 | | | | $6,925 | | | | $6,401 | | | | $4,084 | |
|
|
Ratios to Average Net Assets: | | | | | | | | | | | | | | | | |
Gross expenses | | | 1.24 | % | | | 1.22 | % | | | 1.18 | % | | | 1.31 | %(4) |
Net expenses(5) | | | 1.23 | (6) | | | 1.21 | (6) | | | 1.18 | | | | 1.31 | (4) |
Net investment income | | | 3.49 | | | | 3.79 | | | | 3.87 | | | | 4.14 | (4) |
|
|
Portfolio Turnover Rate | | | 11 | % | | | 19 | % | | | 27 | % | | | 57 | % |
|
|
| (1) | | Per share amounts have been calculated using the average shares method. |
| (2) | | For the period January 13, 2003 (inception date) to March 31, 2003. |
| (3) | | Performance figures may reflect voluntary fee waivers and/or expense reimbursements. Past performance is no guarantee of future results. In the absence of voluntary fee waivers and/or expense reimbursements, the total return would have been lower. Total returns for periods of less than one year are not annualized. |
| (5) | | As a result of a voluntary expense limitation, the ratio of expenses to average net assets of Class B will not exceed 1.35%. |
| (6) | | The investment manager voluntarily waived a portion of its fees. |
See Notes to Financial Statements.
34 Legg Mason Partners Limited Term Municipals Fund 2006 Annual Report
Financial Highlights (continued)
For a share of each class of beneficial interest outstanding throughout each year ended March 31, unless otherwise noted:
| | | | | | | | | | | | | | | | | | | | |
| | | | | |
| Class C Shares(1) | | 2006 | | | 2005 | | | 2004 | | | 2003 | | | 2002(2) | |
Net Asset Value, Beginning of Year | | $ | 6.43 | | | $ | 6.60 | | | $ | 6.58 | | | $ | 6.41 | | | $ | 6.46 | |
|
|
Income (Loss) From Operations: | | | | | | | | | | | | | | | | | | | | |
Net investment income | | | 0.22 | | | | 0.24 | | | | 0.25 | | | | 0.27 | | | | 0.08 | |
Net realized and unrealized gain (loss) | | | (0.09 | ) | | | (0.17 | ) | | | 0.01 | | | | 0.17 | | | | (0.04 | ) |
|
|
Total Income From Operations | | | 0.13 | | | | 0.07 | | | | 0.26 | | | | 0.44 | | | | 0.04 | |
|
|
Less Distributions From: | | | | | | | | | | | | | | | | | | | | |
Net investment income | | | (0.22 | ) | | | (0.24 | ) | | | (0.24 | ) | | | (0.27 | ) | | | (0.09 | ) |
|
|
Total Distributions | | | (0.22 | ) | | | (0.24 | ) | | | (0.24 | ) | | | (0.27 | ) | | | (0.09 | ) |
|
|
Net Asset Value, End of Year | | $ | 6.34 | | | $ | 6.43 | | | $ | 6.60 | | | $ | 6.58 | | | $ | 6.41 | |
|
|
Total Return(3) | | | 2.15 | % | | | 1.05 | % | | | 4.02 | % | | | 6.99 | % | | | 0.58 | % |
|
|
Net Assets, End of Year (millions) | | | $254 | | | | $327 | | | | $351 | | | | $322 | | | | $184 | |
|
|
Ratios to Average Net Assets: | | | | | | | | | | | | | | | | | | | | |
Gross expenses | | | 1.33 | % | | | 1.33 | % | | | 1.30 | % | | | 1.35 | % | | | 1.32 | %(4) |
Net expenses(5) | | | 1.33 | (6) | | | 1.32 | (6) | | | 1.30 | | | | 1.35 | | | | 1.32 | (4) |
Net investment income | | | 3.41 | | | | 3.68 | | | | 3.75 | | | | 4.02 | | | | 4.68 | (4) |
|
|
Portfolio Turnover Rate | | | 11 | % | | | 19 | % | | | 27 | % | | | 57 | % | | | 53 | % |
|
|
| (1) | | Per share amounts have been calculated using the average shares method. |
| (2) | | For the period December 19, 2001 (inception date) to March 31, 2002. |
| (3) | | Performance figures may reflect voluntary fee waivers and/or expense reimbursements. Past performance is no guarantee of future results. In the absence of voluntary fee waivers and/or expense reimbursements, the total return would have been lower. Total returns for periods of less than one year are not annualized. |
| (5) | | As a result of a voluntary expense limitation, the ratio of expenses to average net assets of Class C will not exceed 1.45%. |
| (6) | | The investment manager voluntarily waived a portion of its fees. |
See Notes to Financial Statements.
Legg Mason Partners Limited Term Municipals Fund 2006 Annual Report 35
Financial Highlights (continued)
For a share of each class of beneficial interest outstanding throughout each year ended March 31:
| | | | | | | | | | | | | | | | | | | | |
| | | | | |
| Class O Shares(1) | | 2006 | | | 2005 | | | 2004 | | | 2003 | | | 2002 | |
Net Asset Value, Beginning of Year | | $ | 6.42 | | | $ | 6.60 | | | $ | 6.58 | | | $ | 6.41 | | | $ | 6.52 | |
|
|
Income (Loss) From Operations: | | | | | | | | | | | | | | | | | | | | |
Net investment income | | | 0.24 | | | | 0.26 | | | | 0.27 | | | | 0.29 | | | | 0.33 | |
Net realized and unrealized gain (loss) | | | (0.07 | ) | | | (0.18 | ) | | | 0.02 | | | | 0.18 | | | | (0.11 | ) |
|
|
Total Income From Operations | | | 0.17 | | | | 0.08 | | | | 0.29 | | | | 0.47 | | | | 0.22 | |
|
|
Less Distributions From: | | | | | | | | | | | | | | | | | | | | |
Net investment income | | | (0.25 | ) | | | (0.26 | ) | | | (0.27 | ) | | | (0.30 | ) | | | (0.33 | ) |
|
|
Total Distributions | | | (0.25 | ) | | | (0.26 | ) | | | (0.27 | ) | | | (0.30 | ) | | | (0.33 | ) |
|
|
Net Asset Value, End of Year | | $ | 6.34 | | | $ | 6.42 | | | $ | 6.60 | | | $ | 6.58 | | | $ | 6.41 | |
|
|
Total Return(2) | | | 2.69 | % | | | 1.27 | % | | | 4.42 | % | | | 7.38 | % | | | 3.48 | % |
|
|
Net Assets, End of Year (000s) | | | $21,114 | | | | $26,308 | | | | $31,414 | | | | $35,079 | | | | $39,009 | |
|
|
Ratios to Average Net Assets: | | | | | | | | | | | | | | | | | | | | |
Gross expenses | | | 0.92 | % | | | 0.93 | % | | | 0.93 | % | | | 0.98 | % | | | 0.95 | % |
Net expenses(3) | | | 0.92 | (4) | | | 0.93 | (4) | | | 0.93 | | | | 0.98 | | | | 0.95 | |
Net investment income | | | 3.82 | | | | 4.08 | | | | 4.13 | | | | 4.42 | | | | 5.04 | |
|
|
Portfolio Turnover Rate | | | 11 | % | | | 19 | % | | | 27 | % | | | 57 | % | | | 53 | % |
|
|
| (1) | | Per share amounts have been calculated using the average shares method. |
| (2) | | Performance figures may reflect voluntary fee waivers and/or expense reimbursements. Past performance is no guarantee of future results. In the absence of voluntary fee waivers and/or expense reimbursements, the total return would have been lower. |
| (3) | | As a result of a voluntary expense limitation, the ratio of expenses to average net assets of Class O will not exceed 1.05%. |
| (4) | | The investment manager voluntarily waived a portion of its fees. |
See Notes to Financial Statements.
36 Legg Mason Partners Limited Term Municipals Fund 2006 Annual Report
Notes to Financial Statements
| 1. | Organization and Significant Accounting Policies |
Effective April 7, 2006, the Limited Term Portfolio was renamed Legg Mason Partners Limited Term Municipals Fund, (the “Fund”). The Fund is a separate diversified investment fund of Legg Mason Partners Municipal Funds (formerly known as Smith Barney Muni Funds) (“Trust”) a Massachusetts business trust. The Trust is registered under the Investment Company Act of 1940, as amended, (the “1940 Act”), as an open-end management investment company.
The following are significant accounting policies consistently followed by the Fund and are in conformity with U.S. generally accepted accounting principles (“GAAP”). Estimates and assumptions are required to be made regarding assets, liabilities and changes in net assets resulting from operations when financial statements are prepared. Changes in the economic environment, financial markets and any other parameters used in determining these estimates could cause actual results to differ.
(a) Investment Valuation. Securities are valued at the mean between the bid and asked prices provided by an independent pricing service that are based on transactions in municipal obligations, quotations from municipal bond dealers, market transactions in comparable securities and various other relationships between securities. Securities for which market quotations are not readily available or are determined not to reflect fair value, will be valued in good faith by or under the direction of the Fund’s Board of Trustees. Short-term obligations with maturities of 60 days or less are valued at amortized cost, which approximates market value.
(b) Financial Futures Contracts. The Fund may enter into financial futures contracts to hedge against the economic impact of adverse changes in the market value of portfolio securities due to changes in interest rates, as a substitution for buying or selling securities or as a cash flow management technique. Upon entering into a financial futures contract, the Fund is required to deposit cash or securities as initial margin. Additional securities are also segregated up to the current market value of the financial futures contracts. Subsequent payments, known as variation margin, are made or received by the Fund each day, depending on the daily fluctuation in the value of the underlying financial instruments. The Fund recognizes an unrealized gain or loss equal to the daily variation margin. When the financial futures contracts are closed, a realized gain or loss is recognized equal to the difference between the proceeds from (or cost of) the closing transactions and the Fund’s basis in the contracts.
The risks associated with entering into financial futures contracts include the possibility that a change in the value of the contract may not correlate with the changes in the value of the underlying instruments. In addition, investing in financial futures contracts involves the risk that the Fund could lose more than the original margin deposit and subsequent payments required for a futures transaction. Risks may also arise upon entering into these contracts from the potential inability of the counterparties to meet the terms of their contracts.
(c) Security Transactions and Investment Income. Security transactions are accounted for on a trade date basis. Interest income, adjusted for amortization of premium and accretion of discount, is recorded on the accrual basis. The cost of investments sold is determined by use of the specific identification method. To the extent any issuer defaults on an expected
Legg Mason Partners Limited Term Municipals Fund 2006 Annual Report 37
Notes to Financial Statements (continued)
interest payment, the Fund’s policy is to generally halt any additional interest income accruals and consider the realizability of interest accrued up to the date of default.
(d) Distributions to Shareholders. Distributions from net investment income on the shares of the Fund, are declared each business day to shareholders of record, and are paid monthly. The Fund intends to satisfy conditions that will enable interest from municipal securities, which is exempt from federal and certain state income taxes, to retain such tax-exempt status when distributed to the shareholders of the Fund. Distributions of net realized gains, if any, are taxable and are declared at least annually. Distributions are recorded on the ex-dividend date and are determined in accordance with income tax regulations, which may differ from GAAP.
(e) Class Accounting. Investment income, common expenses and realized/unrealized gain (loss) on investments are allocated to the various classes of the Fund on the basis of daily net assets of each class. Fees relating to a specific class are charged directly to that class.
(f) Federal and Other Taxes. It is the Fund’s policy to comply with the federal income and excise tax requirements of the Internal Revenue Code of 1986, as amended, applicable to regulated investment companies. Accordingly, the Fund intends to distribute substantially all of its income and net realized gains on investments, if any, to shareholders each year. Therefore, no federal income tax provision is required in the Fund’s financial statements.
(g) Reclassification. GAAP requires that certain components of net assets be adjusted to reflect permanent differences between financial and tax reporting. These reclassifications have no effect on net assets or net asset values per share. During the current year, the Fund had no reclassifications. During the current year, the following reclassifications have been made:
| | | | | | | | | | | |
| | | |
| | | Undistributed Net
Investment
Income | | | Accumulated Net
Realized Loss | | Paid-in Capital | |
(a) | | $ | 1 | | | | — | | $ | (1 | ) |
(b) | | | (8,227 | ) | | $ | 8,227 | | | — | |
|
|
| (a) | | Reclassifications are primarily due to rounding. |
| (b) | | Reclassifications are primarily due to differences between book and tax amortization of market discount on fixed income securities. |
| 2. | Investment Management Agreement and Other Transactions with Affiliates |
On December 1, 2005, Citigroup Inc. (“Citigroup”) completed the sale of substantially all of its asset management business, Citigroup Asset Management (“CAM”), to Legg Mason, Inc. (“Legg Mason”). As a result, the Fund’s investment manager, Smith Barney Fund Management LLC (“SBFM” or the “Manager”), previously an indirect wholly-owned subsidiary of Citigroup, has become a wholly-owned subsidiary of Legg Mason. Completion of the sale caused the Fund’s then existing investment management contract to terminate. The Fund’s shareholders approved a new investment management contract between the Fund and the Manager, which became effective on December 1, 2005.
38 Legg Mason Partners Limited Term Municipals Fund 2006 Annual Report
Notes to Financial Statements (continued)
Legg Mason, whose principal executive offices are in Baltimore, Maryland, is a financial services holding company.
Prior to the Legg Mason transaction and continuing under the new Investment Management agreement, the Fund paid the Manager a fee calculated at an annual rate of 0.50% of the Fund’s average daily net assets. This fee is calculated daily and paid monthly.
During the year ended March 31, 2006, the Fund’s Class A, B, C and O shares had voluntary expense limitations in place of 0.85%, 1.35%, 1.45% and 1.05%, respectively. These expense limitations can be terminated at any time by the Manager.
On June 28, 2005 Class Y shares were redeemed.
During the year ended March 31, 2006, the Manager voluntarily waived a portion of its fees amounting to $15,643.
The Fund’s Board has approved PFPC Inc. (“PFPC”) to serve as transfer agent for the Fund, effective January 1, 2006. The principal business office of PFPC is located at 4400 Computer Drive Westborough, MA 01581. Prior to January 1, 2006, Citicorp Trust Bank, fsb. (“CTB”), a subsidiary of Citigroup, acted as the Fund’s transfer agent. Also, prior to January 1, 2006 PFPC acted as the Fund’s sub-transfer agent. CTB received account fees and asset-based fees that varied according to the size and type of account. PFPC was responsible for shareholder recordkeeping and financial processing for all shareholder accounts and was paid by CTB. For the year ended March 31, 2006, the Fund paid transfer agent fees of $127,057 to CTB.
The Fund’s Board has appointed the Fund’s current distributor, Citigroup Global Markets Inc. (“CGM”), a subsidiary of Citigroup, and Legg Mason Investor Services, LLC (“LMIS”), a wholly-owned broker-dealer subsidiary of Legg Mason, as co-distributors of the Fund. The Fund’s Board has also approved amended and restated Rule 12b-1 Plans. CGM and other broker-dealers, financial intermediaries and financial institutions (each called a “Service Agent”) that currently offer Fund shares will continue to make the Fund’s shares available to their clients. Additional Service Agents may offer Fund shares in the future.
There is a maximum initial sales charge of 2.00% for Class A shares. There is a contingent deferred sales charge (“CDSC”) of 5.00% on Class B shares, which applies if redemption occurs within one year from purchase payment. This CDSC declines thereafter by 1.00% per year until no CDSC is incurred. Class O shares have a 1.00% CDSC, which applies if redemption occurs within one year from purchase payment. In addition, Class A shares have a 0.50% CDSC, which applies if redemption occurs within six months from purchase payment. This CDSC only applies to those purchases of Class A shares, which, when combined with current holdings of Class A shares, equal or exceed $500,000 in the aggregate. These purchases do not incur an initial sales charge.
For the year ended March 31, 2006, LMIS, CGM and its affiliates received sales charges of approximately $49,000 on sales of the Fund’s Class A shares. In addition, for the year ended March 31, 2006, CDSCs paid to LMIS, CGM and its affiliates were approximately:
| | | | | | | | | | |
| | | |
| | | Class A | | Class B | | Class O | |
CDSCs | | $ | 16,000 | | $ | 10,000 | | $ | 0 | * |
|
|
| * | | Amount represents less than $1,000. |
Legg Mason Partners Limited Term Municipals Fund 2006 Annual Report 39
Notes to Financial Statements (continued)
The Fund has adopted an unfunded, non-qualified deferred compensation plan (the “Plan”) which allows non-interested trustees (“Trustees”) to defer the receipt of all or a portion of the trustees’ fees earned until a later date specified by the Trustees. The deferred fees earn a return based on notional investments selected by the Trustees. The balance of the deferred fees payable may change depending upon the investment performance. Any gains or losses incurred in the deferred balances are reported in the Statement of Operations under Trustees’ fees. Under the Plan, deferred fees are considered a general obligation of the Fund and any payments made pursuant to the Plan will be made from the Fund’s general assets. Effective January 1, 2006, the Board of Trustees voted to discontinue offering the Plan to its members. This change will have no effect on fees previously deferred. As of March 31, 2006, the Fund had accrued $12,608 as deferred compensation payable under the Plan.
Certain officers and one Trustee of the Trust are employees of Legg Mason or its affiliates and do not receive compensation from the Trust.
During the year ended March 31, 2006, the aggregate cost of purchases and proceeds from sales of investments (excluding short-term investments) were as follows:
| | | |
Purchases | | $ | 76,229,603 |
|
Sales | | | 122,312,907 |
|
At March 31, 2006, the aggregate gross unrealized appreciation and depreciation of investments for federal income tax purposes were as follows:
| | | | |
Gross unrealized appreciation | | $ | 19,966,515 | |
Gross unrealized depreciation | | | (3,541,844 | ) |
|
|
Net unrealized appreciation | | $ | 16,424,671 | |
|
|
At March 31, 2006, the Fund had the following open futures contracts:
| | | | | | | | | | | | | |
| | | | | |
| Contracts to Sell: | | Number of
Contracts | | Expiration
Date | | Basis Value | | Market
Value | | Unrealized
Gain |
U.S. Treasury 10 Year Notes | | 2,070 | | 6/06 | | $ | 221,295,938 | | $ | 220,228,594 | | $ | 1,067,344 |
|
| 4. | Class Specific Expenses |
The Fund has adopted a Rule 12b-1 distribution plan and under that plan the Fund pays a service fee with respect to its Class A, B, C and O shares calculated at the annual rate of 0.15% of the average daily net assets of each respective class. The Fund also pays a distribution fee with respect to its Class B, C and O shares calculated at the annual rate of 0.50%, 0.60% and 0.20% of the average daily net assets of each class, respectively. Distribution fees are accrued daily and paid monthly.
40 Legg Mason Partners Limited Term Municipals Fund 2006 Annual Report
Notes to Financial Statements (continued)
For the year ended March 31, 2006, class specific expenses were as follows:
| | | | | | | | | |
| | | |
| | | Distribution Fees | | Transfer Agent Fees | | Shareholder Reports Expenses |
Class A | | $ | 644,156 | | $ | 44,652 | | $ | 20,635 |
Class B | | | 38,965 | | | 2,166 | | | 1,043 |
Class C | | | 2,199,413 | | | 95,734 | | | 34,279 |
Class O | | | 82,668 | | | 7,193 | | | 1,842 |
Class Y(1) | | | — | | | 8 | | | 79 |
|
Total | | $ | 2,965,202 | | $ | 149,753 | | $ | 57,878 |
|
| (1) | | On June 28, 2005 Class Y shares were redeemed. |
LMIS, CGM and its affiliates have agreed to reimburse the Fund for any amount which exceeds the payments made by the Fund with respect to the distribution plan for Class A shares over the cumulative unreimbursed amounts spent by LMIS, CGM and its affiliates in performing their services under the distribution plan. During the year ended March 31, 2006, no reimbursement was required.
| 5. | Distributions to Shareholders by Class |
| | | | | | |
| | |
| | | Year Ended
March 31, 2006 | | Year Ended
March 31, 2005 |
Net Investment Income | | | | | | |
Class A | | $ | 17,875,576 | | $ | 16,345,165 |
Class B | | | 217,114 | | | 259,591 |
Class C | | | 10,301,038 | | | 11,653,002 |
Class O | | | 918,727 | | | 1,174,477 |
Class Y(1) | | | 74,539 | | | 330,129 |
|
Total | | $ | 29,386,994 | | $ | 29,762,364 |
|
| (1) | | On June 28, 2005 Class Y shares were redeemed. |
| 6. | Shares of Beneficial Interest |
At March 31, 2006, the Trust had an unlimited number of shares of beneficial interest authorized with a par value of $0.001 per share. The Fund has the ability to issue multiple classes of shares. Each share of a class represents an identical interest and has the same rights, except that each class bears certain direct expenses specifically related to the distribution of its shares. Class O shares are available for purchase only by former Class C shareholders.
Legg Mason Partners Limited Term Municipals Fund 2006 Annual Report 41
Notes to Financial Statements (continued)
Transactions in shares of each class of beneficial interest of the Fund were as follows:
| | | | | | | | | | | | | | |
| | |
| | | Year Ended
March 31, 2006
| | | Year Ended
March 31, 2005
| |
| | | Shares | | | Amount | | | Shares | | | Amount | |
Class A | | | | | | | | | | | | | | |
Shares sold | | 25,208,534 | | | $ | 160,800,738 | | | 21,929,497 | | | $ | 142,972,758 | |
Shares issued on reinvestment | | 1,728,143 | | | | 10,990,447 | | | 1,421,780 | | | | 9,258,193 | |
Shares repurchased | | (25,798,142 | ) | | | (164,111,164 | ) | | (17,717,389 | ) | | | (115,577,469 | ) |
|
|
Net Increase | | 1,138,535 | | | $ | 7,680,021 | | | 5,633,888 | | | $ | 36,653,482 | |
|
|
Class B | | | | | | | | | | | | | | |
Shares sold | | 162,026 | | | $ | 1,032,987 | | | 391,201 | | | $ | 2,558,417 | |
Shares issued on reinvestment | | 13,517 | | | | 85,946 | | | 19,206 | | | | 125,173 | |
Shares repurchased | | (623,416 | ) | | | (3,961,140 | ) | | (302,537 | ) | | | (1,974,825 | ) |
|
|
Net Increase (Decrease) | | (447,873 | ) | | $ | (2,842,207 | ) | | 107,870 | | | $ | 708,765 | |
|
|
Class C | | | | | | | | | | | | | | |
Shares sold | | 17,293,519 | | | $ | 110,522,030 | | | 27,059,844 | | | $ | 176,727,000 | |
Shares issued on reinvestment | | 1,159,505 | | | | 7,388,364 | | | 1,276,530 | | | | 8,327,627 | |
Shares repurchased | | (29,382,539 | ) | | | (187,506,648 | ) | | (30,584,237 | ) | | | (199,996,660 | ) |
|
|
Net Decrease | | (10,929,515 | ) | | $ | (69,596,254 | ) | | (2,247,863 | ) | | $ | (14,942,033 | ) |
|
|
Class O | | | | | | | | | | | | | | |
Shares sold | | 1,293 | | | $ | 8,266 | | | 47,479 | | | $ | 310,849 | |
Shares issued on reinvestment | | 87,903 | | | | 559,948 | | | 106,214 | | | | 692,892 | |
Shares repurchased | | (852,777 | ) | | | (5,441,840 | ) | | (822,147 | ) | | | (5,362,591 | ) |
|
|
Net Decrease | | (763,581 | ) | | $ | (4,873,626 | ) | | (668,454 | ) | | $ | (4,358,850 | ) |
|
|
Class Y(1) | | | | | | | | | | | | | | |
Shares sold | | — | | | $ | — | | | 11 | | | $ | 75 | |
Shares issued on reinvestment | | — | | | | — | | | 3,432 | | | | 22,418 | |
Shares repurchased | | (1,061,804 | ) | | $ | (6,763,691 | ) | | (231,852 | ) | | | (1,523,266 | ) |
|
|
Net Decrease | | (1,061,804 | ) | | $ | (6,763,691 | ) | | (228,409 | ) | | $ | (1,500,773 | ) |
|
|
| (1) | | On June 28, 2005 Class Y shares were redeemed. |
| 7. | Income Tax Information and Distributions to Shareholders |
Subsequent to the fiscal year end, the Fund has made the following distributions:
| | | | | | | | | | | | |
| | | | |
Record Date Payable Date | | Class A | | Class B | | Class C | | Class O |
Daily | | | | | | | | | | | | |
4/28/2006 | | $ | 0.020427 | | $ | 0.018406 | | $ | 0.017768 | | $ | 0.019958 |
|
42 Legg Mason Partners Limited Term Municipals Fund 2006 Annual Report
Notes to Financial Statements (continued)
The tax character of distributions paid during the fiscal years ended March 31 were as follows:
| | | | | | |
| | |
| | | 2006 | | 2005 |
Distributions paid from: | | | | | | |
Tax-Exempt Income | | $ | 29,383,736 | | $ | 29,585,851 |
|
Ordinary Income | | | 3,258 | | | 176,513 |
|
Total Distributions Paid | | $ | 29,386,994 | | $ | 29,762,364 |
|
As of March 31, 2006, the components of accumulated earnings on a tax basis were as follows:
| | | | |
Undistributed tax-exempt income — net | | $ | 241,865 | |
Capital loss carryforward(*) | | | (49,341,817 | ) |
Other book/tax temporary differences(a) | | | (2,505,045 | ) |
Unrealized appreciation/(depreciation)(b) | | | 17,492,015 | |
|
|
Total Accumulated Earnings/(losses) — net | | $ | (34,112,982 | ) |
|
|
| (*) | | The Fund had the following net capital loss carryforward remaining: |
| | | | |
Year of Expiration
| | Amount
| |
3/31/2008 | | $ | (9,495,115 | ) |
3/31/2009 | | | (5,514,817 | ) |
3/31/2010 | | | (214,462 | ) |
3/31/2011 | | | (5,537,751 | ) |
3/31/2012 | | | (2,616,935 | ) |
3/31/2013 | | | (21,747,281 | ) |
3/31/2014 | | | (4,215,456 | ) |
| | |
|
|
|
| | | $ | (49,341,817 | ) |
| | |
|
|
|
These amounts will be available to offset any future taxable capital gains.
| (a) | | Other book/tax temporary differences are attributable primarily to the realization for tax purposes of unrealized gains on certain futures contracts, the deferral of post October capital losses for tax purposes and differences in the book/tax treatment of various items. |
| (b) | | The difference between book-basis and tax basis unrealized appreciation/(depreciation) is attributable primarily to the tax deferral of losses on wash sales and the difference between book and tax amortization methods for market discount on fixed income securities. |
On May 31, 2005, the U.S. Securities and Exchange Commission (“SEC”) issued an order in connection with the settlement of an administrative proceeding against SBFM and CGM relating to the appointment of an affiliated transfer agent for the Smith Barney family of mutual funds (the “Funds”).
The SEC order finds that SBFM and CGM willfully violated Section 206(1) of the Investment Advisers Act of 1940 (“Advisers Act”). Specifically, the order finds that SBFM and CGM knowingly or recklessly failed to disclose to the boards of the Funds in 1999 when proposing a new transfer agent arrangement with an affiliated transfer agent that: First Data Investors Services Group (“First Data”), the Funds’ then-existing transfer agent, had offered to continue as transfer agent and do the same work for substantially less money than before; and that Citigroup Asset Management (“CAM”), the Citigroup business unit that, at the time, included the Fund’s investment manager and other investment advisory
Legg Mason Partners Limited Term Municipals Fund 2006 Annual Report 43
Notes to Financial Statements (continued)
companies, had entered into a side letter with First Data under which CAM agreed to recommend the appointment of First Data as sub-transfer agent to the affiliated transfer agent in exchange for, among other things, a guarantee by First Data of specified amounts of asset management and investment banking fees to CAM and CGM. The order also finds that SBFM and CGM willfully violated Section 206(2) of the Advisers Act by virtue of the omissions discussed above and other misrepresentations and omissions in the materials provided to the Funds’ boards, including the failure to make clear that the affiliated transfer agent would earn a high profit for performing limited functions while First Data continued to perform almost all of the transfer agent functions, and the suggestion that the proposed arrangement was in the Funds’ best interests and that no viable alternatives existed. SBFM and CGM do not admit or deny any wrongdoing or liability. The settlement does not establish wrongdoing or liability for purposes of any other proceeding.
The SEC censured SBFM and CGM and ordered them to cease and desist from violations of Sections 206(1) and 206(2) of the Advisers Act. The order requires Citigroup to pay $208.1 million, including $109 million in disgorgement of profits, $19.1 million in interest, and a civil money penalty of $80 million. Approximately $24.4 million has already been paid to the Funds, primarily through fee waivers. The remaining $183.7 million, including the penalty, has been paid to the U.S. Treasury and will be distributed pursuant to a plan submitted for the approval of the SEC. At this time, there is no certainty as to how the above-described proceeds of the settlement will be distributed, to whom such distributions will be made, the methodology by which such distributions will be allocated, and when such distributions will be made. The order also required that transfer agency fees received from the Funds since December 1, 2004 less certain expenses be placed in escrow and provided that a portion of such fees might be subsequently distributed in accordance with the terms of the order. On April 3, 2006, an aggregate amount of approximately $9 million was distributed to the affected Funds.
The order required SBFM to recommend a new transfer agent contract to the Funds’ boards within 180 days of the entry of the order; if a Citigroup affiliate submitted a proposal to serve as transfer agent or sub-transfer agent, SBFM and CGM would have been required, at their expense, to engage an independent monitor to oversee a competitive bidding process. On November 21, 2005, and within the specified timeframe, the Fund’s Board selected a new transfer agent for the Fund. No Citigroup affiliate submitted a proposal to serve as transfer agent. Under the order, SBFM also must comply with an amended version of a vendor policy that Citigroup instituted in August 2004.
Although there can be no assurance, SBFM does not believe that this matter will have a material adverse effect on the Funds.
On December 1, 2005, Citigroup completed the sale of substantially all of its global asset management business, including SBFM, to Legg Mason Inc.
Beginning in August 2005, five class action lawsuits alleging violations of federal securities laws and state law were filed against CGM and SBFM, (collectively, the “Defendants”) based on the May 31, 2005 settlement order issued against the Defendants by the SEC as described in Note 8. The complaints seek injunctive relief and compensatory and punitive
44 Legg Mason Partners Limited Term Municipals Fund 2006 Annual Report
Notes to Financial Statements (continued)
damages, removal of SBFM as the advisor for the Smith Barney family of funds, rescission of the Funds’ management and other contracts with SBFM, recovery of all fees paid to SBFM pursuant to such contracts, and an award of attorneys’ fees and litigation expenses.
On October 5, 2005, a motion to consolidate the five actions and any subsequently-filed, related action was filed. That motion contemplates that a consolidated amended complaint alleging substantially similar causes of action will be filed in the future.
As of the date of this report, the Fund’s investment manager believes that resolution of the pending lawsuit will not have a material effect on the financial position or results of operations of the Funds or the ability of the Fund’s investment manager and it affiliates to continue to render services to the Funds under their respective contracts.
* * *
Beginning in June 2004, class action lawsuits alleging violations of the federal securities laws were filed against CGM and a number of its affiliates, including SBFM and Salomon Brothers Asset Management Inc (the “Advisers”), substantially all of the mutual funds managed by the Advisers, including the Funds (the “Funds”), and directors or trustees of the Funds (collectively, the “Defendants”). The complaints alleged, among other things, that CGM created various undisclosed incentives for its brokers to sell Smith Barney and Salomon Brothers funds. In addition, according to the complaints, the Advisers caused the Funds to pay excessive brokerage commissions to CGM for steering clients towards proprietary funds. The complaints also alleged that the Defendants breached their fiduciary duty to the Funds by improperly charging Rule l2b-1 fees and by drawing on fund assets to make undisclosed payments of soft dollars and excessive brokerage commissions. The complaints also alleged that the Funds failed to adequately disclose certain aspects of the allegedly wrongful conduct. The complaints sought injunctive relief and compensatory and punitive damages, rescission of the Funds’ contracts with the Advisers, recovery of all fees paid to the Advisers pursuant to such contracts and an award of attorneys’ fees and litigation expenses.
On December 15, 2004, a consolidated amended complaint (the “Complaint”) was filed alleging substantially similar causes of action. While the lawsuit is in its earliest stages, to the extent that the Complaint purports to state causes of action against the Funds, the Fund’s investment manager believes the Funds have significant defenses to such allegations, which the Funds intend to vigorously assert in responding to the Complaint.
Additional lawsuits arising out of these circumstances and presenting similar allegations and requests for relief may be filed against the Defendants in the future.
As of the date of this report, the Fund’s investment manager and the Funds believe that the resolution of the pending lawsuit will not have a material effect on the financial position or results of operations of the Funds or the ability of the Advisers and their affiliates to continue to render services to the Funds under their respective contracts.
The Defendants have moved to dismiss the Complaint. Those motions are pending before the court.
Legg Mason Partners Limited Term Municipals Fund 2006 Annual Report 45
Notes to Financial Statements (continued)
On September 16, 2005, the staff of the SEC informed SBFM and Salomon Brothers Asset Management Inc (“SBAM”) that the staff is considering recommending that the Commission institute administrative proceedings against SBFM and SBAM for alleged violations of Section 19(a) and 34(b) of the Investment Company Act (and related Rule 19a-1). The notification is a result of an industry wide inspection by the Commission and is based upon alleged deficiencies in disclosures regarding dividends and distributions paid to shareholders of certain funds. Section 19(a) and related Rule 19a-1 of the Investment Company Act generally require funds that are making dividend and distribution payments to provide shareholders with a written statement disclosing the source of the dividends and distributions, and, in particular, the portion of the payments made from each of net investment income, undistributed net profits and/ or paid-in capital. In connection with the contemplated proceedings, the staff may seek a cease and desist order and/or monetary damages from SBFM or SBAM.
Although there can be no assurance, SBFM and SBAM believes that this matter is not likely to have a material adverse effect on the Fund or SBFM and SBAM’s ability to perform investment management services relating to the Fund.
46 Legg Mason Partners Limited Term Municipals Fund 2006 Annual Report
Report of Independent Registered Public Accounting Firm
The Board of Trustees and Shareholders Legg Mason Partners Municipal Funds (formerly, Smith Barney Muni Funds):
We have audited the accompanying statement of assets and liabilities, including the schedule of investments, of Legg Mason Partners Limited Term Municipals Fund (formerly, Limited Term Portfolio), a series of Legg Mason Partners Municipal Funds, as of March 31, 2006, and the related statement of operations for the year then ended, the statements of changes in net assets for each of the years in the two-year period then ended, and the financial highlights for each of the years in the five-year period then ended. These financial statements and financial highlights are the responsibility of the Fund’s management. Our responsibility is to express an opinion on these financial statements and financial highlights based on our audits.
We conducted our audits in accordance with the standards of the Public Company Accounting Oversight Board (United States). Those standards require that we plan and perform the audit to obtain reasonable assurance about whether the financial statements and financial highlights are free of material misstatement. An audit includes examining, on a test basis, evidence supporting the amounts and disclosures in the financial statements. Our procedures included confirmation of securities owned as of March 31, 2006, by correspondence with the custodian and brokers or by other appropriate auditing procedures. An audit also includes assessing the accounting principles used and significant estimates made by management, as well as evaluating the overall financial statement presentation. We believe that our audits provide a reasonable basis for our opinion.
In our opinion, the financial statements and financial highlights referred to above present fairly, in all material respects, the financial position of Legg Mason Partners Limited Term Municipals Fund as of March 31, 2006, and the results of its operations for the year then ended, the changes in its net assets for each of the years in the two-year period then ended, and the financial highlights for each of the years in the five-year period then ended, in conformity with accounting principles U.S. generally accepted accounting principles.

New York, New York
May 24, 2006
Legg Mason Partners Limited Term Municipals Fund 2006 Annual Report 47
Board Approval of Management Agreement (unaudited)
On June 23, 2005, Citigroup Inc. entered into a definitive agreement (the “Transaction Agreement”) with Legg Mason, Inc. (“Legg Mason”) under which Citigroup agreed to sell substantially all of its asset management business, Citigroup Asset Management (“CAM”), which includes the Adviser, to Legg Mason in exchange for the broker-dealer and investment banking businesses of Legg Mason and certain other considerations (the “Transaction”). The Transaction closed on December 1, 2005.
The consummation of the Transaction resulted in the automatic termination of the Fund’s current management agreement in accordance with the Investment Company Act of 1940, as amended (the “1940 Act”). Prior to the closing of the Transaction, the Fund’s Board approved a new management agreement between the Fund and the Adviser (the “New Management Agreement”).
On July 11, 2005, members of the Board discussed with CAM management and certain Legg Mason representatives the Transaction and Legg Mason’s general plans and intentions regarding CAM’s business and its combination with Legg Mason’s business. The Board Members also inquired about the plans for and anticipated roles and responsibilities of certain CAM employees and officers after the Transaction.
At a meeting held on August 1, 2005, the Fund’s Board, including a majority of the Board Members who are not “interested persons” of the Fund or the Adviser as defined in the 1940 Act (the “Independent Board Members”), approved the New Management Agreement. To assist the Board in its consideration of the New Management Agreement, Legg Mason provided materials and information about Legg Mason, including its financial condition and asset management capabilities and organization, and CAM provided materials and information about the Transaction between Legg Mason and Citigroup. Representatives of CAM and Legg Mason also made presentations to and responded to questions from the Board. The Independent Board Members, through their independent legal counsel, also requested and received additional information from CAM and Legg Mason in connection with their consideration of the New Management Agreement. The additional information was provided in advance of and at the August meeting. After the presentations and after reviewing the written materials provided, the Independent Board Members met in executive session with their counsel to consider the New Management Agreement. The Independent Board Members of the Board also conferred separately and with their counsel about the Transaction on a number of occasions, including in connection with the July and August meetings.
In their deliberations concerning the New Management Agreement, among other things, the Board Members considered:
(i) the reputation, financial strength and resources of Legg Mason and its investment advisory subsidiaries;
(ii) that Legg Mason and its wholly-owned subsidiary, Western Asset Management Company and its affiliates (“Western Asset”), are experienced and respected asset management firms, and that Legg Mason has advised the Board Members that (a) it intends to combine the fixed income investment operations (including money market fund operations) of CAM with those of Western Asset and may also wish to combine other CAM operations with those of other Legg Mason subsidiaries; (b) after the closing
48 Legg Mason Partners Limited Term Municipals Fund
Board Approval of Management Agreement
(unaudited) (continued)
of the Transaction, it will take steps to combine the investment management operations of Western Asset with the fixed income operations of the Adviser, which, among other things, may involve Western Asset and the Adviser sharing common systems and procedures, employees (including portfolio managers), investment and trading platforms, and other resources; (c) it is expected that these combination processes will result in changes to portfolio managers or portfolio management teams for a number of the CAM funds, subject to Board oversight and appropriate notice to shareholders, and that, in other cases, the current portfolio managers or portfolio management teams will remain in place; and (d) in the future, it may recommend that Western Asset or other Legg Mason subsidiaries be appointed as the adviser or subadviser to some or all of the CAM funds, subject to applicable regulatory requirements;
(iii) that CAM management had advised the Board that a number of portfolio managers and other key CAM personnel would be retained after the closing of the Transaction;
(iv) that, following the Transaction, CAM will be part of an organization focused on the asset management business;
(v) that CAM management and Legg Mason have advised the Board that following the Transaction, there is not expected to be any diminution in the nature, quality and extent of services provided to the Fund and their shareholders by the Adviser, including compliance services;
(vi) that Legg Mason has advised the Board that it has no present intention to alter the expense waivers and reimbursements currently in effect and, while it reserves the right to do so in the future, it would consult with the Board before making any changes;
(vii) that under the Transaction Agreement, Citigroup and Legg Mason have agreed not to take any action that is not contemplated by the Transaction or fail to take any action that to their respective knowledge would cause any of the requirements of Section 15(f) of the 1940 Act not to be met;
(viii) the assurances from Citigroup and Legg Mason that, for a three year period following the closing of the Transaction, Citigroup-affiliated broker-dealers will continue to offer the Fund as an investment product, and the potential benefits to Fund shareholders from this and other third-party distribution access;
(ix) the potential benefits to Fund shareholders from being part of a combined fund family with Legg Mason sponsored funds;
(x) that Citigroup and Legg Mason would derive benefits from the Transaction and that, as a result, they have a financial interest in the matters that were being considered;
(xi) the potential effects of regulatory restrictions on the Fund if Citigroup-affiliated broker-dealers remain principal underwriters of the Fund after the closing of the Transaction;
Legg Mason Partners Limited Term Municipals Fund 49
Board Approval of Management Agreement (unaudited) (continued)
(xii) the fact that the Fund’s total advisory and administrative fees will not increase by virtue of the New Management Agreement, but will remain the same;
(xiii) the terms and conditions of the New Management Agreement, including the differences from the current management agreement, and the benefits of a single, uniform form of agreement covering these services;
(xiv) that the Fund would not bear the costs of obtaining shareholder approval of the New Management Agreement;
(xv) that the Fund would avail itself of permissions granted under certain licensing arrangements between Citigroup and Legg Mason that would permit the Fund (including any share classes thereof) to maintain its current name, as well as all logos, trademarks and service marks, related to Citigroup or any of its affiliates for some agreed upon time period after the closing of the Transaction ; and
(xvi) that, as discussed in detail above, within the past year the Board had performed a full annual review of the current management agreement as required by the 1940 Act. In that regard, the Board, in its deliberations concerning the New Management Agreement, considered the same factors regarding the nature, quality and extent of services provided, costs of services provided, profitability, fall out benefits, fees and economies of scale and investment performance as it did when it renewed the current management agreement, and reached substantially the same conclusions.
50 Legg Mason Partners Limited Term Municipals Fund
Additional Information (unaudited)
Information about Trustees and Officers
The business and affairs of the Legg Mason Partners Limited Term Municipals Fund (formerly known as Limited Term Portfolio) (“Fund”) are managed under the direction of the Legg Mason Partners Municipal Funds (formerly known as Smith Barney Muni Funds (“Trust”) Board of Trustees. Information pertaining to the Trustees and Officers of the Trust is set forth below. The Statement of Additional Information includes additional information about the Trustees and is available, without charge, upon request by calling Shareholder Services at 1-800-451-2010).
| | | | | | | | | | |
| | | | | |
Name, Address
and Birth Year | | Position(s)
Held with
Fund | | Term of
Office* and
Length
of Time
Served | | Principal
Occupation(s)
During Past
Five Years | | Number of
Portfolios
in Fund
Complex
Overseen by
Trustee | | Other Board
Memberships
Held by
Trustee |
| Non-Interested Trustees: | | | | | | | | |
| | | | | |
Lee Abraham 13732 LeHavre Drive Frenchman’s Creek Palm Beach Gardens, FL 33410 Birth Year: 1927 | | Trustee | | Since 1999 | | Retired; Former Director of Signet Group PLC | | 27 | | None |
| | | | | |
Jane F. Dasher Korsant Partners 283 Greenwich Avenue 3rd Floor Greenwich, CT 06830 Birth Year: 1949 | | Trustee | | Since 1999 | | Controller of PBK Holdings, Inc., a family investment company | | 27 | | None |
| | | | | |
Donald R. Foley 3668 Freshwater Drive Jupiter, FL 33477 Birth Year: 1922 | | Trustee | | Since 1985 | | Retired | | 18 | | None |
| | | | | |
Richard E. Hanson, Jr. 2751 Vermont Route 140 Poultney, VT 05764 Birth Year: 1941 | | Trustee | | Since 1999 | | Retired; Former Head of the New Atlanta Jewish Community High School | | 27 | | None |
| | | | | |
Paul Hardin 12083 Morehead Chapel Hill, NC 27514-8426 Birth Year: 1931 | | Trustee | | Since 1994 | | Professor of Law & Chancellor Emeritus at the University of North Carolina | | 34 | | None |
| | | | | |
Roderick C. Rasmussen 9 Cadence Court Morristown, NJ 07960 Birth Year: 1926 | | Trustee | | Since 1985 | | Investment Counselor | | 27 | | None |
| | | | | |
John P. Toolan 7202 Southeast Golf Ridge Way Hobe Sound, FL 33455 Birth Year: 1930 | | Trustee | | Since 1985 | | Retired | | 27 | | None |
Legg Mason Partners Limited Term Municipals Fund 51
Additional Information (unaudited) (continued)
| | | | | | | | | | |
| | | | | |
Name, Address
and Birth Year | | Position(s)
Held with
Fund | | Term of
Office* and
Length
of Time
Served | | Principal
Occupation(s)
During Past
Five Years | | Number of
Portfolios
in Fund
Complex
Overseen by
Trustee | | Other Board
Memberships
Held by
Trustee |
| Interested Trustee: | | | | | | | | | | |
| | | | | |
R. Jay Gerken, CFA** Legg Mason & Co., LLC
(“Legg Mason”) 399 Park Avenue
4th Floor New York, NY 10022 Birth Year: 1951 | | Chairman, President and Chief Executive Officer | | Since 2002 | | Managing Director of Legg Mason; President and Chief Executive Officer of Smith Barney Fund Management LLC (“SBFM”) and Citi Fund Management Inc. (“CFM”); President and Chief Executive Officer of certain mutual funds associated with Legg Mason; Formerly, Chairman of SBFM and CFM (2002- 2006); Formerly, Chairman, President and Chief Executive Officer of Travelers Investment Advisers, Inc. (“TIA”) (from 2002 to 2005) | | 169 | | Trustee, Consulting Group Capital Markets Funds |
| | | | | |
| Officers: | | | | | | | | | | |
| | | | | |
Andrew B. Shoup Legg Mason 125 Broad Street
11th Floor New York, NY 10004 Birth Year: 1956 | | Senior Vice President and Chief Administrative Officer | | Since 2003 | | Director of Legg Mason; Senior Vice President and Chief Administrative Officer of certain mutual funds associated with Legg Mason; Formerly Head of International Funds Administration of Legg Mason or its predecessors (from 2001 to 2003) | | N/A | | N/A |
52 Legg Mason Partners Limited Term Municipals Fund
Additional Information (unaudited) (continued)
| | | | | | | | | | |
| | | | | |
Name, Address
and Birth Year | | Position(s)
Held with
Fund | | Term of
Office* and
Length
of Time
Served | | Principal
Occupation(s)
During Past
Five Years | | Number of
Portfolios
in Fund
Complex
Overseen by
Trustee | | Other Board
Memberships
Held by
Trustee |
| Officers: | | | | | | | | | | |
Robert J. Brault Legg Mason 125 Broad Street
11th Floor New York, NY 10004 Birth Year: 1965 | | Chief Financial Officer and Treasurer | | Since
2004 | | Director of Legg Mason; Chief Financial Officer and Treasurer of certain mutual funds associated with Legg Mason; Director of Internal Control for CAM U.S. Mutual Fund Administration (from 2002 to 2004); Director of Project Management & Information Systems for CAM U.S. Mutual Fund Administration (from 2000 to 2002) | | N/A | | N/A |
| | | | | |
Joseph P. Deane Legg Mason 399 Park Avenue 4th Floor New York, NY 10022 Birth Year: 1949 | | Vice President and Investment Officer | | Since
1999 | | Managing Director of Legg Mason Investment Officer of the Manager or its affiliates | | N/A | | N/A |
| | | | | |
David T. Fare Legg Mason 399 Park Avenue 4th Floor New York, NY 10022 Birth Year: 1962 | | Vice President and Investment Officer | | Since
2004 | | Director of Legg Mason Investment Officer of the Manager or its affiliates | | N/A | | N/A |
| | | | | |
Ted P. Becker Legg Mason 399 Park Avenue 4th Floor New York, NY 10022 Birth Year: 1951 | | Chief Compliance Officer | | Since
2006 | | Managing Director of Compliance at Legg Mason (2005-Present); Chief Compliance Officer with certain mutual funds associated with Legg Mason (since 2006); Managing Director of Compliance at CAM (2002-2005). Prior to 2002, Managing Director-Internal Audit & Risk Review at Citigroup, Inc. | | N/A | | N/A |
Legg Mason Partners Limited Term Municipals Fund 53
Additional Information (unaudited) (continued)
| | | | | | | | | | |
| | | | | |
Name, Address
and Birth Year | | Position(s)
Held with
Fund | | Term of
Office* and
Length
of Time
Served | | Principal
Occupation(s) During Past
Five Years | | Number of
Portfolios
in Fund
Complex
Overseen by
Trustee | | Other Board
Memberships
Held by
Trustee |
| Officers: | | | | | | | | | | |
John Chiota Legg Mason 300 First Stamford Place 4th Floor Stamford, CT 06902 Birth Year: 1968 | | Chief Anti-Money Laundering Compliance Officer | | Since
2006 | | Vice President of Legg Mason (since 2004); Chief Anti-Money Laundering Compliance Officer with certain mutual funds associated with Legg Mason (since 2006); prior to August 2004, Chief AML Compliance Officer with TD Waterhouse | | N/A | | N/A |
| | | | | |
Robert I. Frenkel Legg Mason 300 First Stamford Place 4th Floor Stamford, CT 06902 Birth Year: 1954 | | Secretary and Chief Legal Officer | | Since 2003 | | Managing Director and General Counsel of Global Mutual Funds for Legg Mason and its predecessor’s; Secretary and Chief Legal Officer of certain mutual funds associated with Legg Mason (since 2003); Formerly Secretary of CFM (from 2001 to 2004) | | N/A | | N/A |
| * | | Each Trustee and Officer serves until his or her successors has been duly elected and qualified. |
| ** | | Mr. Gerken is an “interested person” of the Fund as defined in the Investment Company Act of 1940, as amended, because Mr. Gerken is an officer of Legg Mason and certain of its affiliates. |
54 Legg Mason Partners Limited Term Municipals Fund
Additional Shareholder Information (unaudited)
Results of a Special Meeting of Shareholders
On November 29, 2005, a Special Meeting of Shareholders was held for the following purposes: 1) to approve a new management agreement and 2) to elect Trustees of Legg Mason Partners Municipal Funds. The following tables provide the number of votes cast for, against or withheld, as well as the number of abstentions and broker non-votes as to each matter voted on at the Special Meeting of Shareholders.
1. Approval of New Management Agreement
| | | | | | | | |
| Item Voted On | | Votes For | | Votes Against | | Abstentions | | Broker Non-Votes |
New Management Agreement | | 53,430,010.200 | | 1,697,375.464 | | 1,666,714.281 | | 15,200,005.000 |
|
2. Election of Trustees1
| | | | | | | | |
| Nominees: | | Votes For | | Authority
Withheld | | Abstentions | | Broker
Non-Votes |
Lee Abraham | | 2,329,588,005.613 | | 149,321,576.243 | | 0.000 | | 0.000 |
Jane F. Dasher | | 2,332,650,753.697 | | 146,258,828.159 | | 0.000 | | 0.000 |
Donald R. Foley | | 2,329,893,384.968 | | 149,016,196.888 | | 0.000 | | 0.000 |
Richard E. Hanson, Jr. | | 2,331,776,035.764 | | 147,133,546.092 | | 0.000 | | 0.000 |
Paul Hardin | | 2,329,386,986.327 | | 149,522,595.529 | | 0.000 | | 0.000 |
Roderick C. Rasmussen | | 2,330,770,995.850 | | 148,138,586.006 | | 0.000 | | 0.000 |
John P. Toolan | | 2,328,703,793.287 | | 150,205,788.569 | | 0.000 | | 0.000 |
R. Jay Gerken | | 2,327,542,856.282 | | 151,366,725.574 | | 0.000 | | 0.000 |
|
| 1 | | Trustees are elected by the shareholders of all of the series of the Trust of which the Fund is a series. |
Legg Mason Partners Limited Term Municipals Fund 55
Important Tax Information (unaudited)
All of the net investment income distributions paid monthly by the Fund from April 2005 through February 2006 qualify as tax-exempt interest dividends for Federal income tax purposes. Additionally, 99.86% of the net investment income distribution paid in March 2006 qualifies as a tax-exempt interest dividend for Federal income tax purposes.
Please retain this information for your records.
56 Legg Mason Partners Limited Term Municipals Fund
Legg Mason Partners Municipal Funds
Legg Mason Partners Limited Term Municipals Fund
| | |
TRUSTEES Lee Abraham Jane F. Dasher Donald R. Foley R. Jay Gerken, CFA
Chairman Richard E. Hanson, Jr. Paul Hardin Roderick C. Rasmussen John P. Toolan OFFICERS R. Jay Gerken, CFA President and Chief Executive Officer Andrew B. Shoup Senior Vice President and Chief Administrative Officer Robert J. Brault Chief Financial Officer and Treasurer Joseph P. Deane Vice President and Investment Officer David T. Fare Vice President and Investment Officer Ted P. Becker Chief Compliance Officer | | OFFICERS (continued) John Chiota Chief Anti-Money Laundering Compliance Officer Robert I. Frenkel Secretary and
Chief Legal Officer INVESTMENT MANAGER Smith Barney Fund Management LLC DISTRIBUTORS Citigroup Global Markets Inc. Legg Mason Investor
Services, LLC CUSTODIAN State Street Bank and Trust Company TRANSFER AGENT PFPC Inc. 4400 Computer Drive Westborough, Massachusetts 01581 INDEPENDENT REGISTERED PUBLIC ACCOUNTING FIRM KPMG LLP 345 Park Avenue New York, New York 10154 |
This report is submitted for the general information of the shareholders of Legg Mason Partners Municipal Funds — Legg Mason Partners Limited Term Municipals Fund, but it may also be used as sales literature when preceded or accompanied by a current Prospectus.
This report must be preceded or accompanied by a free prospectus. Investors should consider the Fund’s investment objectives, risks, charges and expenses carefully before investing. The prospectus contains this and other important information about the Fund. Please read the prospectus carefully before investing.
www.leggmason.com/InvestorServices
©2006 Legg Mason
Investors Services, LLC
Member NASD, SIPC
Legg Mason Partners
Municipal Funds
Legg Mason Partners
Limited Term Municipals Fund
The Fund is a separate investment fund of the Legg Mason Partners Municipal Funds, a Massachusetts business trust.
LEGG MASON PARTNERS MUNICIPAL FUNDS
125 Broad Street
10th Floor, MF-2
New York, New York 10004
The Fund files its complete schedule of portfolio holdings with the Securities and Exchange Commission for the first and third quarters of each fiscal year on Form N-Q. The Fund’s Forms N-Q are available on the Commission’s website at http://www.sec.gov. The Fund’s Forms N-Q may be reviewed and copied at the Commission’s Public Reference Room in Washington D.C., and how information on the operation of the Public Reference Room may be obtained by calling 800-SEC-0330. To obtain information on Form N-Q from the Fund, shareholders can call 800-451-2010.
Information on how the Fund voted-proxies relating to portfolio securities during the most recent 12-month period ended June 30 and a description of the policies and procedures that the Fund uses to determine how to vote proxies relating to portfolio securities is available (1) without charge, upon request, by calling 1-800-451-2010, (2) on the Fund’s website at www.leggmason.com/InvestorServices and (3) on the SEC’s website at www.sec.gov. Proxy voting reports for the period ending June 30, 2005 will continue to be listed under the Fund’s former Smith Barney Muni Funds — Limited Term Portfolio name.
The registrant has adopted a code of ethics that applies to the registrant’s principal executive officer, principal financial officer, principal accounting officer or controller.
| ITEM 3. | AUDIT COMMITTEE FINANCIAL EXPERT. |
The Board of Trustees of the registrant has determined that Jane F. Dasher, the Chairperson of the Board’s Audit Committee, possesses the technical attributes identified in Instruction 2(b) of Item 3 to Form N-CSR to qualify as an “audit committee financial expert,” and has designated Ms. Dasher as the Audit Committee’s financial expert. Ms. Dasher is an “independent” Trustee pursuant to paragraph (a)(2) of Item 3 to Form N-CSR.
| ITEM 4. | PRINCIPAL ACCOUNTANT FEES AND SERVICES. |
a) Audit Fees. The aggregate fees billed in the last two fiscal years ending March 31, 2005 and March 31, 2006 (the “Reporting Periods”) for professional services rendered by the Registrant’s principal accountant (the “Auditor”) for the audit of the Registrant’s annual financial statements, or services that are normally provided by the Auditor in connection with the statutory and regulatory filings or engagements for the Reporting Periods, were $170,500 in 2005 and $182,500 in 2006.
b) Audit-Related Fees. There were no fees billed in the Reporting Periods for assurance and related services by the Auditor that are reasonably related to the performance of the audit of the Registrant’s financial statements and are not reported under paragraph (a) of this Item 4.
In addition, there were no Audit-Related Fees billed in the Reporting Period for assurance and related services by the Auditor to the Registrant’s investment adviser (not including any sub-adviser whose role is primarily portfolio management and is subcontracted with or overseen by another investment adviser), and any entity controlling, controlled by or under common control with the investment adviser that provides ongoing services to the Legg Mason Partners Municipal Funds (“service affiliates”), that were reasonably related to the performance of the annual audit of the service affiliates. Accordingly, there were no such fees that required pre-approval by the Audit Committee for the Reporting Periods (prior to May 6, 2003 services provided by the Auditor were not required to be pre-approved).
(c) Tax Fees. The aggregate fees billed in the Reporting Periods for professional services rendered by the Auditor for tax compliance, tax advice and tax planning (“Tax Services”) were $38,600 in 2005 and $0 in 2006. These services consisted of (i) review or preparation of U.S. federal, state, local and excise tax returns; (ii) U.S. federal, state and local tax planning, advice and assistance regarding statutory, regulatory or administrative developments, and (iii) tax advice regarding tax qualification matters and/or treatment of various financial instruments held or proposed to be acquired or held.
There were no fees billed for tax services by the Auditors to service affiliates during the Reporting Periods that required pre-approval by the Audit Committee.
d) All Other Fees. There were no other fees billed in the Reporting Periods for products and services provided by the Auditor, other than the services reported in paragraphs (a) through (c) of this Item for the Legg Mason Partners Municipal Funds.
All Other Fees. There were no other non-audit services rendered by the Auditor to Smith Barney Fund Management LLC (“SBFM”), and any entity controlling, controlled by or under common control with SBFM that provided ongoing services to Legg Mason Partners Municipal Funds requiring pre-approval by the Audit Committee in the Reporting Period.
(e) Audit Committee’s pre–approval policies and procedures described in paragraph (c) (7) of Rule 2-01 of Regulation S-X.
(1) The Charter for the Audit Committee (the “Committee”) of the Board of each registered investment company (the “Fund”) advised by Smith Barney Fund Management LLC or Salomon Brothers Asset Management Inc. or one of their affiliates (each, an “Adviser”) requires that the Committee shall approve (a) all audit and permissible non-audit services to be provided to the Fund and (b) all permissible non-audit services to be provided by the Fund’s independent auditors to the Adviser and any Covered Service Providers if the engagement relates directly to the operations and financial reporting of the Fund. The Committee may implement policies and procedures by which such services are approved other than by the full Committee.
The Committee shall not approve non-audit services that the Committee believes may impair the independence of the auditors. As of the date of the approval of this Audit Committee Charter, permissible non-audit services include any professional services (including tax services), that are not prohibited services as described below, provided to the Fund by the independent auditors, other than those provided to the Fund in connection with an audit or a review of the financial statements of the Fund. Permissible non-audit services may not include: (i) bookkeeping or other services related to the accounting records or financial statements of the Fund; (ii) financial information systems design and implementation; (iii) appraisal or valuation services, fairness opinions or contribution-in-kind reports; (iv) actuarial services; (v) internal audit outsourcing services; (vi) management functions or human resources; (vii) broker or dealer, investment adviser or investment banking services; (viii) legal services and expert services unrelated to the audit; and (ix) any other service the Public Company Accounting Oversight Board determines, by regulation, is impermissible.
Pre-approval by the Committee of any permissible non-audit services is not required so long as: (i) the aggregate amount of all such permissible non-audit services provided to the Fund, the Adviser and any service providers controlling, controlled by or under common control with the Adviser that provide ongoing services to the Fund (“Covered Service Providers”) constitutes not more than 5% of the total amount of revenues paid to the independent auditors during the fiscal year in which the permissible non-audit services are provided to (a) the Fund, (b) the Adviser and (c) any entity controlling, controlled by or under common control with the Adviser that provides ongoing services to the Fund during the fiscal year in which the services are provided that would have to be approved by the Committee; (ii) the permissible non-audit services were not recognized by the Fund at the time of the engagement to be non-audit services; and (iii) such services are promptly brought to the attention of the Committee and approved by the Committee (or its delegate(s)) prior to the completion of the audit.
(2) For the Legg Mason Partners Municipal Funds, the percentage of fees that were approved by the audit committee, with respect to: Audit-Related Fees were 100% and 0% for 2005 and 2006; Tax Fees were 100% and 0% for 2005 and 2006; and Other Fees were 100% and 0% for 2005 and 2006.
(f) N/A
(g) Non-audit fees billed by the Auditor for services rendered to Legg Mason Partners Municipal Funds and CAM and any entity controlling, controlled by, or under common control with CAM that provides ongoing services to Legg Mason Partners Municipal Funds during the reporting period were $0 in 2006 for fees related to the transfer agent matter as fully described in the notes the financial statements titled “additional information” and $75,000 for 2005.
(h) Yes. The Legg Mason Partners Municipal Funds’ Audit Committee has considered whether the provision of non-audit services that were rendered to Service Affiliates which were not pre-approved (not requiring pre-approval) is compatible with maintaining the Accountant’s independence. All services provided by the Auditor to the Legg Mason Partners Municipal Funds or to Service Affiliates, which were required to be pre-approved, were pre-approved as required.
| ITEM 5. | AUDIT COMMITTEE OF LISTED REGISTRANTS. |
Not applicable.
| ITEM 6. | SCHEDULE OF INVESTMENTS. |
Included herein under Item 1.
| ITEM 7. | DISCLOSURE OF PROXY VOTING POLICIES AND PROCEDURES FOR CLOSED-END MANAGEMENT INVESTMENT COMPANIES. |
Not applicable.
| ITEM 8. | PORTFOLIO MANAGERS OF CLOSED-END MANAGEMENT INVESTMENT COMPANIES. |
Not applicable.
| ITEM 9. | PURCHASES OF EQUITY SECURITIES BY CLOSED-END MANAGEMENT INVESTMENT COMPANY AND AFFILIATED PURCHASERS. |
Not applicable.
| ITEM 10. | SUBMISSION OF MATTERS TO A VOTE OF SECURITY HOLDERS. |
Not applicable.
| ITEM 11. | CONTROLS AND PROCEDURES. |
| | (a) | The registrant’s principal executive officer and principal financial officer have concluded that the registrant’s disclosure controls and procedures (as defined in Rule 30a- 3(c) under the Investment Company Act of 1940, as amended (the “1940 Act”)) are effective as of a date within 90 days of the filing date of this report that includes the disclosure required by this paragraph, based on their evaluation of the disclosure controls and procedures required by Rule 30a-3(b) under the 1940 Act and 15d-15(b) under the Securities Exchange Act of 1934. |
| | (b) | There were no changes in the registrant’s internal control over financial reporting (as defined in Rule 30a-3(d) under the 1940 Act) that occurred during the registrant’s last fiscal half-year (the registrant’s second fiscal half-year in the case of an annual report) that have materially affected, or are likely to materially affect the registrant’s internal control over financial reporting. |
| | (a) | Code of Ethics attached hereto. |
Exhibit 99.CODE ETH
Exhibit 99.CERT Certifications pursuant to section 302 of the Sarbanes-Oxley Act of 2002
Exhibit 99.906CERT Certifications pursuant to Section 906 of the Sarbanes-Oxley Act of 2002
SIGNATURES
Pursuant to the requirements of the Securities Exchange Act of 1934 and the Investment Company Act of 1940, the registrant has duly caused this Report to be signed on its behalf by the undersigned, there unto duly authorized.
| | |
| Legg Mason Partners Municipal Funds |
| |
| By: | | /s/ R. Jay Gerken |
| | R. Jay Gerken |
| | Chief Executive Officer of |
| | Legg Mason Partners Municipal Funds |
| |
| Date: | | June 8, 2006 |
Pursuant to the requirements of the Securities Exchange Act of 1934 and the Investment Company Act of 1940, this report has been signed below by the following persons on behalf of the registrant and in the capacities and on the dates indicated.
| | |
| |
| By: | | /s/ R. Jay Gerken |
| | R. Jay Gerken |
| | Chief Executive Officer of |
| | Legg Mason Partners Municipal Funds |
| |
| Date: | | June 8, 2006 |
| |
| By: | | /s/ Robert J. Brault |
| | Robert J. Brault |
| | Chief Financial Officer of |
| | Legg Mason Partners Municipal Funds |
| |
| Date: | | June 8, 2006 |