Exhibit 99.2
Greater Bay Bancorp
Lehman Brothers
Financial Services Conference
September 8-10, 2003
Greater Bay Bancorp
Certain matters discussed in this presentation constitute forward-looking statements within the meaning of the Private Securities Litigation Reform Act of 1995. These forward looking statements relate to the Company’s current expectations regarding future operating results, net interest margin, net loan charge-offs, asset quality, level of loan loss reserves, growth in loans and deposits, the impact of the S & C acquisition and the strength of the local economy. These forward looking statements are subject to certain risks and uncertainties that could cause the actual results, performance or achievements to differ materially from those expressed, suggested or implied by the forward looking statements. These risks and uncertainties include, but are not limited to: (1) the impact of changes in interest rates, a decline in economic conditions at the international, national and local levels and increased competition among financial service providers on the Company’s results of operations, the Company’s ability to maintain its net interest spread, and the quality of the Company’s earning assets; (2) any difficulties that may be encountered in integrating S&C and in realizing operating efficiencies; (3) government regulation; and (4) the other risks set forth in the Company‘s reports filed with the Securities and Exchange Commission, including its Annual Report on Form 10-K for the year ended December 31, 2002.
[LOGO]
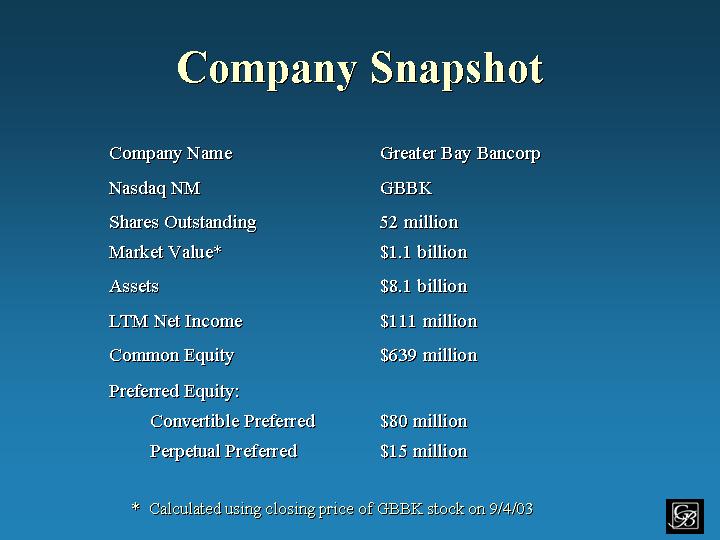
Company Snapshot
Company Name | Greater Bay Bancorp | |
Nasdaq NM | GBBK | |
Shares Outstanding | 52 million | |
Market Value* | $1.1 billion | |
Assets | $8.1 billion | |
LTM Net Income | $111 million | |
Common Equity | $639 million | |
Preferred Equity: | ||
Convertible Preferred | $80 million | |
Perpetual Preferred | $15 million |
| * | Calculated using closing price of GBBK stock on 9/4/03 |
[LOGO]

Franchise Overview
Regional Community Banking
| ¨ | Formed in late 1996 with merger of Cupertino National Bancorp and Mid-Peninsula Bancorp. |
| ¨ | Currently largest independent community bank holding company headquartered in Northern California. |
| ¨ | Diversified financial services provider. |
[LOGO]
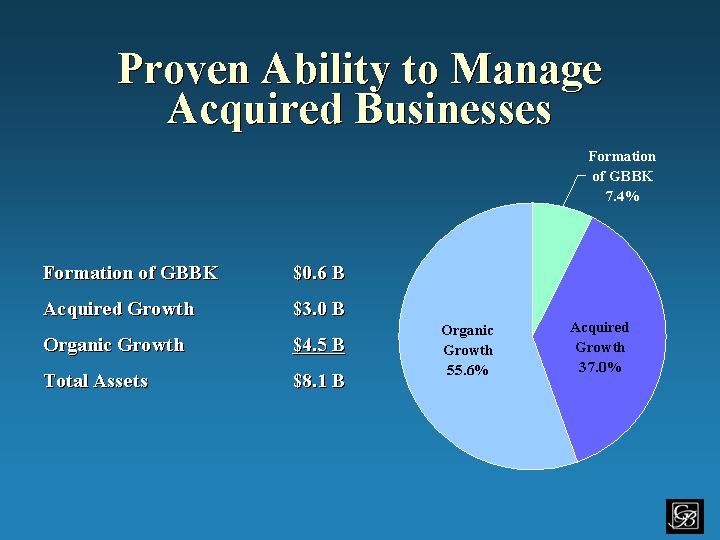
Proven Ability to Manage
Acquired Businesses
Formation of GBBK | $ | 0.6 B | |
Acquired Growth | $ | 3.0 B | |
Organic Growth | $ | 4.5 B | |
Total Assets | $ | 8.1 B |
[GRAPHIC]
[LOGO]
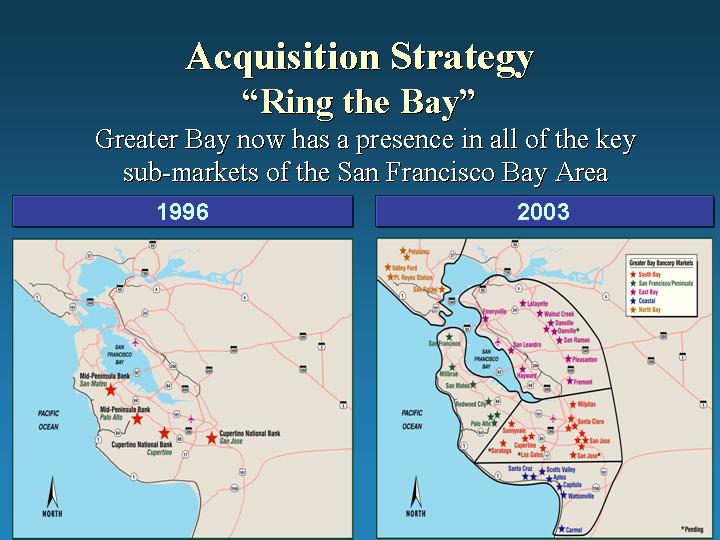
Acquisition Strategy
“Ring the Bay”
Greater Bay now has a presence in all of the key
sub-markets of the San Francisco Bay Area
| 1996 | 2003 | |
| [MAP] | [MAP] | |
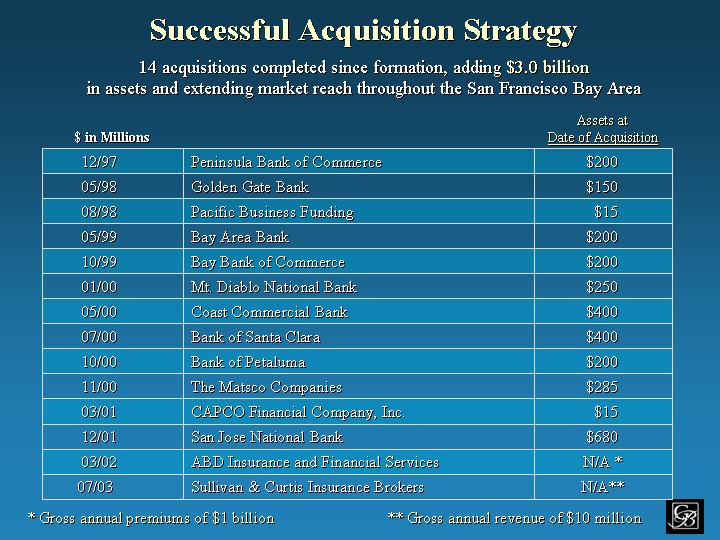
Successful Acquisition Strategy
14 acquisitions completed since formation, adding $3.0 billion
in assets and extending market reach throughout the San Francisco Bay Area
| $ in Millions | Assets at Date of Acquisition | |||||
12/97 | Peninsula Bank of Commerce | $ | 200 | |||
05/98 | Golden Gate Bank | $ | 150 | |||
08/98 | Pacific Business Funding | $ | 15 | |||
05/99 | Bay Area Bank | $ | 200 | |||
10/99 | Bay Bank of Commerce | $ | 200 | |||
01/00 | Mt. Diablo National Bank | $ | 250 | |||
05/00 | Coast Commercial Bank | $ | 400 | |||
07/00 | Bank of Santa Clara | $ | 400 | |||
10/00 | Bank of Petaluma | $ | 200 | |||
11/00 | The Matsco Companies | $ | 285 | |||
03/01 | CAPCO Financial Company, Inc. | $ | 15 | |||
12/01 | San Jose National Bank | $ | 680 | |||
03/02 | ABD Insurance and Financial Services | N/A | * | |||
07/03 | Sullivan & Curtis Insurance Brokers | N/A | ** | |||
* Gross annual premiums of $1 billion | ** Gross annual revenue of $10 million |
[LOGO]
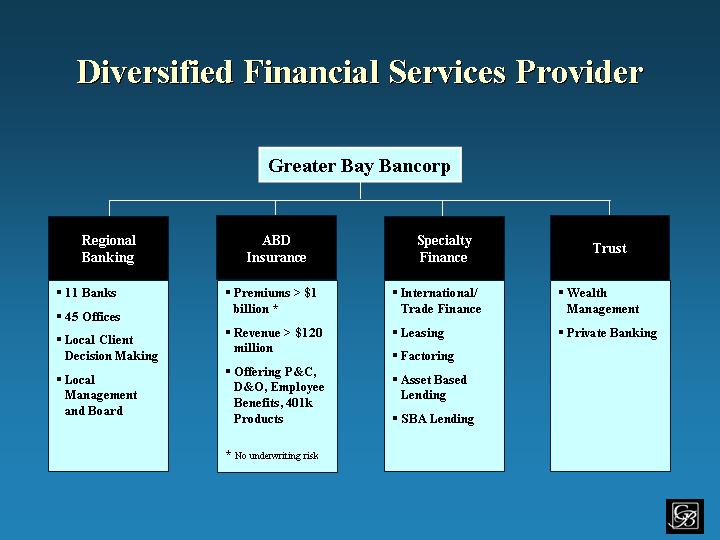
Diversified Financial Services Provider
Greater Bay Bancorp
Regional Banking | ABD Insurance | Specialty Finance | Trust | |||
n 11 Banks | n Premiums > $1 billion * | n International/ Trade Finance | n Wealth Management | |||
n 45 Offices | n Revenue > $120 million | n Leasing | n Private Banking | |||
n Local Client Decision Making | n Offering P&C, D&O, Employee Benefits, 401k Products | n Factoring | ||||
n Local Management and Board | n Asset Based Lending | |||||
n SBA Lending | ||||||
| * No underwriting risk | ||||||
[LOGO]
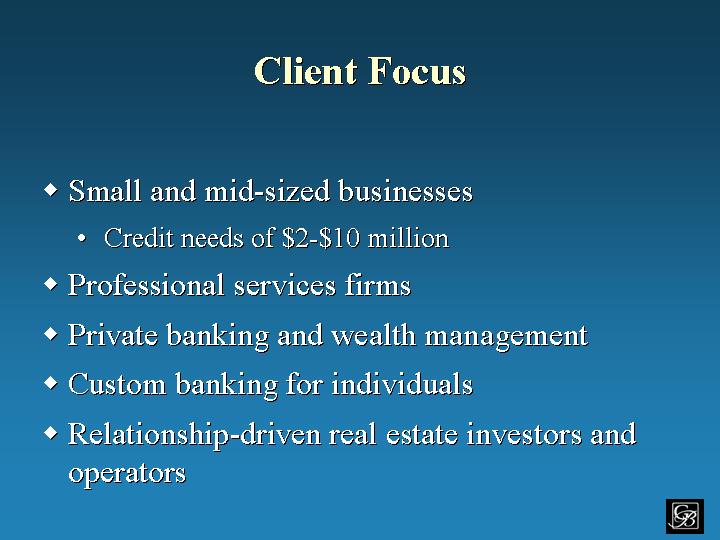
Client Focus
| ¨ | Small and mid-sized businesses |
| • | Credit needs of $2-$10 million |
| ¨ | Professional services firms |
| ¨ | Private banking and wealth management |
| ¨ | Custom banking for individuals |
| ¨ | Relationship-driven real estate investors and operators |
[LOGO]
ABD Insurance and Financial Services
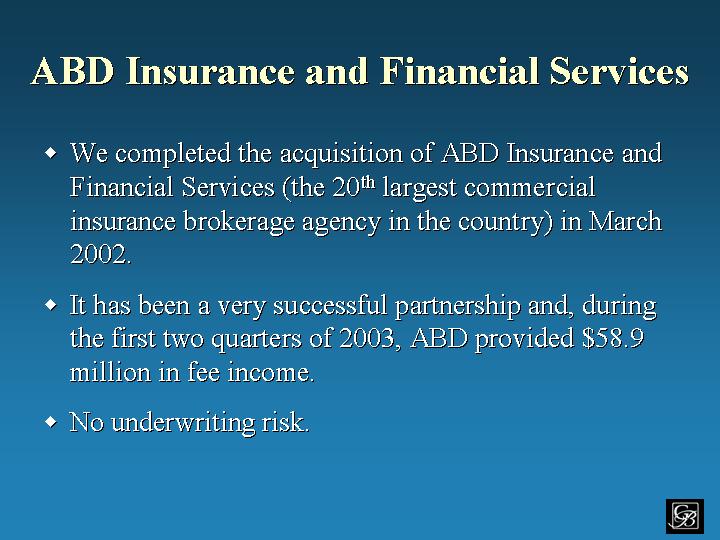
| ¨ | We completed the acquisition of ABD Insurance and Financial Services (the 20th largest commercial insurance brokerage agency in the country) in March 2002. |
| ¨ | It has been a very successful partnership and, during the first two quarters of 2003, ABD provided $58.9 million in fee income. |
| ¨ | No underwriting risk. |
[LOGO]
ABD Insurance and Financial Services
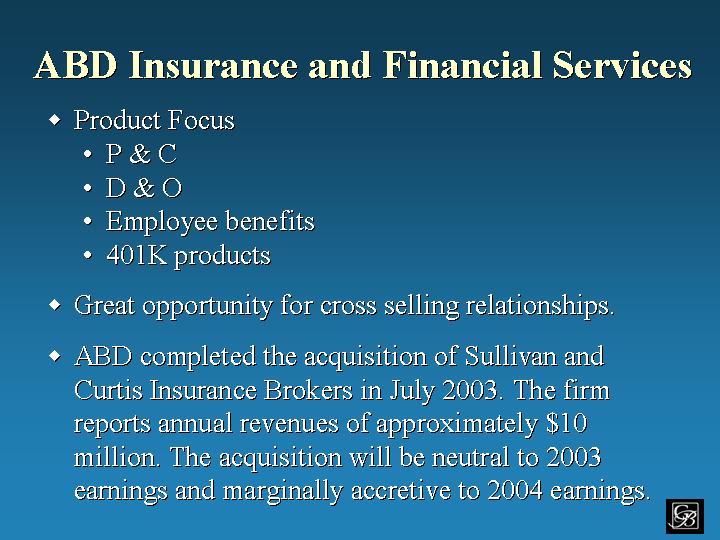
| ¨ | Product Focus |
| • | P & C |
| • | D & O |
| • | Employee benefits |
| • | 401K products |
| ¨ | Great opportunity for cross selling relationships. |
| ¨ | ABD completed the acquisition of Sullivan and Curtis Insurance Brokers in July 2003. The firm reports annual revenues of approximately $10 million. The acquisition will be neutral to 2003 earnings and marginally accretive to 2004 earnings. |
[LOGO]
Experienced Senior Management Team
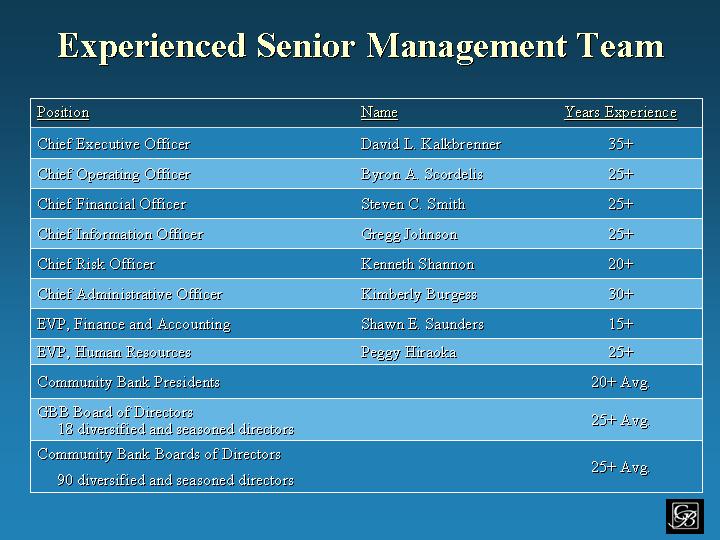
Postion | Name | Years Experience | ||
Chief Executive Officer | David L. Kalkbrenner | 35+ | ||
Chief Operating Officer | Byron A. Scordelis | 25+ | ||
Chief Financial Officer | Steven C. Smith | 25+ | ||
Chief Information Officer | Gregg Johnson | 25+ | ||
Chief Risk Officer | Kenneth Shannon | 20+ | ||
Chief Administrative Officer | Kimberly Burgess | 30+ | ||
EVP, Finance and Accounting | Shawn E. Saunders | 15+ | ||
EVP, Human Resources | Peggy Hiraoka | 25+ | ||
Community Bank Presidents | 20+ Avg. | |||
GBB Board of Directors 18 diversified and seasoned directors | 25+ Avg. | |||
Community Bank Boards of Directors 90 diversified and seasoned directors | 25+ Avg. |
[LOGO]
Q2 2003 Financial Highlights
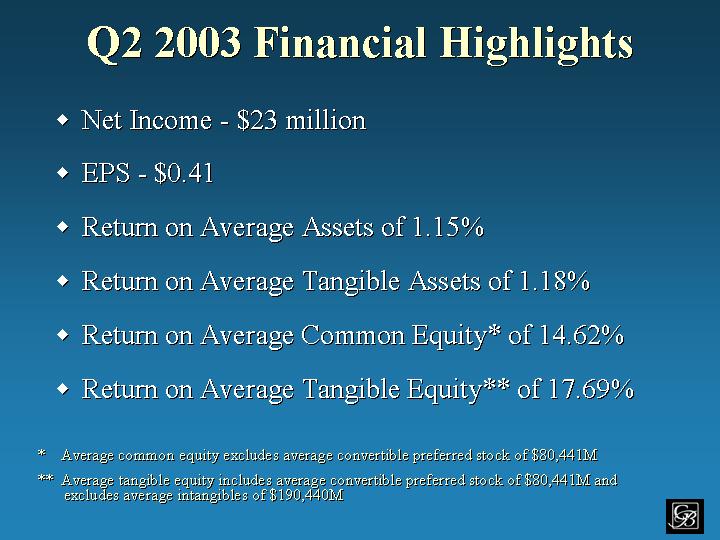
| ¨ | Net Income—$23 million |
| ¨ | EPS—$0.41 |
| ¨ | Return on Average Assets of 1.15% |
| ¨ | Return on Average Tangible Assets of 1.18% |
| ¨ | Return on Average Common Equity* of 14.62% |
| ¨ | Return on Average Tangible Equity** of 17.69% |
| * | Average common equity excludes average convertible preferred stock of $80,441M |
| ** | Average tangible equity includes average convertible preferred stock of $80,441M and excludes average intangibles of $190,440M |
[LOGO]
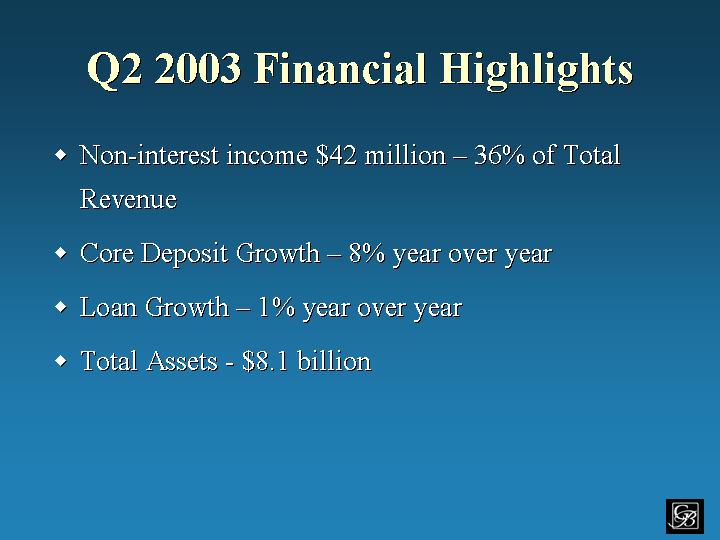
Q2 2003 Financial Highlights
| ¨ | Non-interest income $42 million—36% of Total Revenue |
| ¨ | Core Deposit Growth—8% year over year |
| ¨ | Loan Growth—1% year over year |
| ¨ | Total Assets—$8.1 billion |
[LOGO]
Credit Quality
| ¨ | Despite the challenging economic environment, our relationship banking philosophy and effective credit management efforts have resulted in levels of net charge-offs and non-performing assets in line with our peer group. |
| ¨ | Current outstandings in the non-relationship SNC portfolio are $28 million and the SNC allowance for loan and lease losses is $12 million. |
[LOGO]
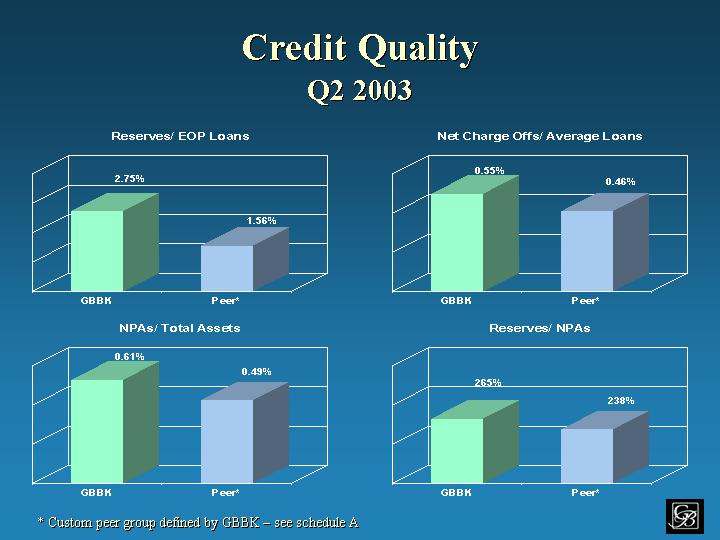
Credit Quality
Q2 2003
| Reserves/ EOP Loans | Net Charge Offs/ Average Loans | |
| [GRAPH] | [GRAPH] |
| NPAs/ Total Assets | Reserves/ NPAs | |
| [GRAPH] | [GRAPH] |
| * | Custom peer group defined by GBBK—see schedule A |
[LOGO]
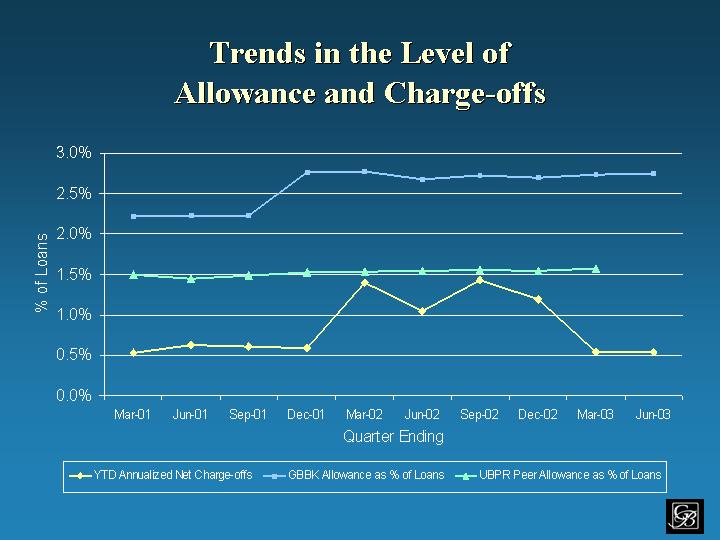
Trends in the Level of Allowance and Charge-offs
[GRAPH]
[LOGO]
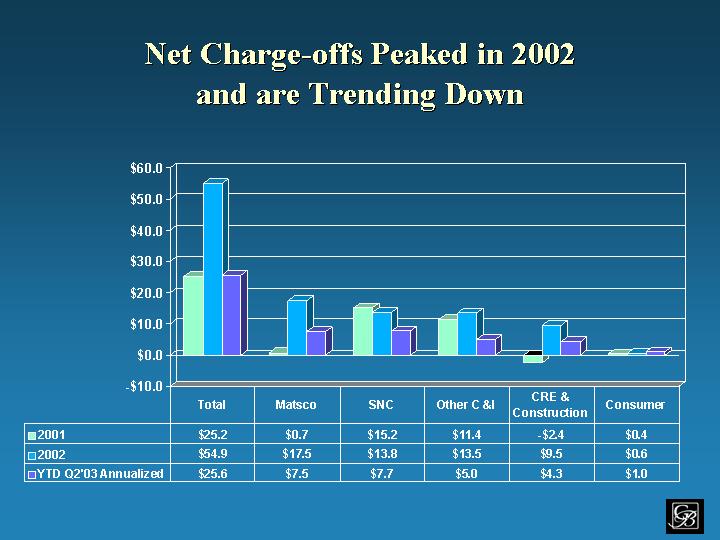
Net Charge-offs Peaked in 2002
and are Trending Down
[GRAPH]
| Total | Matsco | SNC | Other C &I | CRE & Construction | Consumer | |||||||||||||
¨ 2001 | $ | 25.2 | $ | 0.7 | $ | 15.2 | $ | 11.4 | $ | -2.4 | $ | 0.4 | ||||||
¨ 2002 | $ | 54.9 | $ | 17.5 | $ | 13.8 | $ | 13.5 | $ | 9.5 | $ | 0.6 | ||||||
¨ YTD Q2’03 Annualized | $ | 25.6 | $ | 7.5 | $ | 7.7 | $ | 5.0 | $ | 4.3 | $ | 1.0 | ||||||
[LOGO]
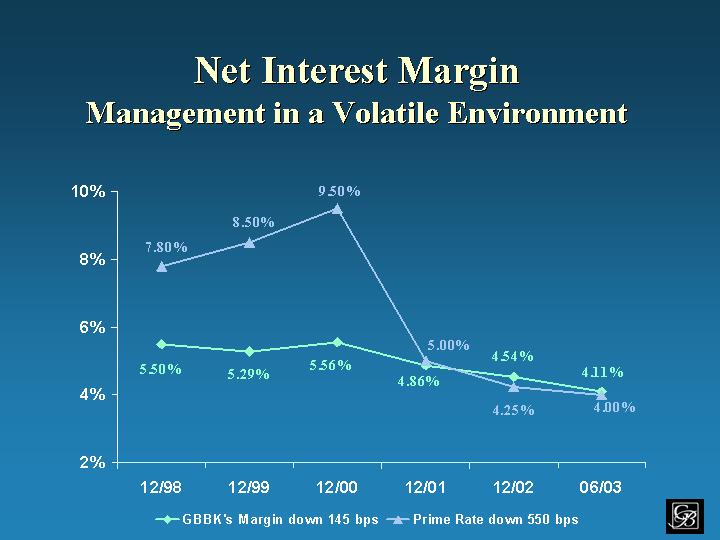
Net Interest Margin
Management in a Volatile Environment
[GRAPH]
[LOGO]
Net Interest Margin
Impact of Further Market Interest Rate Reduction
| ¨ | GBBK is asset sensitive. |
| ¨ | Over the last year, MBS portfolio has declined approximately $675 million as planned. |
| ¨ | Investment strategy continues to be to invest in short duration securities. |
| • | Give up current yield for stable value |
| • | Position Company to take advantage of rising rates in 2004 and beyond |
[LOGO]
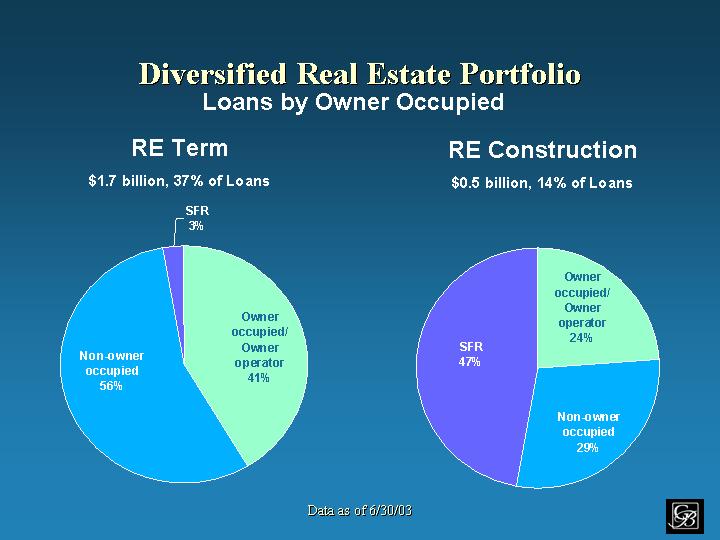
Diversified Real Estate Portfolio
Loans by Owner Occupied
| RE Term | RE Construction | |
| $1.7 billion, 3% of Loans | $0.5 billion, 14% of Loans | |
| [GRAPH] | [GRAPH] | |
Data as of 6/30/03
[LOGO]

Diversified Real Estate Portfolio
Loans by Location (County)
RE Term $1.7 billion, 37% of Loans [GRAPH] | RE Construction $0.5 billion, 14% of Loans [GRAPH] |
Financial data as of 6/30/03
[LOGO]
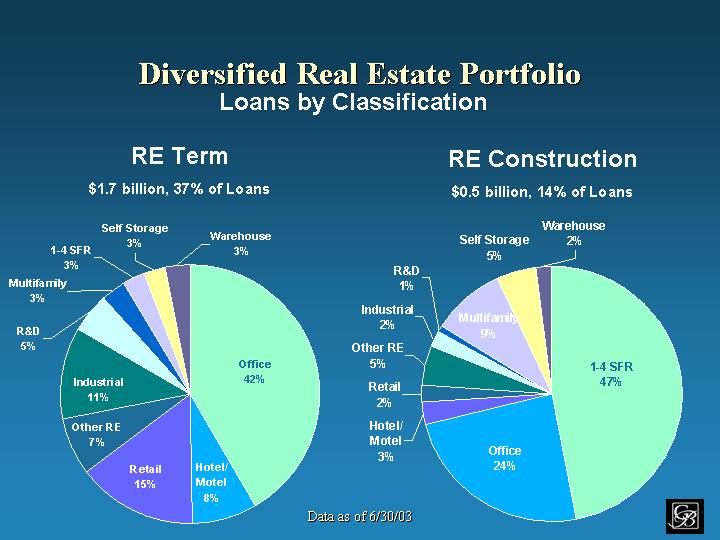
Diversified Real Estate Portfolio
Loans by Classification
| RE Term | RE Construction | |
| $1.7 billion, 37% of Loans | $0.5 billion, 14%of Loans | |
| [GRAPH] | [GRAPH] | |
Data as of 6/30/03
[LOGO]
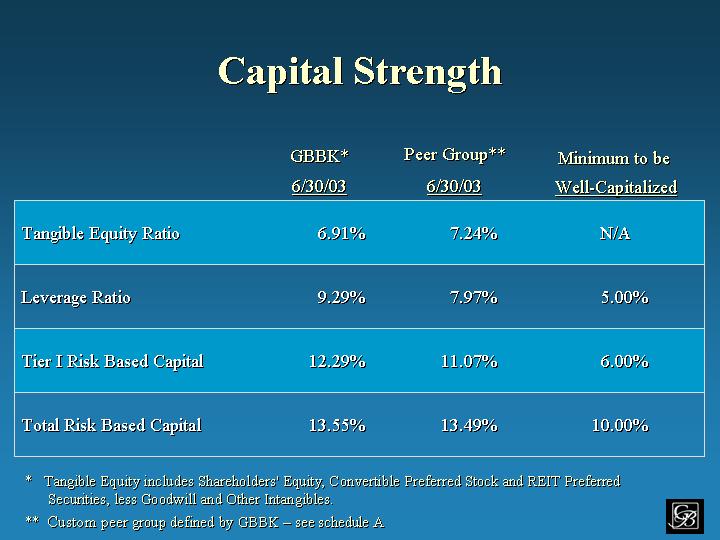
Capital Strength
GBBK* 6/30/03 | Peer Group** 6/30/03 | Minimum to be Well-Capitalized | |||||||
Tangible Equity Ratio | 6.91 | % | 7.24 | % | N/A | ||||
Leverage Ratio | 9.29 | % | 7.97 | % | 5.00 | % | |||
Tier I Risk Based Capital | 12.29 | % | 11.07 | % | 6.00 | % | |||
Total Risk Based Capital | 13.55 | % | 13.49 | % | 10.00 | % |
| * | Tangible Equity includes Shareholders’ Equity, Convertible Preferred Stock and REIT Preferred Securities, less Goodwill and Other Intangibles. |
| ** | Custom peer group defined by GBBK—see schedule A |
[LOGO]
Capital Strength
| ¨ | Our emphasis on increasing capital ratios during the past year has resulted in a tangible equity to asset ratio of 6.91%, up from 5.43% at June 30, 2002. |
| ¨ | All other capital ratios are substantially in excess of regulatory well capitalized guidelines and peers. |
[LOGO]
Economic Capital as a Foundation for
Enterprise-wide Risk Management
| ¨ | We have developed an economic capital allocation model that incorporates economic factors, historical factors and our actual operating results to measure our capital levels in relation to our risk profile. |
| ¨ | Results show returns on risk adjusted capital by business line. |
| ¨ | Results provide framework, based on risk appetite correlated to ratings targets, to determine capital GBBK can utilize to enhance shareholder returns. |
[LOGO]
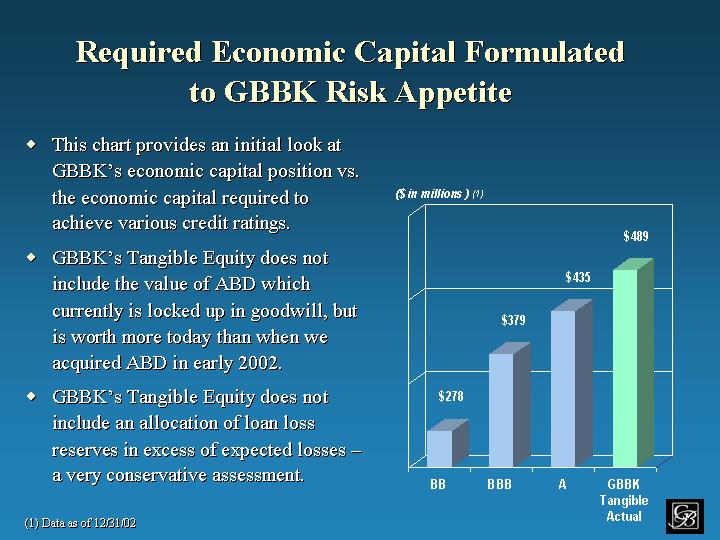
Required Economic Capital Formulated
to GBBK Risk Appetite
| ¨ | This chart provides an initial look at GBBK’s economic capital position vs. the economic capital required to achieve various credit ratings. |
| ¨ | GBBK’s Tangible Equity does not include the value of ABD which currently is locked up in goodwill, but is worth more today than when we acquired ABD in early 2002. |
| ¨ | GBBK’s Tangible Equity does not include an allocation of loan loss reserves in excess of expected losses—a very conservative assessment. |
[GRAPH]
| (1) | Data as of 12/31/02 |
[LOGO]
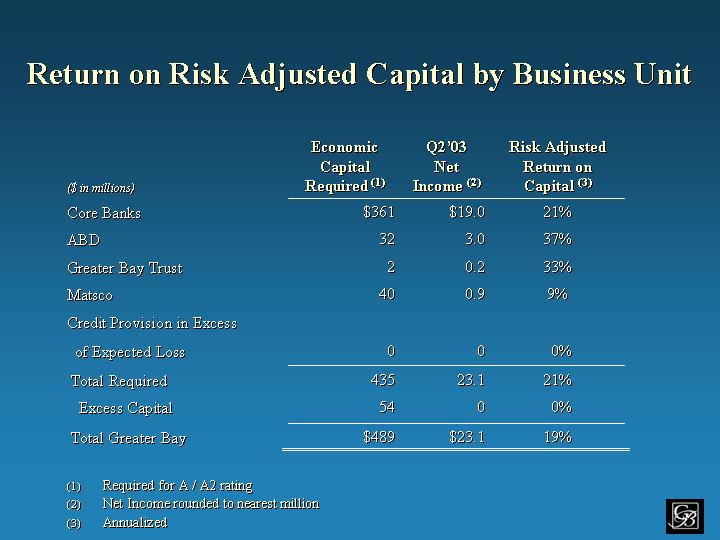
Return on Risk Adjusted Capital by Business Unit
| ($ in millions) | Economic Required(1) | Q2’03 Income(2) | Risk Adjusted Return on Capital(3) | ||||||
Core Banks | $ | 361 | $ | 19.0 | 21 | % | |||
ABD | 32 | 3.0 | 37 | % | |||||
Greater Bay Trust | 2 | 0.2 | 33 | % | |||||
Matsco | 40 | 0.9 | 9 | % | |||||
Credit Provision in Excess of Expected Loss | 0 | 0 | 0 | % | |||||
Total Required | 435 | 23.1 | 21 | % | |||||
Excess Capital | 54 | 0 | 0 | % | |||||
Total Greater Bay | $ | 489 | $ | 23.1 | 19 | % | |||
| (1) | Required for A / A2 rating |
| (2) | Net Income rounded to nearest million |
| (3) | Annualized |
[LOGO]

Looking Forward:
Our Strategy for 2004 and Beyond
Our Future is a Reaffirmation
of Our Past
| ¨ | The Bay Area economy is mired in an economic slump which has affected our state and our nation,but |
| • | We believe that this remains one of the greatest economic regions in the world. |
| • | And the Bay Area will remain the focal point of our strategic future. |
[LOGO]
“ We are heartened that expectations for the next six months have improved and are keeping our fingers crossed that this growing confidence can produce capital spending to grease the gears of the economy and jumpstart positive growth.”
Bay Area Council
Business Confidence Survey
May 2003
[LOGO]
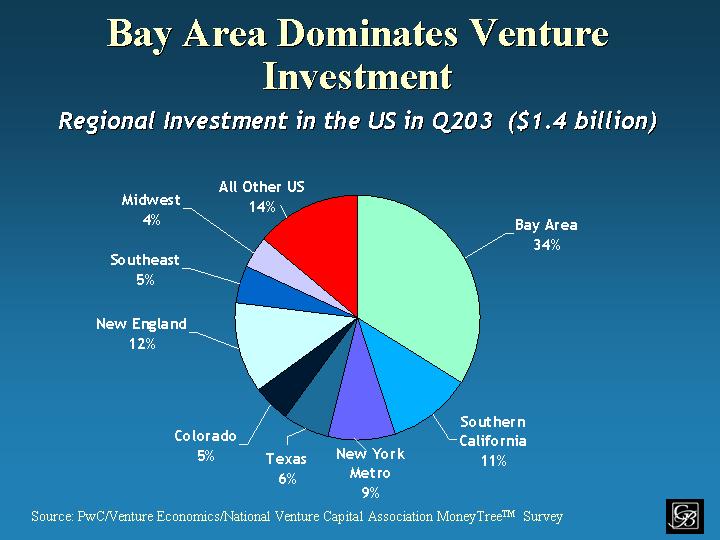
Bay Area Dominates Venture
Investment
Regional Investment in the US in Q203 ($1.4 billion)
[GRAPH]
Source: PwC/Venture Economics/National Venture Capital Association MoneyTree™ Survey
[LOGO]
Our Future is a Reaffirmation of Our Past
| ¨ | We believe thatrelationship banking rather thantransactional banking must remain at the core of our business model. |
| • | The local market knowledge of our community bankers provide an advantage that is difficult to match. |
| • | The strength of our credit portfolio affirms this belief and defies the skeptics. |
[LOGO]
Our Future is a Reaffirmation of Our Past
| ¨ | We believe that an uncompromising focus on quality will differentiate us from our peers and is the key that will deliver superior long-term value to our shareholders |
| • | Credit quality |
| • | Operating quality |
| • | Attention to detail in serving our clients |
[LOGO]
Our Future is a Reaffirmation of Our Past
| ¨ | We understand that this is a business and that we work for our shareholders. |
| • | We have no divine right to exist as a business. |
| • | Most efficient competitor sets profit margin for everyone else. |
| • | Our focus must be on factors that deliver quality results. |
| • | Selling money is a commodity business providing exceptional service is a value business. |
[LOGO]
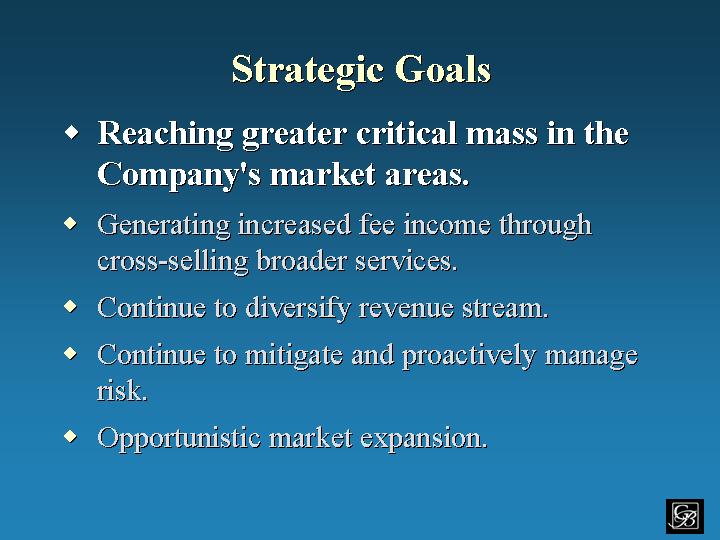
Strategic Goals
| ¨ | Reaching greater critical mass in the Company’s market areas. |
| ¨ | Generating increased fee income through cross-selling broader services. |
| ¨ | Continue to diversify revenue stream. |
| ¨ | Continue to mitigate and proactively manage risk. |
| ¨ | Opportunistic market expansion. |
[LOGO]
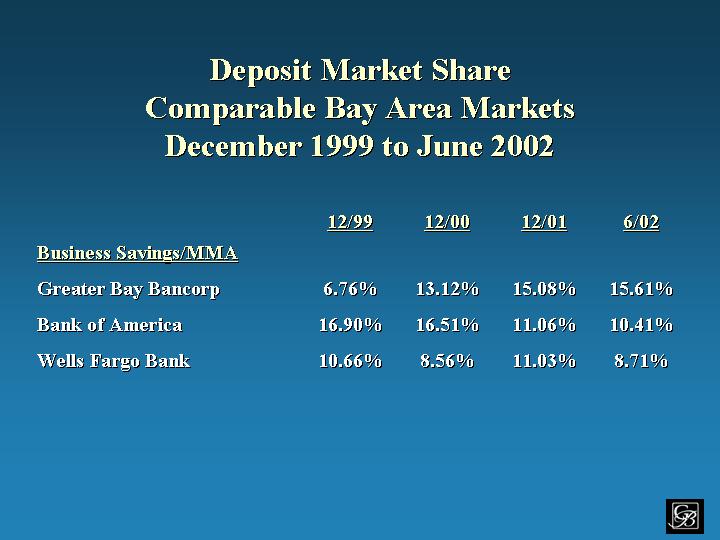
Deposit Market Share
Comparable Bay Area Markets
December 1999 to June 2002
| 12/99 | 12/00 | 12/01 | 6/02 | |||||||||
Business Savings/MMA | ||||||||||||
Greater Bay Bancorp | 6.76 | % | 13.12 | % | 15.08 | % | 15.61 | % | ||||
Bank of America | 16.90 | % | 16.51 | % | 11.06 | % | 10.41 | % | ||||
Wells Fargo Bank | 10.66 | % | 8.56 | % | 11.03 | % | 8.71 | % |
[LOGO]

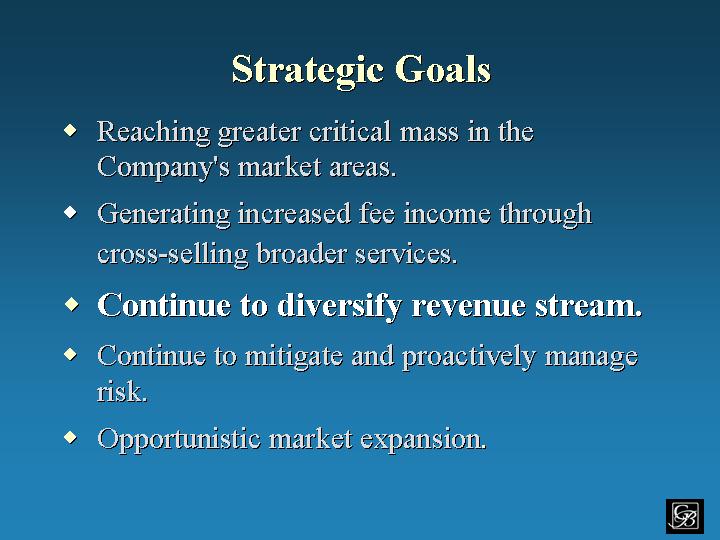
Strategic Goals
| ¨ | Reaching greater critical mass in the Company’s market areas. |
| ¨ | Generating increased fee income through cross-selling broader services. |
| ¨ | Continue to diversify revenue stream. |
| ¨ | Continue to mitigate and proactively manage risk. |
| ¨ | Opportunistic market expansion |
[LOGO]
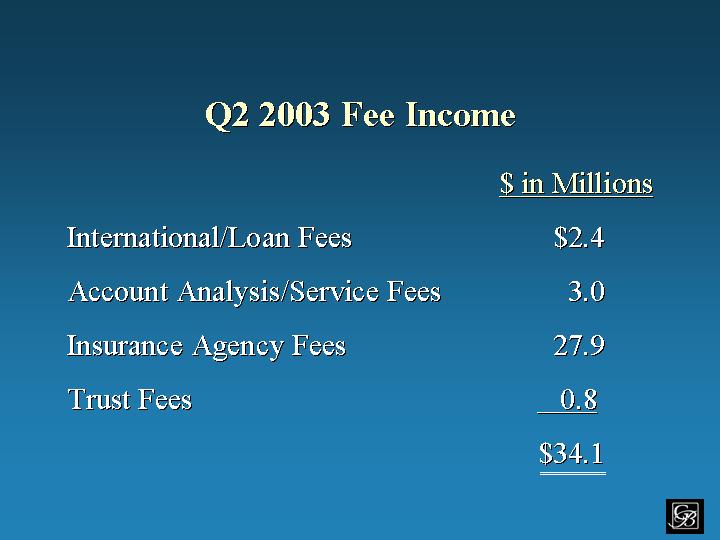
Q2 2003 Fee Income
| $ in Millions | |||
International/ Loan Fees | $ | 2.4 | |
Account Analysis/ Service Fees | 3.0 | ||
Insurance Agency Fees | 27.9 | ||
Trust Fees | 0.8 | ||
| $ | 34.1 | ||
[LOGO]
Strategic Goals
| ¨ | Reaching greater critical mass in the Company’s market areas. |
| ¨ | Generating increased fee income through cross-selling broader services. |
| ¨ | Continue to diversify revenue stream. |
| ¨ | Continue to mitigate and proactively manage risk. |
| ¨ | Opportunistic market expansion. |
[LOGO]
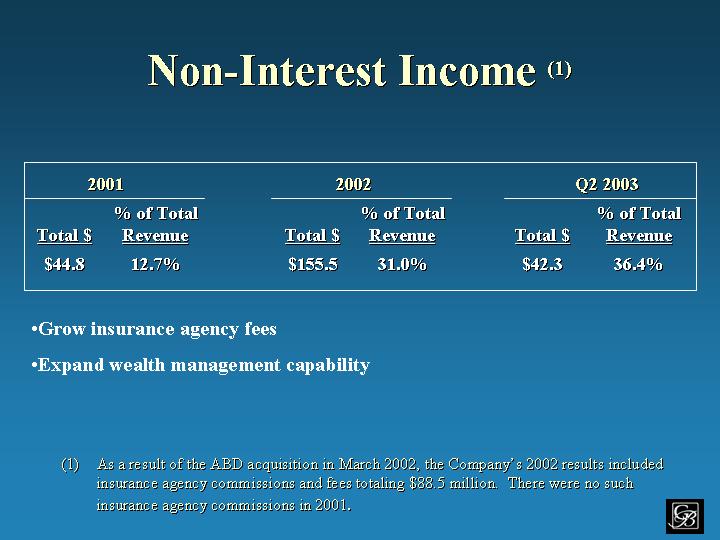
Non-Interest Income(1)
2001 | 2002 | Q2 2003 | ||||||||
Total $ | % of Total Revenue | Total $ | % of Total Revenue | Total $ | % of Total Revenue | |||||
| $ 44.8 | 12.7% | $ 155.5 | 31.0% | $ 42.3 | 36.4% | |||||
| • | Grow insurance agency fees |
| • | Expand wealth management capability |
| (1) | As a result of the ABD acquisition in March 2002, the Company’s 2002 results included insurance agency commissions and fees totaling $88.5 million. There were no such insurance agency commissions in 2001. |
[LOGO]
Strategic Goals
| ¨ | Reaching greater critical mass in the Company’s market areas. |
| ¨ | Generating increased fee income through cross-selling broader services. |
| ¨ | Continue to diversify revenue stream. |
| ¨ | Continue to mitigate and proactively manage risk. |
| ¨ | Opportunistic market expansion. |
[LOGO]
Mitigate and Proactively Manage Risk
| ¨ | Enterprise-wide Risk Management |
| ¨ | Economic Capital Analysis |
| ¨ | Concentration Analysis |
| ¨ | Focus on Relationships |
[LOGO]
Strategic Goals
| ¨ | Reaching greater critical mass in the Company’s market areas. |
| ¨ | Generating increased fee income through cross-selling broader services. |
| ¨ | Continue to diversify revenue stream. |
| ¨ | Continue to mitigate and proactively manage risk. |
| ¨ | Opportunistic market expansion. |
[LOGO]
Opportunistic Market
Expansion
| ¨ | De novo regional offices |
| ¨ | Upscale retail banking |
| ¨ | Acquisitions of community banks, insurance agencies and wealth management companies |
[LOGO]
Market Concerns About GBBK
| ¨ | The Northern California economy, the state deficit, the dot com fall-out and the technology industry in Silicon Valley. |
| ¨ | Real estate valuations, lease rates and vacancy factors in the San Francisco Bay Area. |
| ¨ | Impact of Fed rate decreases on net interest margin. |
| ¨ | Market perception of GBBK’s credit quality and overall risk profile. |
[LOGO]
Guidance
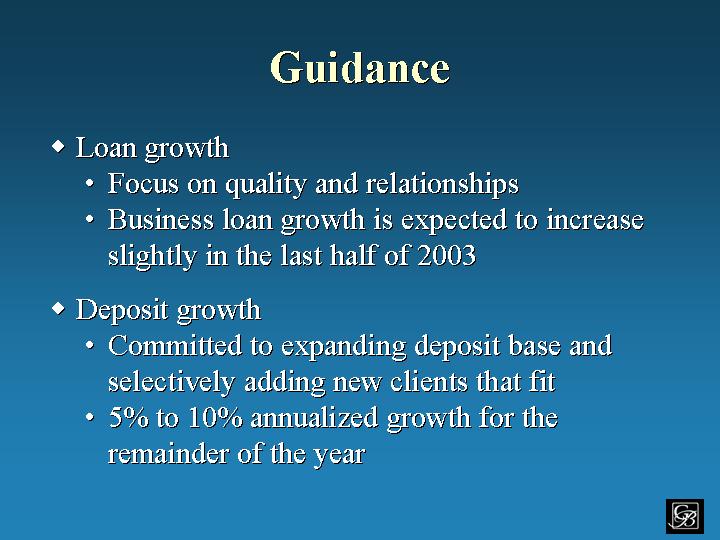
| ¨ | Loan growth |
| • | Focus on quality and relationships |
| • | Business loan growth is expected to increase slightly in the last half of 2003 |
| ¨ | Deposit growth |
| • | Committed to expanding deposit base and selectively adding new clients that fit |
| • | 5% to 10% annualized growth for the remainder of the year |
[LOGO]
Guidance
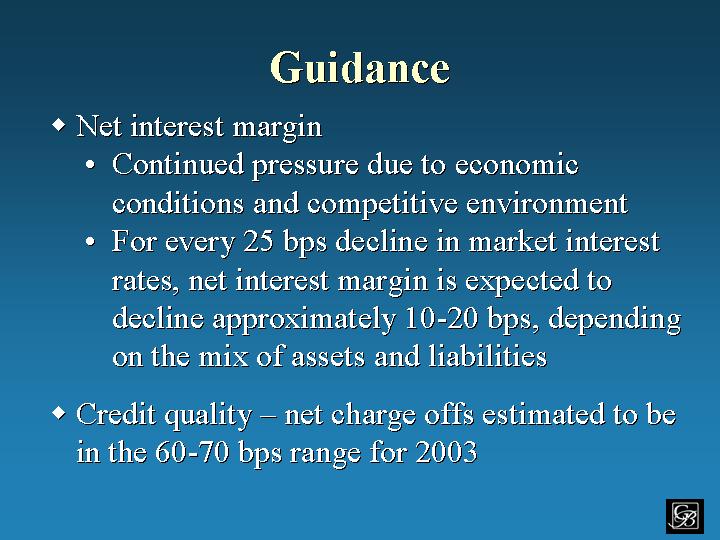
| ¨ | Net interest margin |
| • | Continued pressure due to economic conditions and competitive environment |
| • | For every 25 bps decline in market interest rates, net interest margin is expected to decline approximately 10-20 bps, depending on the mix of assets and liabilities |
| ¨ | Credit quality—net charge offs estimated to be in the 60-70 bps range for 2003 |
[LOGO]
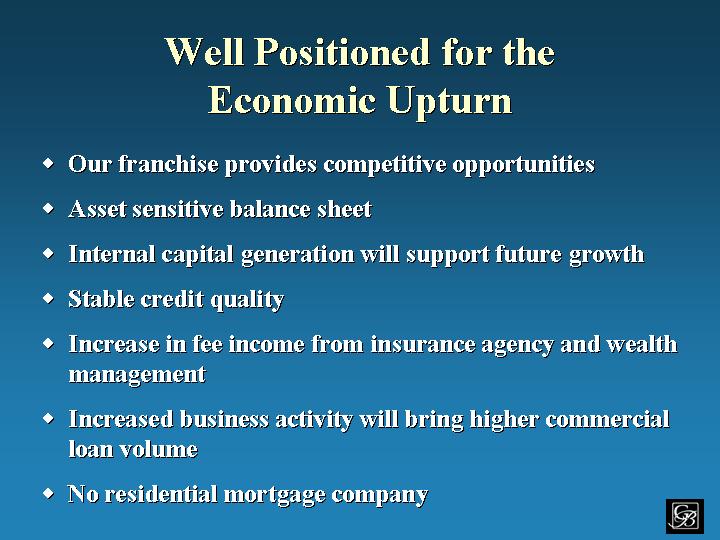
Well Positioned for the Economic Upturn
| ¨ | Our franchise provides competitive opportunities |
| ¨ | Asset sensitive balance sheet |
| ¨ | Internal capital generation will support future growth |
| ¨ | Stable credit quality |
| ¨ | Increase in fee income from insurance agency and wealth management |
| ¨ | Increased business activity will bring higher commercial loan volume |
| ¨ | No residential mortgage company |
[LOGO]
Schedule A—Custom Peer Group
Allfirst Financial, Inc. | Fulton Financial Corporation | |
Associated Banc-Corp | Greater Bay Bancorp | |
BancorpSouth, Inc. | Hibernia Corporation | |
Bank of Hawaii Corporation | Hudson United Bancorp | |
BOK Financial Corporation | International Bancshares Corporation | |
Bremer Financial Corporation | Mercantile Bankshares Corporation | |
Central Bancompany | Old National Bancorp | |
Citizens Banking Corporation | Provident Financial Group, Inc. | |
City National Corporation | RBC Centura Banks, Inc. | |
Colonial BancGroup, Inc. | Riggs National Corporation | |
Commerce Bancorp, Inc. | Sky Financial Group Inc. | |
Commerce Bancshares, Inc. | South Financial Group, Inc. (The) | |
Community First Bankshares, Inc. | Southwest Bancorporation of Texas, Inc. | |
Cullen/Frost Bankers, Inc. | Susquehanna Bancshares, Inc. | |
F.N.B. Corporation | Synovus Financial Corp. | |
FBOP Corporation | TCF Financial Corporation | |
First Banks, Inc. | Trustmark Corporation | |
First Citizens BancShares, Inc. | UMB Financial Corporation | |
First Midwest Bancorp, Inc. | United Bankshares, Inc. | |
First National of Nebraska, Incorporated | Valley National B0ancorp | |
First Virginia Banks, Inc. | Whitney Holding Corporation | |
Firstbank Holding Company of Colorado | Wilmington Trust Corporation | |
FirstMerit Corporation |
[LOGO]