Exhibit 99.2
Greater Bay Bancorp Slide Presentation
for March 10, 2004 Sandler O’Neill & Partners L.P. Financial Services Conference
Sandler O’Neill & Partners, L.P. West Coast Financial Services Conference
March 9-11, 2004
Greater Bay Bancorp
Certain matters discussed in this presentation constitute forward-looking statements within the meaning of the Private Securities Litigation Reform Act of 1995. These forward looking statements relate to the Company’s current expectations regarding future operating results, the bank subsidiary consolidation, net interest margin, net loan charge-offs, asset quality, level of loan loss reserves, growth in loans and deposits and the strength of the local economy. These forward looking statements are subject to certain risks and uncertainties that could cause the actual results, performance or achievements to differ materially from those expressed, suggested or implied by the forward looking statements. These risks and uncertainties include, but are not limited to: (1) the impact of changes in interest rates, a decline in economic conditions at the international, national and local levels and increased competition among financial service providers on the Company’s results of operations, the Company’s ability to maintain its net interest spread, and the quality of the Company’s earning assets; (2) any difficulties that may be encountered in integrating newly acquired businesses, consolidating the bank subsidiaries and in realizing operating efficiencies; (3) government regulation; and (4) the other risks set forth in the Company’s reports filed with the Securities and Exchange Commission, including its Annual Report on Form 10-K for the year ended December 31, 2003. Greater Bay does not undertake, and specifically disclaims, any obligation to update any forward-looking statements to reflect occurrences or unanticipated events or circumstances after the date of such statements.
2
Table of Contents
Agenda
I. Overview of Greater Bay Bancorp
II. Recent Developments
III. Financial Highlights
IV. Looking Forward: Our Strategy for 2004 and Beyond
V. Investment Rationale
VI. Appendix
3

Overview of Greater Bay Bancorp
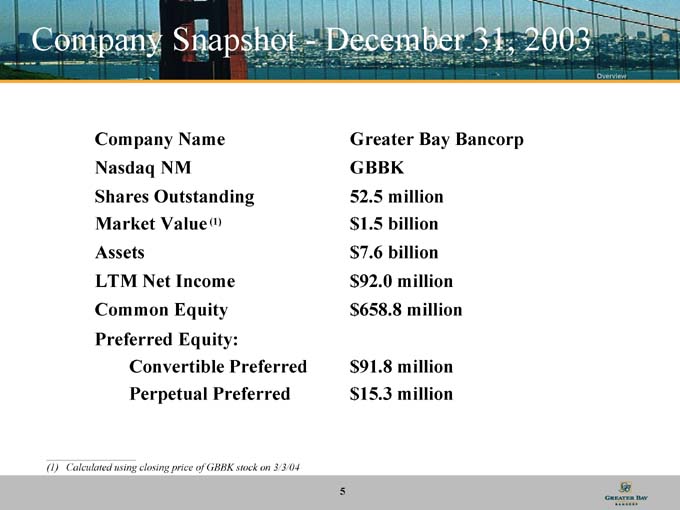
Company Snapshot—December 31, 2003
Overview
Company Name
Nasdaq NM
Shares Outstanding
Market Value(1)
Assets
LTM Net Income
Common Equity
Preferred Equity:
Convertible Preferred
Perpetual Preferred
Greater Bay Bancorp GBBK
52.5 million
$1.5 billion
$7.6 billion
$92.0 million
$658.8 million
$91.8 million
$15.3 million
(1) Calculated using closing price of GBBK stock on 3/3/04
5
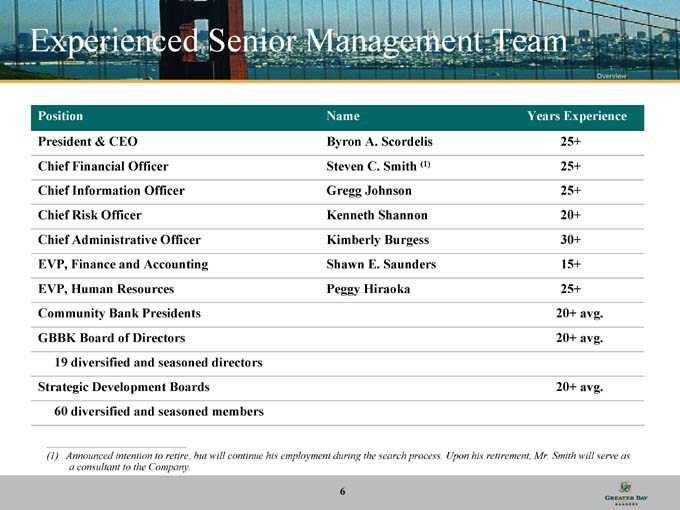
Experienced Senior Management Team
Overview
Position Name Years Experience
President & CEO Byron A. Scordelis 25+
Chief Financial Officer Steven C. Smith (1) 25+
Chief Information Officer Gregg Johnson 25+
Chief Risk Officer Kenneth Shannon 20+
Chief Administrative Officer Kimberly Burgess 30+
EVP, Finance and Accounting Shawn E. Saunders 15+
EVP, Human Resources Peggy Hiraoka 25+
Community Bank Presidents 20+ avg.
GBBK Board of Directors 20+ avg.
19 diversified and seasoned directors
Strategic Development Boards 20+ avg.
60 diversified and seasoned members
(1) Announced intention to retire, but will continue his employment during the search process. Upon his retirement, Mr. Smith will serve as a consultant to the Company.
6
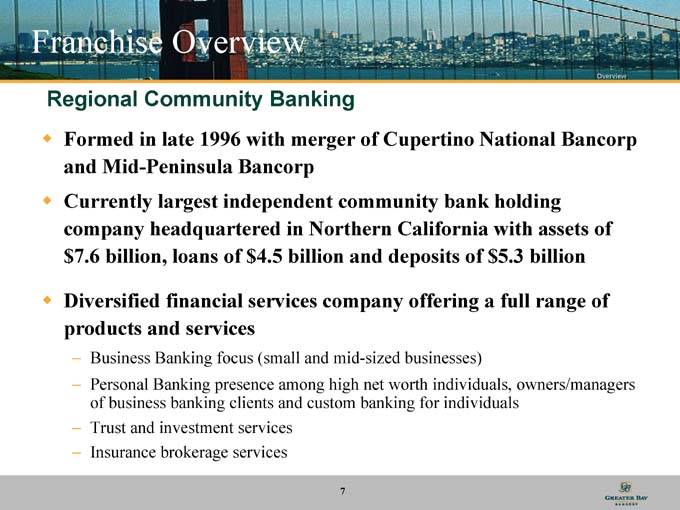
Franchise Overview
Overview
Regional Community Banking
. Formed in late 1996 with merger of Cupertino National Bancorp and Mid-Peninsula Bancorp
. Currently largest independent community bank holding company headquartered in Northern California with assets of $7.6 billion, loans of $4.5 billion and deposits of $5.3 billion
. Diversified financial services company offering a full range of products and services
- Business Banking focus (small and mid-sized businesses)
- Personal Banking presence among high net worth individuals, owners/managers of business banking clients and custom banking for individuals
- Trust and investment services
- Insurance brokerage services
7
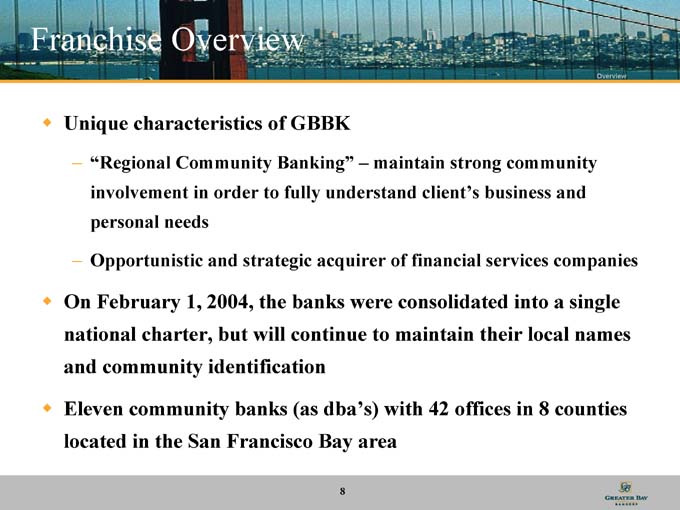
Franchise Overview
Overview
. Unique characteristics of GBBK
- “Regional Community Banking” – maintain strong community involvement in order to fully understand client’s business and personal needs
- Opportunistic and strategic acquirer of financial services companies
. On February 1, 2004, the banks were consolidated into a single national charter, but will continue to maintain their local names and community identification
. Eleven community banks (as dba’s) with 42 offices in 8 counties located in the San Francisco Bay area
8
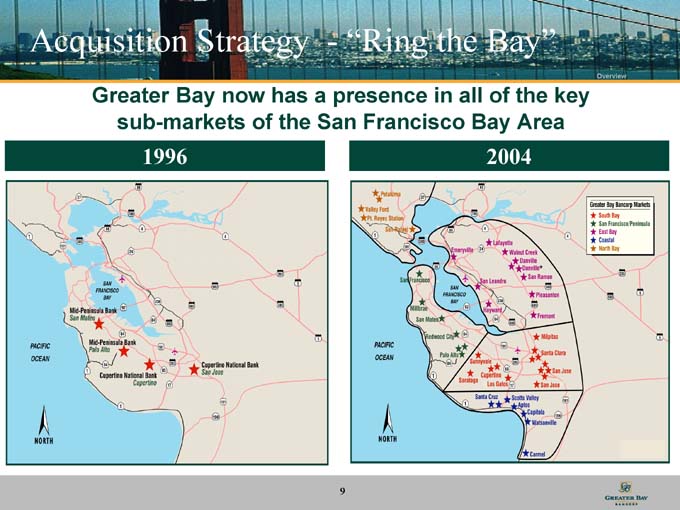
Acquisition Strategy - - “Ring the Bay”
Overview
Greater Bay now has a presence in all of the key sub-markets of the San Francisco Bay Area
1996
2004
9
Successful Acquisition Strategy
Overview
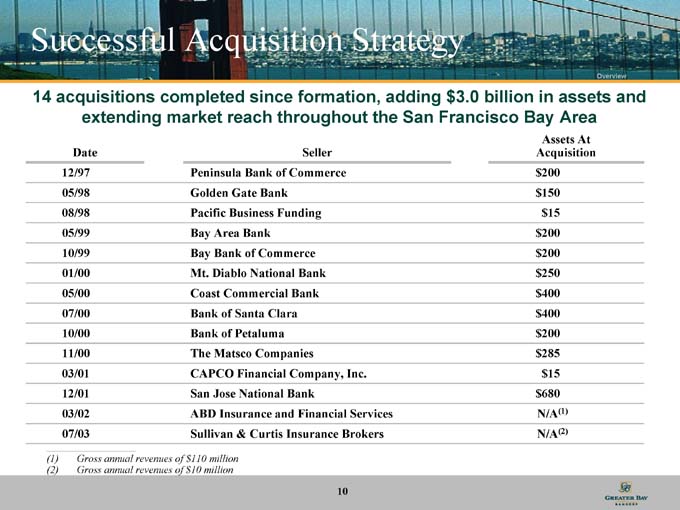
14 acquisitions completed since formation, adding $3.0 billion in assets and extending market reach throughout the San Francisco Bay Area
Assets At
Date Seller Acquisition
12/97 Peninsula Bank of Commerce $ 200
05/98 Golden Gate Bank $ 150
08/98 Pacific Business Funding $ 15
05/99 Bay Area Bank $ 200
10/99 Bay Bank of Commerce $ 200
01/00 Mt. Diablo National Bank $ 250
05/00 Coast Commercial Bank $ 400
07/00 Bank of Santa Clara $ 400
10/00 Bank of Petaluma $ 200
11/00 The Matsco Companies $ 285
03/01 CAPCO Financial Company, Inc. $ 15
12/01 San Jose National Bank $ 680
03/02 ABD Insurance and Financial Services N/A(1)
07/03 Sullivan & Curtis Insurance Brokers N/A(2)
(1) Gross annual revenues of $110 million
(2) Gross annual revenues of $10 million
10
Business Lines
Overview
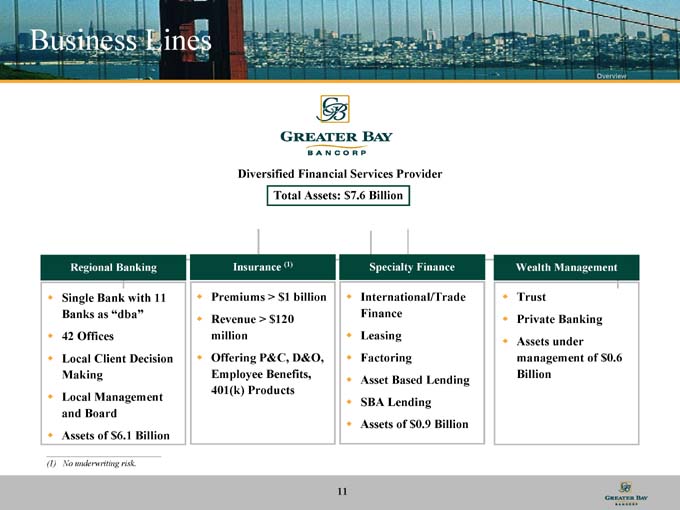
Diversified Financial Services Provider
Total Assets: $7.6 Billion
Regional Banking
Single Bank with 11 Banks as “dba”
42 Offices
Local Client Decision Making
Local Management and Board
Assets of $6.1 Billion
Insurance (1)
Premiums > $1 billion
Revenue > $120 million
Offering P&C, D&O, Employee Benefits, 401(k) Products
Specialty Finance
International/Trade Finance
Leasing
Factoring
Asset Based Lending
SBA Lending
Assets of $0.9 Billion
Wealth Management
Trust
Private Banking
Assets under management of $0.6 Billion
(1) No underwriting risk.
11

Recent Developments
Recent Developments
Recent Developments
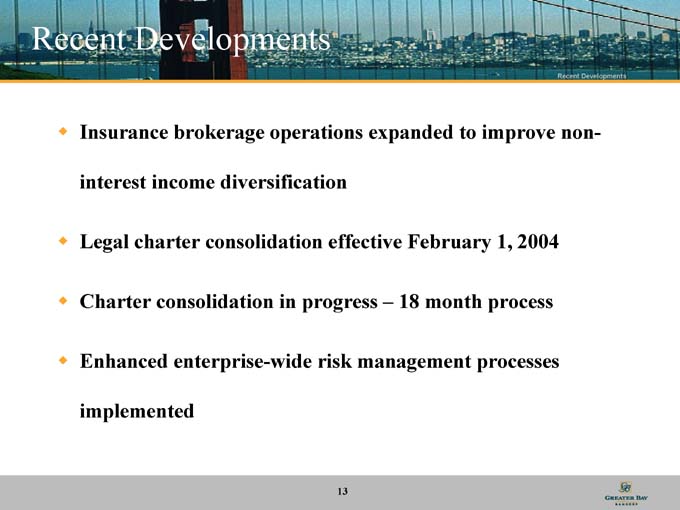
. Insurance brokerage operations expanded to improve non-interest income diversification
. Legal charter consolidation effective February 1, 2004
. Charter consolidation in progress – 18 month process
. Enhanced enterprise-wide risk management processes implemented
13
Charter Consolidation
Recent Developments
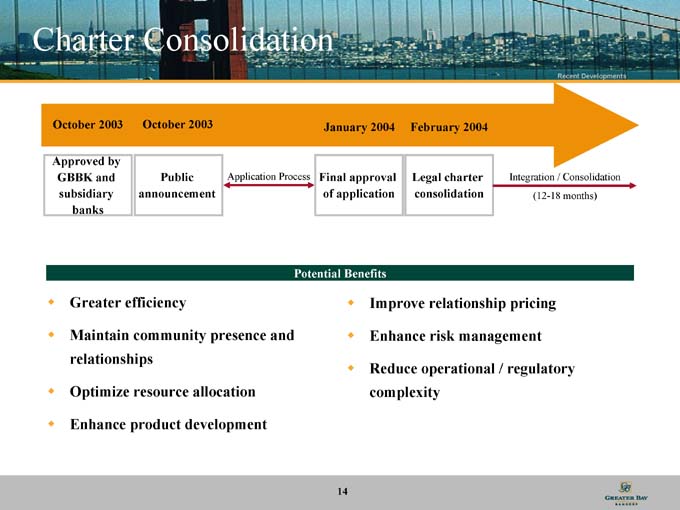
October 2003
Approved by GBBK and subsidiary banks
October 2003
Public announcement
Application Process
January 2004
Final approval of application
February 2004
Legal charter consolidation
Integration / Consolidation (12-18 months)
Potential Benefits
. Greater efficiency
. Maintain community presence and relationships
. Optimize resource allocation
. Enhance product development
. Improve relationship pricing
. Enhance risk management
. Reduce operational / regulatory complexity
14
Enhanced Risk Management
Recent Developments
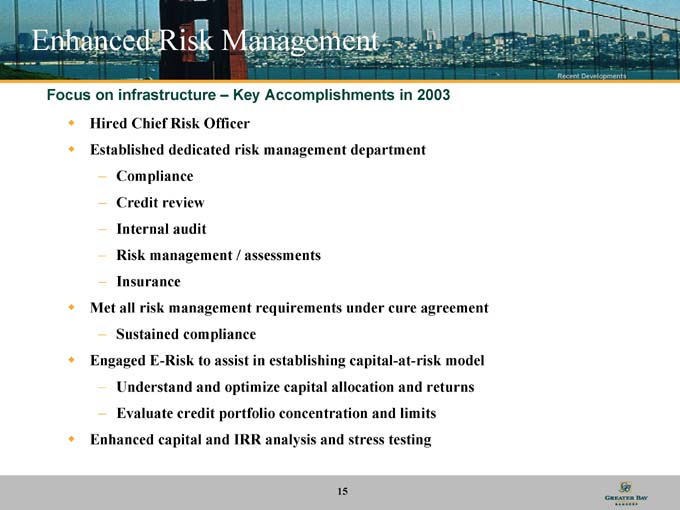
Focus on infrastructure – Key Accomplishments in 2003
. Hired Chief Risk Officer
. Established dedicated risk management department
- Compliance
- Credit review
- Internal audit
- Risk management / assessments
- Insurance
. Met all risk management requirements under cure agreement
- Sustained compliance
. Engaged E-Risk to assist in establishing capital-at-risk model
- Understand and optimize capital allocation and returns
- ?Evaluate credit portfolio concentration and limits
. Enhanced capital and IRR analysis and stress testing
15
ABD Insurance and Financial Services
Recent Developments
We completed the acquisition of ABD Insurance and Financial Services (currently the 20th largest commercial insurance brokerage agency in the country) in March 2002
It has been a very successful partnership and, during 2003, ABD provided $117.5 million in fee income with no underwriting risk
16
Significant Growth in Insurance Income
Recent Developments
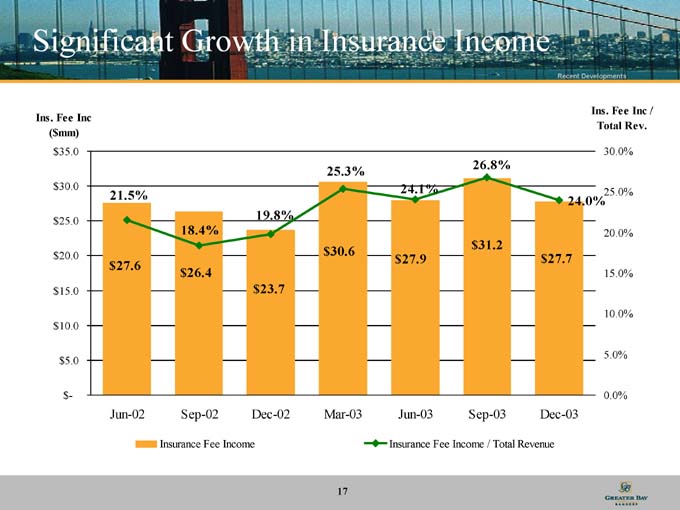
Ins. Fee Inc ($mm) Ins. Fee Inc / Total Rev.
21.5%
$27.6
Jun-02
18.4%
$26.4
Sep-02
19.8%
$23.7
Dec-02
25.3%
$30.6
Mar-03
24.1%
$27.9
Jun-03
26.8%
$31.2
Sep-03
24.0%
$27.7
Dec-03
Insurance Fee Income
Insurance Fee Income / Total Revenue
17
ABD Insurance and Financial Services
Recent Developments
. Product Focus
- P & C
- D & O
- Employee benefits
- 401K products
. Great opportunity for cross selling relationships
. ABD completed the acquisition of Sullivan and Curtis Insurance Brokers in July 2003
- The firm generates annual revenues of approximately $10 million
- The acquisition was neutral to 2003 earnings and marginally accretive to 2004 earnings
18

Financial Highlights
Q4 2003 Financial Highlights
Financial Highlights
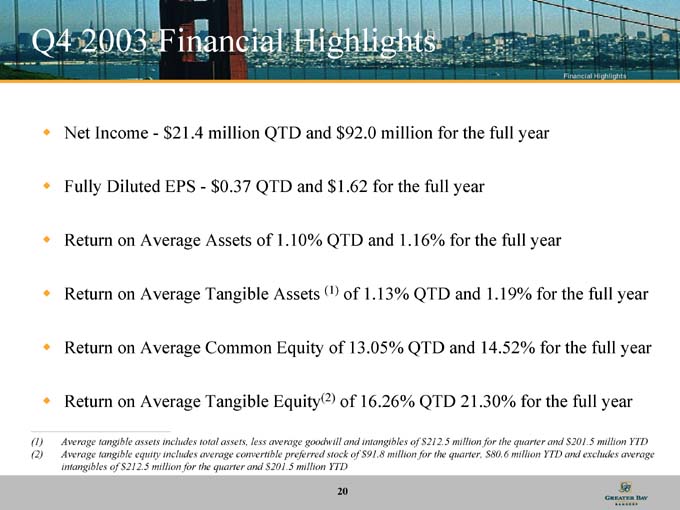
. Net Income—$21.4 million QTD and $92.0 million for the full year
. Fully Diluted EPS—$0.37 QTD and $1.62 for the full year
. Return on Average Assets of 1.10% QTD and 1.16% for the full year
. Return on Average Tangible Assets (1) of 1.13% QTD and 1.19% for the full year
. Return on Average Common Equity of 13.05% QTD and 14.52% for the full year
. Return on Average Tangible Equity(2) of 16.26% QTD 21.30% for the full year
(1) Average tangible assets includes total assets, less average goodwill and intangibles of $212.5 million for the quarter and $201.5 million YTD
(2) Average tangible equity includes average convertible preferred stock of $91.8 million for the quarter, $80.6 million YTD and excludes average intangibles of $212.5 million for the quarter and $201.5 million YTD
20
Q4 2003 Financial Highlights
Financial Highlights
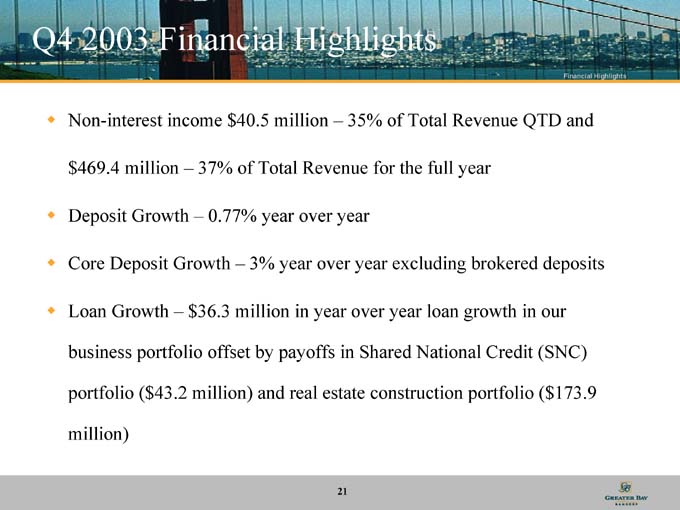
. Non-interest income $40.5 million – 35% of Total Revenue QTD and $469.4 million – 37% of Total Revenue for the full year
. Deposit Growth – 0.77% year over year
. Core Deposit Growth – 3% year over year excluding brokered deposits Loan Growth – $36.3 million in year over year loan growth in our business portfolio offset by payoffs in Shared National Credit (SNC) portfolio ($43.2 million) and real estate construction portfolio ($173.9 million)
21
Net Interest Margin
Financial Highlights
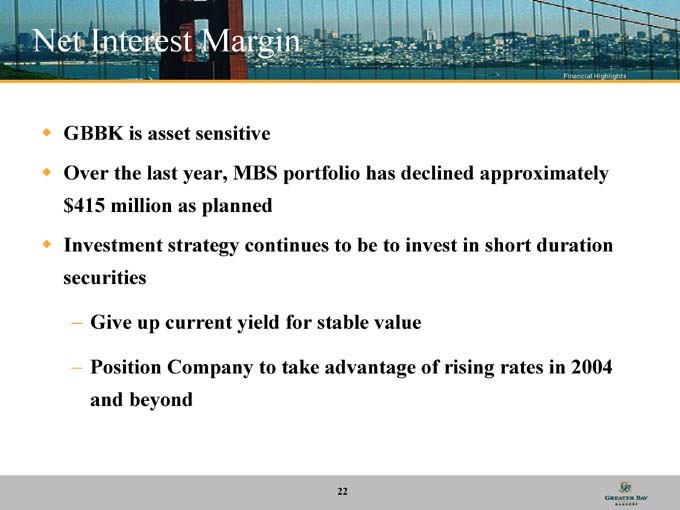
. GBBK is asset sensitive
. Over the last year, MBS portfolio has declined approximately $415 million as planned
. Investment strategy continues to be to invest in short duration securities
- Give up current yield for stable value
- Position Company to take advantage of rising rates in 2004 and beyond
22
Net Interest Margin
Financial Highlights
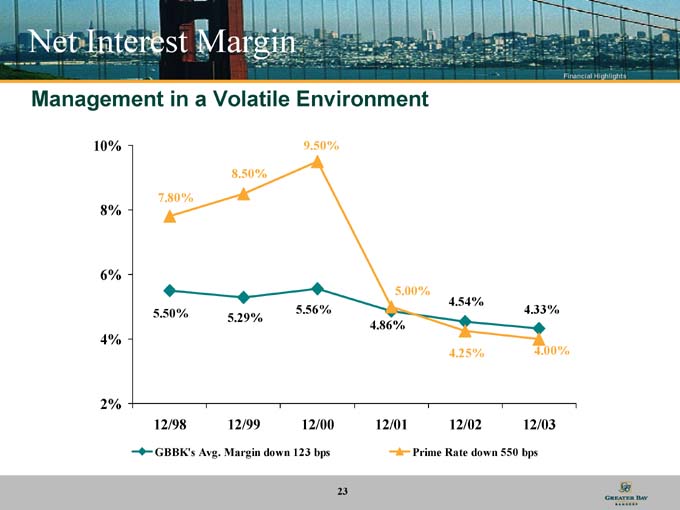
Management in a Volatile Environment
7.80%
5.50%
12/98
8.50%
5.29%
12/99
9.50%
5.56%
12/00
5.00%
4.86%
12/01
4.54%
4.25%
12/02
4.33%
4.00%
12/03
GBBK’s Avg. Margin down 123 bps
Prime Rate down 550 bps
23
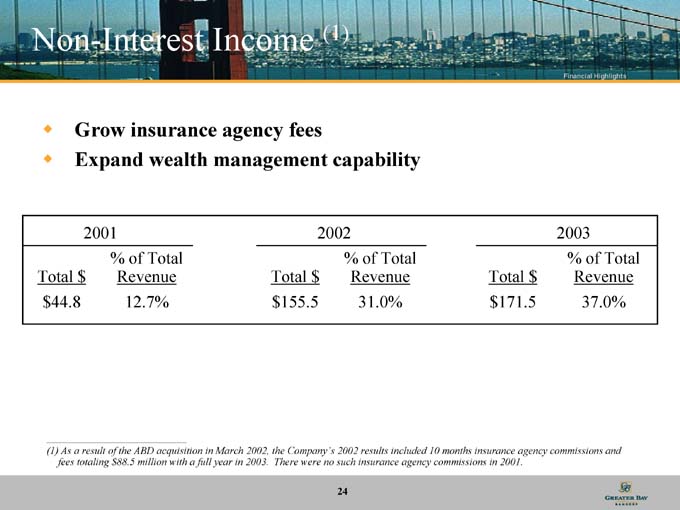
Non-Interest Income (1)
Financial Highlights
. Grow insurance agency fees
. Expand wealth management capability
2001
% of Total
Total $ Revenue
$ 44.8 12.7%
2002
% of Total
Total $ Revenue
$ 155.5 31.0%
2003
% of Total
Total $ Revenue
$ 171.5 37.0%
(1) As a result of the ABD acquisition in March 2002, the Company’s 2002 results included 10 months insurance agency commissions and fees totaling $88.5 million with a full year in 2003. There were no such insurance agency commissions in 2001.
24
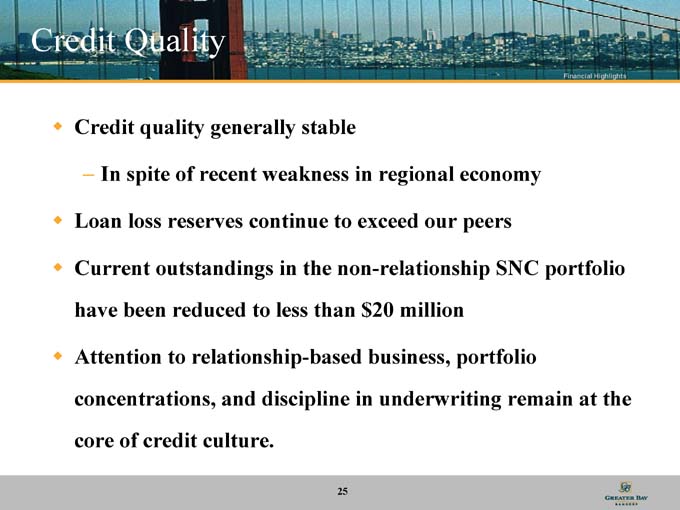
Credit Quality
Financial Highlights
. Credit quality generally stable
- |
| In spite of recent weakness in regional economy |
. Loan loss reserves continue to exceed our peers
. Current outstandings in the non-relationship SNC portfolio have been reduced to less than $20 million
. Attention to relationship-based business, portfolio concentrations, and discipline in underwriting remain at the core of credit culture.
25
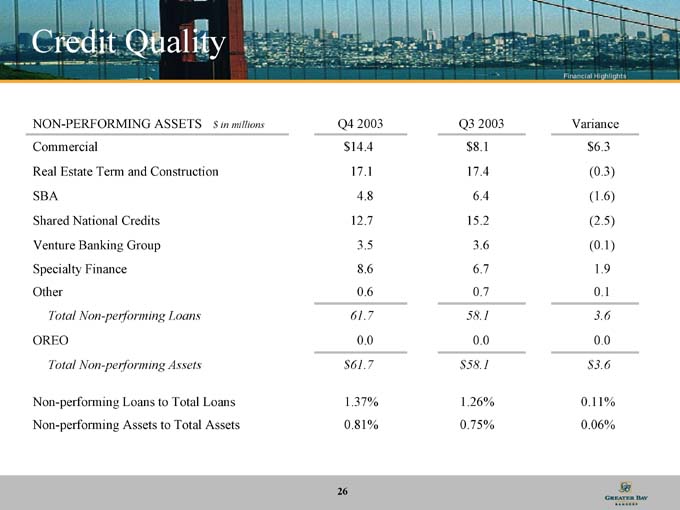
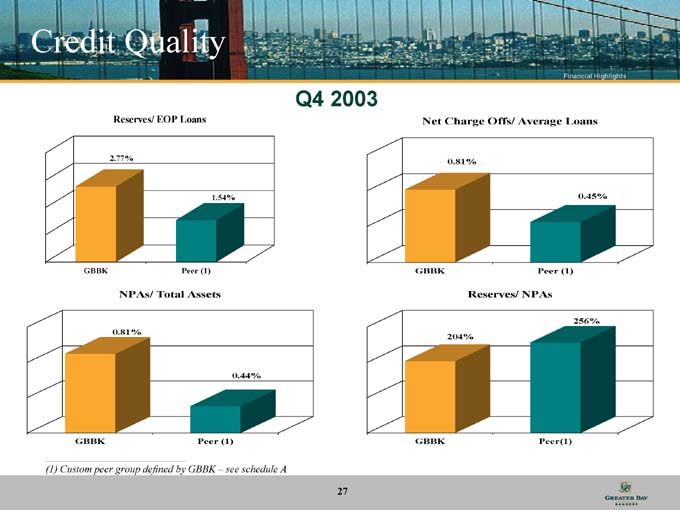
Credit Quality
Financial Highlights
NON-PERFORMING ASSETS $ in millions Q4 2003 Q3 2003 Variance
Commercial $ 14.4 $ 8.1 $ 6.3
Real Estate Term and Construction 17.1 17.4 (0.3)
SBA 4.8 6.4 (1.6)
Shared National Credits 12.7 15.2 (2.5)
Venture Banking Group 3.5 3.6 (0.1)
Specialty Finance 8.6 6.7 1.9
Other 0.6 0.7 0.1
Total Non-performing Loans 61.7 58.1 3.6
OREO 0.0 0.0 0.0
Total Non-performing Assets $ 61.7 $ 58.1 $ 3.6
Non-performing Loans to Total Loans 1.37% 1.26% 0.11%
Non-performing Assets to Total Assets 0.81% 0.75% 0.06%
26
Credit Quality
Financial Highlights
Q4 2003
Reserves/ EOP Loans
2.77%
GBBK
1.54%
Peer (1)
NPAs/ Total Assets
0.81%
GBBK
0.44%
Peer (1)
Net Charge Offs/ Average Loans
0.81%
GBBK
0.45%
Peer (1)
Reserves/ NPAs
204%
GBBK
256%
Peer(1)
(1) Custom peer group defined by GBBK – see schedule A
27
Credit Quality
Financial Highlights
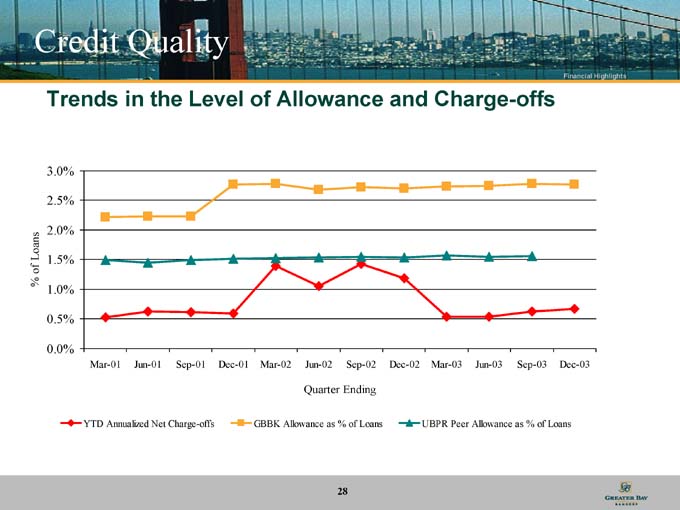
Trends in the Level of Allowance and Charge-offs
Quarter Ending
YTD Annualized Net Charge-offs
GBBK Allowance as % of Loans
UBPR Peer Allowance as % of Loans
28
Credit Quality
Financial Highlights
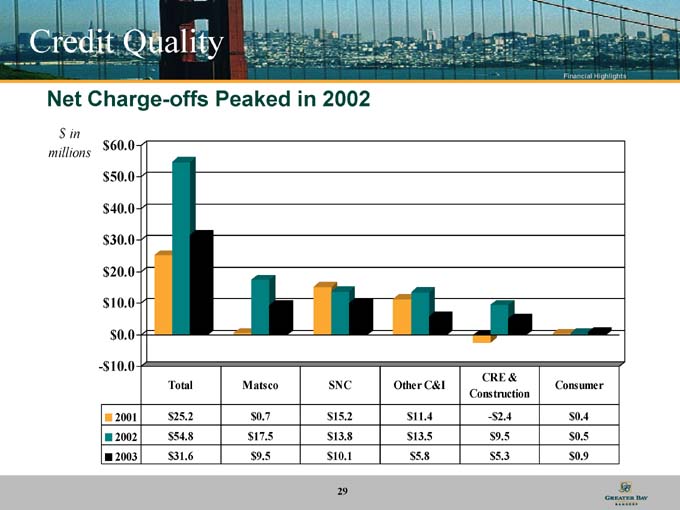
Net Charge-offs Peaked in 2002 $ in millions
CRE &
Total Matsco SNC Other C&I Construction Consumer
2001 $ 25.2 $ 0.7 $ 15.2 $ 11.4 -$ 2.4 $ 0.4
2002 $ 54.8 $ 17.5 $ 13.8 $ 13.5 $ 9.5 $ 0.5
2003 $ 31.6 $ 9.5 $ 10.1 $ 5.8 $ 5.3 $ 0.9
29

Commercial Real Estate Loan Portfolio
Financial Highlights
Term Loans (12/31/03)
Warehouse 4%
Self Storage 3%
Office 38%
Retail 15%
Industrial 11%
Hotel/Motel 9%
Other RE
8%
R&D 5%
1-4 SFR 4%
Multifamily 3%
Total: $1,733.0 mm
Construction Loans (12/31/03)
Warehouse 1%
1-4 SFR 52%
Office 20%
Multifamily 12%
Self Storage 4%
Other RE 3%
Hotel/Motel 1%
Retail 5%
Industrial 2%
Total: $431.3 mm
30
Real Estate Term Loan Portfolio
Financial Highlights
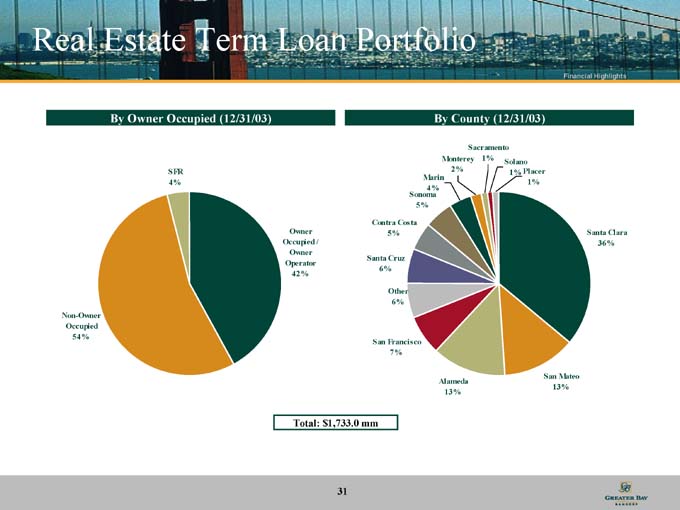
By Owner Occupied (12/31/03)
SFR 4%
Owner Occupied / Owner Operator 42%
Non-Owner Occupied 54%
By County (12/31/03)
Sacramento 1%
Solano 1%
Placer 1%
Santa Clara 36%
San Mateo 13%
Alameda 13%
San Francisco 7%
Other 6%
Santa Cruz 6%
Contra Costa 5%
Marin 4%
Sonoma 5%
Monterey 2%
Total: $1,733.0 mm
31
Real Estate Construction Loan Portfolio
Financial Highlights
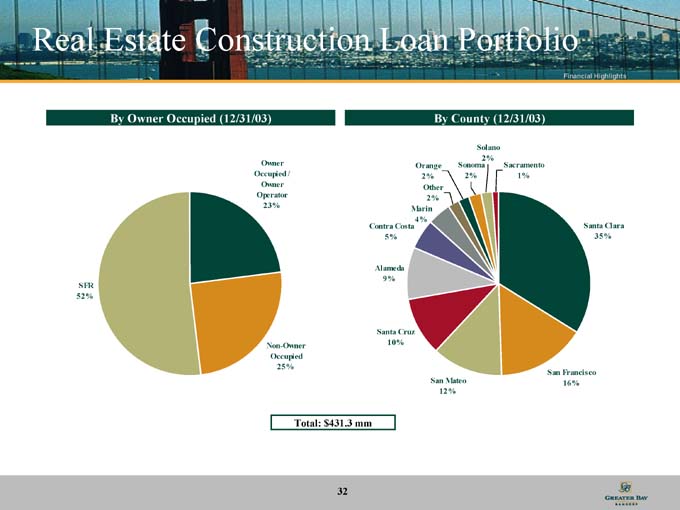
By Owner Occupied (12/31/03)
Owner Occupied / Owner Operator 23%
Non-Owner Occupied 25%
SFR 52%
By County (12/31/03)
Solano 2%
Sacramento 1%
Santa Clara 35%
San Francisco 16%
San Mateo 12%
Santa Cruz 10%
Alameda 9%
Contra Costa 5%
Marin 4%
Other 2%
Orange 2%
Sonoma 2%
Total: $431.3 mm
32
Capital Strength
Financial Highlights
Peer Top 75
GBBK (1) Group (2) Banks (3) Minimum to be
12/31/03 12/31/03 12/31/03 Well-Capitalized
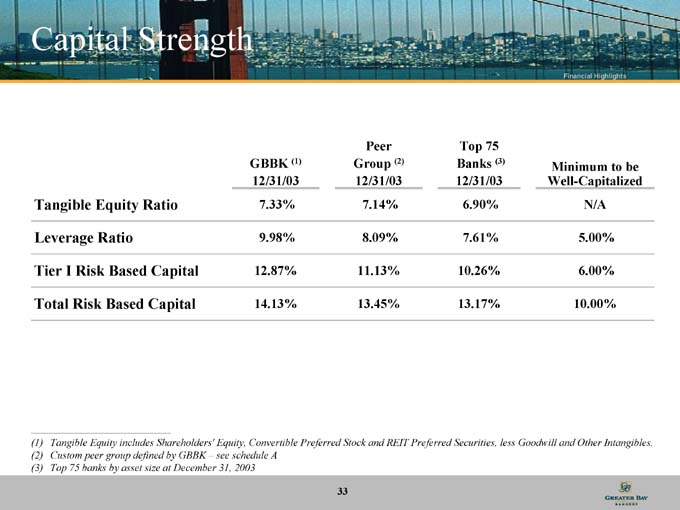
Tangible Equity Ratio 7.33% 7.14% 6.90% N/A
Leverage Ratio 9.98% 8.09% 7.61% 5.00%
Tier I Risk Based Capital 12.87% 11.13% 10.26% 6.00%
Total Risk Based Capital 14.13% 13.45% 13.17% 10.00%
(1) Tangible Equity includes Shareholders’ Equity, Convertible Preferred Stock and REIT Preferred Securities, less Goodwill and Other Intangibles.
(2) Custom peer group defined by GBBK – see schedule A
(3) Top 75 banks by asset size at December 31, 2003
33
Capital Strength
Financial Highlights
. Emphasis on increasing capital ratios during the past year has resulted in tangible equity to asset ratio of 7.33%, up from 6.40% at December 31, 2002
. All other capital ratios are substantially in excess of regulatory well capitalized guidelines and peers
34
Economic Capital as a Foundation for Enterprise-wide Risk Management Financial Highlights
. We are utilizing an economic capital allocation model developed by ERisk that incorporates economic factors, historical factors and our actual operating results to measure our capital levels in relation to our risk profile
. Results show returns on risk adjusted capital by business line
. Results provide framework, based on risk appetite correlated to ratings targets, to optimize capital allocation for enhancing shareholder returns
35
Required Economic Capital Formulated to GBBK Risk Appetite(1)
Financial Highlights
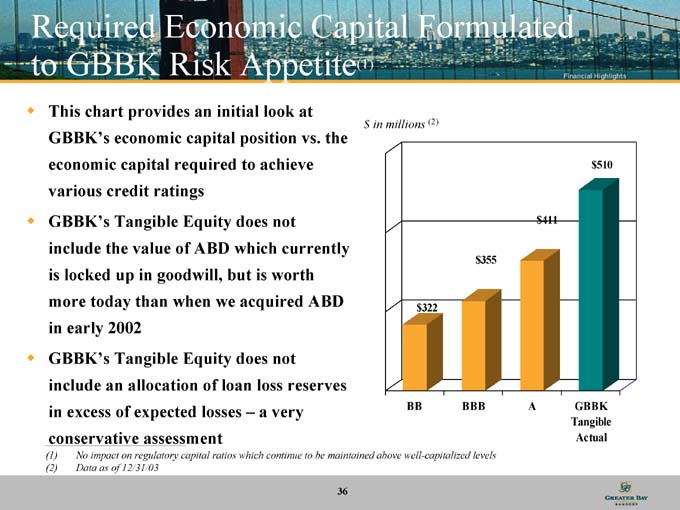
. This chart provides an initial look at GBBK’s economic capital position vs. the economic capital required to achieve various credit ratings
. GBBK’s Tangible Equity does not include the value of ABD which currently is locked up in goodwill, but is worth more today than when we acquired ABD in early 2002
. GBBK’s Tangible Equity does not include an allocation of loan loss reserves in excess of expected losses – a very
conservative assessment
$ in millions (2)
$322
BB
$355
BBB
$411
A
$510
GBBK Tangible Actual
(1) No impact on regulatory capital ratios which continue to be maintained above well-capitalized levels
(2) Data as of 12/31/03
36
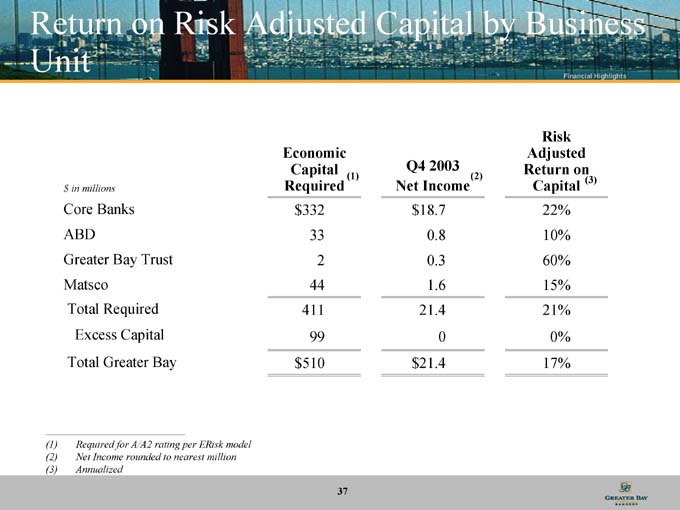
Return on Risk Adjusted Capital by Business Unit
Financial Highlights
Risk
Economic Adjusted
Capital Q4 2003 Return on
$ in millions Required(1) Net Income(2) Capital(3)
Core Banks $ 332 $ 18.7 22%
ABD 33 0.8 10%
Greater Bay Trust 2 0.3 60%
Matsco 44 1.6 15%
Total Required 411 21.4 21%
Excess Capital 99 0 0%
Total Greater Bay $ 510 $ 21.4 17%
(1) Required for A/A2 rating per ERisk model
(2) Net Income rounded to nearest million
(3) Annualized
37
Looking Forward: Our Strategy for 2004 and Beyond
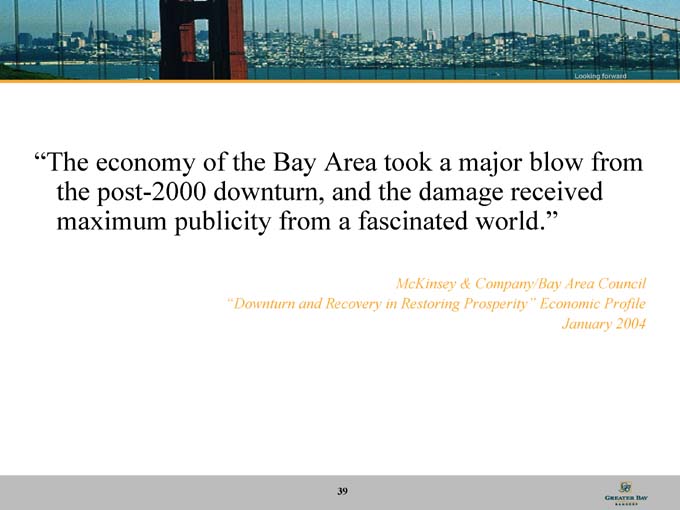
Looking forward
“The economy of the Bay Area took a major blow from the post-2000 downturn, and the damage received maximum publicity from a fascinated world.”
McKinsey & Company/Bay Area Council
“Downturn and Recovery in Restoring Prosperity” Economic Profile
January 2004
39
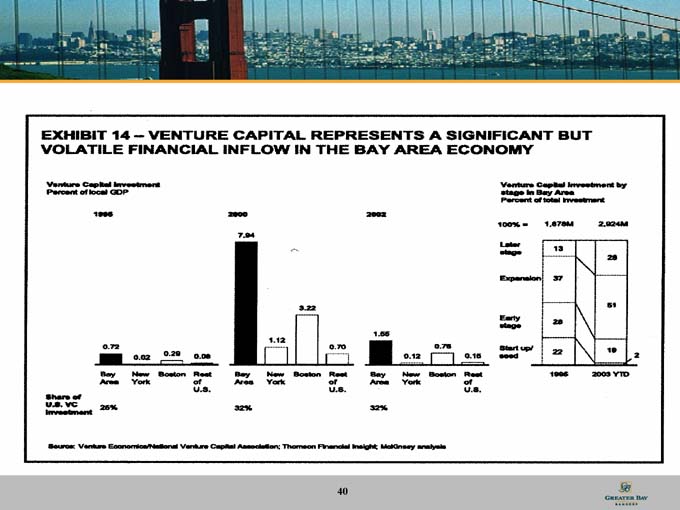
EXHBIT 14 – VENTURE CAPITAL REPRESENTS A SIGNIFICANT BUT VOLATILE FINANCIAL INFLOW IN THE BAY AREA COMPANY
40
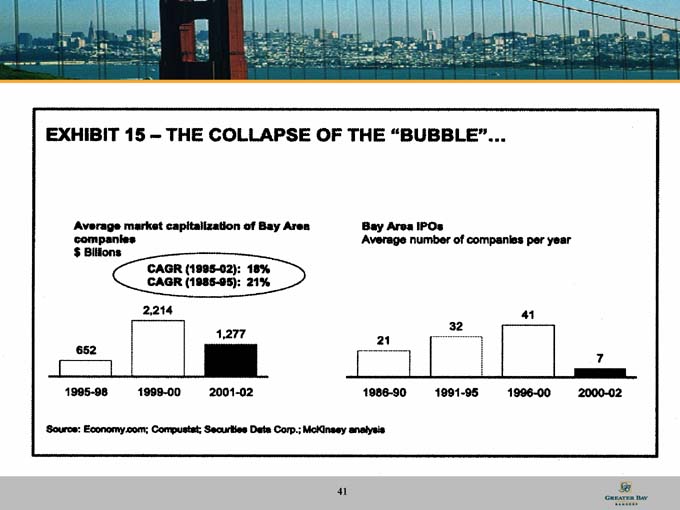
EXHIBIT 15 – THE COLLAPSE OF THE “BUBBLE”…
41
Looking forward
“The Bay Area has proven fairly resilient in the economic downturn. Several fundamental strengths remain in tact such as its highly skilled work force, global presence, and multi-faceted economy…(and) the Bay Area retains its core dynamism, and still has marked advantages over most other comparable regions in the country.”
McKinsey & Company/Bay Area Council
“Downturn and Recovery in Restoring Prosperity” Economic Profile
January 2004
42
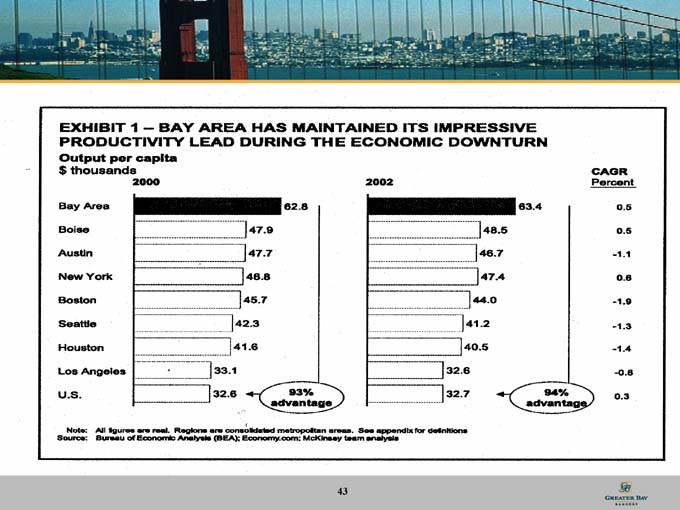
EXHIBIT 1 - BAY AREA HAS MAINTAINED ITS IMPRESSIVE PRODUCTIVITY LEAD DURING THE ECONOMIC DOWNTURN
43
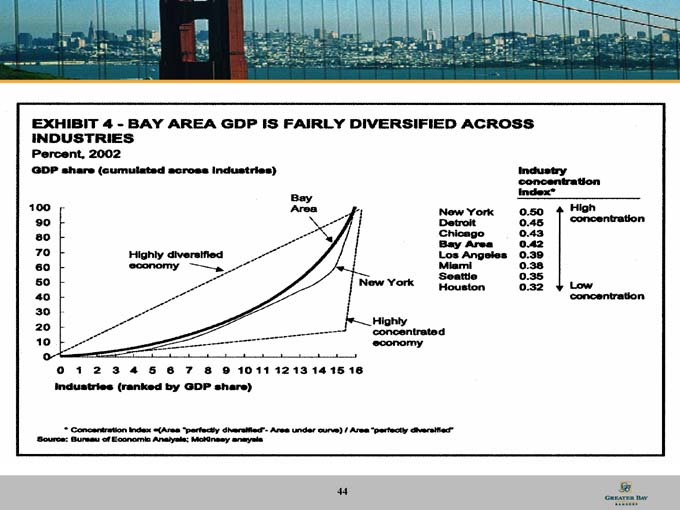
EXHIBIT 4 – BAY AREA GDP IS FAIRLY DIVERSIFIED ACROSS INDUSTRIES
44
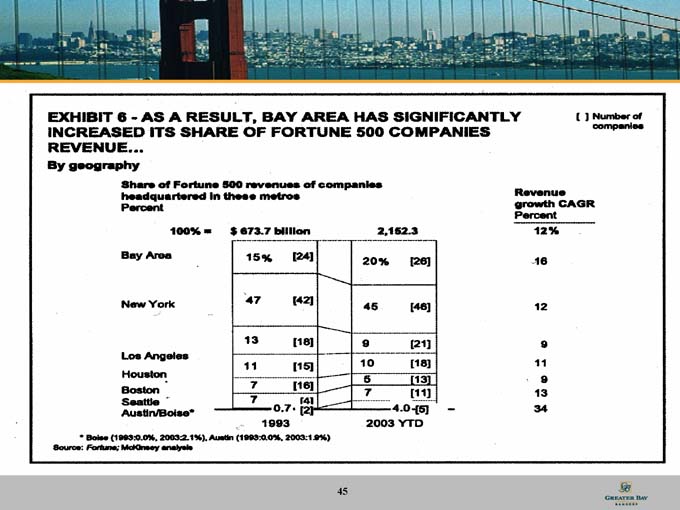
EXHIBIT 6 – AS A RESULT, BAY AREA HAS SIGNIFICANTLY INCREASED ITS SHARE OF FORTUNE 500 COMPANIES REVENUE…
45
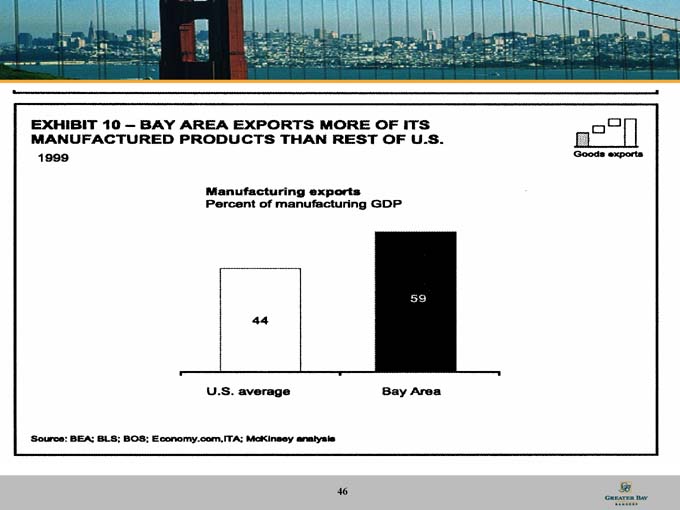
EXHIBIT 10 – BAY AREA EXPORTS MORE OF ITS MANUFACTURED PRODUCTS THAN REST OF U.S.
46
Strategic Goals
Looking forward
. Reaching greater critical mass in the Company’s market areas
. Generating increased fee income through cross-selling broader services
. Continue to diversify revenue stream
. Continue to mitigate and proactively manage risk
. Opportunistic market expansion
47
Mitigate and Proactively Manage Risk
Looking forward
. Enterprise-wide Risk Management
. Maintain Credit Quality
. Loan Concentration Analysis
. Focus on Relationships
. Economic Capital Analysis
. Interest Rate Risk Management
48
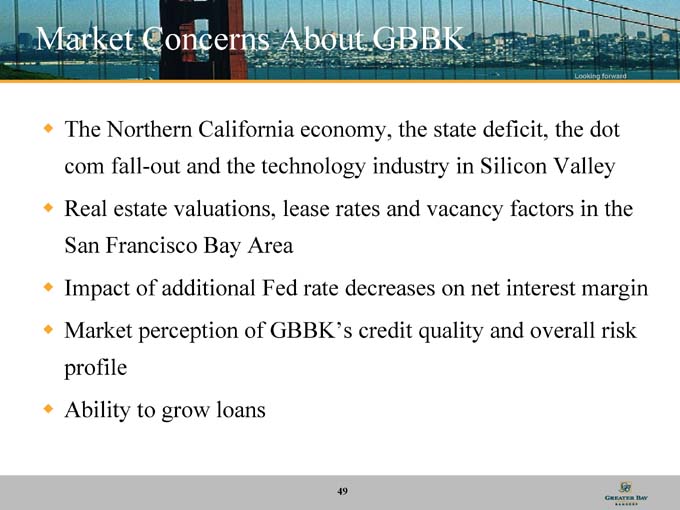
Market Concerns About GBBK
Looking forward
. The Northern California economy, the state deficit, the dot com fall-out and the technology industry in Silicon Valley
. Real estate valuations, lease rates and vacancy factors in the San Francisco Bay Area
. Impact of additional Fed rate decreases on net interest margin
. Market perception of GBBK’s credit quality and overall risk profile
. Ability to grow loans
49
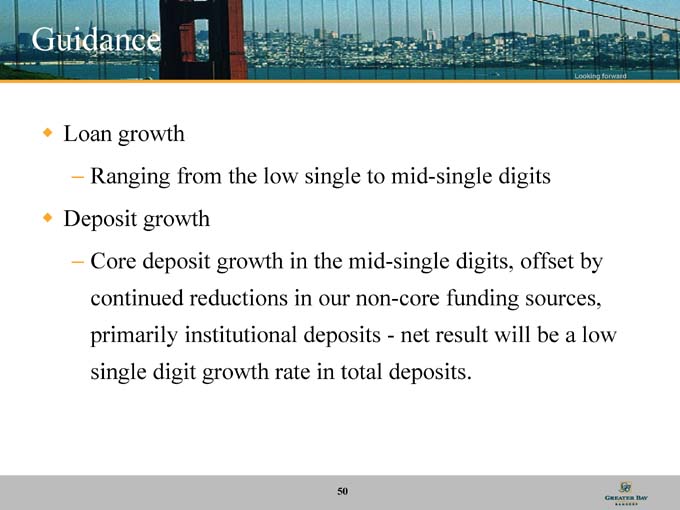
Guidance
Looking forward
. Loan growth
- Ranging from the low single to mid-single digits
. Deposit growth
- Core deposit growth in the mid-single digits, offset by continued reductions in our non-core funding sources, primarily institutional deposits—net result will be a low single digit growth rate in total deposits.
50
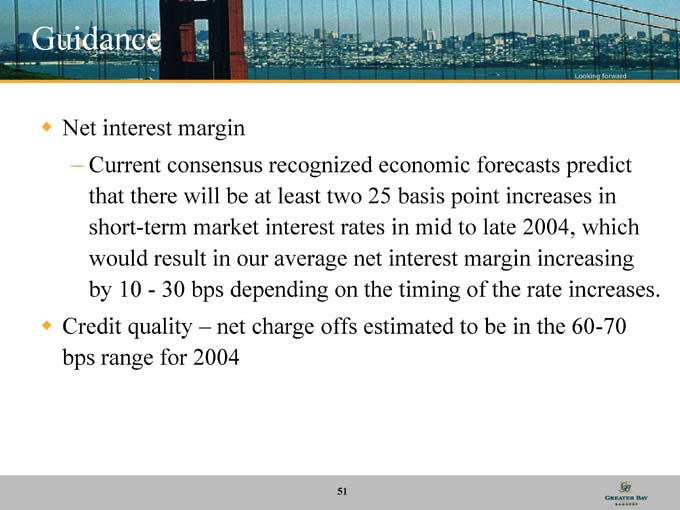
Guidance
Looking forward
. Net interest margin
- Current consensus recognized economic forecasts predict that there will be at least two 25 basis point increases in short-term market interest rates in mid to late 2004, which would result in our average net interest margin increasing by 10—30 bps depending on the timing of the rate increases.
. Credit quality – net charge offs estimated to be in the 60-70 bps range for 2004
51

Investment Rationale
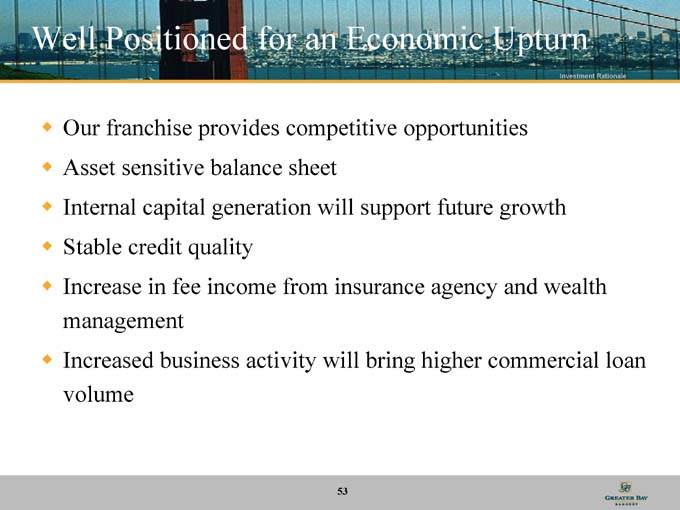
Well Positioned for an Economic Upturn
Investment Rationale
. Our franchise provides competitive opportunities
. Asset sensitive balance sheet
. Internal capital generation will support future growth
. Stable credit quality
. Increase in fee income from insurance agency and wealth management
. Increased business activity will bring higher commercial loan volume
53
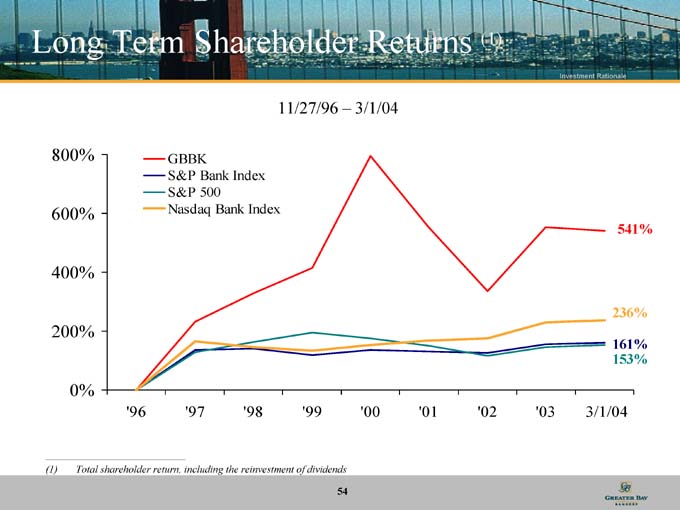
Long Term Shareholder Returns (1)
Investment Rationale
11/27/96 – 3/1/04
GBBK
S&P Bank Index
S&P 500
Nasdaq Bank Index
(1) Total shareholder return, including the reinvestment of dividends
54

Appendix
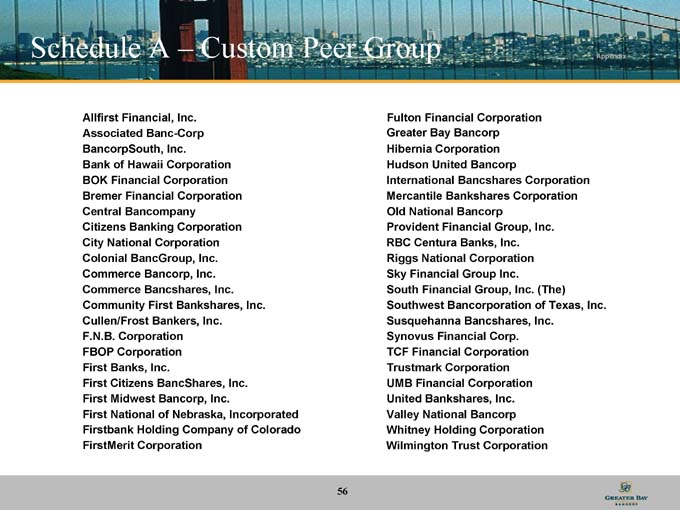
Schedule A – Custom Peer Group Appendix
Allfirst Financial, Inc.
Associated Banc-Corp
BancorpSouth, Inc. Bank of Hawaii Corporation
BOK Financial Corporation
Bremer Financial Corporation
Central Bancompany
Citizens Banking Corporation
City National Corporation
Colonial BancGroup, Inc.
Commerce Bancorp, Inc.
Commerce Bancshares, Inc.
Community First Bankshares, Inc.
Cullen/Frost Bankers, Inc.
F.N.B. Corporation
FBOP Corporation
First Banks, Inc.
First Citizens BancShares, Inc.
First Midwest Bancorp, Inc.
First National of Nebraska, Incorporated
Firstbank Holding Company of Colorado
FirstMerit Corporation
Fulton Financial Corporation
Greater Bay Bancorp
Hibernia Corporation
Hudson United Bancorp
International Bancshares Corporation
Mercantile Bankshares Corporation
Old National Bancorp
Provident Financial Group, Inc.
RBC Centura Banks, Inc.
Riggs National Corporation
Sky Financial Group Inc.
South Financial Group, Inc. (The)
Southwest Bancorporation of Texas, Inc.
Susquehanna Bancshares, Inc.
Synovus Financial Corp.
TCF Financial Corporation
Trustmark Corporation
UMB Financial Corporation
United Bankshares, Inc.
Valley National Bancorp
Whitney Holding Corporation
Wilmington Trust Corporation
56