Exhibit 99
Slide Presentation of Greater Bay Bancorp as of September 30, 2004
Keefe, Bruyette & Woods
Investor Meeting
October 27, 2004
Greater Bay Bancorp
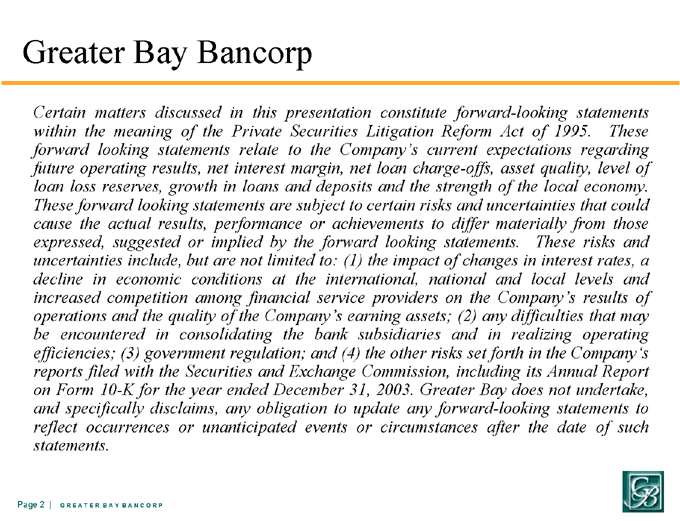
Certain matters discussed in this presentation constitute forward-looking statements within the meaning of the Private Securities Litigation Reform Act of 1995. These forward looking statements relate to the Company’s current expectations regarding future operating results, net interest margin, net loan charge-offs, asset quality, level of loan loss reserves, growth in loans and deposits and the strength of the local economy. These forward looking statements are subject to certain risks and uncertainties that could cause the actual results, performance or achievements to differ materially from those expressed, suggested or implied by the forward looking statements. These risks and uncertainties include, but are not limited to: (1) the impact of changes in interest rates, a decline in economic conditions at the international, national and local levels and increased competition among financial service providers on the Company’s results of operations and the quality of the Company’s earning assets; (2) any difficulties that may be encountered in consolidating the bank subsidiaries and in realizing operating efficiencies; (3) government regulation; and (4) the other risks set forth in the Company’s reports filed with the Securities and Exchange Commission, including its Annual Report on Form 10-K for the year ended December 31, 2003. Greater Bay does not undertake, and specifically disclaims, any obligation to update any forward-looking statements to reflect occurrences or unanticipated events or circumstances after the date of such statements.
Page 2 | G R E A T E R B A Y B A N C O R P
Table of Contents
I. Overview of Greater Bay Bancorp
II. Recent Developments
III. Financial Highlights
IV. Looking Forward: Our Strategy for 2004 and Beyond
V. Investment Rationale
VI. Appendix
Page 3 | G R E A T E R B A Y B A N C O R P

Overview of Greater Bay Bancorp
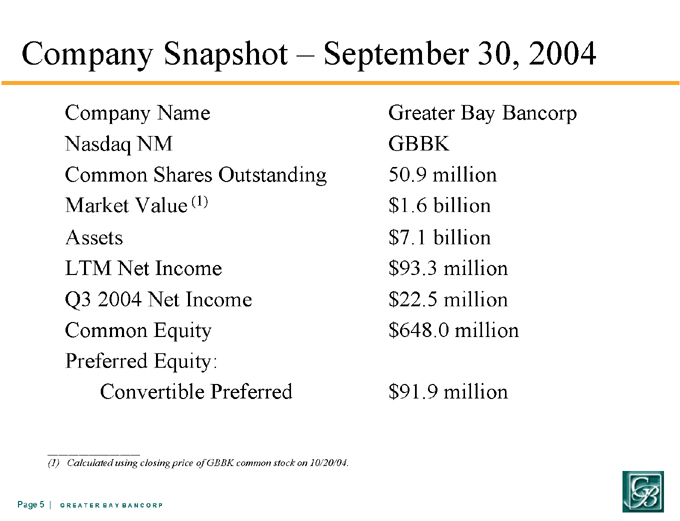
Company Snapshot – September 30, 2004
Company Name Greater Bay Bancorp
Nasdaq NM GBBK
Common Shares Outstanding 50.9 million
Market Value (1) $1.6 billion
Assets $7.1 billion
LTM Net Income $93.3 million
Q3 2004 Net Income $22.5 million
Common Equity $648.0 million
Preferred Equity:
Convertible Preferred $91.9 million
(1) Calculated using closing price of GBBK common stock on 10/20/04.
Page 5 | G R E A T E R B A Y B A N C O R P
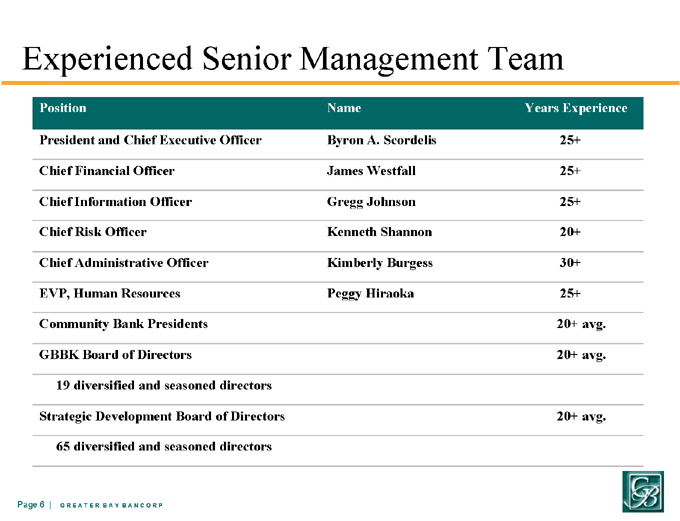
Experienced Senior Management Team
Position Name Years Experience
President and Chief Executive Officer Byron A. Scordelis 25+
Chief Financial Officer James Westfall 25+
Chief Information Officer Gregg Johnson 25+
Chief Risk Officer Kenneth Shannon 20+
Chief Administrative Officer Kimberly Burgess 30+
EVP, Human Resources Peggy Hiraoka 25+
Community Bank Presidents 20+ avg.
GBBK Board of Directors 20+ avg.
19 diversified and seasoned directors
Strategic Development Board of Directors 20+ avg.
65 diversified and seasoned directors
Page 6 | G R E A T E R B A Y B A N C O R P
Franchise Overview
Regional Community Banking
Formed in late 1996 with the merger of Cupertino National Bancorp and Mid-Peninsula Bancorp.
Currently the largest independent community bank holding company headquartered in Northern California with assets of $7.1 billion, loans of $4.5 billion and deposits of $5.2 billion.
Diversified financial services company offering a full range of products and services.
Page 7 | G R E A T E R B A Y B A N C O R P
Franchise Overview
Unique characteristics of GBBK as a Regional Community Bank:
Maintains strong community involvement in order to fully understand clients’ business and personal needs.
Local people in local markets making local decisions based upon local knowledge.
Opportunistic and strategic acquirer of financial services companies.
In February 2004, subsidiary banks were consolidated into a single national charter, but continue to maintain local names and community identities.
Eleven community bank “dba’s” with 40 offices in 8 counties located throughout the San Francisco Bay Area.
Page 8 | G R E A T E R B A Y B A N C O R P
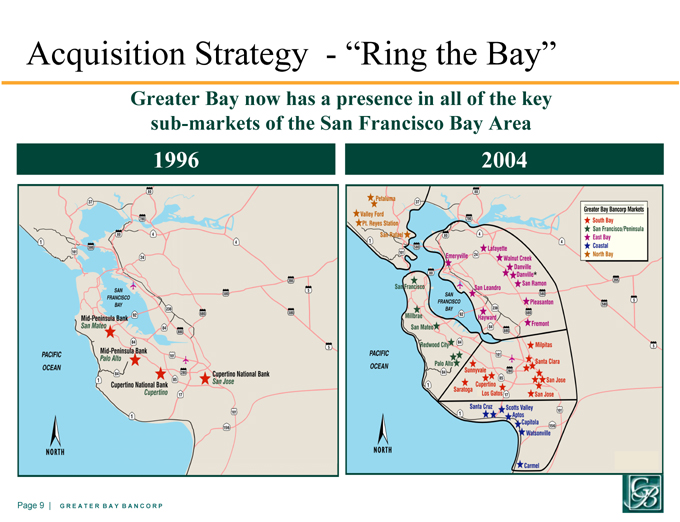
Acquisition Strategy - “Ring the Bay”
Greater Bay now has a presence in all of the key sub-markets of the San Francisco Bay Area
1996
2004
Page 9 | G R E A T E R B A Y B A N C O R P
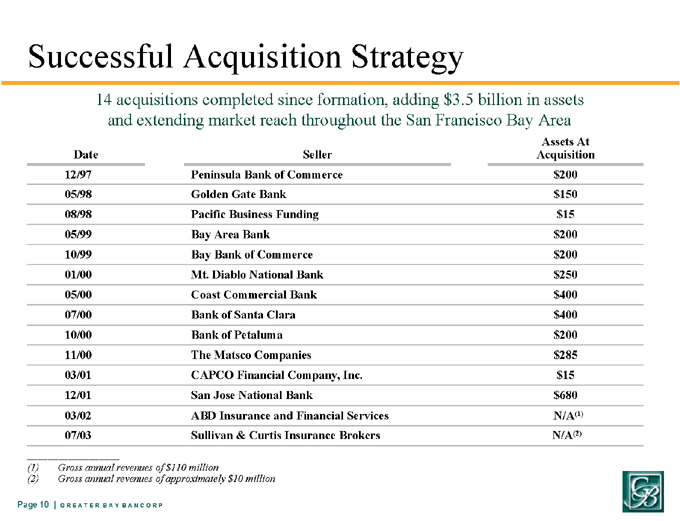
Successful Acquisition Strategy
14 acquisitions completed since formation, adding $3.5 billion in assets and extending market reach throughout the San Francisco Bay Area
Date Seller Assets At Acquisition
12/97 Peninsula Bank of Commerce $ 200
05/98 Golden Gate Bank $ 150
08/98 Pacific Business Funding $ 15
05/99 Bay Area Bank $ 200
10/99 Bay Bank of Commerce $ 200
01/00 Mt. Diablo National Bank $ 250
05/00 Coast Commercial Bank $ 400
07/00 Bank of Santa Clara $ 400
10/00 Bank of Petaluma $ 200
11/00 The Matsco Companies $ 285
03/01 CAPCO Financial Company, Inc. $ 15
12/01 San Jose National Bank $ 680
03/02 ABD Insurance and Financial Services N/A(1)
07/03 Sullivan & Curtis Insurance Brokers N/A(2)
(1) Gross annual revenues of $110 million
(2) Gross annual revenues of approximately $10 million
Page 10 | G R E A T E R B A Y B A N C O R P
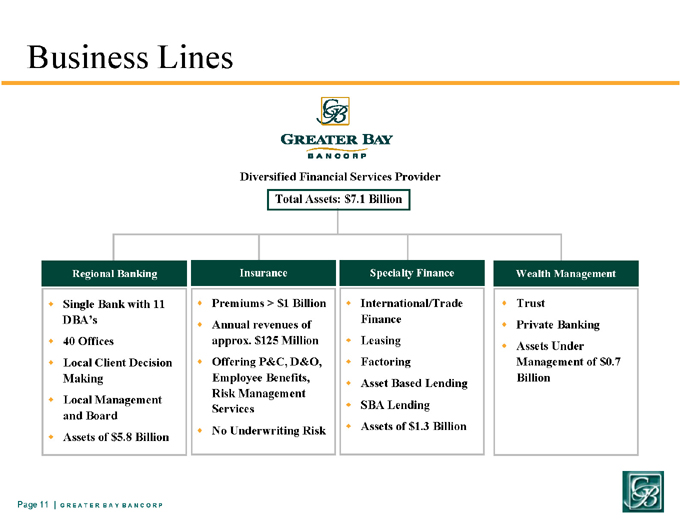
Business Lines
Diversified Financial Services Provider
Total Assets: $7.1 Billion
Regional Banking
Insurance
Specialty Finance
Wealth Management
Single Bank with 11 DBA’s
40 Offices
Local Client Decision Making
Local Management and Board
Assets of $5.8 Billion
Trust
Private Banking
Assets Under Management of $0.7 Billion
Premiums > $1 Billion
Annual revenues of approx. $125 Million
Offering P&C, D&O, Employee Benefits, Risk Management Services
No Underwriting Risk
International/Trade Finance
Leasing
Factoring
Asset Based Lending
SBA Lending
Assets of $1.3 Billion
Page 11 | G R E A T E R B A Y B A N C O R P

Recent Developments
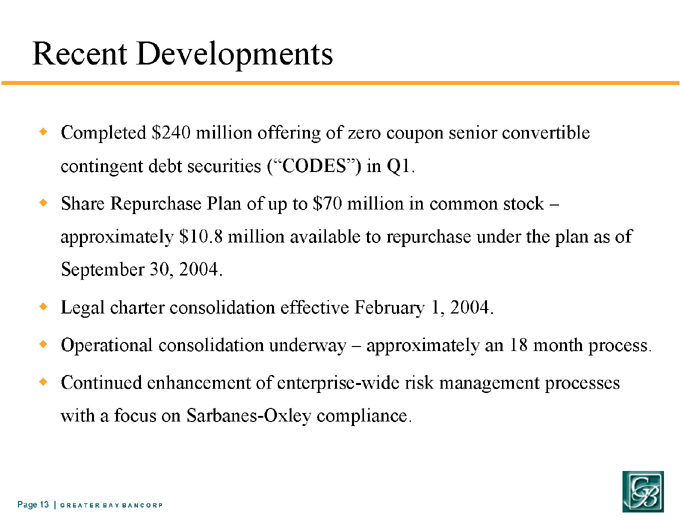
Recent Developments
Completed $240 million offering of zero coupon senior convertible contingent debt securities (“CODES”) in Q1.
Share Repurchase Plan of up to $70 million in common stock – approximately $10.8 million available to repurchase under the plan as of September 30, 2004.
Legal charter consolidation effective February 1, 2004.
Operational consolidation underway – approximately an 18 month process.
Continued enhancement of enterprise-wide risk management processes with a focus on Sarbanes-Oxley compliance.
Page 13 | G R E A T E R B A Y B A N C O R P
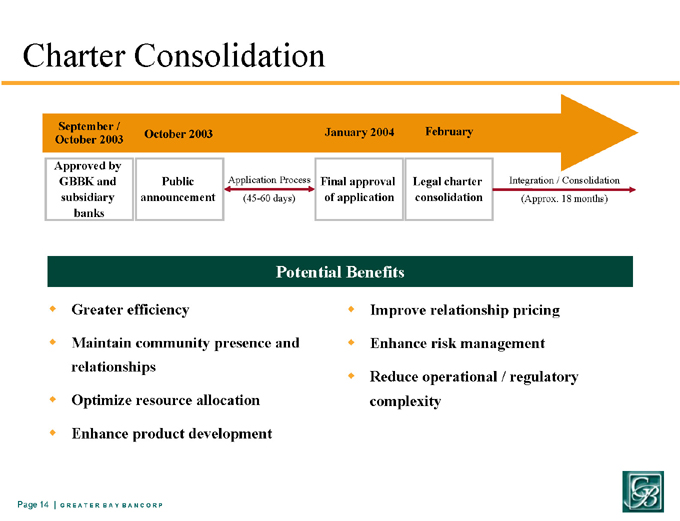
Charter Consolidation
Application Process
(45-60 days)
Potential Benefits
Greater efficiency
Maintain community presence and relationships
Optimize resource allocation
Enhance product development
Improve relationship pricing
Enhance risk management
Reduce operational / regulatory complexity
September / October 2003
February
January 2004
October 2003
Approved by GBBK and subsidiary banks
Public announcement
Final approval of application
Legal charter consolidation
Integration / Consolidation
(Approx. 18 months)
Page 14 | G R E A T E R B A Y B A N C O R P
ABD Insurance and Financial Services
Acquired ABD Insurance and Financial Services (currently the 17th largest insurance brokerage agency in the country(1)) in March 2002.
Diversified and highly respected provider of property and casualty, employee benefits, and risk management services.
Locations in key California markets and recent expansion into the Pacific Northwest.
Very successful partnership that has improved non-interest income from 12% to nearly 40%.
Contributed $117.5 million in insurance fee income for full year 2003 and $100.8 million for the first nine months of 2004.
(1) Source: Business Insurance Magazine – July 2004
Page 15 | G R E A T E R B A Y B A N C O R P
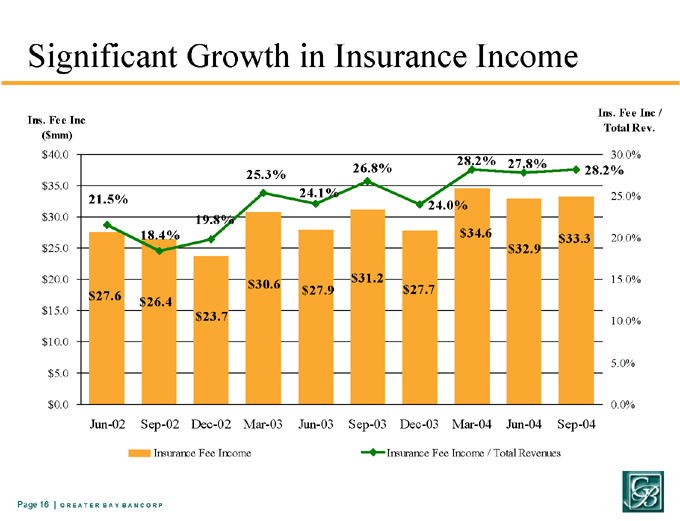
Significant Growth in Insurance Income
$33.3 $32.9 $34.6 $27.7 $31.2 $27.9 $30.6 $23.7 $26.4 $27.6
24.0% 28.2% 27.8% 28.2% 21.5% 18.4% 19.8% 25.3% 24.1% 26.8%
$0.0 $5.0 $10.0 $15.0 $20.0 $25.0 $30.0 $35.0 $40.0
Jun-02
Sep-02
Dec-02
Mar-03
Jun-03
Sep-03
Dec-03
Mar-04
Jun-04
Sep-04
Ins. Fee Inc ($mm)
0.0%
5.0%
10.0%
15.0%
20.0%
25.0%
30.0%
Ins. Fee Inc / Total Rev.
Insurance Fee Income
Insurance Fee Income / Total Revenues
Page 16 | G R E A T E R B A Y B A N C O R P

Financial Highlights
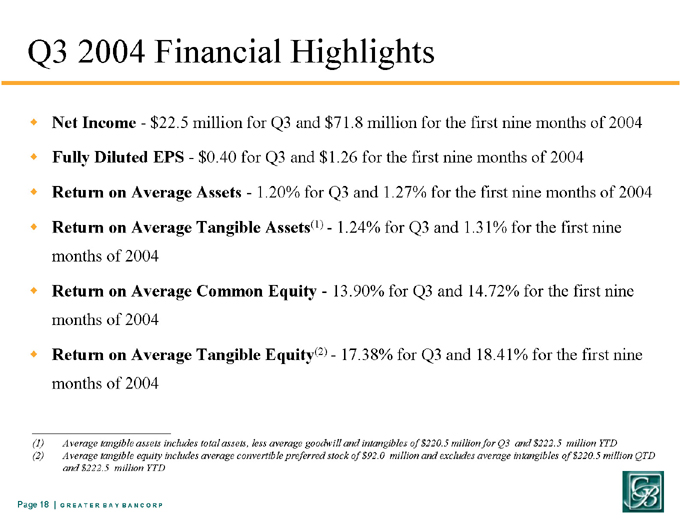
Q3 2004 Financial Highlights
Net Income—$22.5 million for Q3 and $71.8 million for the first nine months of 2004
Fully Diluted EPS—$0.40 for Q3 and $1.26 for the first nine months of 2004
Return on Average Assets—1.20% for Q3 and 1.27% for the first nine months of 2004
Return on Average Tangible Assets(1)—1.24% for Q3 and 1.31% for the first nine months of 2004
Return on Average Common Equity—13.90% for Q3 and 14.72% for the first nine months of 2004
Return on Average Tangible Equity(2)—17.38% for Q3 and 18.41% for the first nine months of 2004
(1) Average tangible assets includes total assets, less average goodwill and intangibles of $220.5 million for Q3 and $222.5 million YTD
(2) Average tangible equity includes average convertible preferred stock of $92.0 million and excludes average intangibles of $220.5 million QTD and $222.5 million YTD
Page 18 | G R E A T E R B A Y B A N C O R P
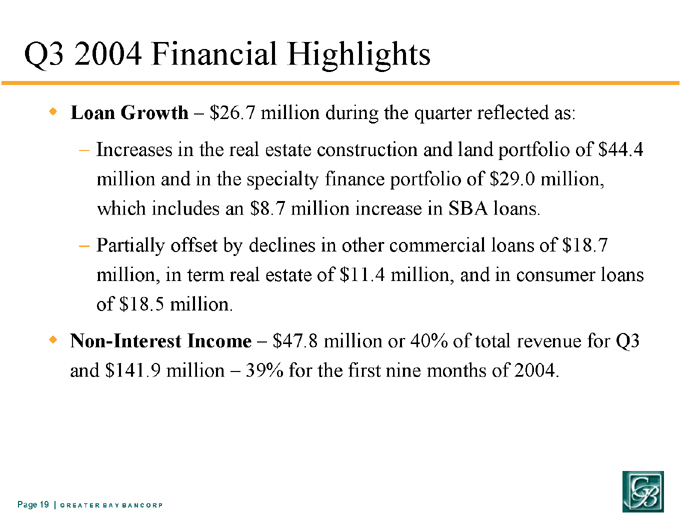
Q3 2004 Financial Highlights
Loan Growth – $26.7 million during the quarter reflected as:
Increases in the real estate construction and land portfolio of $44.4 million and in the specialty finance portfolio of $29.0 million, which includes an $8.7 million increase in SBA loans.
Partially offset by declines in other commercial loans of $18.7 million, in term real estate of $11.4 million, and in consumer loans of $18.5 million.
Non-Interest Income – $47.8 million or 40% of total revenue for Q3 and $141.9 million – 39% for the first nine months of 2004.
Page 19 | G R E A T E R B A Y B A N C O R P
Interest Rate Risk and Net Interest Margin
Balance sheet position is modestly asset sensitive.
Q3 net interest margin declined 2 basis points
Increase in earning asset yields of 18 basis points less a corresponding 12 basis point increase in related funding costs.
Change in accounting – time shift in loan fee income recognition – 8 basis point reduction.
Page 20 | G R E A T E R B A Y B A N C O R P
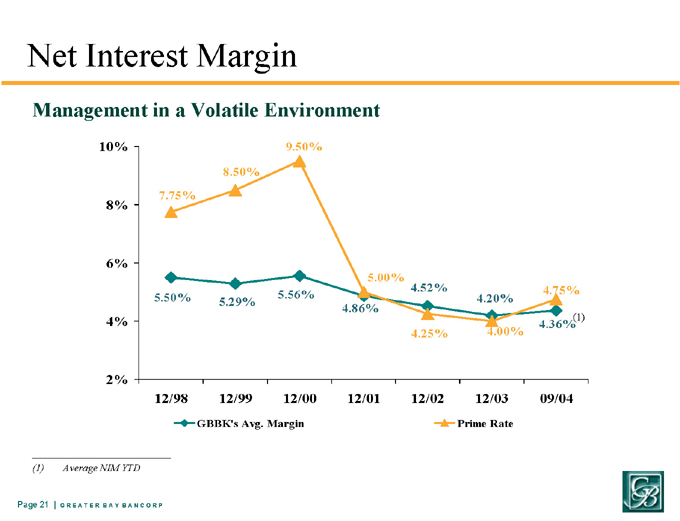
Net Interest Margin
Management in a Volatile Environment
(1) Average NIM YTD
4.36% (1) 5.50% 5.29% 5.56% 4.86% 4.52% 4.20% 4.75% 7.75% 8.50% 9.50% 5.00% 4.25% 4.00% 2% 4% 6%
8%
10%
12/98
12/99
12/00
12/01
12/02
12/03
09/04
GBBK’s Avg. Margin
Prime Rate
Page 21 | G R E A T E R B A Y B A N C O R P
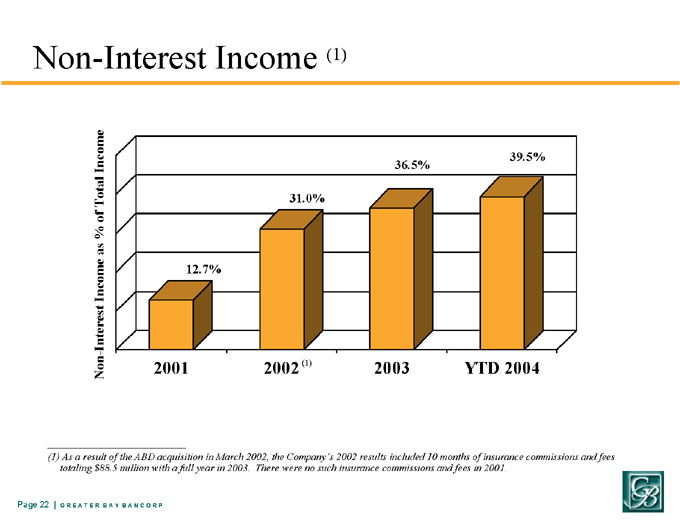
Non-Interest Income (1)
(1) As a result of the ABD acquisition in March 2002, the Company’s 2002 results included 10 months of insurance commissions and fees totaling $88.5 million with a full year in 2003. There were no such insurance commissions and fees in 2001.
Non-Interest Income as % of Total Income
12.7%
31.0%
36.5%
39.5%
2001
2002(1)
2003
YTD 2004
Page 22 | G R E A T E R B A Y B A N C O R P
Credit Quality
Reported credit metrics remain satisfactory.
Non-performing assets have declined 4% since year end 2003.
Charge-offs YTD 2004 are low at 0.39% of annualized loans.
Portfolio retains inherent lumpiness as movements in larger credits continue to influence these measures.
Current outstandings in the non-relationship SNC portfolio have been reduced to less than $4 million.
Continued attention to relationship-based business, portfolio concentrations, and discipline in underwriting remain at the core of our credit culture.
Page 23 | G R E A T E R B A Y B A N C O R P
Credit Quality
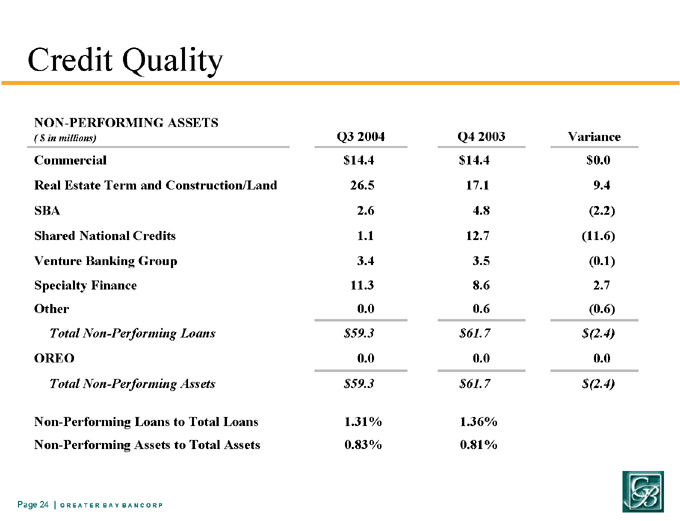
NON-PERFORMING ASSETS
($ in millions) Q3 2004 Q4 2003 Variance
Commercial $ 14.4 $ 14.4 $ 0.0
Real Estate Term and Construction/Land 26.5 17.1 9.4
SBA 2.6 4.8 (2.2)
Shared National Credits 1.1 12.7 (11.6)
Venture Banking Group 3.4 3.5 (0.1)
Specialty Finance 11.3 8.6 2.7
Other 0.0 0.6 (0.6)
Total Non-Performing Loans $ 59.3 $ 61.7 $ (2.4)
OREO 0.0 0.0 0.0
Total Non-Performing Assets $ 59.3 $ 61.7 $ (2.4)
Non-Performing Loans to Total Loans 1.31% 1.36%
Non-Performing Assets to Total Assets 0.83% 0.81%
Page 24 | G R E A T E R B A Y B A N C O R P
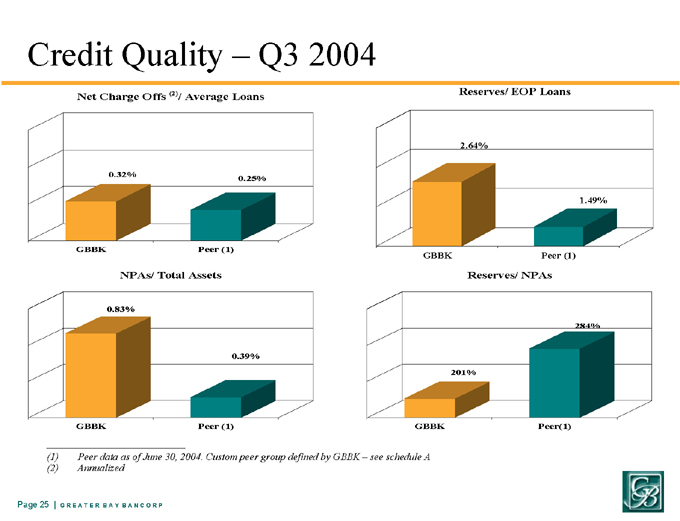
Credit Quality – Q3 2004
(1) Peer data as of June 30, 2004. Custom peer group defined by GBBK – see schedule A
(2) Annualized
2.64%
1.49%
GBBK
Peer (1)
Reserves/ EOP Loans
0.32%
0.25%
GBBK
Peer (1)
Net Charge Offs (2) / Average Loans
0.83%
0.39%
GBBK
Peer (1)
NPAs/ Total Assets
201%
284%
GBBK
Peer(1)
Reserves/ NPAs
Page 25 | G R E A T E R B A Y B A N C O R P
Credit Quality
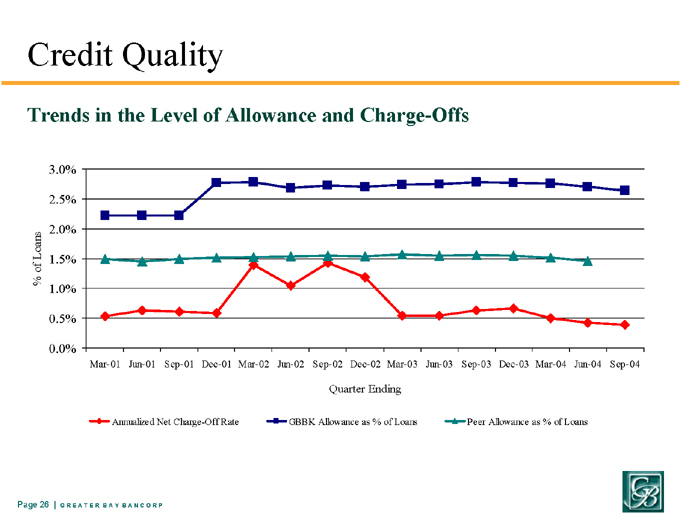
Trends in the Level of Allowance and Charge-Offs
0.0%
0.5%
1.0%
1.5%
2.0%
2.5%
3.0%
Mar-01
Jun-01
Sep-01
Dec-01
Mar-02
Jun-02
Sep-02
Dec-02
Mar-03
Jun-03
Sep-03
Dec-03
Mar-04
Jun-04
Sep-04
Quarter Ending % of Loans
Annualized Net Charge-Off Rate
GBBK Allowance as % of Loans
Peer Allowance as % of Loans
Page 26 | G R E A T E R B A Y B A N C O R P
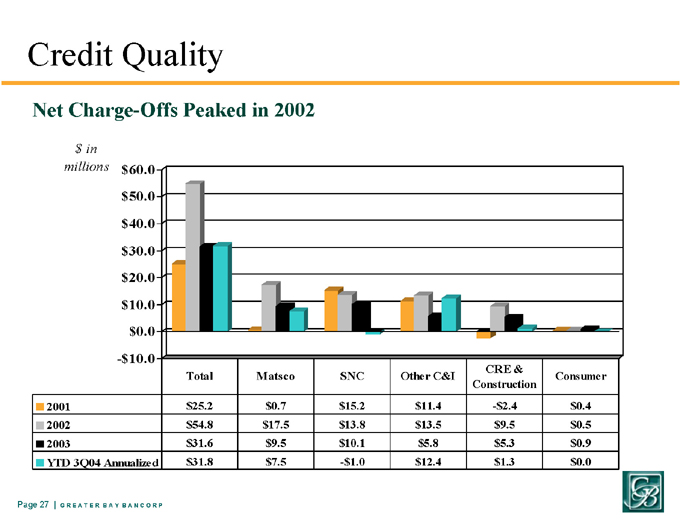
Credit Quality
Net Charge-Offs Peaked in 2002
-$10.0
$0.0
$10.0
$20.0
$30.0
$40.0
$50.0
$60.0
$ in millions
2001 $25.2 $0.7 $15.2 $11.4 -$2.4 $0.4
2002 $54.8 $17.5 $13.8 $13.5 $9.5 $0.5
2003 $31.6 $9.5 $10.1 $5.8 $5.3 $0.9
YTD 3Q04 Annualized $31.8 $7.5 -$1.0 $12.4 $1.3 $0.0
Total Matsco SNC Other C&I CRE & Construction Consumer
Page 27 | G R E A T E R B A Y B A N C O R P
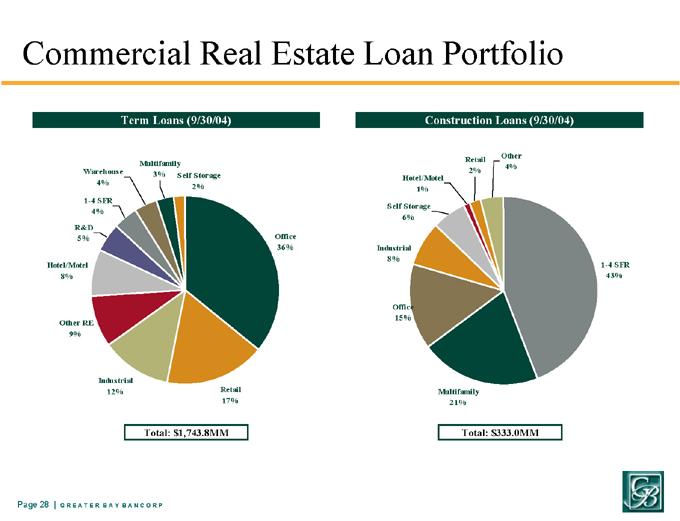
Commercial Real Estate Loan Portfolio
Term Loans (9/30/04)
Construction Loans (9/30/04)
Total: $1,743.8MM
Total: $333.0MM
1-4 SFR 43%
Multifamily 21%
Office 15%
Industrial 8%
Self Storage 6%
Hotel/Motel 1%
Retail 2%
Other 4%
Office 36%
Retail 17%
Industrial 12%
Other RE 9%
Hotel/Motel 8%
R&D 5%
1-4 SFR 4%
Warehouse 4%
Multifamily 3%
Self Storage 2%
Page 28 | G R E A T E R B A Y B A N C O R P
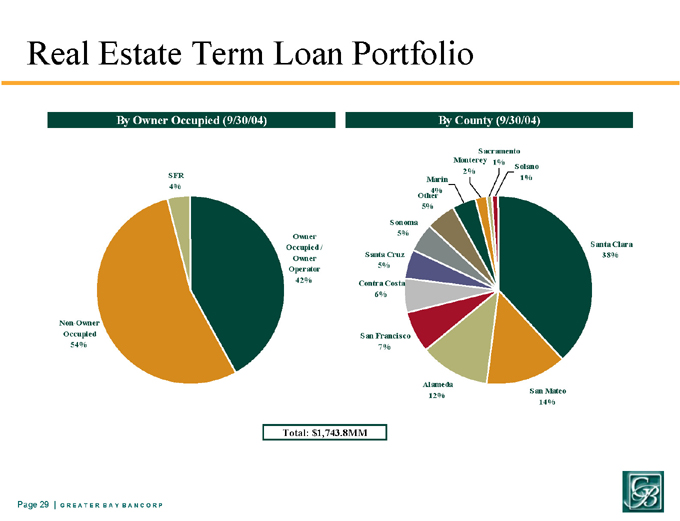
Real Estate Term Loan Portfolio
By Owner Occupied (9/30/04)
By County (9/30/04)
Total: $1,743.8MM
Owner Occupied / Owner Operator 42%
Non-Owner Occupied 54%
SFR 4%
Santa Clara 38%
San Mateo 14%
Alameda 12%
San Francisco 7%
Santa Cruz 5%
Sonoma 5%
Other 5%
Monterey 2%
Marin 4%
Contra Costa 6%
Sacramento 1%
Solano 1%
Page 29 | G R E A T E R B A Y B A N C O R P
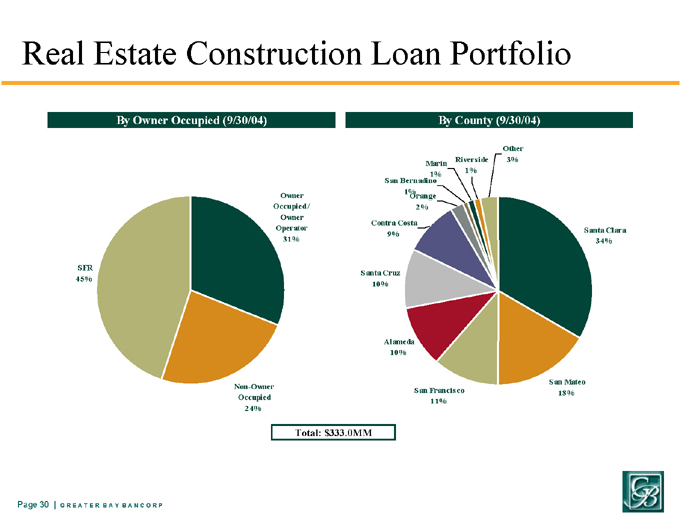
Real Estate Construction Loan Portfolio
By County (9/30/04)
By Owner Occupied (9/30/04)
Total: $333.0MM
Owner Occupied / Owner Operator 31%
Non-Owner Occupied 24%
SFR 45%
Santa Clara 34%
San Mateo 18%
San Francisco 11%
Alameda 10%
Santa Cruz 10%
Contra Costa 9%
Orange 2%
San Bernadino 1%
Riverside 1%
Other 3%
Marin 1%
Page 30 | G R E A T E R B A Y B A N C O R P
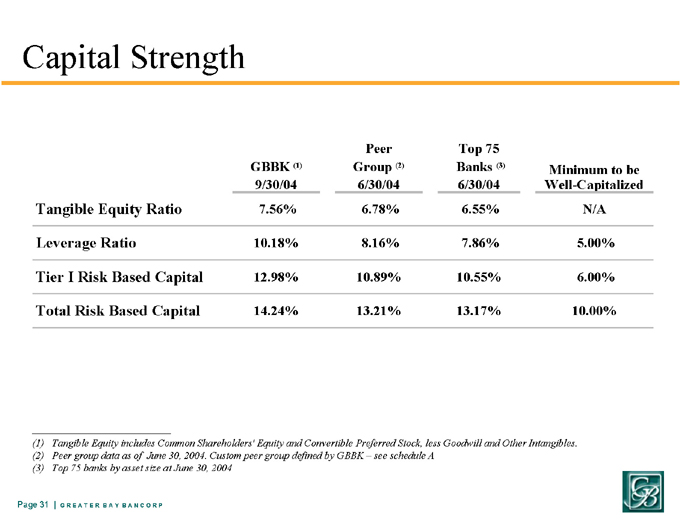
Capital Strength
GBBK (1) 9/30/04 Peer Group (2) 6/30/04 Top 75 Banks (3) 6/30/04 Minimum to be Well-Capitalized
Tangible Equity Ratio 7.56% 6.78% 6.55% N/A
Leverage Ratio 10.18% 8.16% 7.86% 5.00%
Tier I Risk Based Capital 12.98% 10.89% 10.55% 6.00%
Total Risk Based Capital 14.24% 13.21% 13.17% 10.00%
(1) Tangible Equity includes Common Shareholders’ Equity and Convertible Preferred Stock, less Goodwill and Other Intangibles.
(2) Peer group data as of June 30, 2004. Custom peer group defined by GBBK – see schedule A
(3) Top 75 banks by asset size at June 30, 2004
Page 31 | G R E A T E R B A Y B A N C O R P
Capital Management and Strength
All capital ratios of the Company and the Bank continue to substantially exceed regulatory well-capitalized guidelines.
Total tangible equity ratio is 7.56% up from 6.68% at Q2; increase reflected $18.4 million appreciation of AFS securities.
Share repurchase plan has approximately $10.8 million remaining – continually evaluate opportunities to buy back shares as a part of our capital management process.
Page 32 | G R E A T E R B A Y B A N C O R P
Looking Forward: Our Strategy for 2004 and Beyond
“The economy of the Bay Area took a major blow from the post-2000 downturn, and the damage received maximum publicity from a fascinated world.”
McKinsey & Company/Bay Area Council
“Downturn and Recovery in Restoring Prosperity” Economic Profile
January 2004
Page 34 | G R E A T E R B A Y B A N C O R P
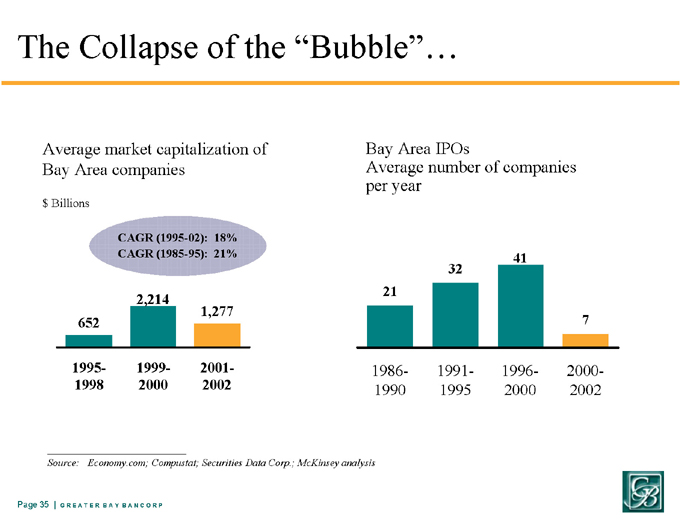
The Collapse of the “Bubble”…
CAGR (1995-02): 18%
CAGR (1985-95): 21%
Source: Economy.com; Compustat; Securities Data Corp.; McKinsey analysis
Average market capitalization of Bay Area companies
$ Billions
Bay Area IPOs
Average number of companies per year
652
1,277
2,214
1995-1998
1999-2000
2001-2002
21
32
41
7
1986-1990
1991-1995
1996-2000
2000-2002
Page 35 | G R E A T E R B A Y B A N C O R P
“The Bay Area has proven fairly resilient in the economic downturn. Several fundamental strengths remain in tact such as its highly skilled work force, global presence, and multi-faceted economy…(and) the Bay Area retains its core dynamism, and still has marked advantages over most other comparable regions in the country.”
McKinsey & Company/Bay Area Council
“Downturn and Recovery in Restoring Prosperity” Economic Profile
January 2004
Page 36 | G R E A T E R B A Y B A N C O R P
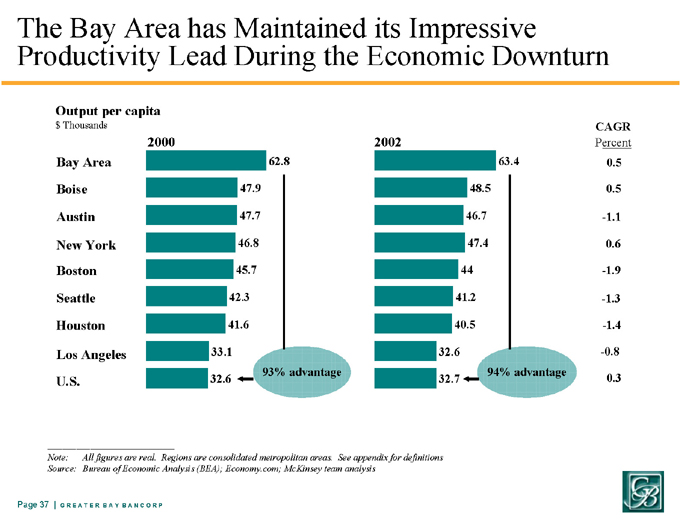
The Bay Area has Maintained its Impressive Productivity Lead During the Economic Downturn
Note: All figures are real. Regions are consolidated metropolitan areas. See appendix for definitions
Source: Bureau of Economic Analysis (BEA); Economy.com; McKinsey team analysis
2000 2002
Output per capita $ Thousands
CAGR
Percent
Bay Area Seattle Boise Austin Boston Houston New York Los Angeles U.S.
94% advantage
93% advantage
62.8 47.9 47.7 46.8 45.7 42.3 41.6 33.1
32.6
63.4
48.5
46.7
47.4
44
41.2
40.5
32.6
32.7
Page 37 | G R E A T E R B A Y B A N C O R P
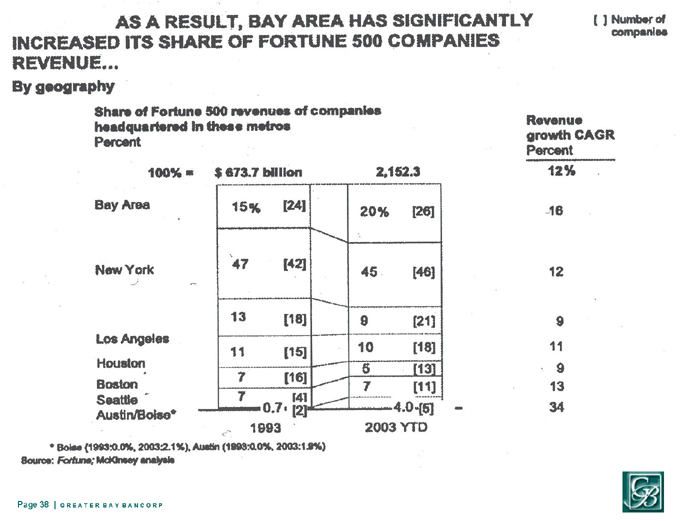
AS A RESULT, BAY AREA HAS SIGNIFICANTLY INCREASED ITS SHARE OF FORTUNE 500 COMPANIES REVENUE
[ ] Number of companies
By geography
Share of Fortune 500 revenues of companies headquartered in these metros Percent
100% = $673.7 billion 2,152.3
Bay Area New York Los Angeles Houston Boston Seattle Austin/Boise*
15% [24]
47 [42]
13 [18]
11 [15]
7 [16]
7 [4]
0.7 [2]
20% [26]
45 [46]
9 [21]
10 [18]
5 [13]
7 [11]
4.0 [5]
Revenue Growth CAGR Percent
12% 16 12 9 11 9 13 34
* Boise (1993:0.0%, 2003:2.1%), Austin (1993:0.0%, 2003:1.9%)
Source: Fortune; McKinsey analysis
Page 38 | G R E A T E R B A Y B A N C O R P
Sustainably Superior Virtues of the Bay Area Economy
Intellectual Capital
Venture Capital
Productivity
Per Capita Income
Exports as Component of GRP
Entrepreneurial Spirit/Quest for Innovation
Page 39 | G R E A T E R B A Y B A N C O R P

Strategic Goals
Reaching greater critical mass in the Company’s market areas.
Generating increased fee income through cross-selling broader services.
Continue to diversify revenue stream.
Proactively mitigate and manage risk.
Opportunistic market expansion.
Page 40 | G R E A T E R B A Y B A N C O R P
Proactively Mitigate and Manage Risk
Continual enterprise-wide risk management.
Uncompromising focus on credit quality.
Monitor and manage loan concentration.
Focus on relationships – know our clients.
Proactive interest rate risk management.
Page 41 | G R E A T E R B A Y B A N C O R P
Market Concerns About GBBK
The Northern California economy, the state deficit and the technology industry in Silicon Valley.
Real estate valuations, lease rates and vacancy factors in the San Francisco Bay Area.
Market perception of GBBK’s credit quality and overall risk profile.
Ability to grow loans and sustain core EPS growth.
Deployment of capital – share repurchases, acquisitions, loan growth.
Direction and sensitivity of net interest margin.
Page 42 | G R E A T E R B A Y B A N C O R P
Guidance for the Remainder of 2004
Loan Growth – ranging from the low-single to mid-single digits.
Deposit Growth—core growth in the mid-single digits.
Credit Quality – net charge-offs could range from 60-70 basis points of average loans outstanding.
Net Interest Margin – based on balance sheet trends and the rate sensitivity of the balance sheet, expect margin to be in the 4.40% to 4.50% range.
Page 43 | G R E A T E R B A Y B A N C O R P

Investment Rationale
Well-Positioned for an Economic Upturn
Our franchise provides competitive opportunities.
Asset sensitive balance sheet.
Internal capital generation will support future growth.
Credit metrics are satisfactory.
Increase in fee income from insurance agency and wealth management.
Increased business activity will bring higher commercial loan volume.
Page 45 | G R E A T E R B A Y B A N C O R P
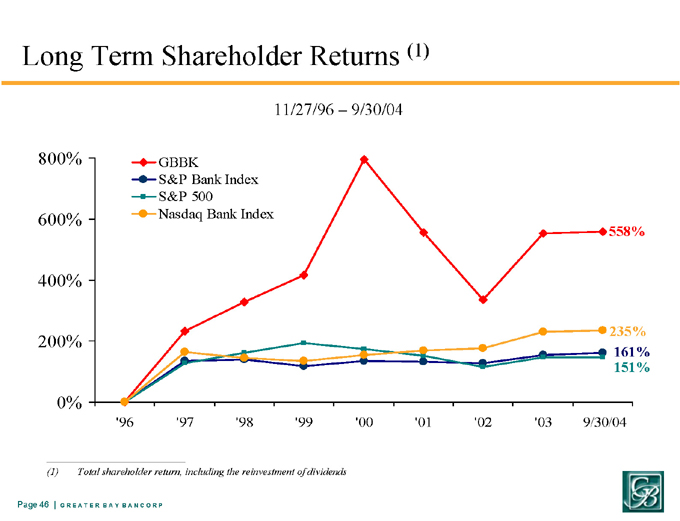
Long Term Shareholder Returns (1)
11/27/96 – 9/30/04
558%
161%
151%
235%
(1) Total shareholder return, including the reinvestment of dividends
0%
200%
400%
600%
800%
‘96
‘97
‘98
‘99
‘00
‘01
‘02
‘03
9/30/04
GBBK
S&P Bank Index
S&P 500
Nasdaq Bank Index
Page 46 | G R E A T E R B A Y B A N C O R P

Appendix
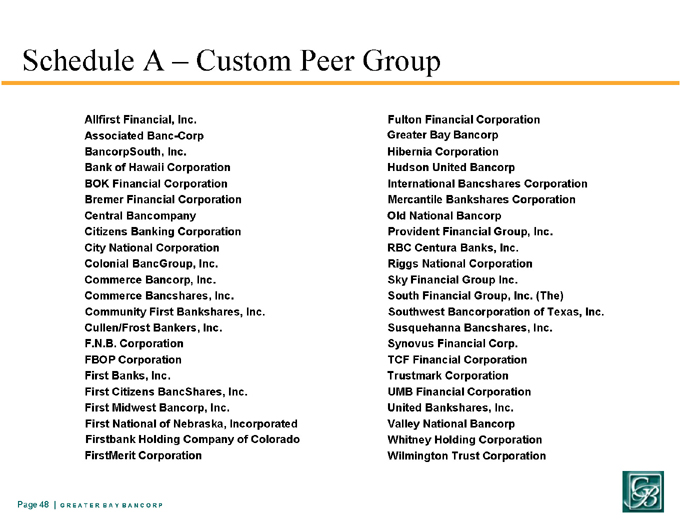
Schedule A – Custom Peer Group
Allfirst Financial, Inc.
Fulton Financial Corporation
Associated Banc-Corp
Greater Bay Bancorp
BancorpSouth, Inc.
Hibernia Corporation
Bank of Hawaii Corporation
Hudson United Bancorp
BOK Financial Corporation
International Bancshares Corporation
Bremer Financial Corporation
Mercantile Bankshares Corporation
Central Bancompany
Old National Bancorp
Citizens Banking Corporation
Provident Financial Group, Inc.
City National Corporation
RBC Centura Banks, Inc.
Colonial BancGroup, Inc.
Riggs National Corporation
Commerce Bancorp, Inc.
Sky Financial Group Inc.
Commerce Bancshares, Inc.
South Financial Group, Inc. (The)
Community First Bankshares, Inc.
Southwest Bancorporation of Texas, Inc.
Cullen/Frost Bankers, Inc.
Susquehanna Bancshares, Inc.
F.N.B. Corporation
Synovus Financial Corp.
FBOP Corporation
TCF Financial Corporation
First Banks, Inc.
Trustmark Corporation
First Citizens BancShares, Inc.
UMB Financial Corporation
First Midwest Bancorp, Inc.
United Bankshares, Inc.
First National of Nebraska, Incorporated
Valley National Bancorp
Whitney Holding Corporation
Firstbank Holding Company of Colorado
Wilmington Trust Corporation
FirstMerit Corporation
Page 48 | G R E A T E R B A Y B A N C O R P