Exhibit 99
Slide Presentation of Greater Bay Bancorp as of March 31, 2005
Greater Bay Bancorp
Keefe, Bruyette & Woods Investor Meeting May 2, 2005
1
Greater Bay Bancorp
Certain matters discussed in this presentation constitute forward-looking statements within the meaning of the Private Securities Litigation Reform Act of 1995. These forward looking statements relate to the Company’s current expectations regarding future operating results, net interest margin, net loan charge-offs, asset quality, level of loan loss reserves, growth in loans and deposits and the strength of the local economy. These forward looking statements are subject to certain risks and uncertainties that could cause the actual results, performance or achievements to differ materially from those expressed, suggested or implied by the forward looking statements. These risks and uncertainties include, but are not limited to: (1) the impact of changes in interest rates, a decline in economic conditions at the international, national and local levels and increased competition among financial service providers on the Company’s results of operations and the quality of the Company’s earning assets; (2) any difficulties that may be encountered in consolidating the bank subsidiaries and in realizing operating efficiencies; (3) government regulation, including developments related to the ongoing insurance industry-wide investigations into contingent commissions and override payments; and (4) the other risks set forth in the Company’s reports filed with the Securities and Exchange Commission, including its Annual Report on Form 10-K for the year ended December 31, 2004. Greater Bay does not undertake, and specifically disclaims, any obligation to update any forward-looking statements to reflect occurrences or unanticipated events or circumstances after the date of such statements.
2
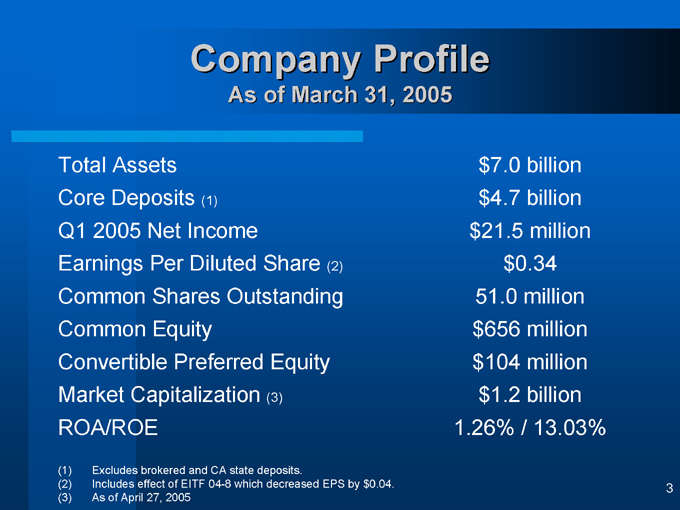
Company Profile
As of March 31, 2005
Total Assets $7.0 billion
Core Deposits (1) $4.7 billion
Q1 2005 Net Income $21.5 million
Earnings Per Diluted Share (2) $0.34
Common Shares Outstanding 51.0 million
Common Equity $656 million
Convertible Preferred Equity $104 million
Market Capitalization (3) $1.2 billion
ROA/ROE 1.26% / 13.03%
(1) Excludes brokered and CA state deposits.
(2) Includes effect of EITF 04-8 which decreased EPS by $0.04. (3) As of April 27, 2005
3
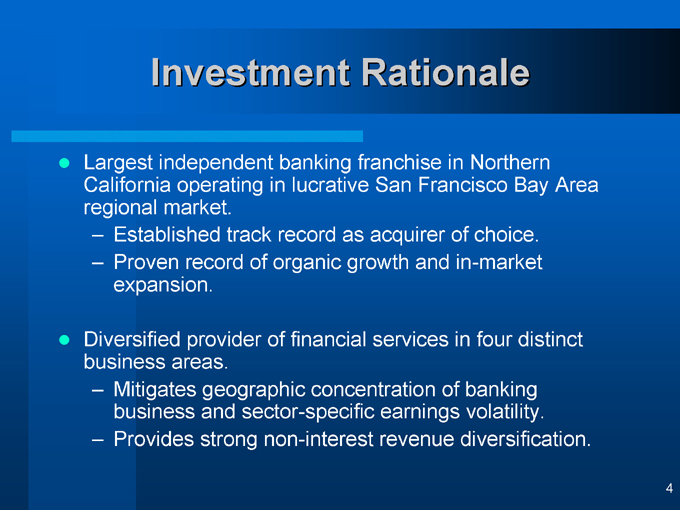
Investment Rationale
Largest independent banking franchise in Northern California operating in lucrative San Francisco Bay Area regional market.
Established track record as acquirer of choice. Proven record of organic growth and in-market expansion.
Diversified provider of financial services in four distinct business areas.
Mitigates geographic concentration of banking business and sector-specific earnings volatility. Provides strong non-interest revenue diversification.
4

Investment Rationale
Strong financial fundamentals and sound credit metrics.
Experienced and proven executive management team.
Leading to long-term record of superior shareholder return.
5
An Exceptional Regional Market
6
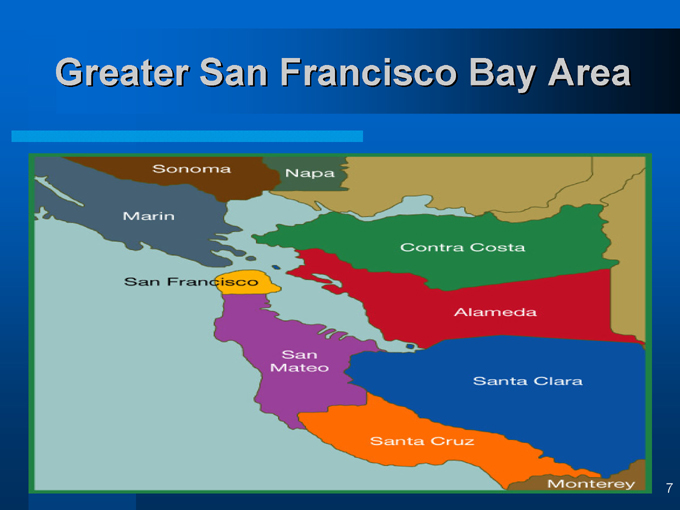
Greater San Francisco Bay Area
Sonaoma
Napa
Marin
San Francisco
San Mateo
Santa Cruz
Contra Costa
Alameda
Santa Clara
Monterey
7
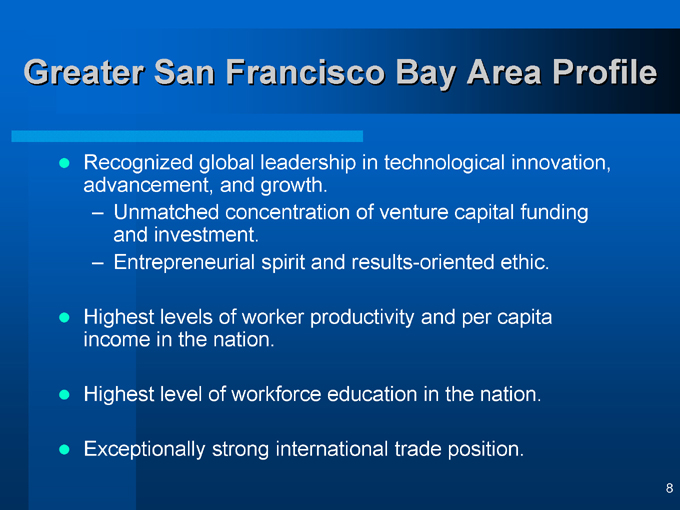
Greater San Francisco Bay Area Profile
Recognized global leadership in technological innovation, advancement, and growth.
Unmatched concentration of venture capital funding and investment.
Entrepreneurial spirit and results-oriented ethic.
Highest levels of worker productivity and per capita income in the nation.
Highest level of workforce education in the nation.
Exceptionally strong international trade position.
8
A Regional Strategic Perspective
“The Bay Area has proven fairly resilient in the economic downturn. Several fundamental strengths remain in tact such as its highly skilled work force, global presence, and multi-faceted economy…(and) the Bay Area retains its core dynamism, and still has marked advantages over other comparable regions in the country.”
McKinsey & Company/Bay Area Council “Downturn and Recovery in Restoring Prosperity” Economic Profile January 2004
9
Diversified Financial Services Provider
10
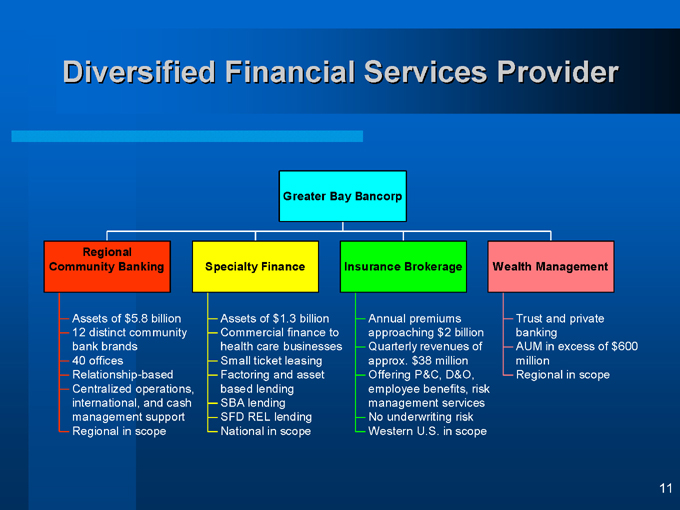
Diversified Financial Services Provider
Greater Bay Bancorp
Regional Community Banking
Assets of $5.8 billion
12 distinct community bank brands
40 offices Relationship-based
Centralized operations, international, and cash management support
Regional in scope
Specialty Finance
Assets of $1.3 billion
Commercial finance to health care businesses
Small ticket leasing
Factoring and asset based lending
SBA lending SFD REL lending
National in scope
Insurance Brokerage
Annual premiums approaching $2 billion
Quarterly revenues of approx. $38 million
Offering P&C, D&O, employee benefits, risk management services
No underwriting risk
Western U.S. in scope
Wealth Management
Trust and private banking
AUM in excess of $600 million
Regional in scope
11
Regional Community Banking
12
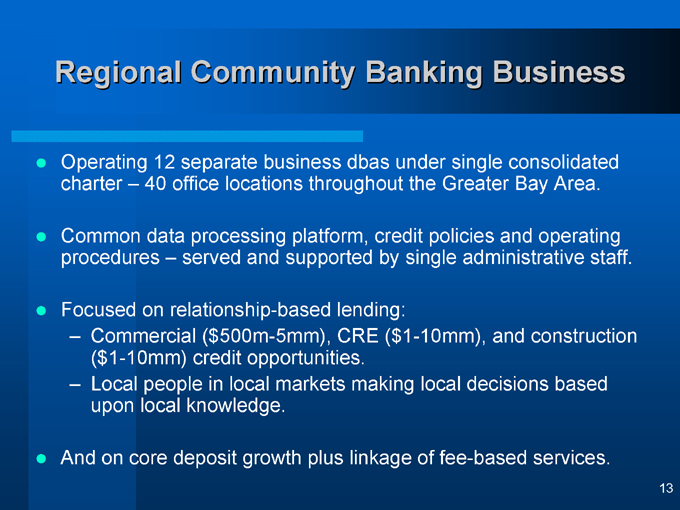
Regional Community Banking Business
Operating 12 separate business dbas under single consolidated charter – 40 office locations throughout the Greater Bay Area.
Common data processing platform, credit policies and operating procedures – served and supported by single administrative staff.
Focused on relationship-based lending:
Commercial ($500m-5mm), CRE ($1-10mm), and construction
($1-10mm) credit opportunities.
Local people in local markets making local decisions based upon local knowledge.
And on core deposit growth plus linkage of fee-based services.
13
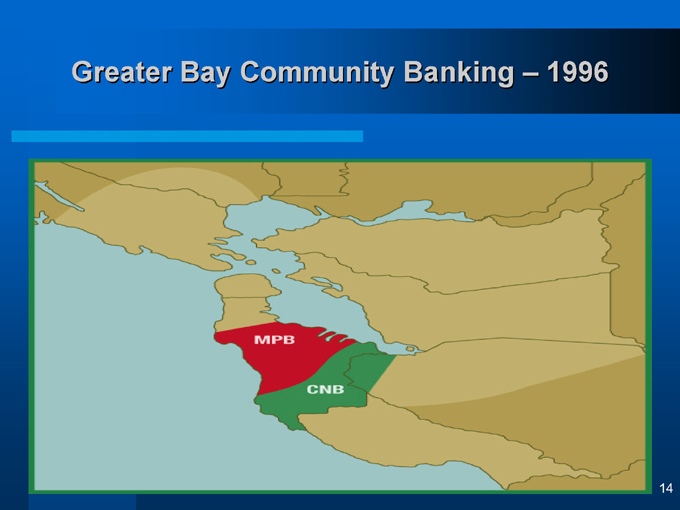
Greater Bay Community Banking – 1996
MPB
CNB
14
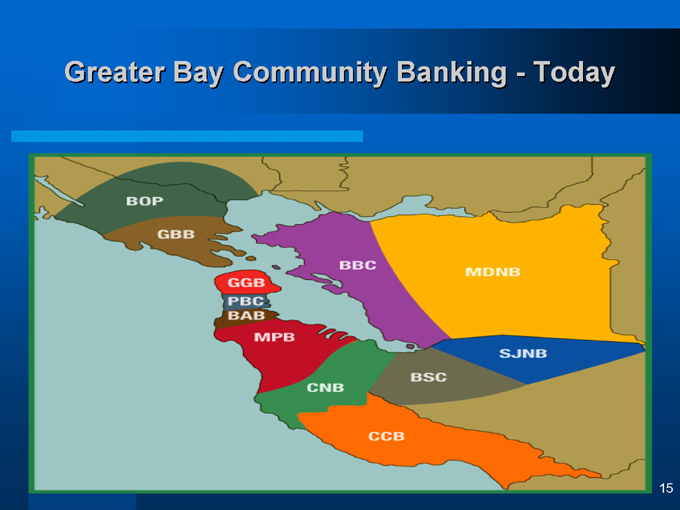
Greater Bay Community Banking—Today
BOP
GBB
GGB
PBC
BAB
MPB
CNB
CCB
BSC
SJNB
MDNB
BBC
15
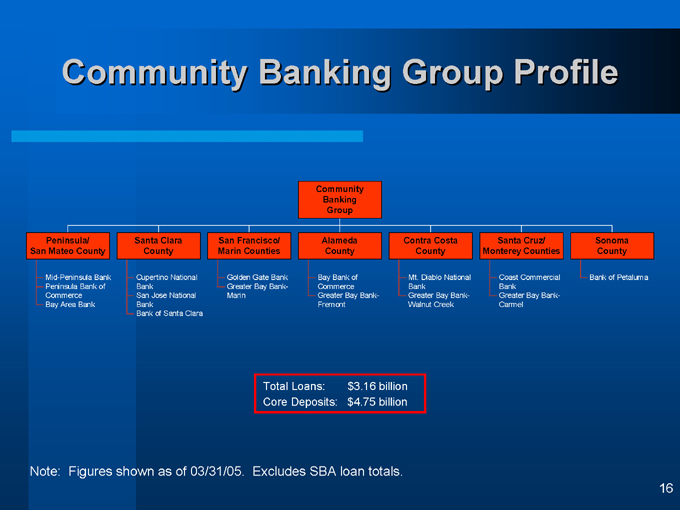
Community Banking Group Profile
Community Banking Group
Peninsula/ San Mateo County
Mid-Peninsula Bank
Peninsula Bank of Commerce
Bay Area Bank
Santa Clara County
Cupertino National Bank
San Jose National Bank
Bank of Santa Clara
San Francisco/ Marin Counties
Golden Gate Bank
Greater Bay Bank-Marin
Alameda County
Bay Bank of Commerce
Greater Bay Bank-Fremont
Contra Costa County
Mt. Diablo National Bank
Greater Bay Bank-Walnut Creek
Santa Cruz/ Monterey Counties
Coast Commercial Bank
Greater Bay Bank-Carmel
Sonoma County
Bank of Petaluma
Total Loans: $3.16 billion Core Deposits: $4.75 billion
Note: Figures shown as of 03/31/05. Excludes SBA loan totals.
16
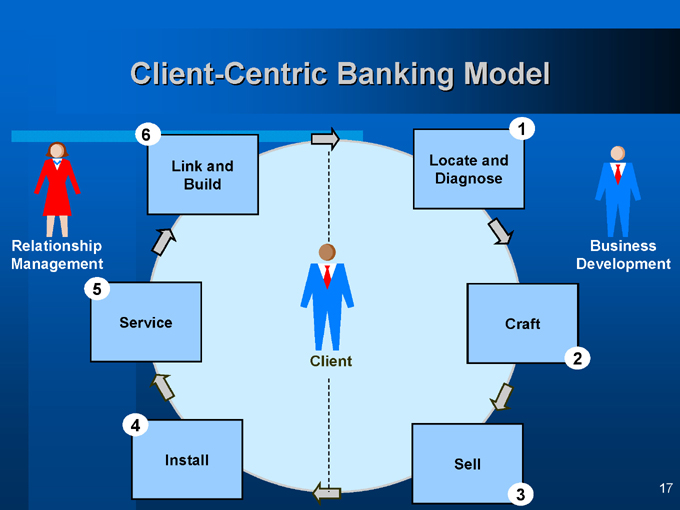
Client-Centric Banking Model
1
Locate and Diagnose
Business Development
2
Craft
3
Sell
4
Install
5
Service
6
Link and Build
Client
Relationship Management
17
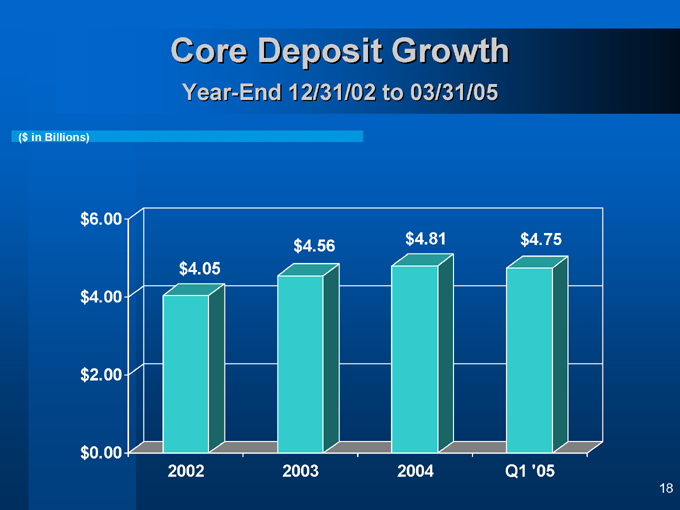
Core Deposit Growth
Year-End 12/31/02 to 03/31/05
($ in Billions)
$6.00 $4.00 $2.00 $0.00
$4.05 $4.56 $4.81 $4.75
2002 2003 2004 Q1 ‘05
18

Specialty Finance
19
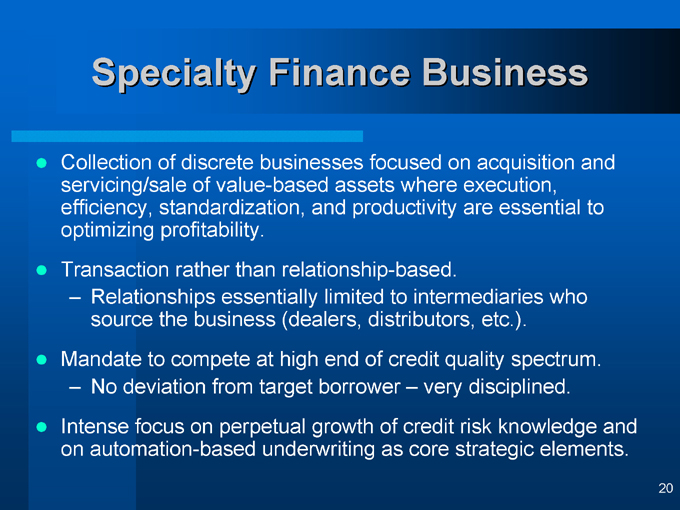
Specialty Finance Business
Collection of discrete businesses focused on acquisition and servicing/sale of value-based assets where execution, efficiency, standardization, and productivity are essential to optimizing profitability.
Transaction rather than relationship-based.
Relationships essentially limited to intermediaries who source the business (dealers, distributors, etc.).
Mandate to compete at high end of credit quality spectrum.
No deviation from target borrower – very disciplined.
Intense focus on perpetual growth of credit risk knowledge and on automation-based underwriting as core strategic elements.
20
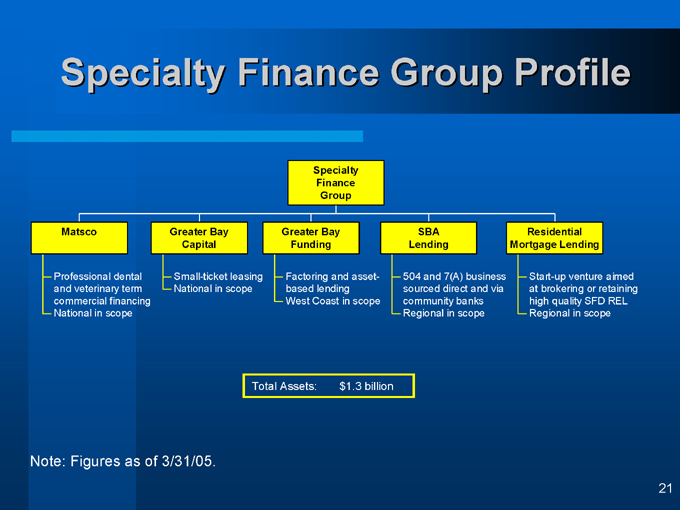
Specialty Finance Group Profile
Specialty Finance Group
Matsco
Professional dental and veterinary term commercial financing
National in scope
Greater Bay Capital
Small-ticket leasing
National in scope
Greater Bay Funding
Factoring and asset-based lending
West Coast in scope
SBA Lending
504 and 7(A) business sourced direct and via community banks
Regional in scope
Residential Mortgage Lending
Start-up venture aimed at brokering or retaining high quality SFD REL
Regional in scope
Total Assets: $1.3 billion
Note: Figures as of 3/31/05.
21
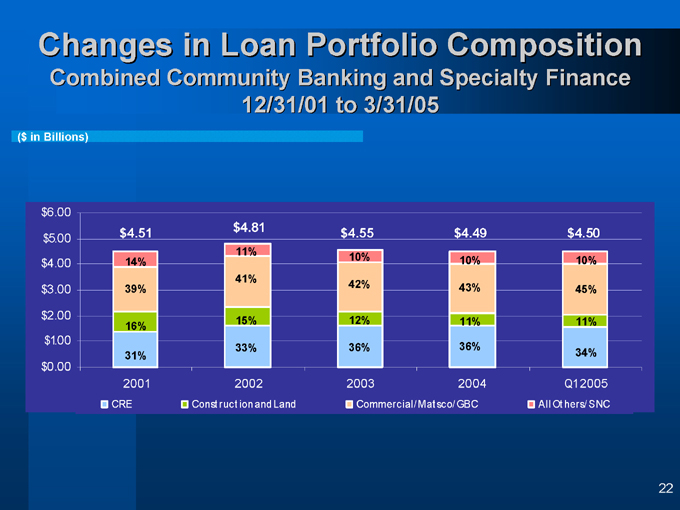
Changes in Loan Portfolio Composition
Combined Community Banking and Specialty Finance 12/31/01 to 3/31/05
($in Billions)
$6.00
$5.00
$4.00
$3.00
$2.00
$1.00
$0.00
$4.51
$4.81
$4.55
$4.49
$4.50
14%
39%
16%
31%
11%
41%
15%
33%
10%
42%
12%
36%
10%
43%
11%
36%
10%
45%
11%
34%
2001 2002 2003 2004 Q1 2005
CRE
Construction and Land
Commercial/ Mat sco/ GBC
All Others/ SNC
22
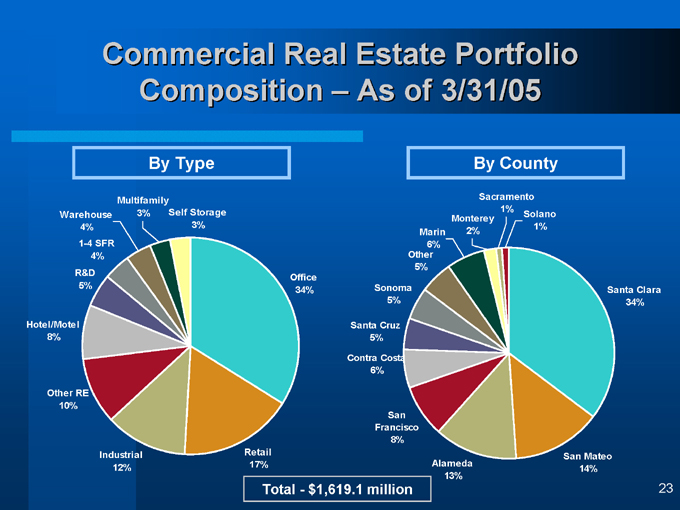
Commercial Real Estate Portfolio Composition – As of 3/31/05
By Type
Self Storage 3%
Multifamily 3%
Warehouse 4%
1-4 SFR
4%
R&D 5%
Hotel/Motel 8%
Other RE
10%
Industrial 12%
Retail 17%
Office 34%
By County
Santa Clara 34%
Solano 1%
Sacramento 1%
Monterey 2%
Marin 6%
Other 5%
Sonoma 5%
Santa Cruz 5%
Contra Costa 6%
San Francisco 8%
Alameda 13%
San Mateo 14%
Total - $1,619.1 million
23
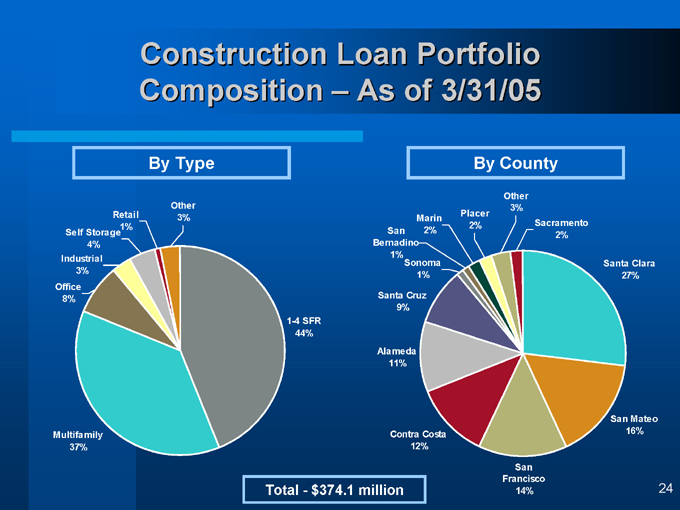
Construction Loan Portfolio Composition – As of 3/31/05
By Type
Other 3%
Retail 1%
Self Storage 4%
Industrial 3%
Office 8%
Multifamily 37%
1-4 SFR
44%
By County
Santa Clara 27%
Sacramento 2%
Other 3%
Placer 2%
Marin 2%
San Bernadino 1%
Sonoma 1%
Santa Cruz 9%
Alameda 11%
Contra Costa 12%
San Francisco 14%
San Mateo 16%
Total—$374.1 million
24
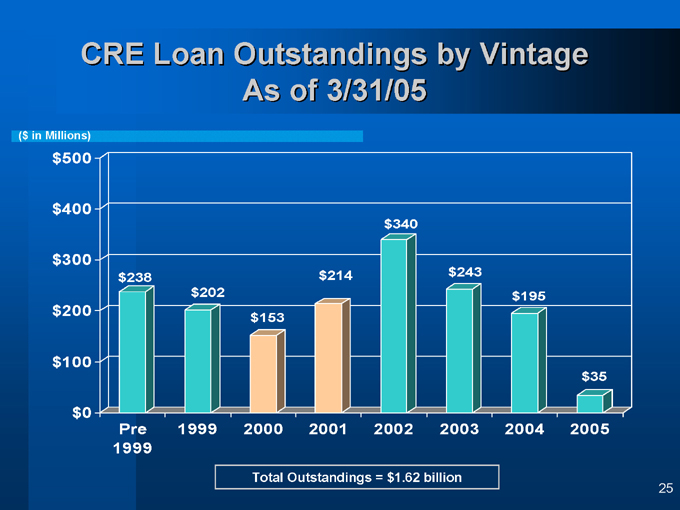
CRE Loan Outstandings by Vintage As of 3/31/05
($ in Millions)
$500 $400 $300 $200 $100 $0 $238 $202 $153 $214 $340 $243 $195 $35
Pre 1999 2000 2001 2002 2003 2004 2005 1999
Total Outstandings = $1.62 billion
25
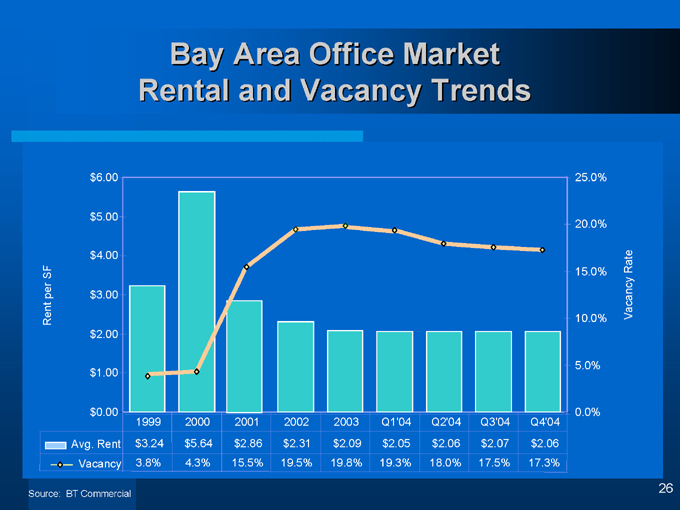
Bay Area Office Market Rental and Vacancy Trends
Rent per SF
$6.00 $5.00 $4.00 $3.00 $2.00 $1.00 $0.00
Avg. Rent
Vacancy
1999 2000 2001 2002 2003 Q1’04 Q2’04 Q3’04 Q4’04
$3.24 $5.64 $2.86 $2.31 $2.09 $2.05 $2.06 $2.07 $2.06
3.8% 4.3% 15.5% 19.5% 19.8% 19.3% 18.0% 17.5% 17.3%
25.0% 20.0% 15.0% 10.0%
5.0% 0.0%
Vacancy Rate
Source: BT Commercial
26

Commercial Insurance Brokerage
27
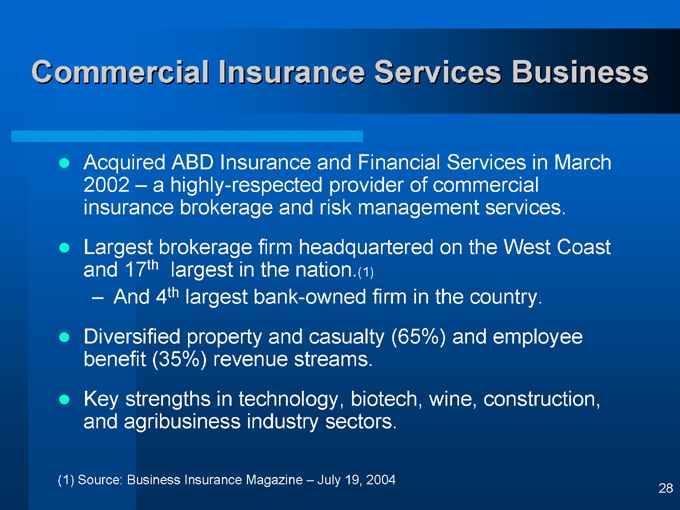
Commercial Insurance Services Business
Acquired ABD Insurance and Financial Services in March 2002 – a highly-respected provider of commercial insurance brokerage and risk management services.
Largest brokerage firm headquartered on the West Coast and 17th largest in the nation.(1)
And 4th largest bank-owned firm in the country.
Diversified property and casualty (65%) and employee benefit (35%) revenue streams.
Key strengths in technology, biotech, wine, construction, and agribusiness industry sectors.
(1) Source: Business Insurance Magazine – July 19, 2004
28
Commercial Insurance Services Business
Strategic focus on disciplined expansion (via organic growth and acquisition) into key western regional markets.
To leverage existing lines of business expertise – and to develop enhanced “provider-of-choice” branding and pricing positions.
Highly successful expansion into Seattle is indicative of both capabilities and expectations.
Announced acquisition of Lucini-Parish, a highly regarded firm in Nevada
29
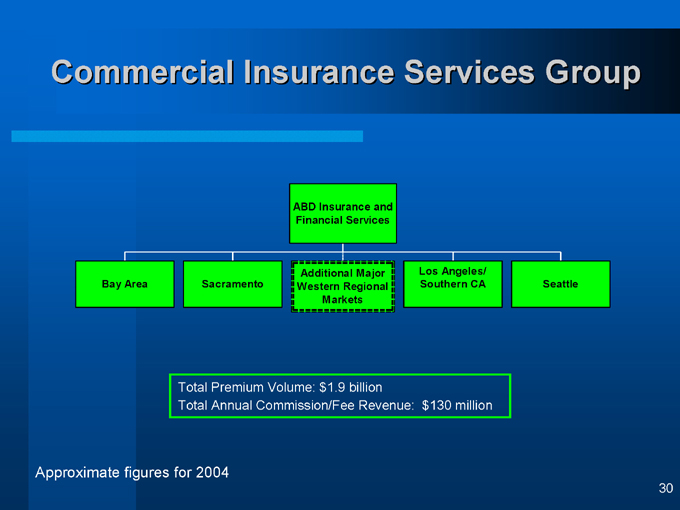
Commercial Insurance Services Group
ABD Insurance and Financial Services
Bay Area
Sacramento
Additional Major Western Regional Markets
Los Angeles/
Southern CA
Seattle
Total Premium Volume: $1.9 billion
Total Annual Commission/Fee Revenue: $130 million
Approximate figures for 2004
30
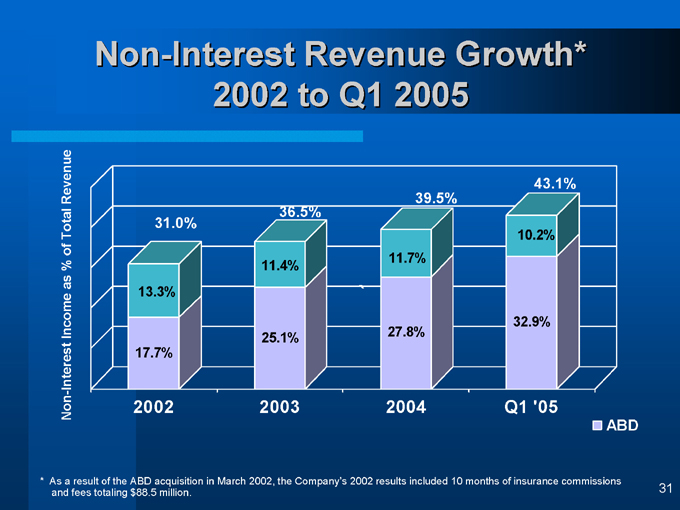
Non-Interest Revenue Growth* 2002 to Q1 2005
Non-Interest Income as % of Total Revenue
31.0%
13.3%
17.7%
36.5%
11.4%
25.1%
39.5%
11.7%
27.8%
43.1%
10.2%
32.9%
2002 2003 2004 Q1 ‘05
ABD
* As a result of the ABD acquisition in March 2002, the Company’s 2002 results included 10 months of insurance commissions and fees totaling $88.5 million.
31
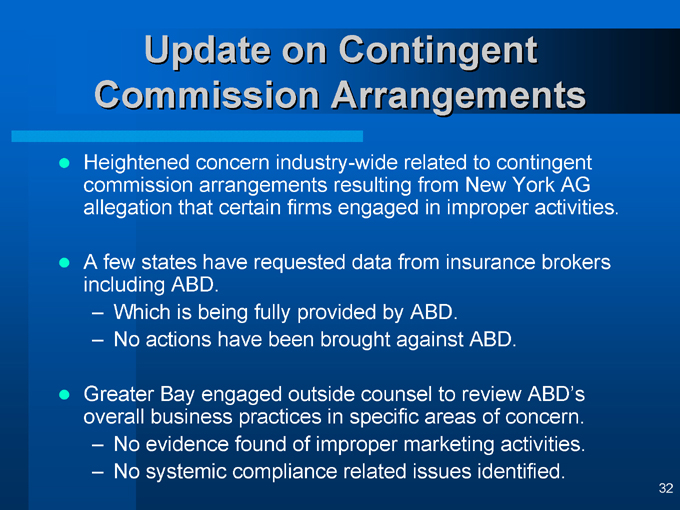
Update on Contingent Commission Arrangements
Heightened concern industry-wide related to contingent commission arrangements resulting from New York AG allegation that certain firms engaged in improper activities.
A few states have requested data from insurance brokers including ABD.
Which is being fully provided by ABD. No actions have been brought against ABD.
Greater Bay engaged outside counsel to review ABD’s overall business practices in specific areas of concern.
No evidence found of improper marketing activities. No systemic compliance related issues identified.
32
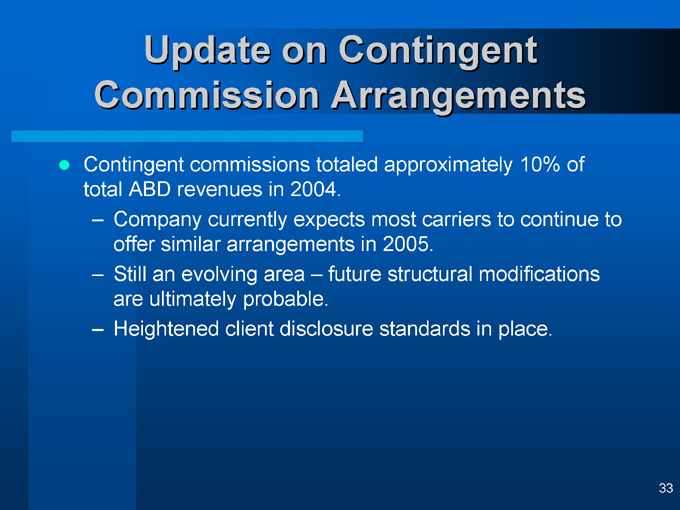
Update on Contingent Commission Arrangements
Contingent commissions totaled approximately 10% of total ABD revenues in 2004.
Company currently expects most carriers to continue to offer similar arrangements in 2005.
Still an evolving area – future structural modifications are ultimately probable.
Heightened client disclosure standards in place.
33
Sound Credit Metrics
34
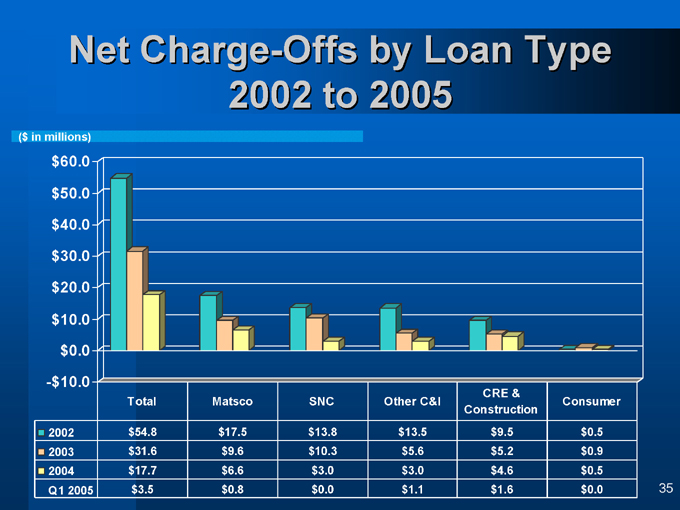
Net Charge-Offs by Loan Type 2002 to 2005
($ in millions)
$60.0 $50.0 $40.0 $30.0 $20.0 $10.0 $0.0
-$ 10.0
2002 2003 2004 Q1 2005
Total Matsco SNC Other C&I CRE & Construction Consumer
$54.8 $17.5 $13.8 $13.5 $9.5 $0.5
$31.6 $9.6 $10.3 $5.6 $5.2 $0.9
$17.7 $6.6 $3.0 $3.0 $4.6 $0.5
$3.5 $0.8 $0.0 $1.1 $1.6 $0.0
35
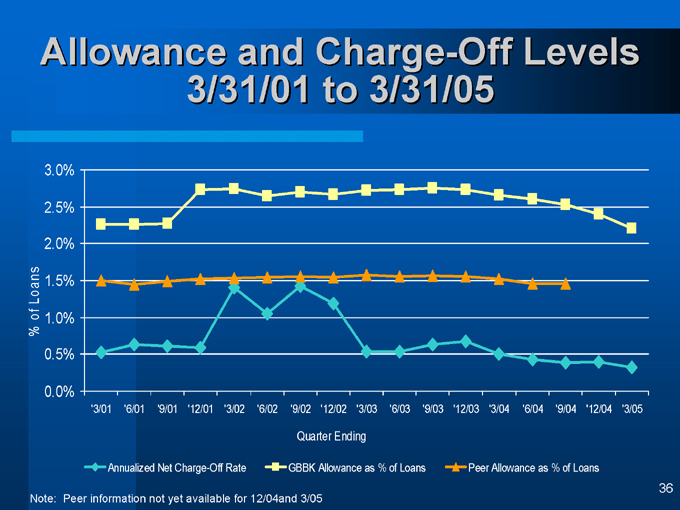
Allowance and Charge-Off Levels 3/31/01 to 3/31/05
% of Loans
3.0% 2.5% 2.0% 1.5% 1.0% 0.5% 0.0%
‘3/01 ‘6/01 ‘9/01 ‘12/01 ‘3/02 ‘6/02 ‘9/02 ‘12/02 ‘3/03 ‘6/03 ‘9/03 ‘12/03 ‘3/04 ‘6/04 ‘9/04 ‘12/04 ‘3/05
Quarter Ending
Annualized Net Charge-Off Rate
GBBK Allowance as % of Loans
Peer Allowance as % of Loans
Note: Peer information not yet available for 12/04and 3/05
36
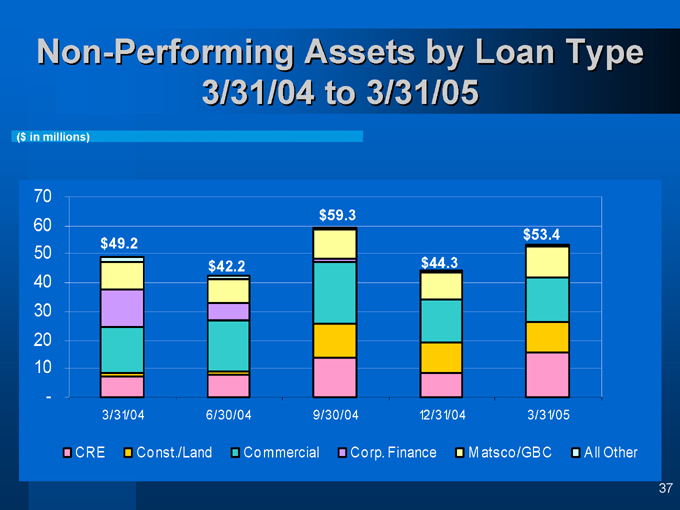
Non-Performing Assets by Loan Type 3/31/04 to 3/31/05
($ in millions)
70 60 50 40 30 20 10 $49.2 $42.2 $59.3 $44.3 $53.4 -
3/31/04 6/30/04 9/30/04 12/31/04 3/31/05
CRE
Const./Land
Commercial
Corp. Finance
Matsco/GBC
All Other
37
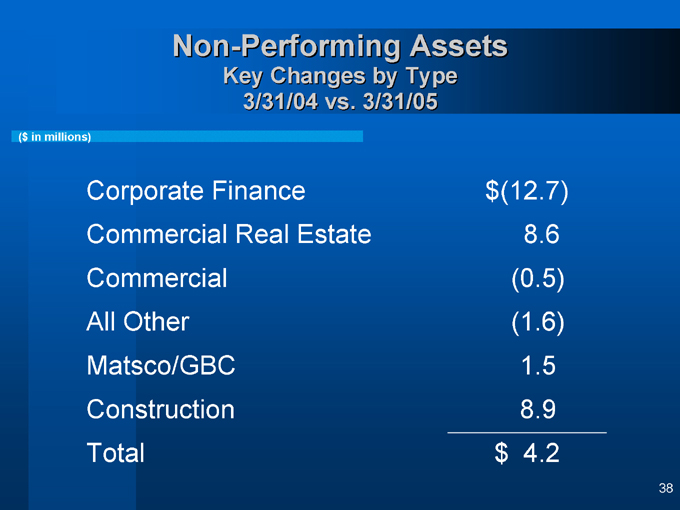
Non-Performing Assets
Key Changes by Type 3/31/04 vs. 3/31/05
($ in millions)
Corporate Finance $(12.7)
Commercial Real Estate 8.6
Commercial (0.5)
All Other (1.6)
Matsco/GBC 1.5
Construction 8.9
Total $4.2
38
Strong Financial Indicators
39
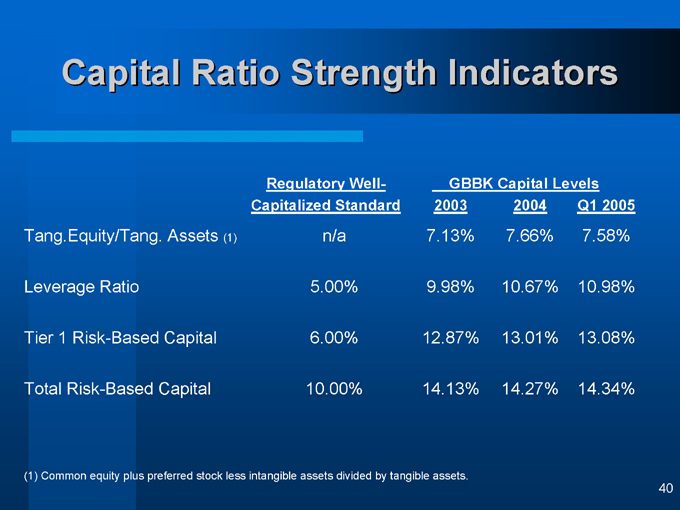
Capital Ratio Strength Indicators
Regulatory Well- GBBK Capital Levels
Capitalized Standard 2003 2004 Q1 2005
Tang.Equity/Tang. Assets (1) n/a 7.13% 7.66% 7.58%
Leverage Ratio 5.00% 9.98% 10.67% 10.98%
Tier 1 Risk-Based Capital 6.00% 12.87% 13.01% 13.08%
Total Risk-Based Capital 10.00% 14.13% 14.27% 14.34%
(1) Common equity plus preferred stock less intangible assets divided by tangible assets.
40
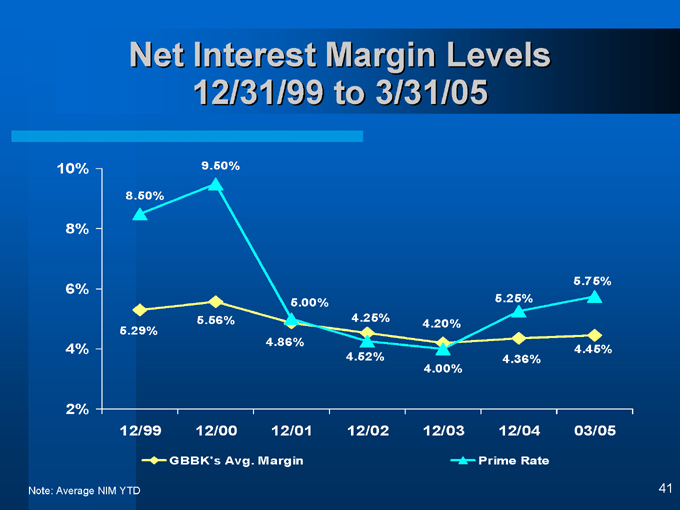
Net Interest Margin Levels 12/31/99 to 3/31/05
10% 8% 6% 4% 2%
8.50%
9.50%
5.00%
4.25%
4.20%
5.25%
5.75%
5.29%
5.56%
4.86%
4.52%
4.00%
4.36%
4.45%
12/99 12/00 12/01 12/02 12/03 12/04 03/05
GBBK’s Avg. Margin
Prime Rate
Note: Average NIM YTD
41
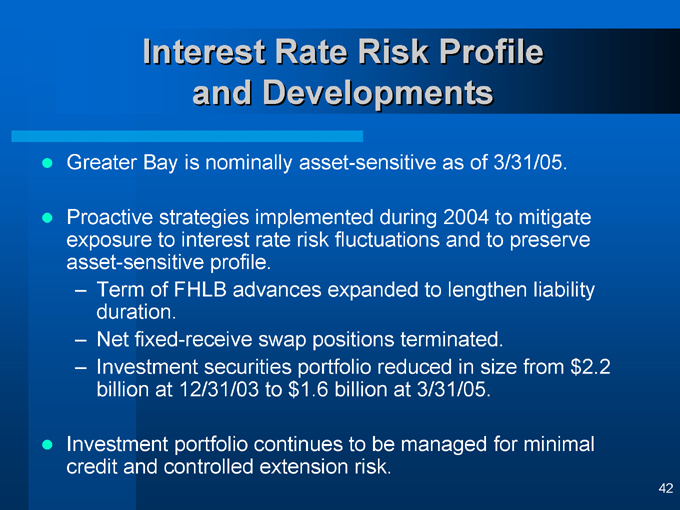
Interest Rate Risk Profile and Developments
Greater Bay is nominally asset-sensitive as of 3/31/05.
Proactive strategies implemented during 2004 to mitigate exposure to interest rate risk fluctuations and to preserve asset-sensitive profile.
Term of FHLB advances expanded to lengthen liability duration.
Net fixed-receive swap positions terminated.
Investment securities portfolio reduced in size from $2.2 billion at 12/31/03 to $1.6 billion at 3/31/05.
Investment portfolio continues to be managed for minimal credit and controlled extension risk.
42
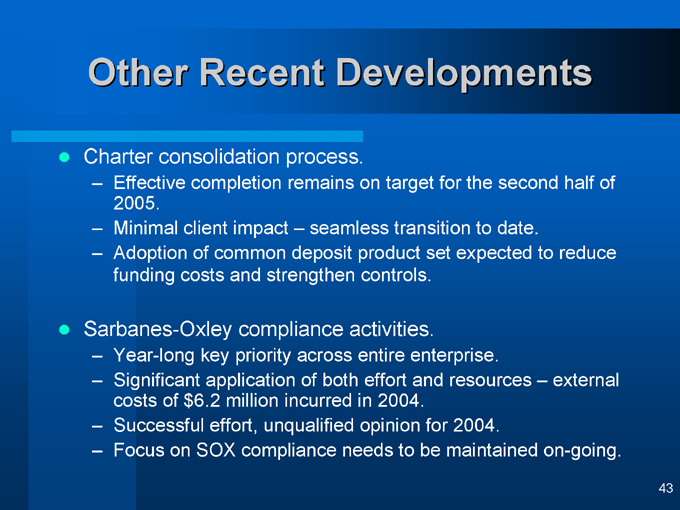
Other Recent Developments
Charter consolidation process.
Effective completion remains on target for the second half of 2005.
Minimal client impact – seamless transition to date.
Adoption of common deposit product set expected to reduce funding costs and strengthen controls.
Sarbanes-Oxley compliance activities.
Year-long key priority across entire enterprise.
Significant application of both effort and resources – external costs of $6.2 million incurred in 2004.
Successful effort, unqualified opinion for 2004.
Focus on SOX compliance needs to be maintained on-going.
43
Other Recent Developments
IRS Notice of Proposed Adjustment (NPA).
Received in November 2004 – challenged deductibility of merger-related expenses of $34 million taken in 2000 and 2001.
Extensive internal analysis undertaken with assistance of outside advisors and legal counsel.
Based upon that analysis and input from advisors, no tax expense related to this matter was required for 2004 or Q1 2005.
Cooperative conversations continue with IRS – final resolution currently anticipated prior to year-end 2005.
44
Other Recent Developments
Outstanding contingent convertible debt (“CODES”).
In mid-November 2004, GBBK announced its intention to exchange existing CODES to address impact of EITF 04-8 on EPS calculations.
Exchange was delayed as a result of IRS NPA. In February 2005, GBBK announced termination of exchange plan as consequence of:
Changes in interest rate environment and GBBK stock price.
Probability of March 2006 put exercise by CODES investors.
Relative cost of exchange process.
45
Other Recent Developments
Retirement of directors.
In February 2005, the Company announced the retirement of seven directors.
Reducing the Board from 19 to 12 directors. Orderly and logical consequence of charter consolidation action.
Determined by Board’s governance process to result in more effective, efficient, and cost-sensitive operation.
And consistent with national trends in this area.
46
Quality Management
47
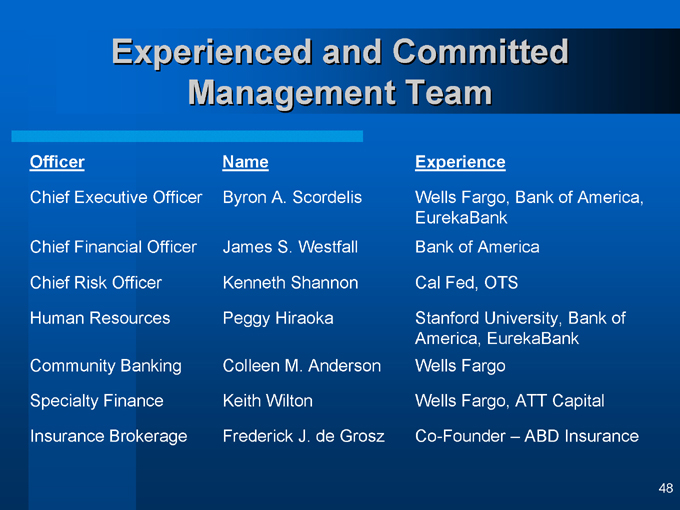
Experienced and Committed Management Team
Officer Name Experience
Chief Executive Officer Byron A. Scordelis Wells Fargo, Bank of America, EurekaBank
Chief Financial Officer James S. Westfall Bank of America
Chief Risk Officer Kenneth Shannon Cal Fed, OTS
Human Resources Peggy Hiraoka Stanford University, Bank of America, EurekaBank
Community Banking Colleen M. Anderson Wells Fargo
Specialty Finance Keith Wilton Wells Fargo, ATT Capital
Insurance Brokerage Frederick J. de Grosz Co-Founder – ABD Insurance
48

Focus on the Future
49
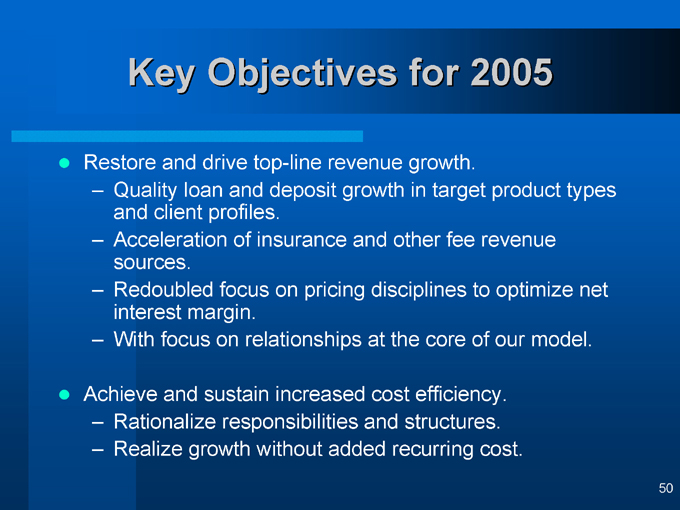
Key Objectives for 2005
Restore and drive top-line revenue growth.
Quality loan and deposit growth in target product types and client profiles.
Acceleration of insurance and other fee revenue sources.
Redoubled focus on pricing disciplines to optimize net interest margin.
With focus on relationships at the core of our model.
Achieve and sustain increased cost efficiency.
Rationalize responsibilities and structures. Realize growth without added recurring cost.
50
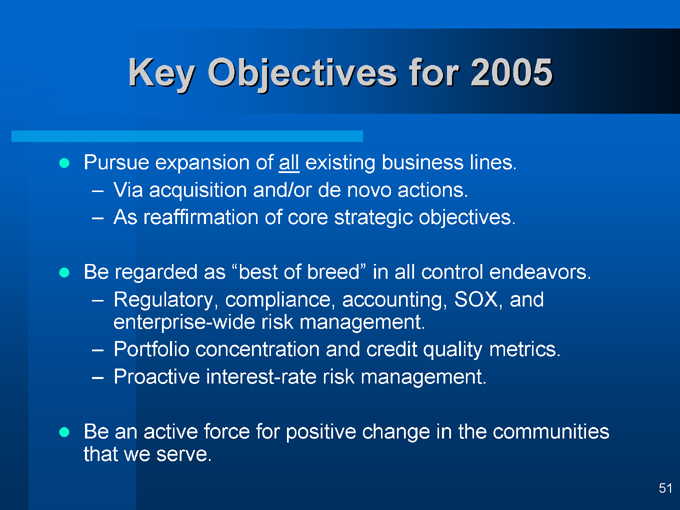
Key Objectives for 2005
Pursue expansion of all existing business lines.
Via acquisition and/or de novo actions. As reaffirmation of core strategic objectives.
Be regarded as “best of breed” in all control endeavors.
Regulatory, compliance, accounting, SOX, and enterprise-wide risk management.
Portfolio concentration and credit quality metrics. Proactive interest-rate risk management.
Be an active force for positive change in the communities that we serve.
51
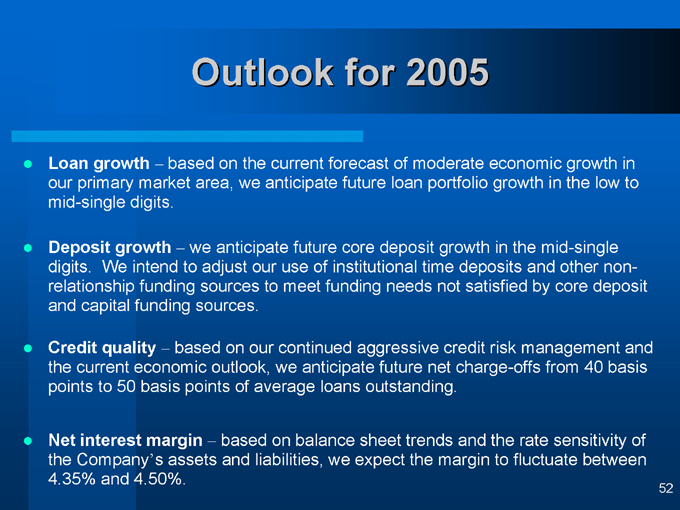
Outlook for 2005
Loan growth – based on the current forecast of moderate economic growth in our primary market area, we anticipate future loan portfolio growth in the low to mid-single digits.
Deposit growth – we anticipate future core deposit growth in the mid-single digits. We intend to adjust our use of institutional time deposits and other non-relationship funding sources to meet funding needs not satisfied by core deposit and capital funding sources.
Credit quality – based on our continued aggressive credit risk management and the current economic outlook, we anticipate future net charge-offs from 40 basis points to 50 basis points of average loans outstanding.
Net interest margin – based on balance sheet trends and the rate sensitivity of the Company’s assets and liabilities, we expect the margin to fluctuate between 4.35% and 4.50%.
52

Focus on Shareholder Value
53
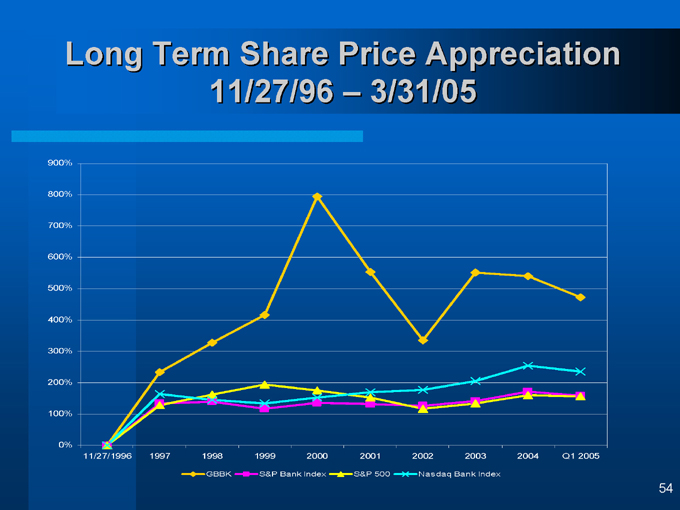
Long Term Share Price Appreciation 11/27/96 – 3/31/05
900% 800% 700% 600% 500% 400% 300% 200% 100%
0%
11/27/1996 1997 1998 1999 2000 2001 2002 2003 2004 Q1 2005
GBBK
S&P Bank Index
S&P 500
Nasdaq Bank Index
54

Appendix
55
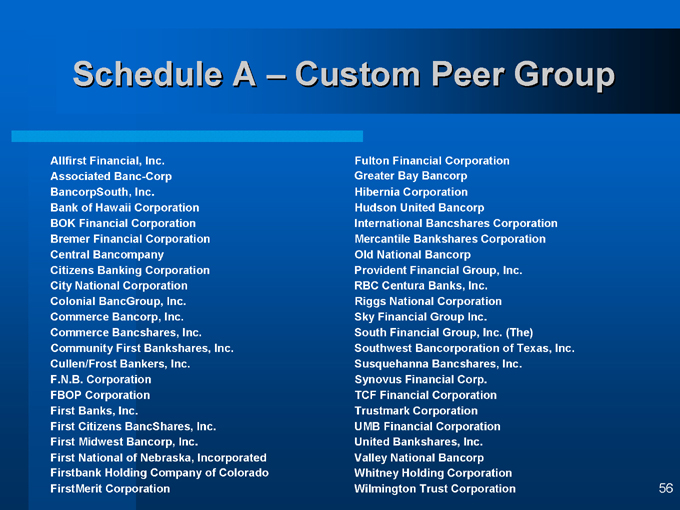
Schedule A – Custom Peer Group
Allfirst Financial, Inc.
Associated Banc-Corp
BancorpSouth, Inc.
Bank of Hawaii Corporation BOK
Financial Corporation Bremer
Financial Corporation Central
Bancompany Citizens
Banking Corporation City National Corporation Colonial
BancGroup, Inc. Commerce Bancorp, Inc. Commerce
Bancshares, Inc. Community First
Bankshares, Inc. Cullen/Frost
Bankers, Inc.
F.N.B. Corporation
FBOP Corporation First Banks, Inc.
First Citizens BancShares, Inc.
First Midwest Bancorp, Inc.
First National of Nebraska, Incorporated
Firstbank Holding Company of Colorado
FirstMerit Corporation
Fulton Financial Corporation
Greater Bay Bancorp
Hibernia Corporation
Hudson United Bancorp
International Bancshares Corporation
Mercantile Bankshares Corporation
Old National Bancorp
Provident Financial Group, Inc.
RBC Centura Banks, Inc.
Riggs National Corporation
Sky Financial Group Inc.
South Financial Group, Inc. (The)
Southwest Bancorporation of Texas, Inc.
Susquehanna Bancshares, Inc.
Synovus Financial Corp.
TCF Financial Corporation
Trustmark Corporation
UMB Financial Corporation
United Bankshares, Inc.
Valley National Bancorp
Whitney Holding Corporation
Wilmington Trust Corporation
56
Greater Bay Bancorp
57