Exhibit 99.1
Slide Presentation of Greater Bay Bancorp as of June 30, 2006
    1 Greater Bay Bancorp Greater Bay Bancorp Investor Presentation Investor Presentation September 2006 September 2006 |
    2 Greater Bay Bancorp Greater Bay Bancorp Certain matters discussed in this presentation constitute forward-looking statements within the meaning of the Private Securities Litigation Reform Act of 1995. These forward looking statements relate to the Company’s current expectations regarding future operating results, net interest margin, net loan charge-offs, asset quality, level of loan loss reserves, growth in loans and deposits and the strength of the local economy. These forward looking statements are subject to certain risks and uncertainties that could cause the actual results, performance or achievements to differ materially from those expressed, suggested or implied by the forward looking statements. These risks and uncertainties include, but are not limited to: (1) the impact of changes in interest rates, a decline in economic conditions at the local, national and international levels and increased competition among financial service providers on the Company’s results of operations and the quality of the Company’s earning assets; (2) government regulation, including ABD’s receipt of requests for information from state insurance commissioners and subpoenas from state attorneys general related to the ongoing insurance industry-wide investigations into contingent commissions and override payments; and (3) the other risks set forth in the Company‘s reports filed with the Securities and Exchange Commission, including its Annual Report on Form 10-K for the year ended December 31, 2005. Greater Bay does not undertake, and specifically disclaims, any obligation to update any forward- looking statements to reflect occurrences or unanticipated events or circumstances after the date of such statements. |
    3 Company Profile Company Profile As of June 30, 2006 As of June 30, 2006 $4.5 billion Core Loans (1) 1.41% / 14.3% Q2 ROA / ROCE $1.5 billion Market Capitalization (3) $712 million Common Equity 50.9 million Common Shares Outstanding $0.46 Q2 Diluted EPS $25.1 million Q2 Net Income $4.3 billion Core Deposits (2) $7.4 billion Total Assets (1) Excludes purchased whole loans (2) Excludes brokered and wholesale institutional deposits (3) As of August 15, 2006 |
    4 Investment Rationale Investment Rationale • Largest independent banking franchise in Northern California operating in lucrative San Francisco Bay Area regional market. • Proven record of organic growth. • Established track record as acquirer of choice. • Diversified provider of financial services in three distinct business areas. • Mitigates geographic and sector-specific concentrations. • Balanced spread and fee revenue mix. |
    5 Investment Rationale Investment Rationale • Strong financial fundamentals and sound credit metrics. • Experienced and proven executive management team. • Leading to long-term record of superior shareholder return. |
    6 An Exceptional Regional Market An Exceptional Regional Market |
   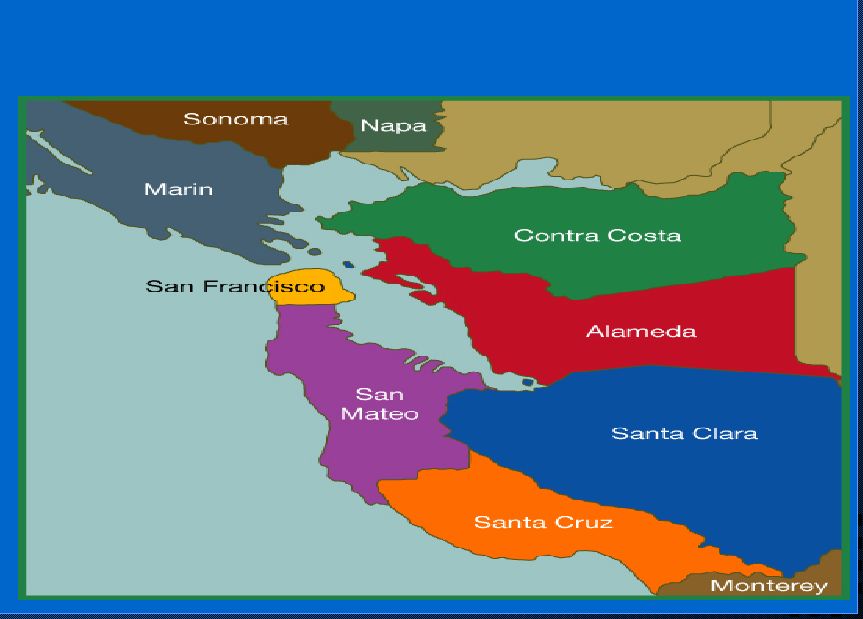 7 Greater San Francisco Bay Area Greater San Francisco Bay Area |
    8 Greater San Francisco Bay Area Profile Greater San Francisco Bay Area Profile • Recognized global leadership in technological innovation, advancement, and growth. • Unmatched concentration of venture capital funding and investment. • Entrepreneurial spirit and results-oriented ethic. • Highest levels of worker productivity and per capita income in the nation. • Highest level of workforce education in the nation. • Exceptionally strong international trade position. |
    9 Diversified Financial Services Diversified Financial Services Provider Provider |
    10 Diversified Financial Services Provider Diversified Financial Services Provider Greater Bay Bancorp Community Banking Loans of $3.0 billion Core deposits of $4.2 billion 8 distinct community bank brands 41 offices Relationship based Centralized operations, international and cash management support Bay Area in scope Assets of $1.6 billion Commercial finance to health care businesses Small ticket leasing Factoring and asset based lending SBA lending National in scope Annual premiums of $2.2 billion 2005 annual revenues of $154 million * Offering P&C and D&O, employee benefits, risk management services No underwriting risk Western U.S. in scope Specialty Finance Insurance Brokerage *Includes Lucini/Parish which was acquired May 2005. |
    11 Community Banking Community Banking |
    12 Community Banking Business Community Banking Business • Operating 8 separate banking identities under single consolidated charter – 41 office locations throughout the Greater Bay Area. • Common data processing platform, credit policies and operating procedures – served and supported by single administrative staff. • Relationship focused: • Loans: Commercial ($500M-5MM), CRE ($1-10MM), and construction ($1-10MM). • Deposits: Full suite of business and personal products. • Local people in local markets making local decisions based upon local knowledge. |
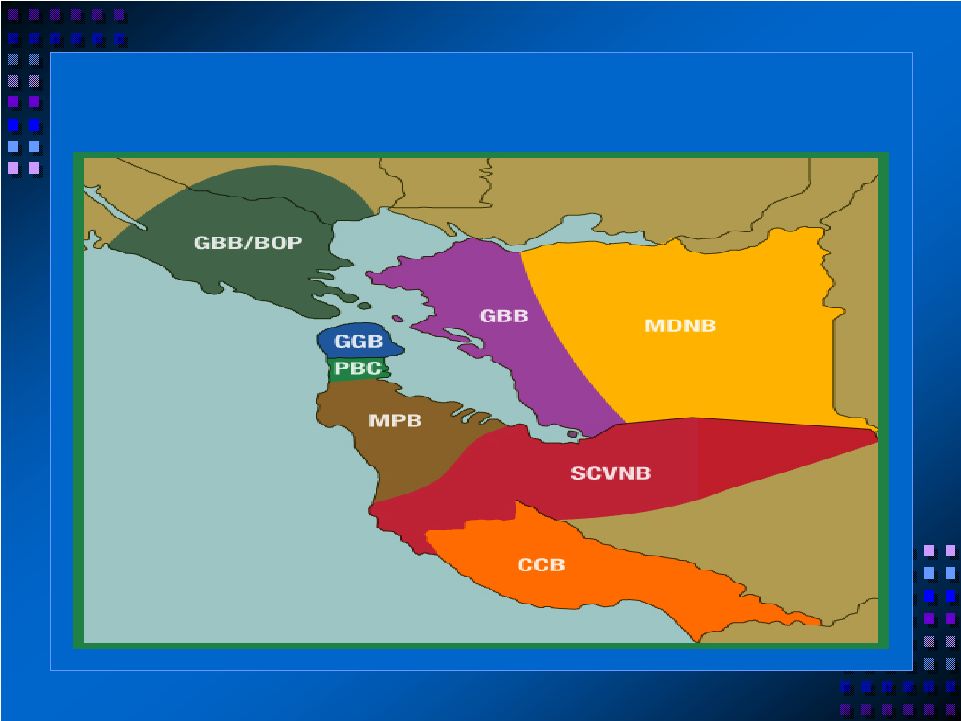 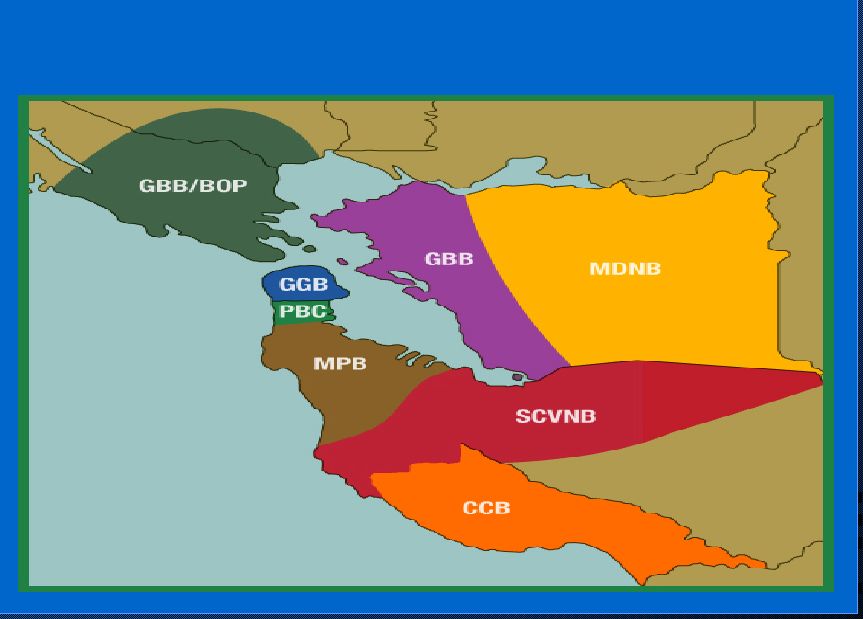   13 Community Banking Footprint Community Banking Footprint |
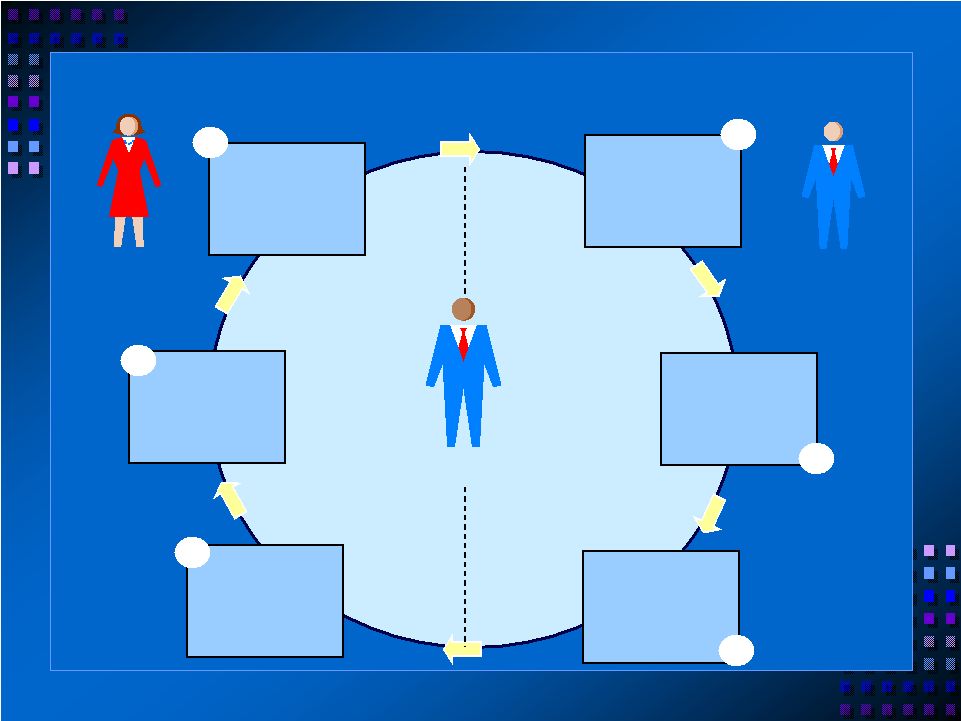    14 Client-Centric Banking Model Client-Centric Banking Model Install Sell Service Craft Locate and Diagnose 1 5 4 2 3 Client Link and Build 6 Relationship Management Business Development |
    15 Business Development Group Initiatives Business Development Group Initiatives • Proven executive hired in Q4 2005 to build & manage team. • Fourteen proven BDOs recruited to date. • Top performers from two major local competitors. • Virtually all BDOs from large banks. • Targeted to grow to 15 by year-end. • Each BDO expected to generate $20MM in annual loan/line commitments and related deposit business. • Commercial and owner-occupied CRE in nature. • Target size of $1-6 MM per commitment. |
 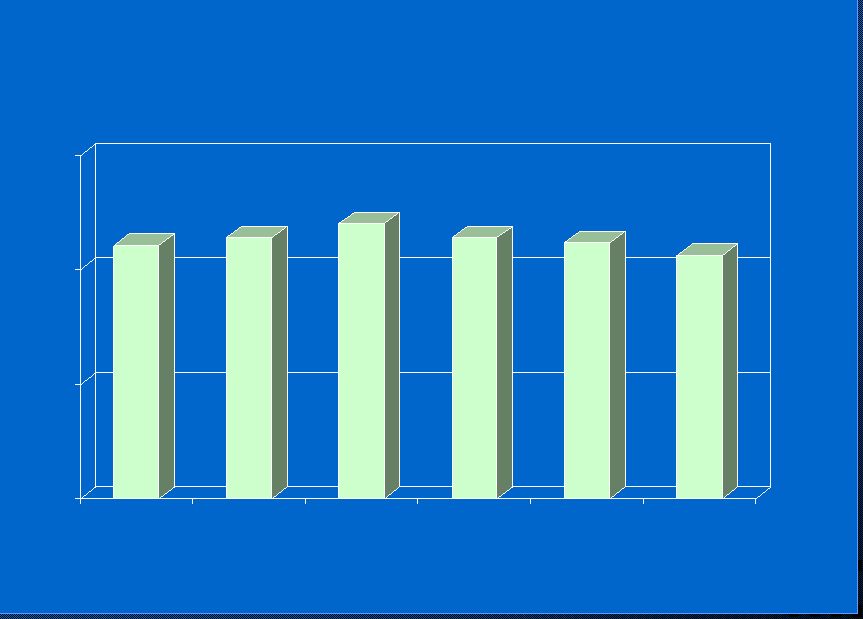   16 Core Deposit Balances Core Deposit Balances (1) (1) $4.43 $4.56 $4.81 $4.56 $4.47 $4.25 $0 $2 $4 $6 2002 2003 2004 2005 Q1 '06 Q2 '06 ($ in Billions) (1) Core deposits exclude brokered and wholesale institutional deposits. |
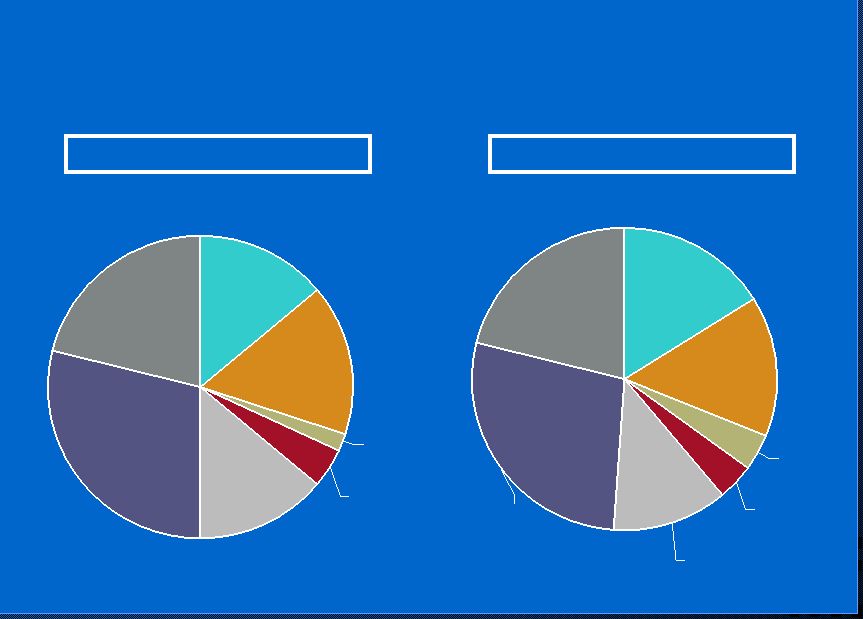
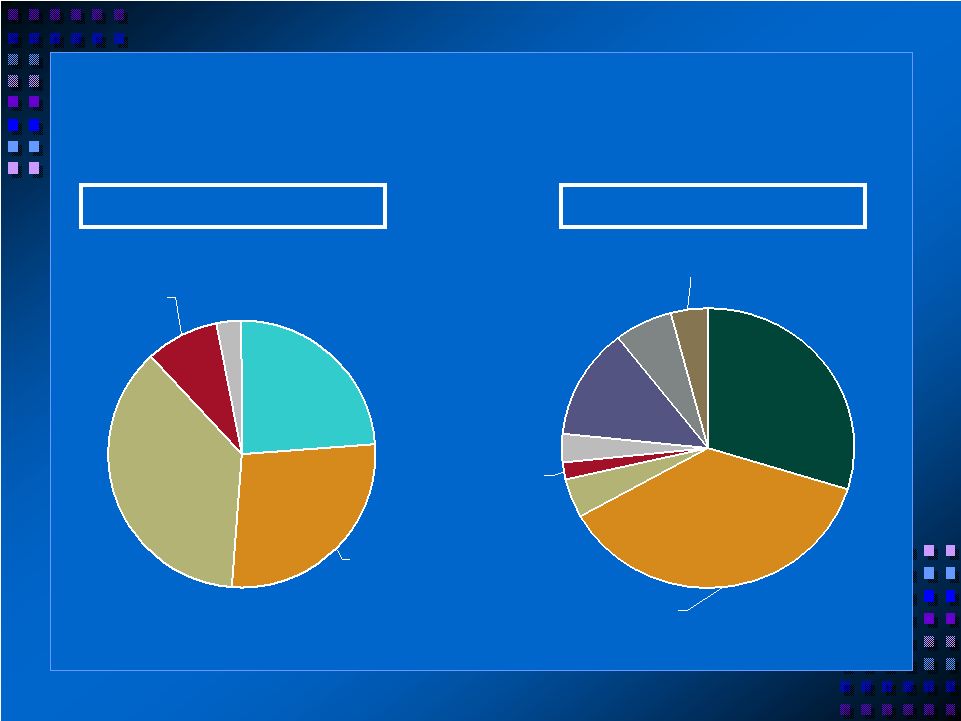 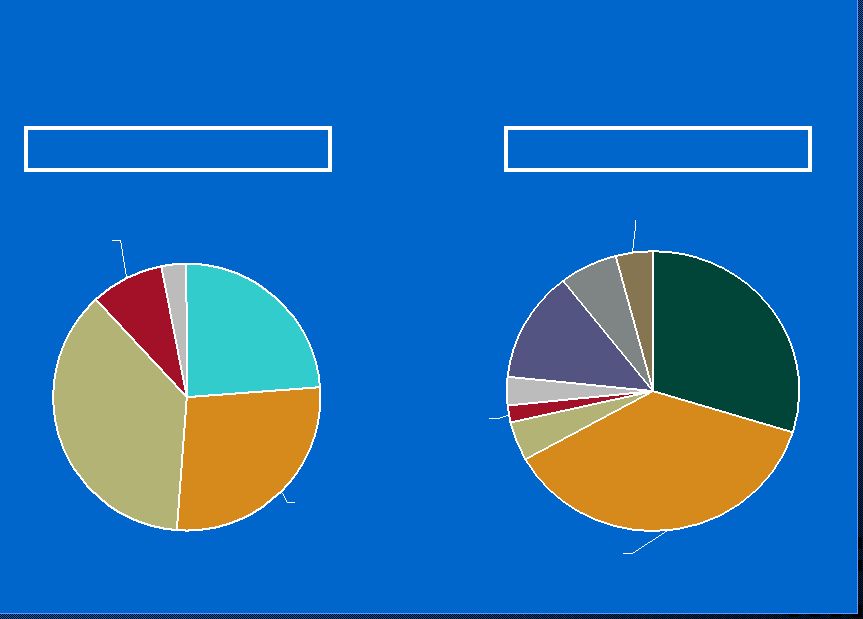   17 (1) Core deposits exclude brokered and wholesale institutional deposits. By Region By Type Demand 24% MMDAs 37% Savings & NOW 27% Other Time Deposits 3% Time Deposits >$100 9% San Mateo 30% Contra Costa 13% Sonoma 4% Santa Clara 38% Santa Cruz & Monterey 6% Alameda 3% Marin 2% San Francisco 4% Community Banking Core Deposits Community Banking Core Deposits (1) (1) June 30, 2006 June 30, 2006 |
    18 Restrained Core Deposit Pricing Restrained Core Deposit Pricing -1% 0% 1% 2% 3% 4% 5% Dec '03 Dec '04 Dec '05 Jun '06 Interest Bearing Core Deposit Cost LIBOR Cumulative Rate Change |
    19 Specialty Finance Specialty Finance |
    20 Specialty Finance Business Specialty Finance Business • Collection of discrete businesses focused on acquisition and servicing/sale of value-based assets where execution, efficiency, standardization, and productivity are essential to optimizing profitability. • Transaction rather than relationship-based. • Relationships essentially limited to intermediaries who source the business (dealers, distributors, etc.). • Mandate to compete at high end of credit quality spectrum. • No deviation from target borrower – very disciplined. • Intense focus on perpetual growth of credit risk knowledge and on automation-based underwriting as core strategic elements. |
    21 Total Assets: $1.6 billion Professional dental and veterinary term commercial financing National in scope Matsco Small-ticket leasing National in scope Greater Bay Capital Factoring and asset- based lending National in scope Greater Bay Business Funding 504 and 7(A) business sourced direct and via community banks Regional in scope SBA Lending Start-up venture aimed at brokering or retaining high quality SFD REL Regional in scope Residential Mortgage Lending Specialty Finance Group |
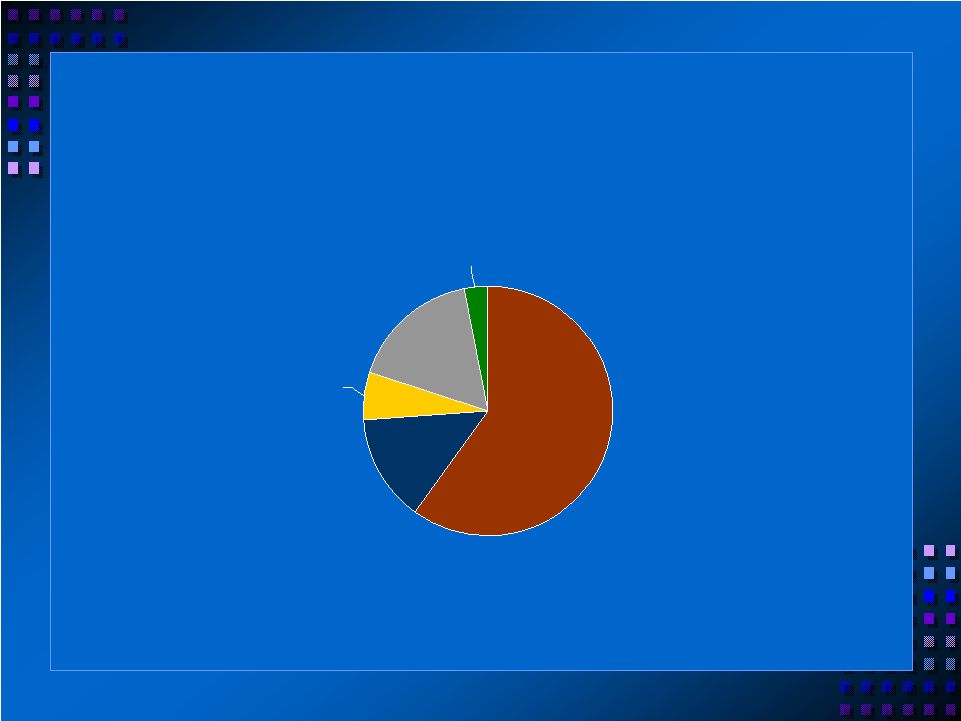  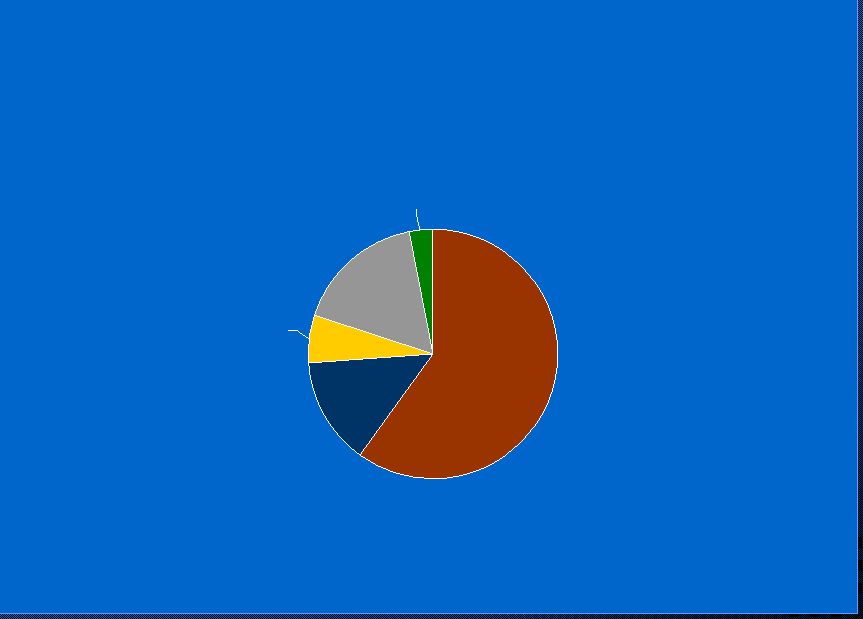  22 Specialty Finance Group Specialty Finance Group Loan Portfolio Composition Loan Portfolio Composition June 30, 2006 June 30, 2006 (1) Excludes operating lease totals of $56.7 million at 06/30/06. Matsco 60% Greater Bay Capital (1) 14% SBA Lending 17% Residential Mortgage 3% Greater Bay Business Funding 6% |
    23 Credit Portfolio Profile Credit Portfolio Profile |
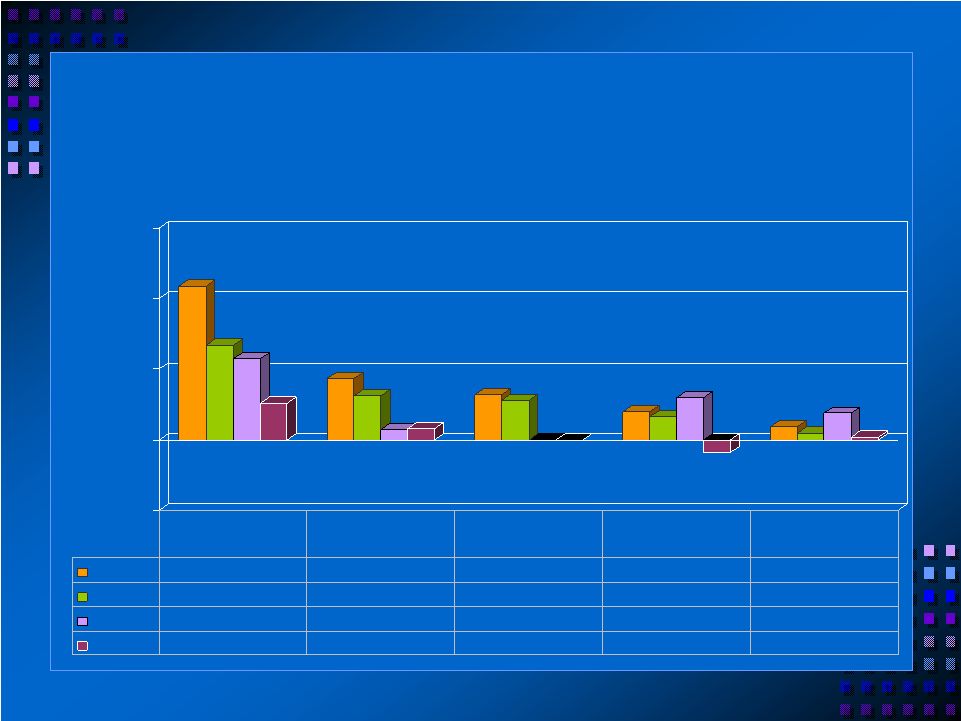
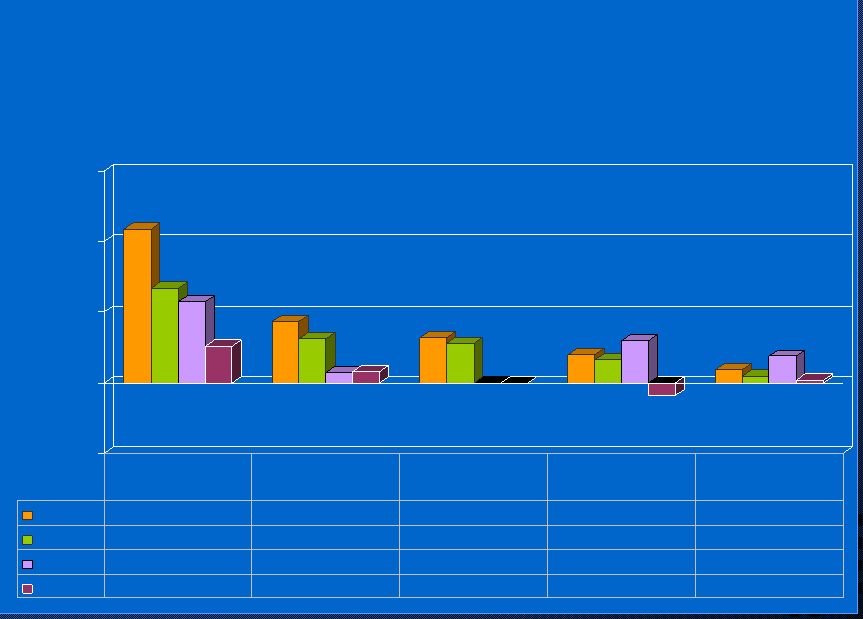
    24 Core Loan Portfolio Composition Core Loan Portfolio Composition Combined Community Banking and Specialty Finance Combined Community Banking and Specialty Finance ($ in Billions) $- $1 $2 $3 $4 $5 2001 2002 2003 2004 2005 Q2 2006 Commercial-Term RE Construction and Land Commercial - Community Banking Commercial-Specialty Finance SNC/Residential/All Other $4.51 $4.81 $4.55 $4.47 $4.50 $4.56 14% 13% 26% 16% 31% 11% 17% 24% 15% 33% 10% 19% 23% 12% 36% 9% 23% 22% 11% 36% 9% 26% 20% 14% 31% 8% 29% 16% 17% 29% |
    25 -400 -200 0 200 400 Dec-03 Jun-04 Dec-04 Jun-05 Dec-05 Jun-06 Commercial - Term RE Construction and Land Commercial - Community Banking Commercial - Specialty Finance Total Loans * Core Loan Portfolio Evolution Core Loan Portfolio Evolution Combined Community Banking and Specialty Finance Combined Community Banking and Specialty Finance (Cumulative Change Since December 2003) (Cumulative Change Since December 2003) ($ in Millions) * Total Loans gross of deferred fees and discounts |
    26 Term Commercial Real Estate Loan Composition Term Commercial Real Estate Loan Composition June 30, 2006 June 30, 2006 Retail 22% Industrial 16% Self Storage 2% Office 35% Warehouse 6% Other 10% R&D 4% Hotel/Motel 5% San Mateo 11% Contra Costa 7% Marin 7% San Francisco 9% Santa Cruz 5% Sonoma 7% Monterey 2% Other 9% Alameda 15% Santa Clara 28% By Type By County Total - $1.3 Billion |
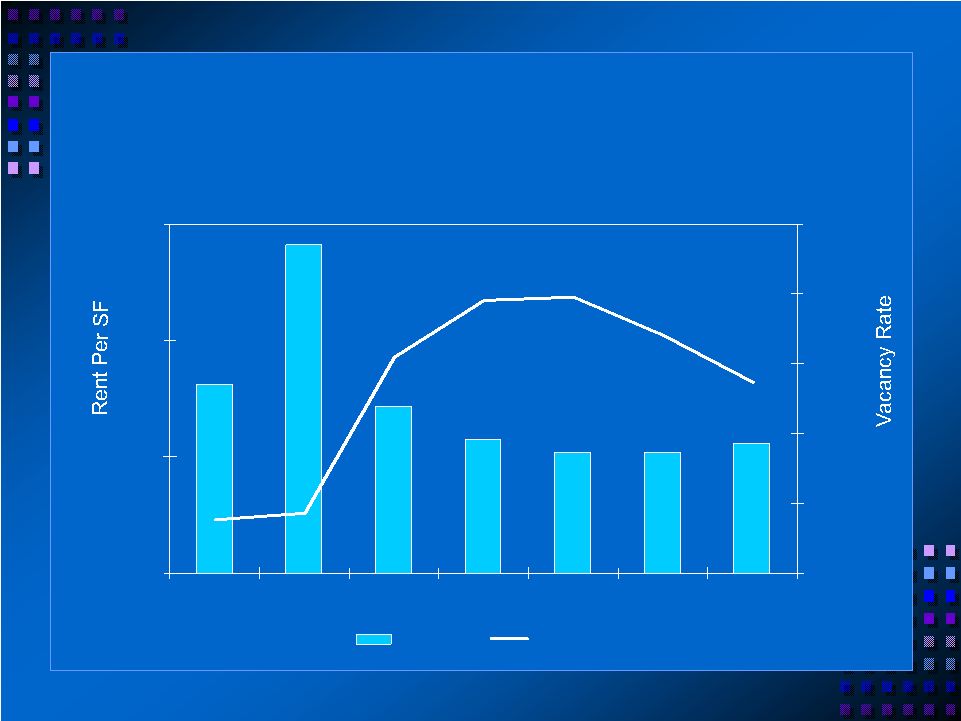 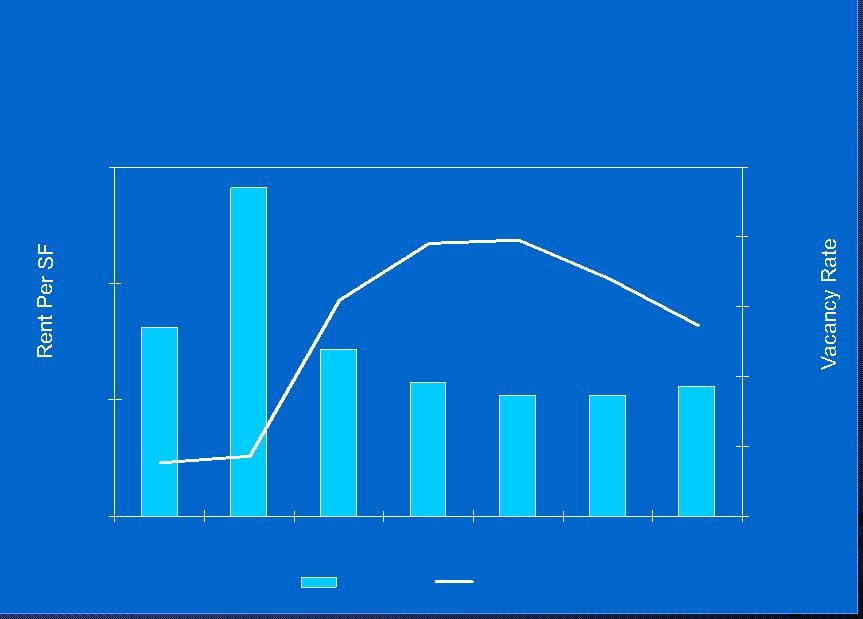   27 Bay Area Office Market Bay Area Office Market and Vacancy Trends and Vacancy Trends Source: BT Commercial $0 $2 $4 $6 1999 2000 2001 2002 2003 2004 2005 0% 5% 10% 15% 20% 25% Avg Rent Vacancy |
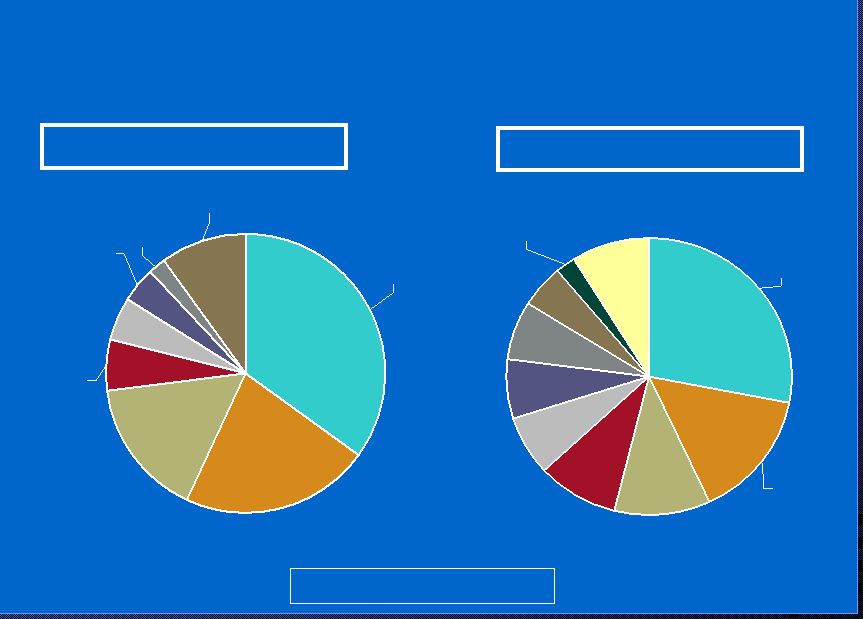
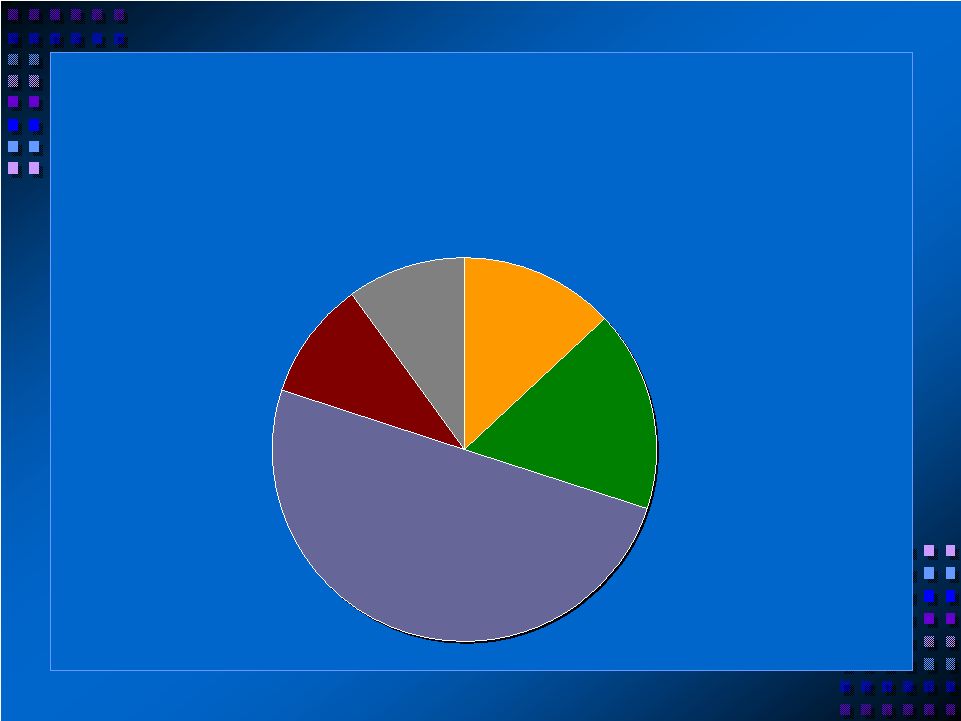
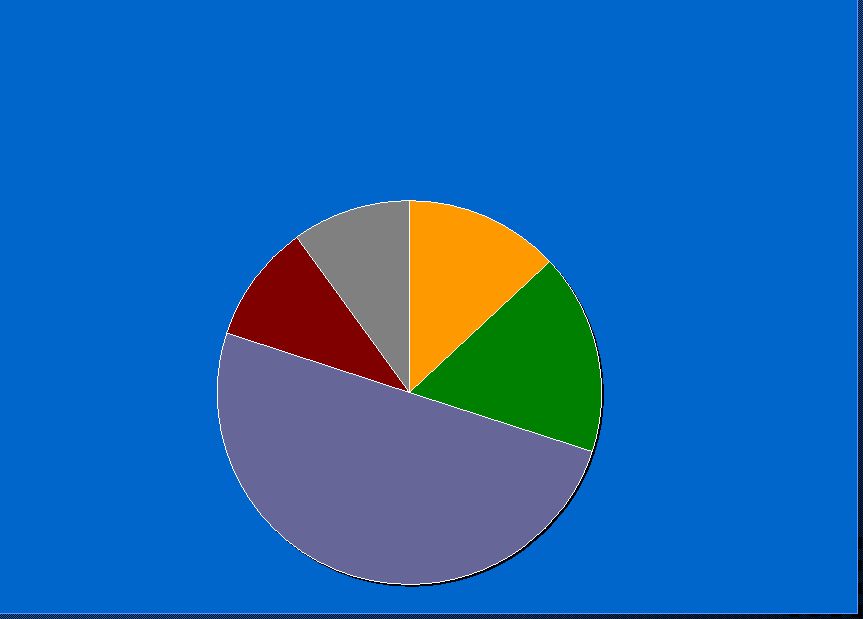
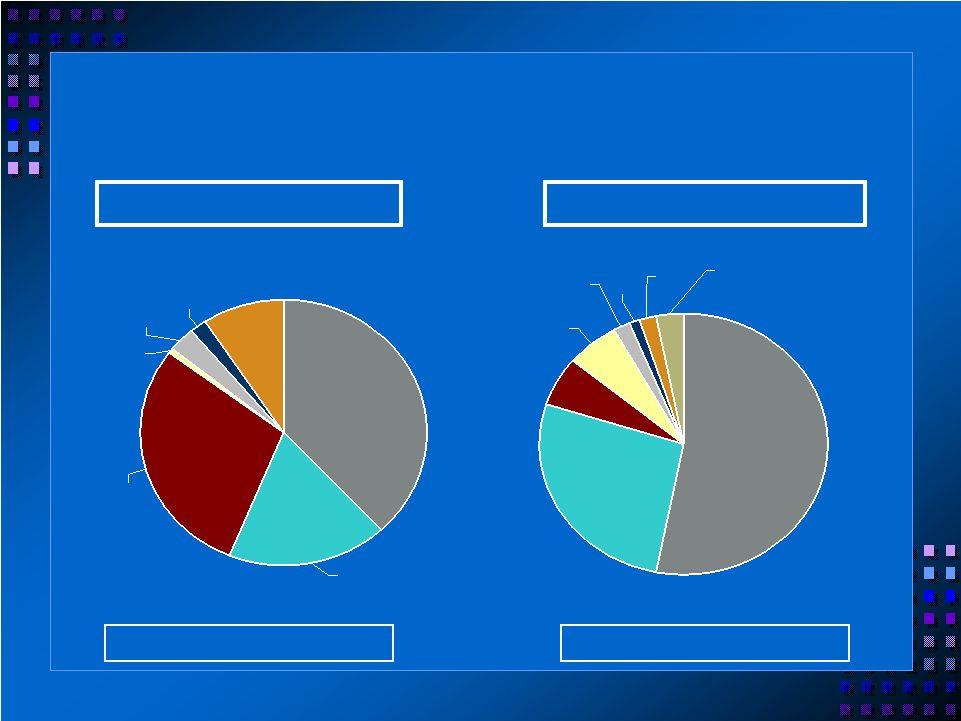 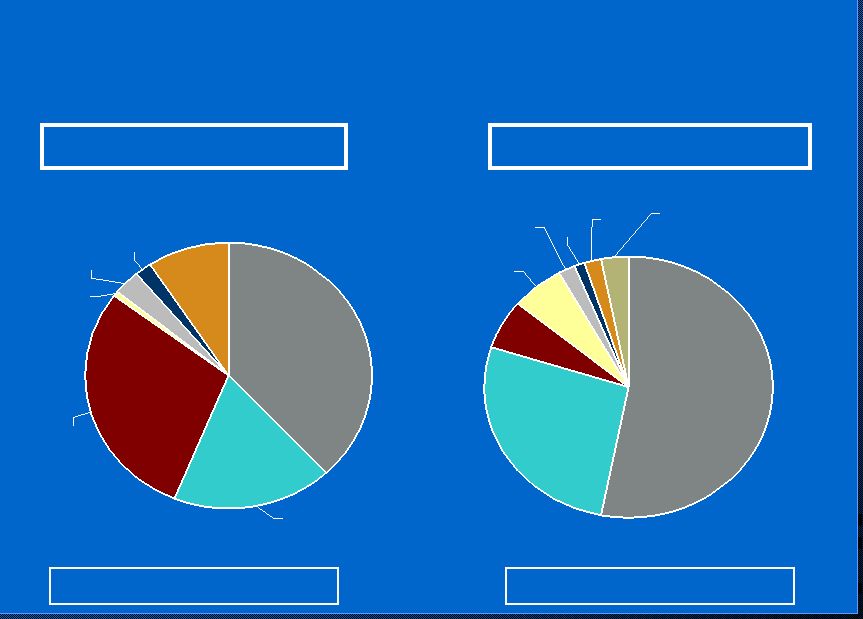   28 Construction Loan Portfolio Composition Construction Loan Portfolio Composition December 31, 2002 June 30, 2006 1-4 SFR 38% Multifamily 18% Office 29% Industrial 1% Self Storage 3% Retail 2% Other 9% Total - $557 Million Total - $612 Million 1-4 SFR 53% Multifamily 27% Office 6% Retail 6% Land 2% Self Storage 1% R&D 2% Other 3% |
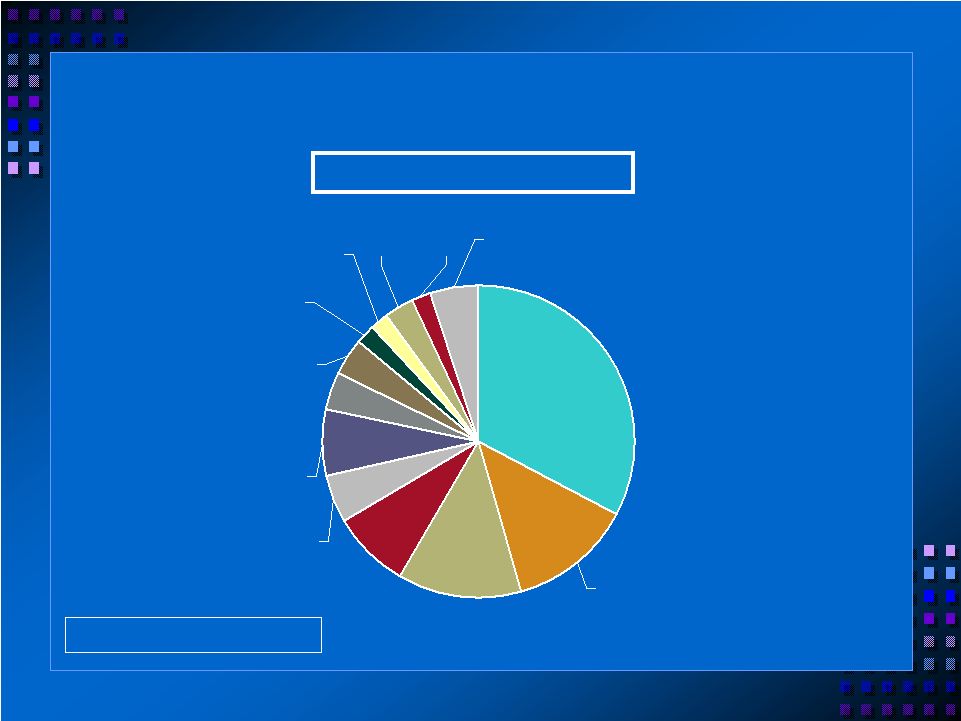 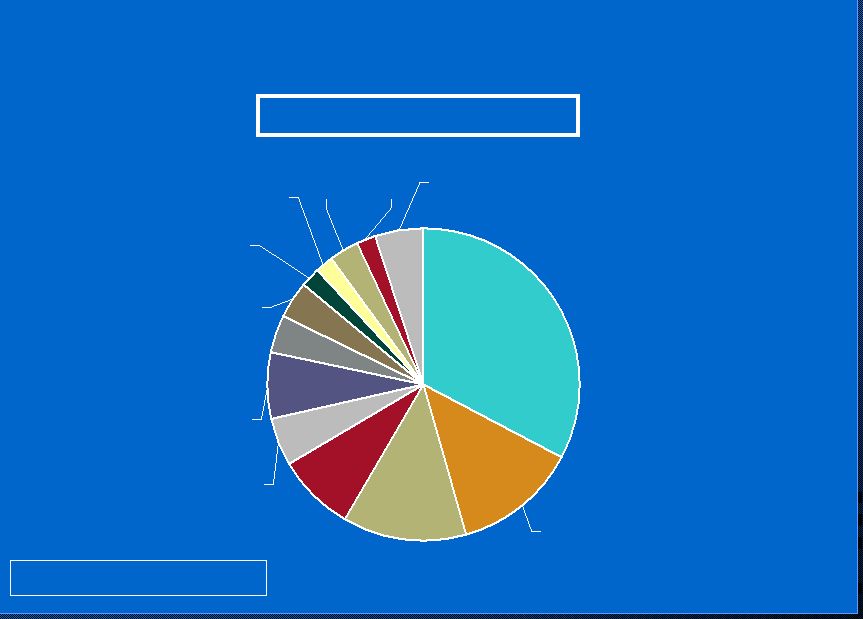   29 Construction Loan Portfolio Composition Construction Loan Portfolio Composition June 30, 2006 June 30, 2006 By County Santa Clara 32% San Francisco 13% San Mateo 13% Alameda 8% Santa Cruz 5% Contra Costa 7% Sacramento 4% San Diego 4% Other 5% Marin 2% Solano 3% Monterey 2% Sonoma 2% Total - $612 Million |
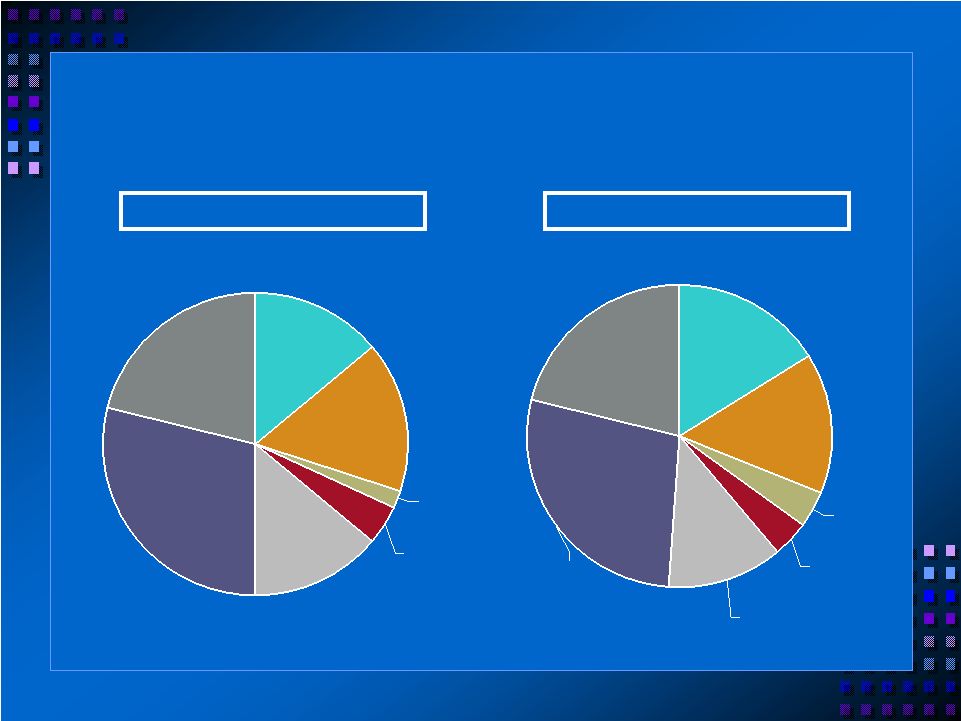
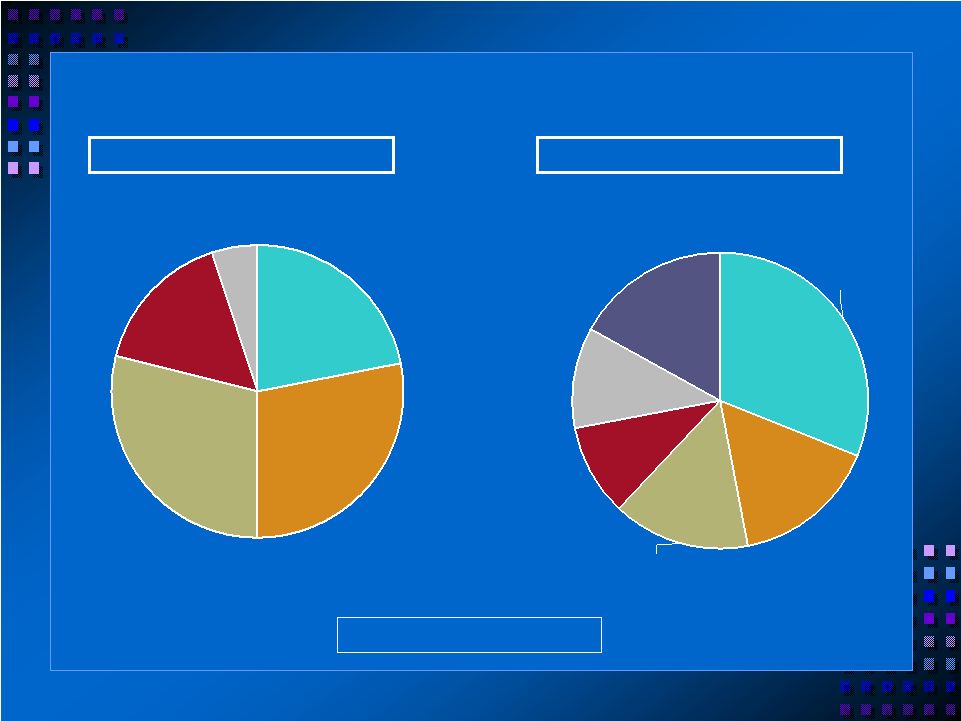    65-70% 29% < 60% 22% 70-75% 16% 60-65% 28% 75-80% 5% By LTV By Total Commitment Size Total - $751 Million 1-4 Family/Condo Construction Portfolio Commitments 1-4 Family/Condo Construction Portfolio Commitments June 30, 2006 June 30, 2006 $20-25MM 11% Over $25MM 17% Under $5MM 31% $15-20MM 10% $10-15MM 15% $5-10MM 16% 30 |
    31 Commercial Insurance Commercial Insurance Brokerage Brokerage |
    32 Commercial Insurance Services Business Commercial Insurance Services Business • Acquired ABD Insurance and Financial Services in March 2002 – a highly-respected provider of commercial insurance brokerage and risk management services. • Largest brokerage firm headquartered on the West Coast and 14 largest in the nation. • 4 largest bank-owned firm in the country. • Diversified property and casualty (65%) and employee benefit (35%) revenue streams. • Key strengths in technology, biotech, wine, construction, and agribusiness industry sectors. th th |
    33 • Strategic focus on disciplined expansion (via organic growth and acquisitions) into key western regional markets. • Leverage existing lines of business expertise – and to develop enhanced “provider-of-choice” branding and pricing positions. • Successful 2003 expansion into Seattle. • Completed acquisition of highly regarded Lucini/Parish firm in Nevada – May 1, 2005. Commercial Insurance Services Business Commercial Insurance Services Business |
    34 Bay Area Sacramento Reno Los Angeles/ Southern CA Seattle Additional Major Western Regional Markets ABD Insurance and Financial Services 2005 Commission & Fee Revenue: $154 million |
    35 ABD Geographic Distribution ABD Geographic Distribution % of 2005 Revenue % of 2005 Revenue Nevada Seattle Bay Area Southern CA/ Central Coast Sacramento 10% 10% 13% 17% 50% |
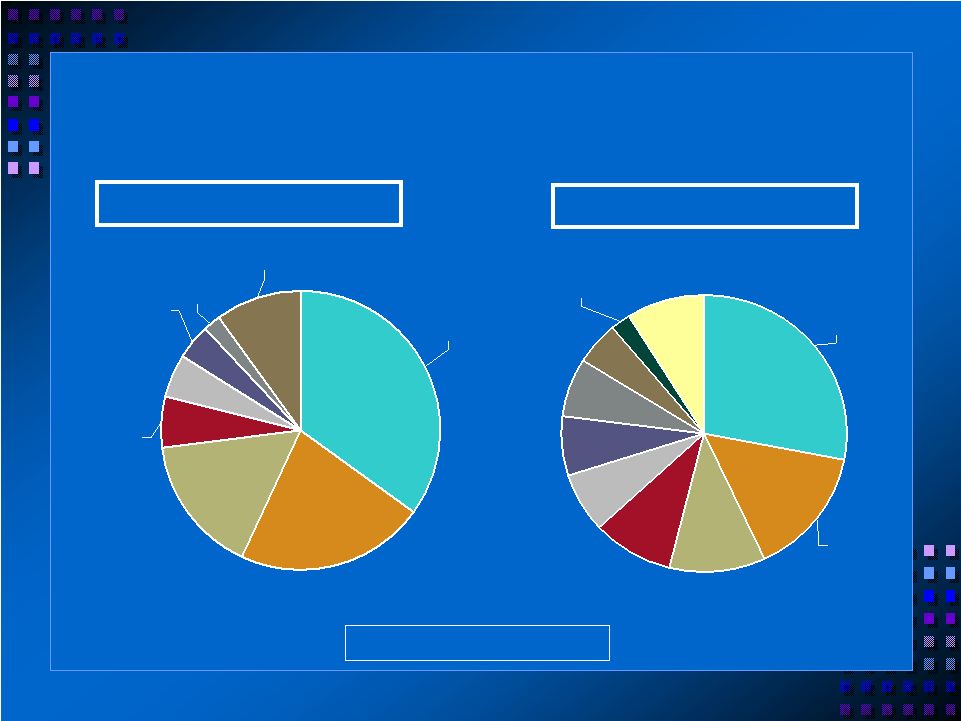
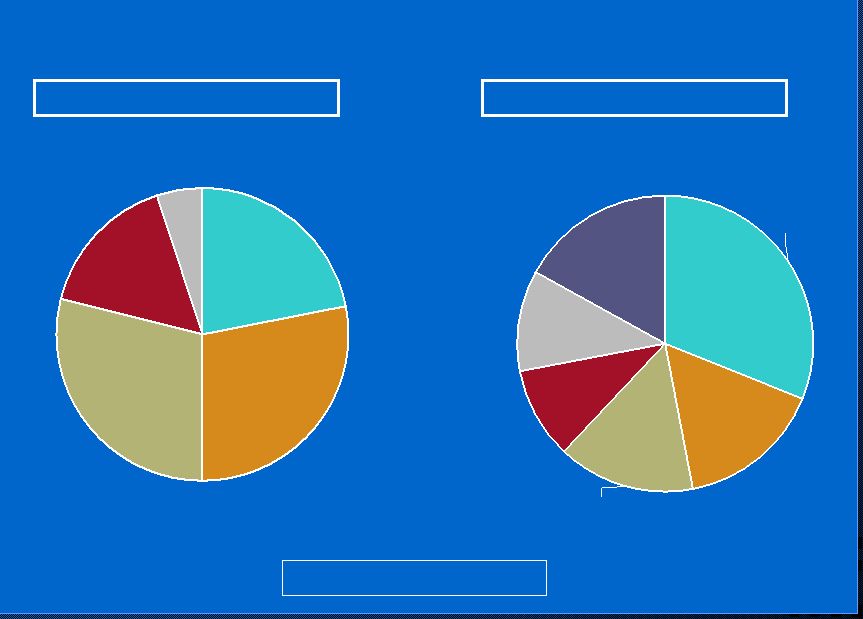
    36 ABD 2005 Revenue Distribution By Size of Client Relationship * ($ in 000’s) $25-50 14% $5-25 16% Over $75 2% $500-750 4% $250-500 14% $100-250 29% $50-100 21% Property and Casualty * Excludes relationships of less than $5,000 $5-25 15% Over $750 4% $500-750 4% $250-500 12% $100-250 28% $25-50 16% $50-100 21% Employee Benefits |
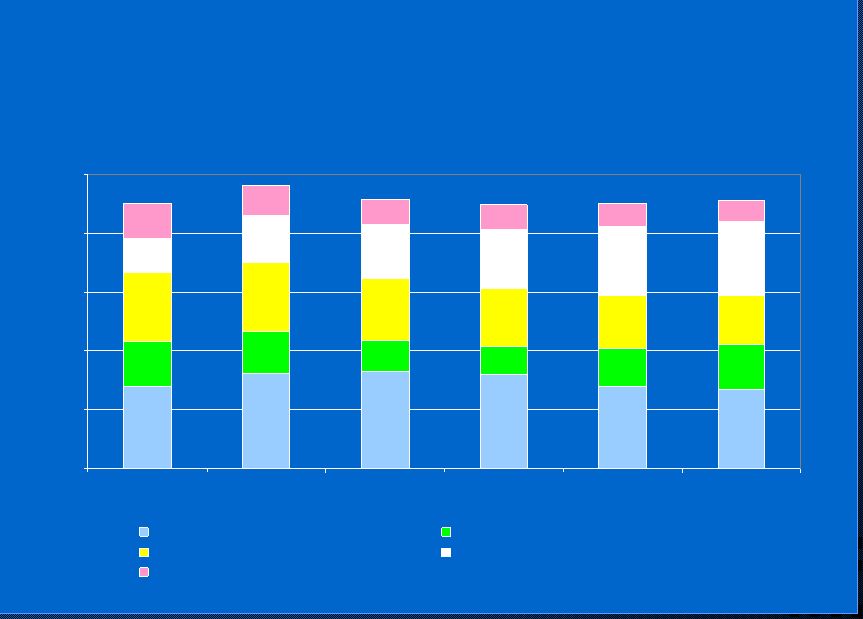
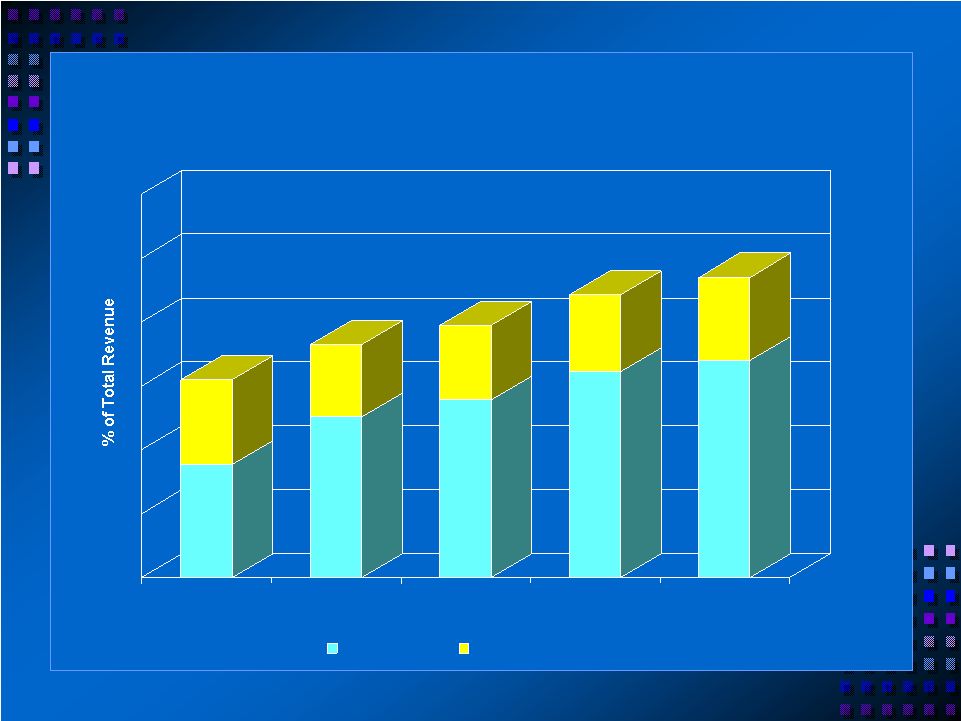   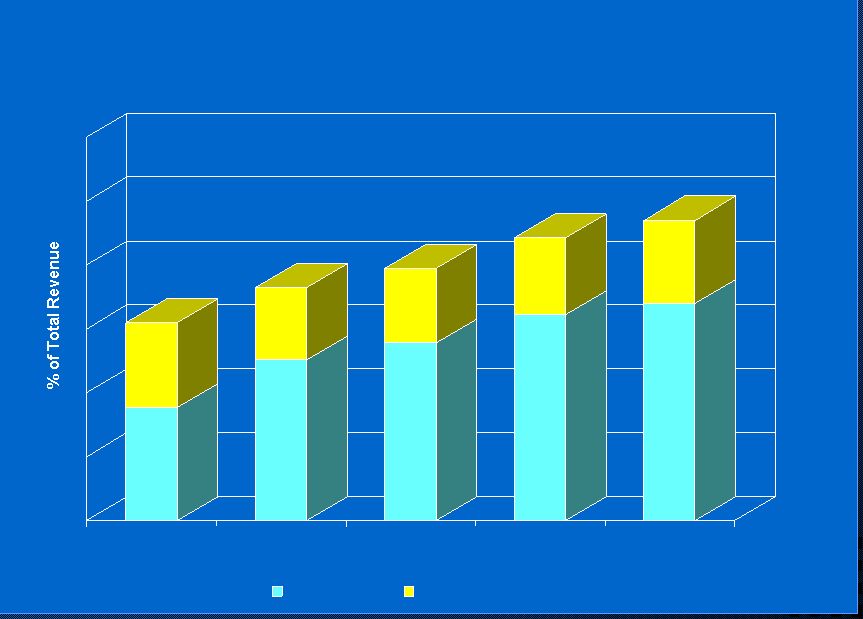 37 Increased Non-Interest Revenue Contribution Increased Non-Interest Revenue Contribution 18% 13% 25% 12% 28% 12% 32% 12% 34% 13% 2002 2003 2004 2005 YTD '06 ABD Other Fee-Based 40% 31% 37% 44% 47% |
    38 Sound Credit Metrics Sound Credit Metrics |
   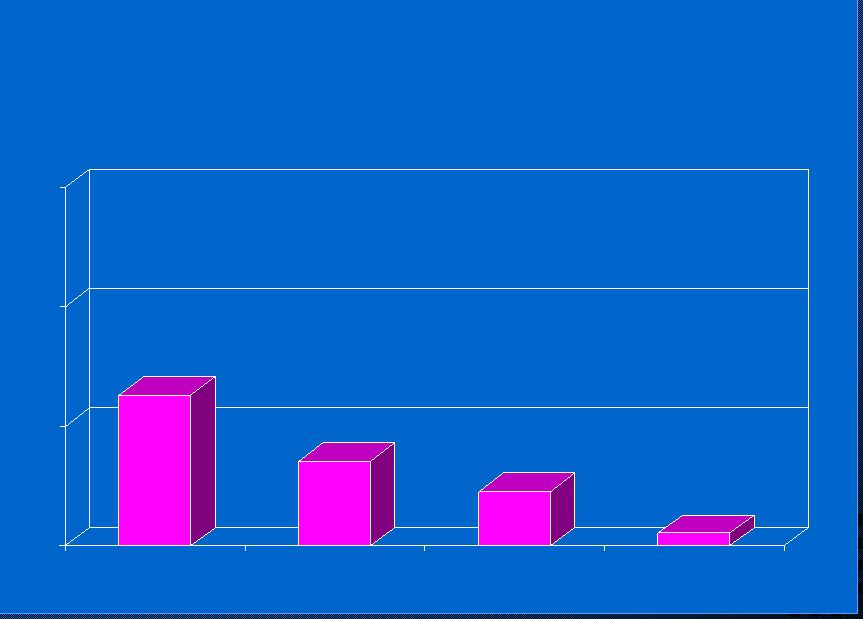 39 Net Charge-Offs Net Charge-Offs $31.6 $17.7 $11.3 $2.7 $0 $25 $50 $75 2003 2004 2005 YTD '06 ($ in Millions) |
    40 Net Charge-Offs by Loan Type Net Charge-Offs by Loan Type -$5 $0 $5 $10 $15 2003 $10.9 $4.3 $3.2 $2.0 0.9 2004 $6.7 $3.1 $2.8 $1.6 0.5 2005 $5.7 $0.7 $0.0 $3.0 1.9 YTD '06 $2.6 $0.8 $0.0 ($0.9) 0.2 Specialty Finance * C & I RE Term - Commercial Construction & Land Consumer & Other ($ in Millions) * Specialty Finance includes, Matsco, GBC, GBBF and SBA. |
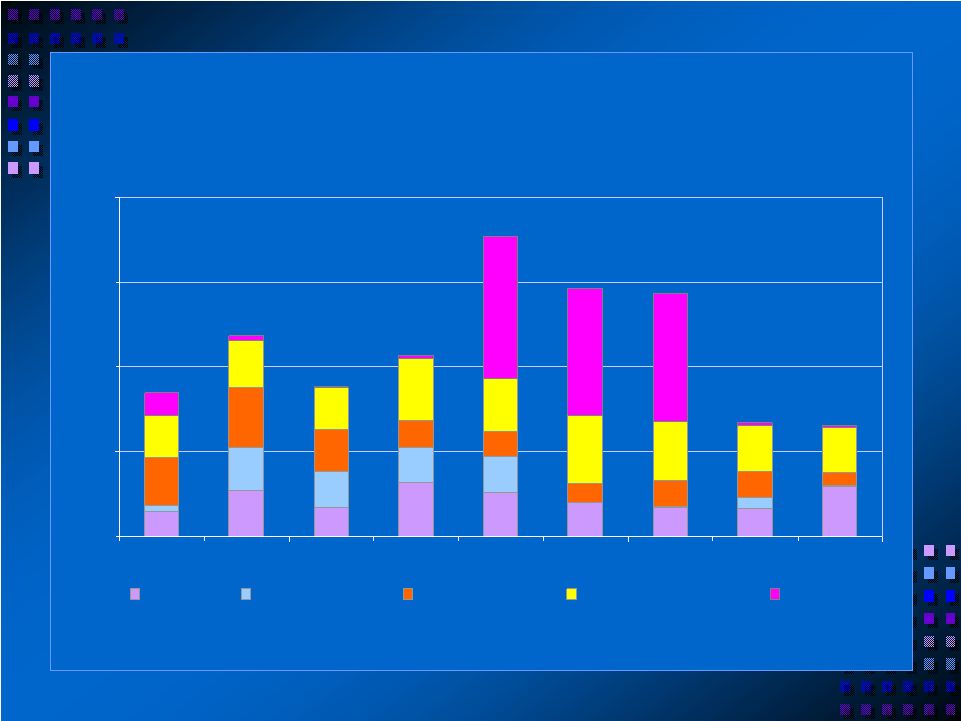 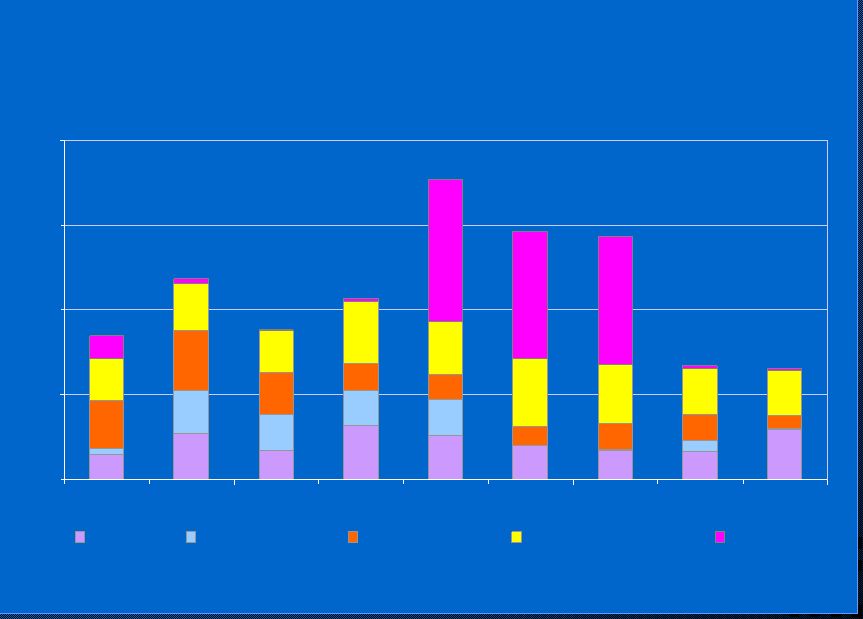   41 Non-Performing Assets by Loan Type Non-Performing Assets by Loan Type $0 $25 $50 $75 $100 6/30/04 9/30/04 12/31/04 3/31/05 6/30/05 9/30/05 12/31/05 3/31/06 6/30/06 CRE Const./Land Commercial Specialty Finance All Other $42 $59 $44 ($ in Millions) $53 $88* $73* $72* * Includes single borrowing relationship representing $41.6MM at 6/30/05, $36.6MM at 9/30/05 and $36.8MM 12/31/05. $33 $33 |
    42 Strong Financial Indicators Strong Financial Indicators |
    43 Capital Strength Capital Strength 14.9% 13.5% 12.1% 6.0% Q2 ‘06 13.3% 14.3% 10.0% Total Risk-Based Capital 12.0% 13.0% 6.0% Tier 1 Risk-Based Capital 10.4% 10.7% 5.0% Leverage Ratio 5.6% 6.1% N/A Tangible Common Equity / Tangible Assets 2005 2004 Regulatory Well-Capitalized Standard Capital Ratios |
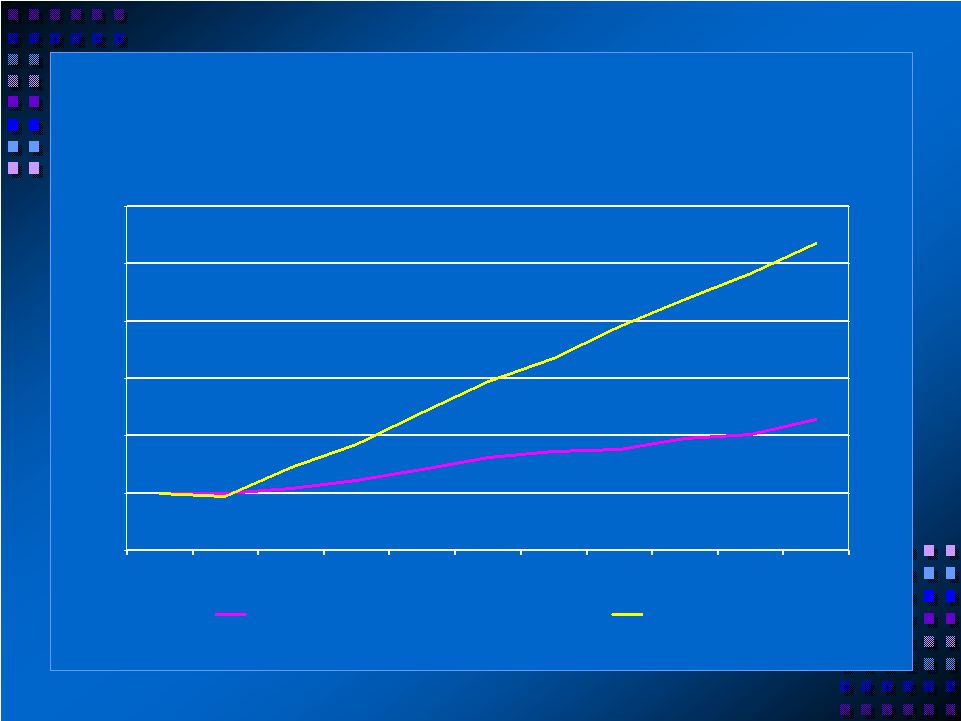
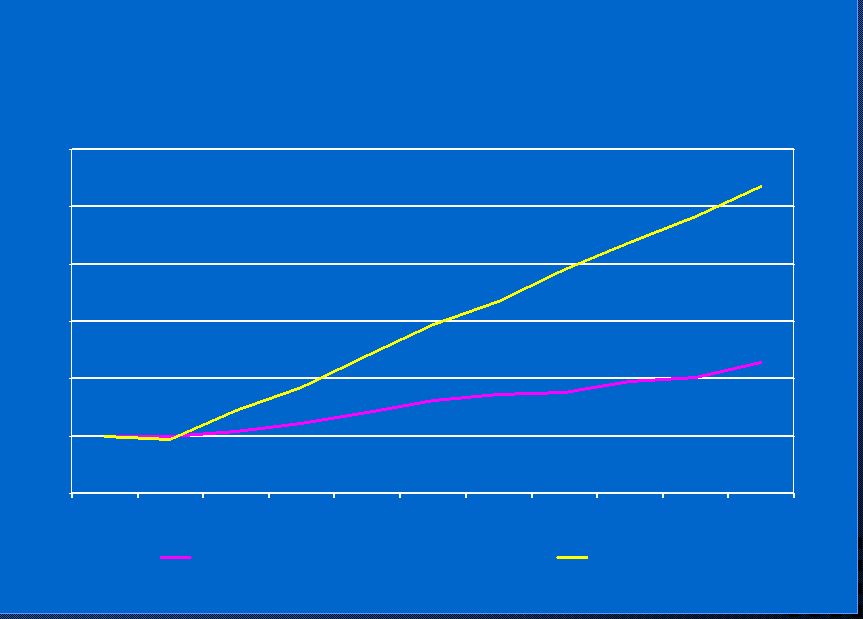
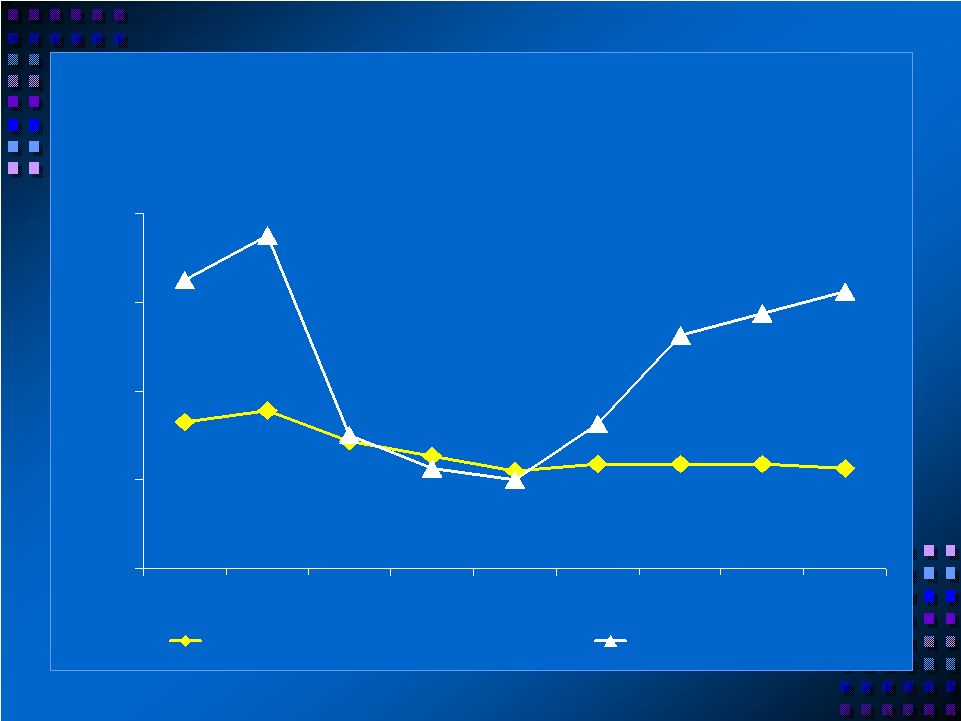  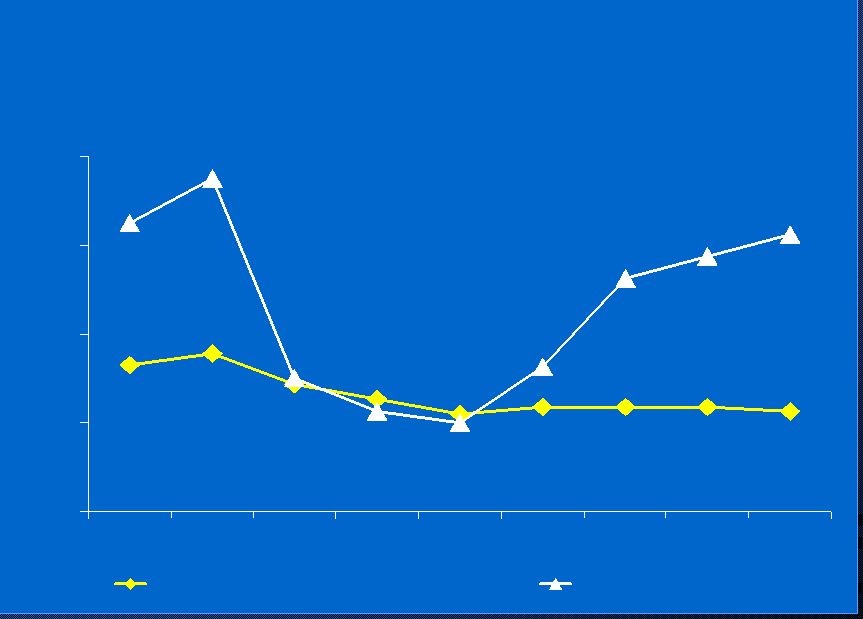  44 4.35% 4.36% 5.29% 5.56% 4.86% 4.52% 4.20% 4.36% 4.26% 7.75% 7.25% 8.50% 9.50% 5.00% 4.25% 4.00% 5.25% 8.25% 2% 4% 6% 8% 10% 12/99 12/00 12/01 12/02 12/03 12/04 12/05 03/06 06/06 GBBK's Avg. Margin Prime Rate Net Interest Margin Net Interest Margin |
    45 Interest Rate Risk Profile Interest Rate Risk Profile • Neutral risk positioning orientation. • Fundamentally matched across maturity spectrum. • Balanced under 1 year gap -- asset rates reset before liabilities. • Investment portfolio continues to be managed for minimal credit and controlled convexity risk. • Deposit repricing speed and balance behaviors primary position uncertainty. |
    46 Quality Management Quality Management |
    47 Experienced and Committed Experienced and Committed Management Team Management Team Franklin Templeton, KeyCorp Allen Gula Chief Information Officer ABD, Minet, COMPRO Dan R. Francis Insurance Brokerage Wells Fargo Colleen M. Anderson Community Banking Stanford University, Bank of America, EurekaBank Peggy Hiraoka Human Resources Wells Fargo, ATT Capital Keith Wilton Specialty Finance Cal Fed, OTS Kenneth Shannon Chief Risk Officer Bank of America James S. Westfall Chief Financial Officer Wells Fargo, Bank of America, EurekaBank Byron A. Scordelis Chief Executive Officer Experience Name Officer |
    48 Focus on the Future Focus on the Future |
    49 2006 Accomplishments of Note 2006 Accomplishments of Note • Continuation of solid and quality growth realized in specialty finance and commercial insurance brokerage businesses. • Integration of strategic insurance acquisition successfully completed. • Expansion of GBC franchise sustained. • Repositioning of community bank asset portfolio proceeding in concert with stated objectives. • Balance migration from CRE to construction. • BDO initiative established and growing. • Key risk and control metrics favorably reflect devotion of focus and resources. • Credit quality trends sustainably strengthening. • SOX compliance efforts consistent with control-based ethic. |
    50 Key Objectives Key Objectives • Restore and drive top-line revenue growth. • Quality loan and deposit growth in targeted product types and client profiles. • Focus on C&I, construction, and specialty finance lending. • Continued growth of insurance and other fee revenue sources. • Redoubled focus on pricing disciplines. • Achieve and sustain increased cost efficiency. • Rationalize responsibilities and structures. • Realize growth without added recurring cost. |
    51 Key Objectives Key Objectives • Pursue expansion of all existing business lines. • Be regarded as “best of breed” in all control endeavors. • Regulatory, compliance, accounting, SOX, and enterprise-wide risk management. • Portfolio concentration and credit quality. • Interest rate risk management. • Be an active force for positive change in the communities that we serve. |
    52 Recent Developments Recent Developments • Realignment of community bank “branding” identities completed in August 2006. • Reduced number of franchise identities from twelve to eight. • Strategic positioning around “natural” regional community banking economic markets. • Leverages pre-existing strength of Mid-Peninsula Bank identity, and coalesces four previously unfocused identities in the Santa Clara Valley around single new regional brand -- with deposits totaling in excess of $1.0 billion. • Opened new banking office in Santa Rosa, and finalizing leases on new locations in Oakland and Livermore -- both expected to open by YE 06. |
    53 • Established de novo commercial insurance brokerage operation in Eugene, Oregon in August 2006. - Continues ABD’s strategic mission of building out (via mix of organic and de novo growth) leading commercial insurance brokerage position on West Coast. • Major acquisitions successfully completed in Nevada and Washington. • De novo locations established in San Diego, Denver, and Eugene. |
    54 Focus on Shareholder Value Focus on Shareholder Value |
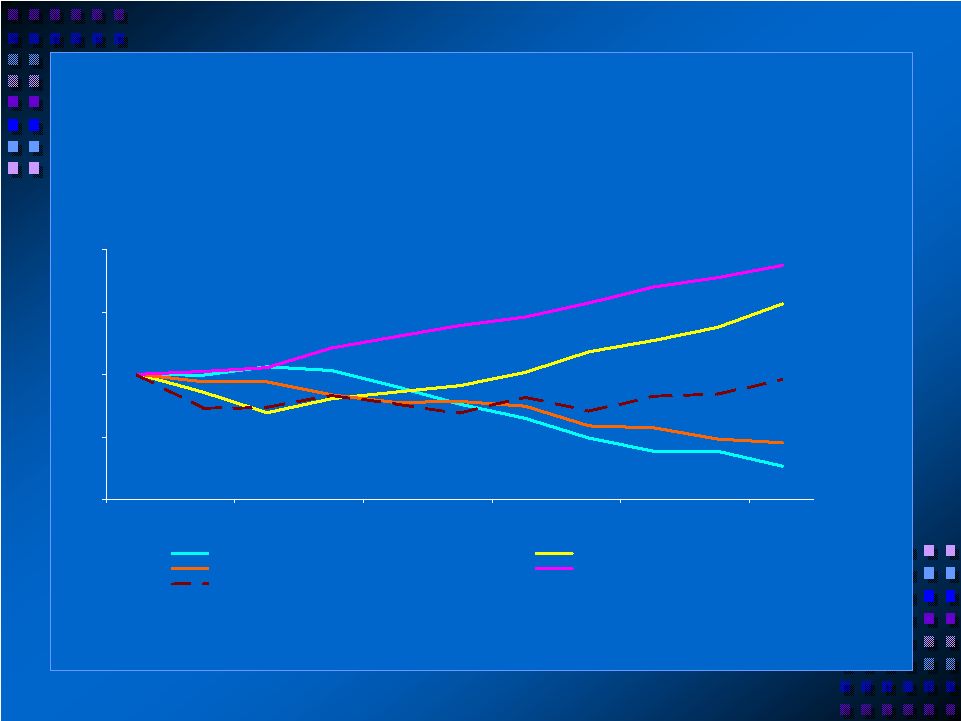
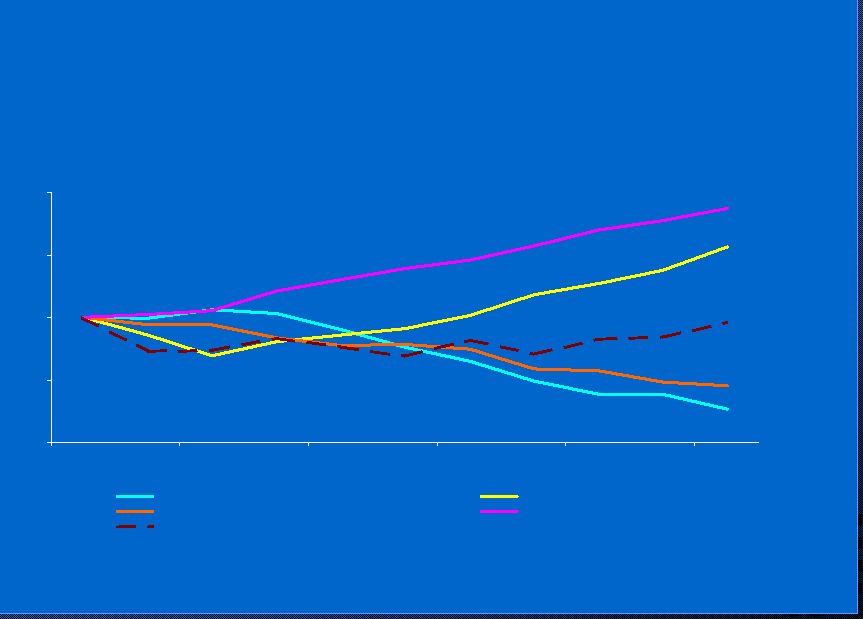
  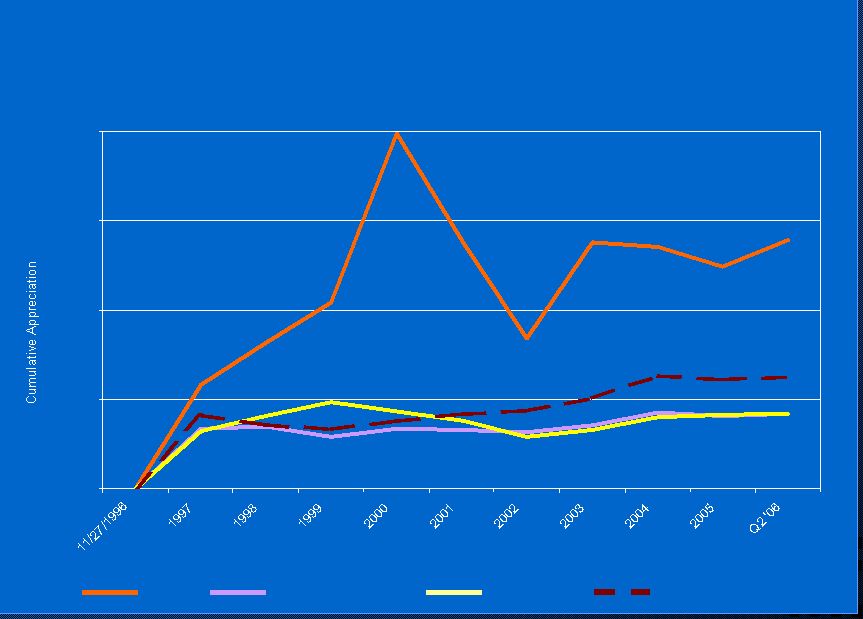  55 GBBK Share Price Performance GBBK Share Price Performance 0% 200% 400% 600% 800% GBBK S&P Bank Index S&P 500 Nasdaq Bank Index |
    56 Greater Bay Bancorp Greater Bay Bancorp |