Exhibit 99.1
Slide Presentation of Greater Bay Bancorp as of December 31, 2006
 1 Greater Bay Bancorp Greater Bay Bancorp Investor Presentation February 2007 |
 2 Greater Bay Bancorp Forward Looking Statements Greater Bay Bancorp Forward Looking Statements Certain matters discussed in this presentation constitute forward-looking statements within the meaning of the Private Securities Litigation Reform Act of 1995. These forward looking statements relate to the Company’s current expectations regarding future operating results, net interest margin, net loan charge-offs, asset quality, level of loan loss reserves, growth in loans and deposits, and the strength of the local economy. These forward looking statements are subject to certain risks and uncertainties that could cause the actual results, performance or achievements to differ materially from those expressed, suggested or implied by the forward looking statements. These risks and uncertainties include, but are not limited to: (1) the impact of changes in interest rates, a decline in economic conditions at the local, national and international levels and increased competition among financial service providers on the Company’s results of operations and the quality of the Company’s earning assets; (2) government regulation, including ABD’s receipt of requests for information from state insurance commissioners and subpoenas from state attorneys general related to the ongoing insurance industry- wide investigations into contingent commissions and override payments; and (3) the other risks set forth in the Company‘s reports filed with the Securities and Exchange Commission, including its Annual Report on Form 10-K for the year ended December 31, 2006. Greater Bay does not undertake, and specifically disclaims, any obligation to update any forward-looking statements to reflect occurrences or unanticipated events or circumstances after the date of such statements. |
 3 Company Profile As of December 31, 2006 Company Profile As of December 31, 2006 1.24% / 12.6% FY06 ROA/ROCE $4.7 billion Core Loans (1) $1.4 billion Market Capitalization (3) $736 million Common Equity 50.9 million Common Shares Outstanding $0.33 / $1.60 Q4/FY06 Diluted EPS $18.8 / $89.6 million Q4/FY06 Net Income $4.3 billion Core Deposits (2) $7.4 billion Total Assets (1) Excludes purchased residential mortgage loans (2) Excludes brokered and wholesale institutional deposits (3) As of February 2, 2007 |
 4 Investment Rationale Investment Rationale Largest independent banking franchise in Northern California operating in lucrative San Francisco Bay Area regional market. – Proven record of organic growth. – Established track record as acquirer of choice. Diversified provider of financial services in three distinct business areas. – Mitigates geographic and sector-specific concentrations. – Balanced spread and fee revenue mix. |
 5 Investment Rationale Investment Rationale Strong financial fundamentals and sound credit metrics. Experienced and proven executive management team. Leading to long-term record of superior shareholder return. |
 6 An Exceptional Regional Market An Exceptional Regional Market |
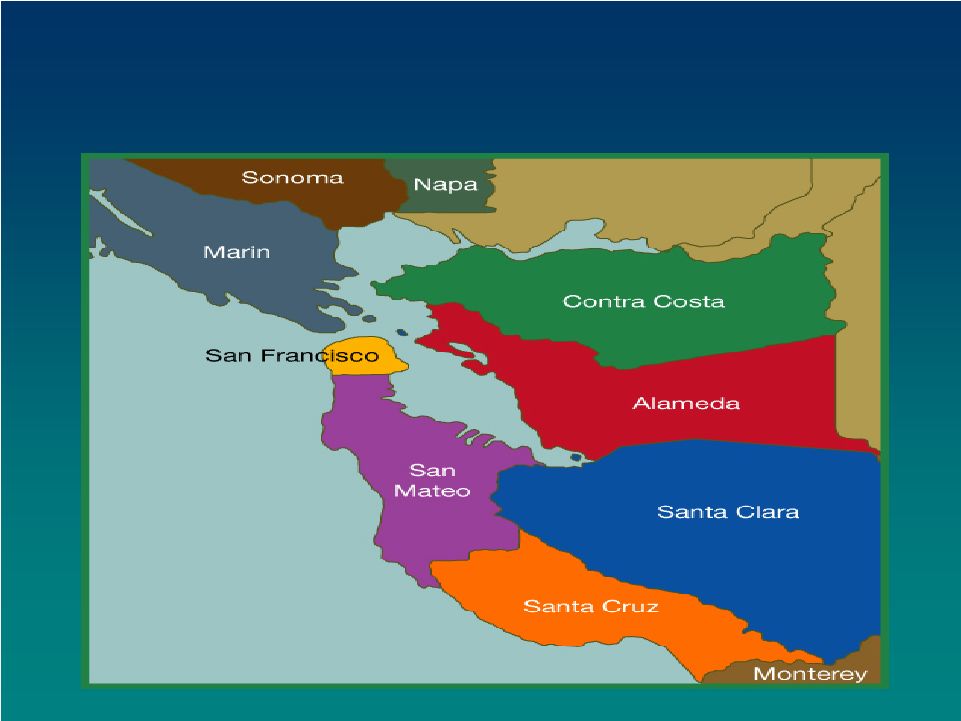 7 Greater San Francisco Bay Area Greater San Francisco Bay Area |
 8 Greater San Francisco Bay Area Profile Greater San Francisco Bay Area Profile Recognized global leadership in technological innovation, advancement, and growth. – Unmatched concentration of venture capital funding and investment. – Entrepreneurial spirit and results-oriented ethic. Highest levels of worker productivity and per capita income in the nation. Highest level of workforce education in the nation. Exceptionally strong international trade position. |
 9 Diversified Financial Services Provider Diversified Financial Services Provider Greater Bay Bancorp Community Banking Loans of $3.0 billion Core deposits of $4.3 billion 8 distinct community bank brands 43 offices Relationship based Centralized back office, policies and administration Bay Area in scope Assets of $1.7 billion Commercial finance to health care businesses Small ticket leasing Factoring and asset based lending SBA lending National in scope Annual premiums of $2.2 billion 2006 revenues of $165 million Offering P&C and D&O, employee benefits, risk management services No underwriting risk Western U.S. in scope Specialty Finance Insurance Brokerage |
 10 Community Banking |
 11 Community Banking Business Community Banking Business Operating 8 separate banking identities under single consolidated charter – 43 office locations throughout the Greater Bay Area. Common data processing platform, credit policies and operating procedures – served and supported by single administrative staff. Relationship focused: – Loans: Commercial ($500M-5MM), CRE ($1-10MM), and construction ($1-10MM). – Deposits: Full suite of business and personal products. – Local people in local markets making local decisions based upon local knowledge. |
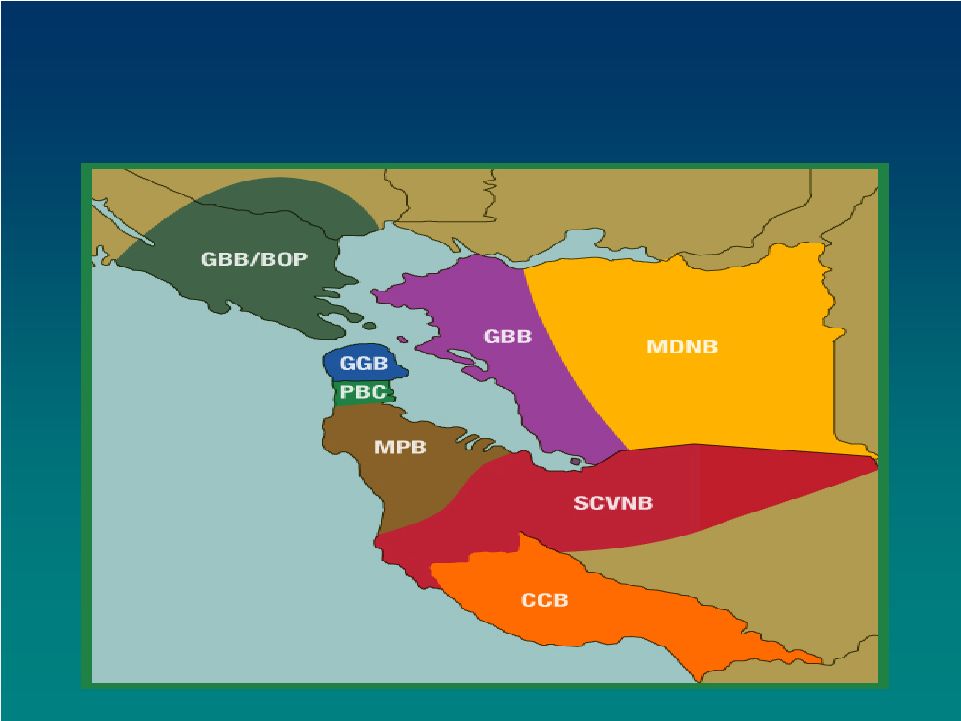 12 Community Banking Footprint |
 13 Client-Centric Banking Model Client-Centric Banking Model Install Sell Service Craft Locate and Diagnose 1 5 4 2 3 Client Link and Build 6 Relationship Management Business Development |
 14 Business Development Group Initiatives Business Development Group Initiatives Proven executive hired in Q4 2005 to build & manage team. 16 experienced BDOs recruited in 2006. – Top performers from major local competitors. – Virtually all BDOs from large banks. – Targeted to grow to 20 during 2007. Each seasoned BDO expected to generate $20MM on average in annual loan/line commitments and related deposit business. – Commercial and owner-occupied CRE. – Target size of $500M - $5MM per commitment. |
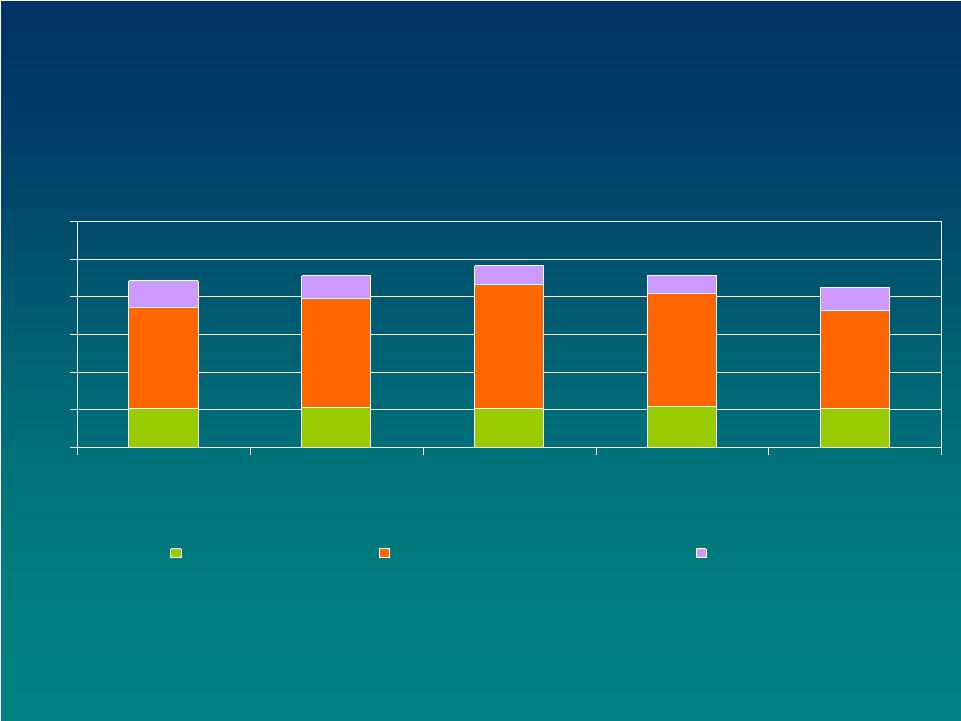 15 Core Deposit Balances (1) $0 $1 $2 $3 $4 $5 $6 2002 2003 2004 2005 2006 Demand Deposits Liquid Interest-Bearing Accounts Time Deposits ($ in Billions) (1) Core deposits exclude brokered and wholesale institutional deposits. $4.43 $4.56 $4.81 $4.56 $4.25 |
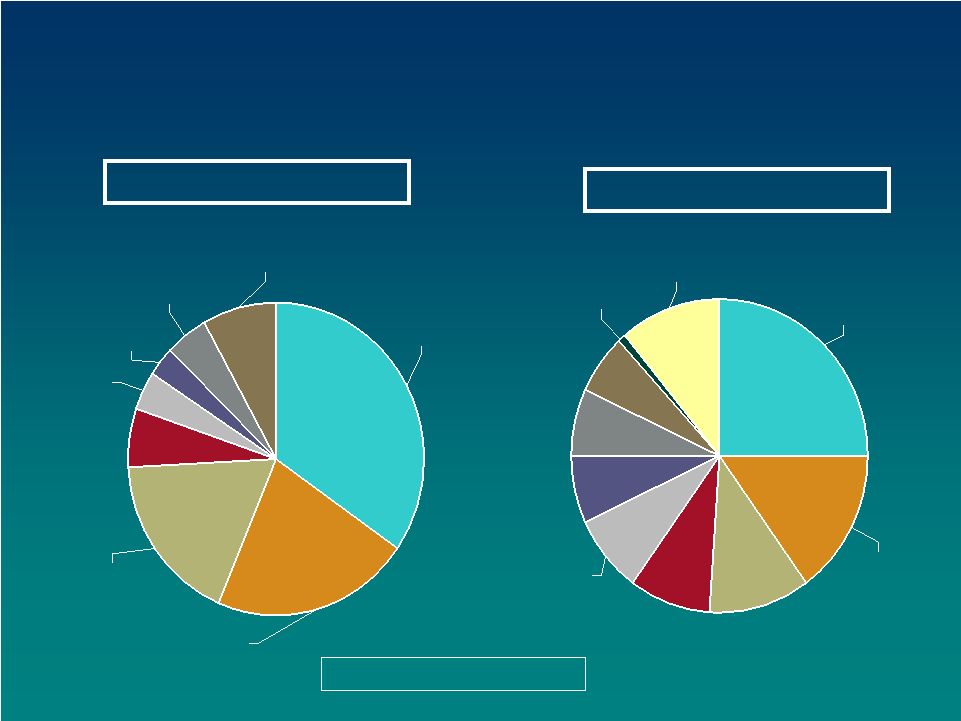
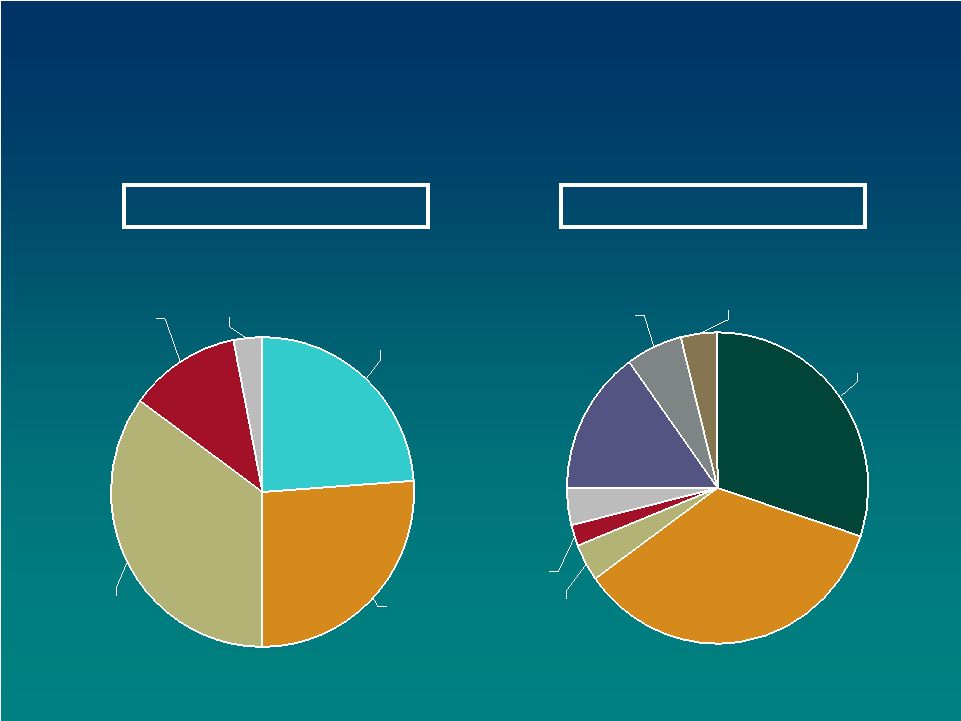 16 (1) Core deposits exclude brokered and wholesale institutional deposits. By Region By Type Demand 24% MMDAs 35% Time Deposits >$100 12% Other Time Deposits 3% Savings & NOW 26% San Mateo 30% Contra Costa 15% Sonoma 4% Santa Clara 35% Santa Cruz & Monterey 6% Alameda 4% Marin 2% San Francisco 4% Community Banking Core Deposits (1) December 31, 2006 |
 17 Core Deposit Composition (1) Core Deposit Composition (1) (23) 37 41 64 68 60 Legal Settlement $(310) $4,255 $4,097 $4,251 $4,471 $4,565 Total Core Deposits (105) 3,822 3,639 3,653 3,753 3,927 All Other Core Deposits $(205) $433 $458 $598 $718 $638 Total Specialty Deposits 23 124 140 88 164 101 Lease Investment Funds (55) 85 98 157 126 140 Venture Capital $(150) $187 $179 $288 $362 $336 1031 Exchange YOY Chg. 12/06 9/06 6/06 3/06 12/05 $ in Millions (1) Core deposits exclude brokered and wholesale institutional deposits. |
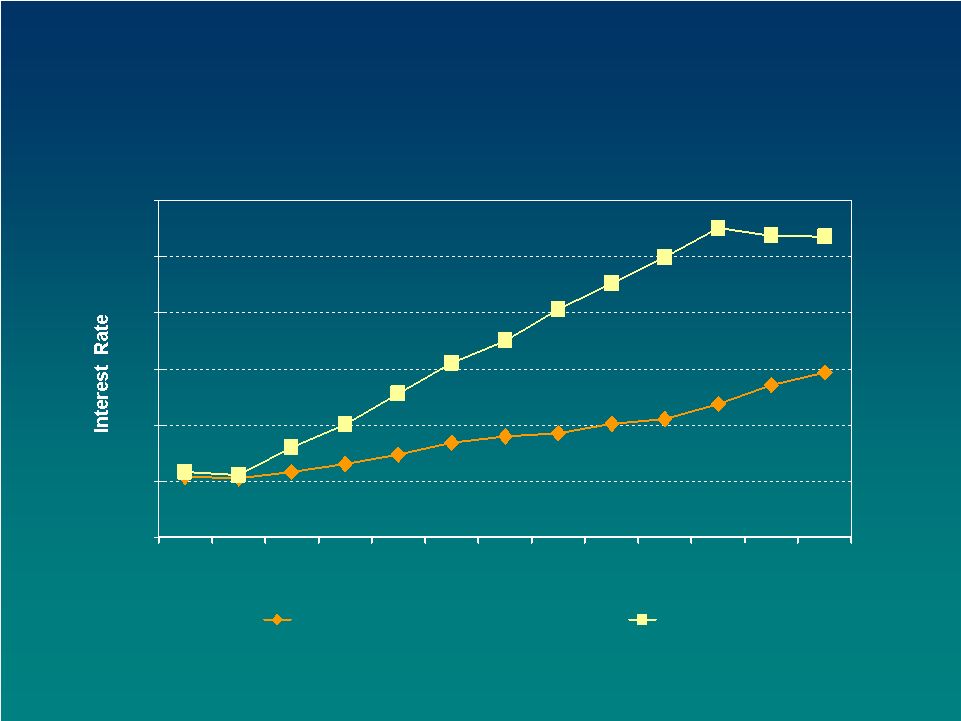 18 Core Deposit Pricing Core Deposit Pricing 0% 1% 2% 3% 4% 5% 6% Dec '03 Dec '04 Dec '05 Dec '06 Interest Bearing Core Deposit Cost LIBOR Core deposits exclude brokered and wholesale institutional deposits. |
 19 Specialty Finance |
 20 Specialty Finance Business Specialty Finance Business Collection of discrete businesses focused on acquisition and servicing/sale where execution, efficiency, standardization and productivity are essential to optimizing profitability. Transaction rather than relationship-based. – Relationships essentially limited to intermediaries who source the business (dealers, distributors, etc.). Mandate to compete at high end of credit quality spectrum. – No deviation from target borrower – very disciplined. Intense focus on perpetual growth of credit risk knowledge and on automation-based underwriting as core strategic elements. |
 21 (1) Total loans, gross of deferred costs and fees. Professional dental and veterinary term commercial financing National in scope Matsco Loans $978 million (1) Small-ticket leasing National in scope Greater Bay Capital Operating Leases $47 million Finance Leases $246 million Factoring and asset- based lending National in scope Greater Bay Business Funding Loans $82 million (1) 504 and 7(A) business sourced direct and via community banks Regional in scope SBA Lending Loans $286 million (1) Specialty Finance Group |
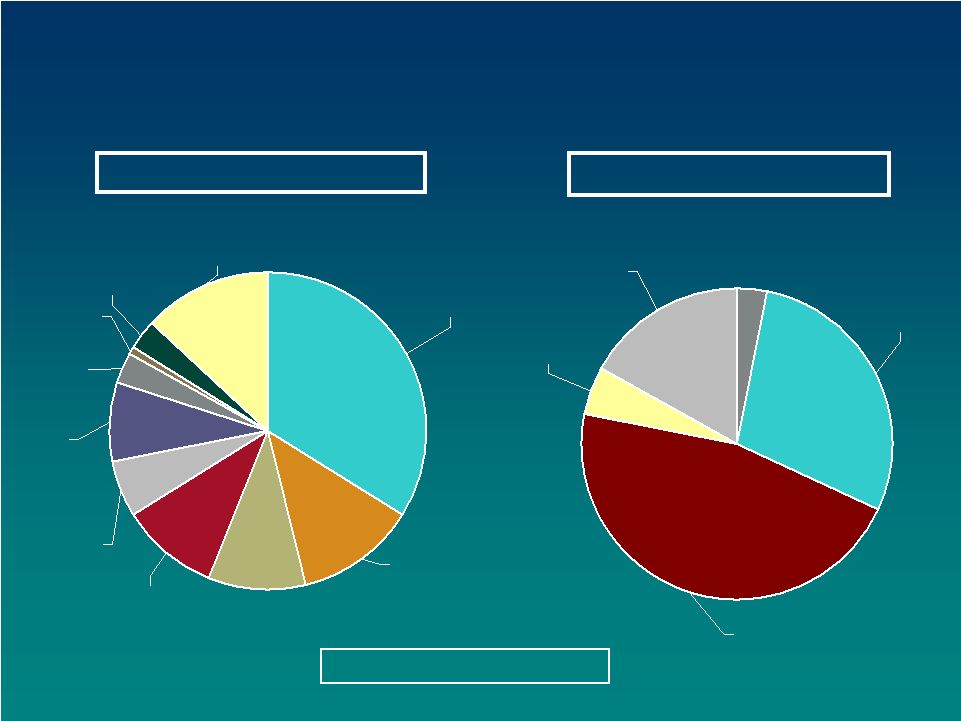
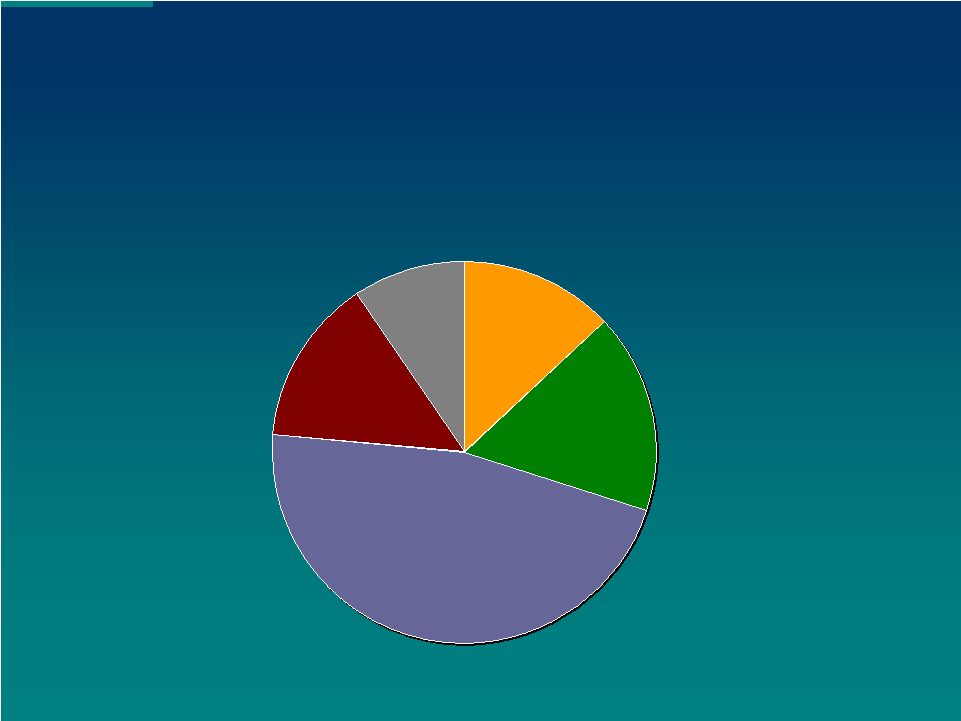
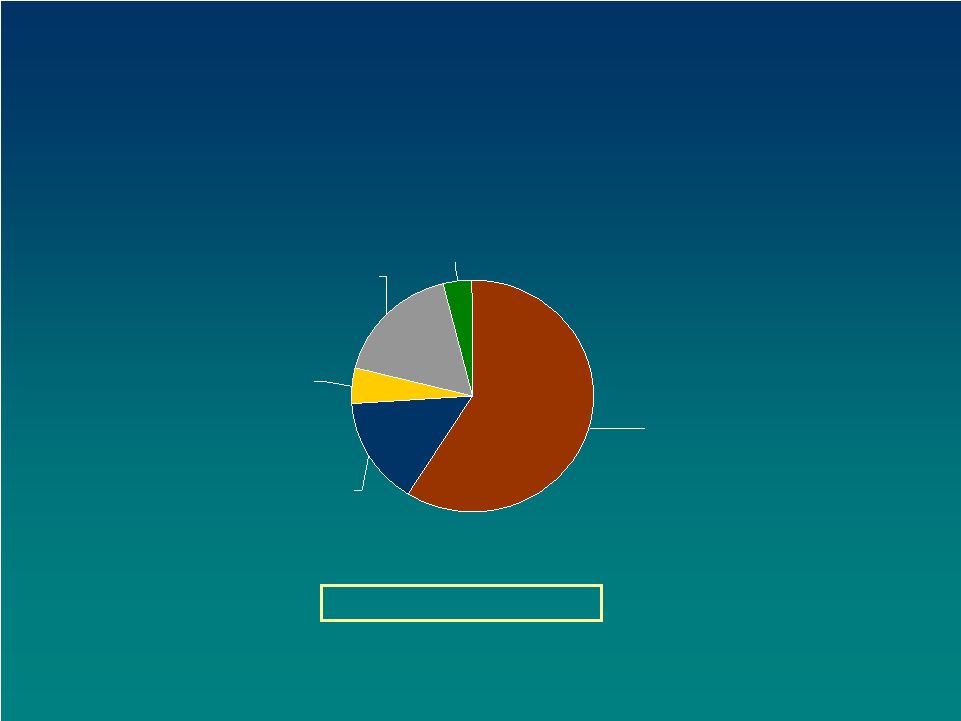 22 Specialty Finance Group Loan Portfolio Composition December 31, 2006 Specialty Finance Group Loan Portfolio Composition December 31, 2006 Matsco (1) 59% Greater Bay Capital (2) 15% SBA Lending (1) 17% Other (1) 4% Greater Bay Business Funding (1) 5% Total Assets: $1.7 billion (1) Total loans, gross of deferred costs and fees. (2) Excludes operating lease totals of $47 million. |
 23 Consolidated Loan Portfolio Profile |
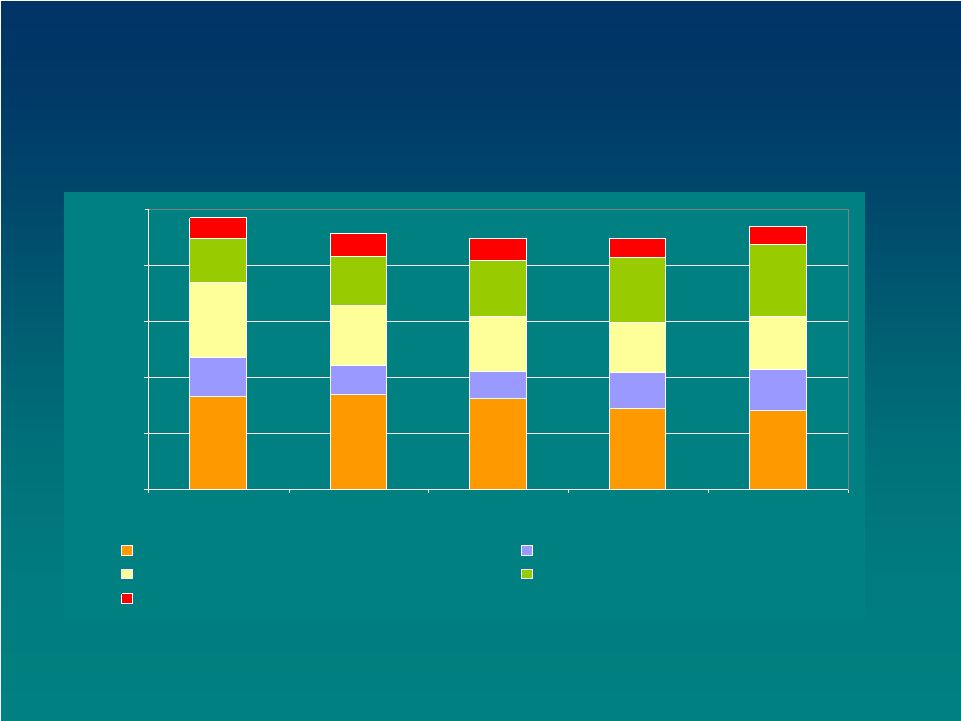 24 Core Loan Portfolio Composition (1) Combined Community Banking and Specialty Finance ($ in Billions) $- $1 $2 $3 $4 $5 2002 2003 2004 2005 2006 Commercial-Term RE Construction and Land Commercial - Community Banking Commercial - Specialty Finance SNC/Residential/All Other $4.84 $4.56 $4.47 $4.49 $4.69 8% 16% 27% 15% 34% 9% 19% 23% 12% 37% 9% 22% 22% 11% 36% 8% 26% 20% 14% 32% ( 1) Total Loans, gross of deferred costs and fees. In Q3’06 $15.4 million of deferred costs and fees on leases were reclassified from commercial, consumer and other loans into net deferred costs and fees. Prior periods have been changed to conform with current period presentation; core loans exclude purchased residential mortgage loans. 7% 27% 20% 16% 30% |
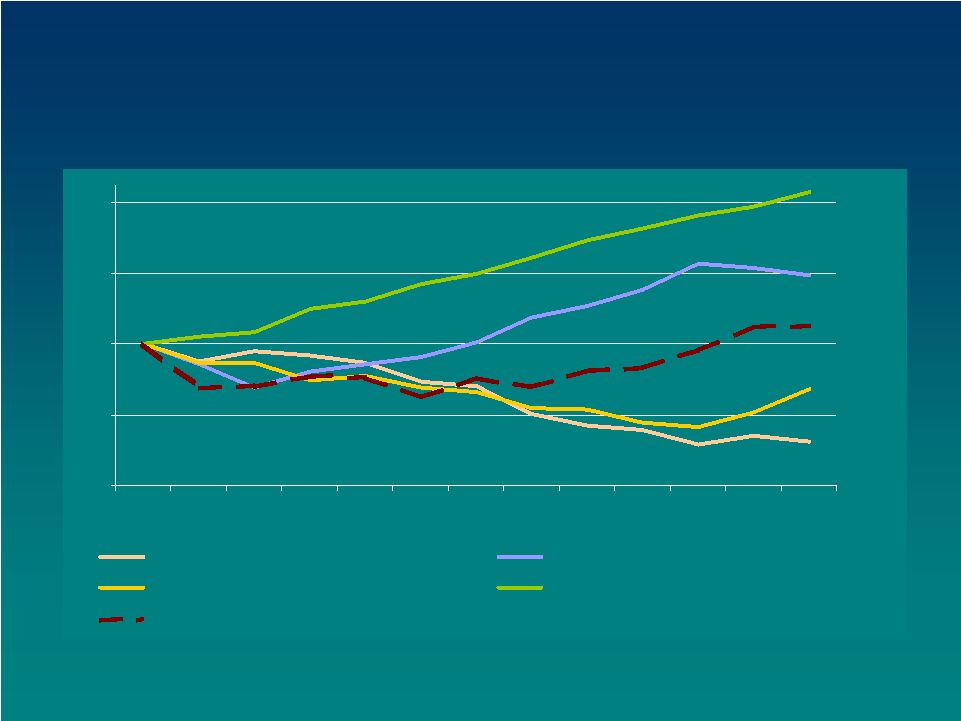 25 -400 -200 0 200 400 Dec-03 Dec-04 Dec-05 Dec-06 Commercial - Term RE Construction and Land Commercial - Community Banking Commercial - Specialty Finance Total Loans, gross of deferred costs and fees Core Loan Portfolio Evolution (1) (Cumulative Change Since December 2003) ($ in Millions) (1) In Q3’06 $15.4 million of deferred costs and fees on leases were reclassified from commercial, consumer and other loans into net deferred costs and fees. Prior periods have been changed to conform with current period presentation; core loans exclude purchased residential mortgage loans. |
 26 Term Commercial Real Estate Loan Composition December 31, 2006 Term Commercial Real Estate Loan Composition December 31, 2006 Retail 22% Industrial 18% Multi Family 5% Office 34% Warehouse 6% Other 8% R&D 3% Hotel/ Motel 4% San Mateo 11% Contra Costa 7% Marin 7% San Francisco 9% Santa Cruz 6% Sonoma 8% Solano 1% Other 11% Alameda 15% Santa Clara 25% By Type By County Total - $1.4 Billion |
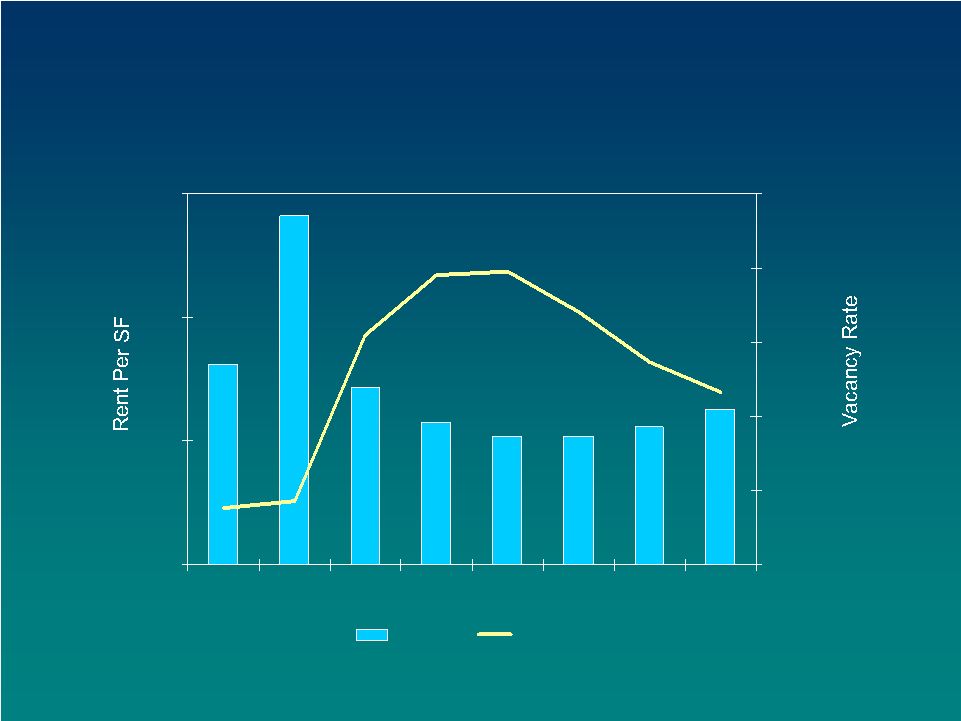 27 Bay Area Office Market Profile Bay Area Office Market Profile $0 $2 $4 $6 1999 2000 2001 2002 2003 2004 2005 2006 0% 5% 10% 15% 20% 25% Avg Rent Vacancy Source: NAI BT Commercial. |
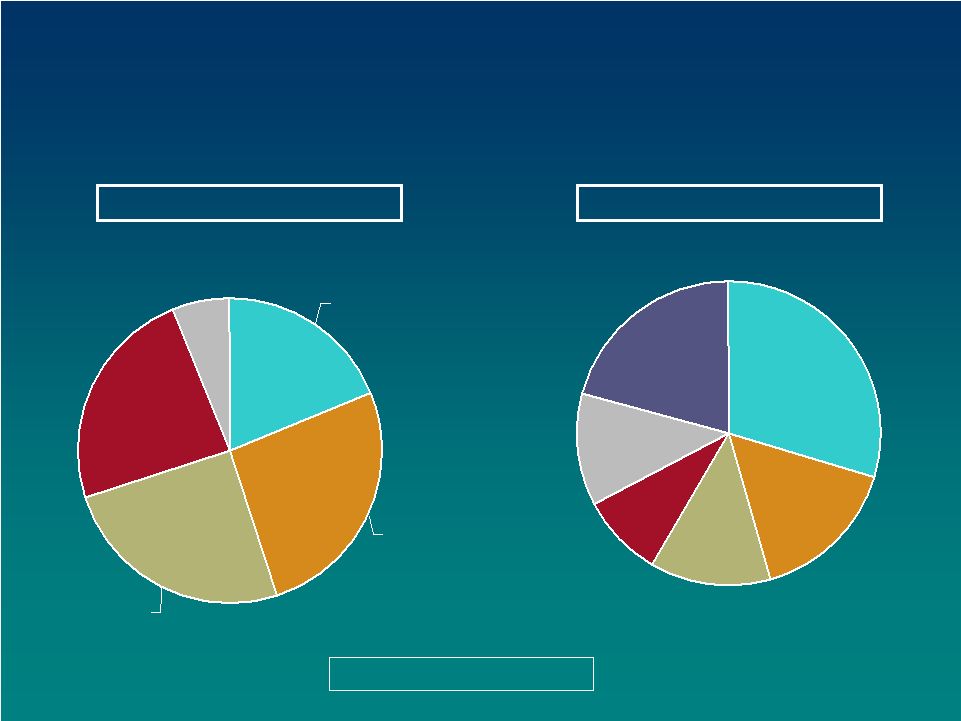
 28 Construction Loan Portfolio Composition (1) December 31, 2006 Construction Loan Portfolio Composition (1) December 31, 2006 By County Santa Clara 34% San Francisco 12% San Mateo 10% Alameda 10% Santa Cruz 6% Contra Costa 8% Sonoma 3% Marin 1% Other 13% Solano 3% Owner Occupied 3% CRE 17% Apartments 5% Condo / Townhome 46% SFD 29% By Type Total - $560 Million (1) Excludes land loans of $170 million. |
 29 65-70% 25% < 60% 19% 70-75% 24% 60-65% 26% 75-80% 6% By LTV By Total Commitment Size Total - $738 Million 1 - 4 Family / Condo Construction Portfolio Commitments December 31, 2006 $20-25MM 12% Over $25MM 21% Under $5MM 29% $15-20MM 9% $10-15MM 13% $5-10MM 16% |
 30 Sound Credit Metrics |
 31 Strong Credit Quality * Strong Credit Quality * 2.72% 2.63% 2.39% 1.39% 1.74% 0.67% 1.18% 0.39% 0.24% 0.13% Allowance% Net charge-off % 2002 2003 2004 2005 2006 * Allowance ratio is a percentage of end of period total loans. Net charge-offs are a percentage of average loans. |
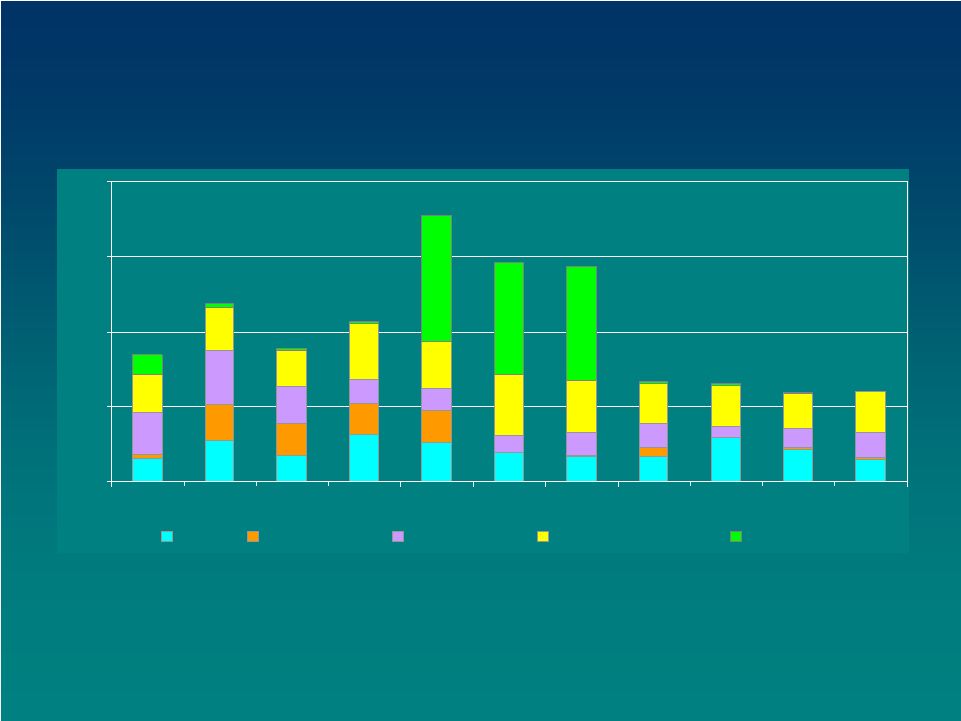 32 Non-Performing Assets by Loan Type Non-Performing Assets by Loan Type $0 $25 $50 $75 $100 6/04 9/04 12/04 3/05 6/05 9/05 12/05 3/06 6/06 9/06 12/06 CRE Const./Land Commercial Specialty Finance All Other $42 $59 $44 $53 $88* $73* $72* * Includes single borrowing relationship representing $41.6MM at 6/30/05, $36.6MM at 9/30/05 and $36.8MM 12/31/05. $33 $33 $30 $30 |
 33 Commercial Insurance Brokerage |
 34 Commercial Insurance Services Business Commercial Insurance Services Business Acquired ABD Insurance and Financial Services in March 2002 – a highly-respected provider of commercial insurance brokerage and risk management services. 14 th largest US retail broker in the nation. Diversified property and casualty (65%) and employee benefit (35%) revenue streams. Key strengths in technology, biotech, wine, construction, and agribusiness industry sectors. |
 35 Strategic focus on disciplined expansion (via organic growth and acquisitions) into key western regional markets. – Leverage existing lines of business expertise – and to develop enhanced “provider-of-choice” branding and pricing positions. – Successful expansion into Seattle (2003) and Nevada (2005). – Entered Oregon in 2006. Commercial Insurance Services Business |
 36 ABD Geographic Distribution % of 2006 Revenue ABD Geographic Distribution % of 2006 Revenue Nevada Seattle Bay Area Southern CA/ Central Coast Sacramento 14% 10% 13% 17% 46% |
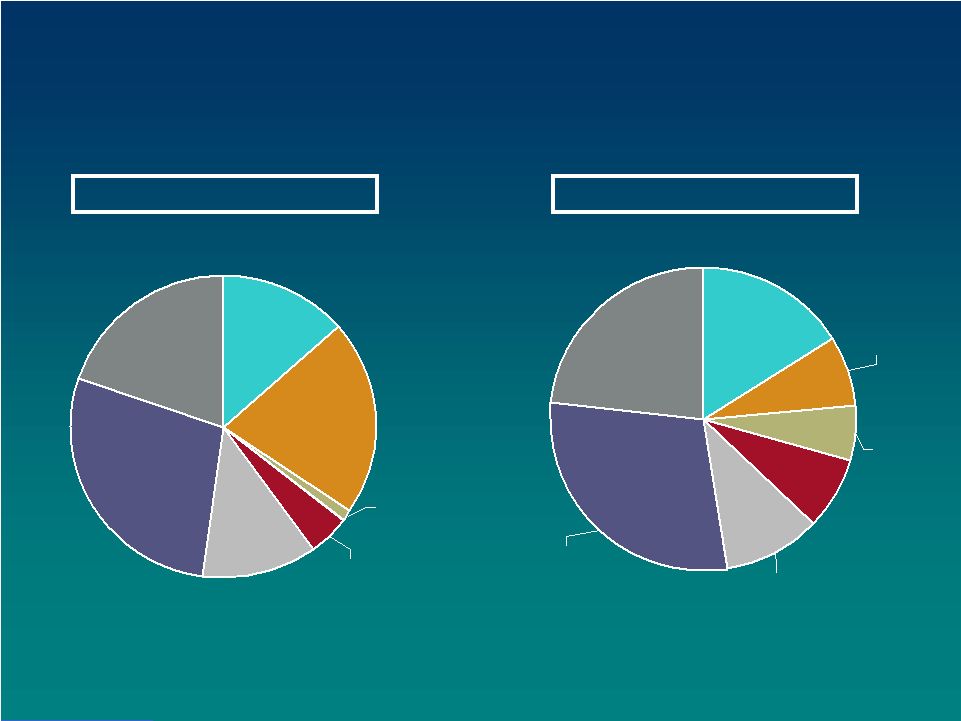 37 ABD 2006 Revenue Distribution By Size of Client Relationship * ($ in 000 ’s) ABD 2006 Revenue Distribution By Size of Client Relationship * ($ in 000’s) $5-25 21% $25-50 14% Over $750 1% $500-750 4% $250-500 12% $50-100 20% $100-250 28% Property and Casualty * Excludes relationships of less than $5,000 Employee Benefits $5-25 17% Over $750 5% $500-750 7% $250-500 10% $100-250 26% $25-50 14% $50-100 21% |
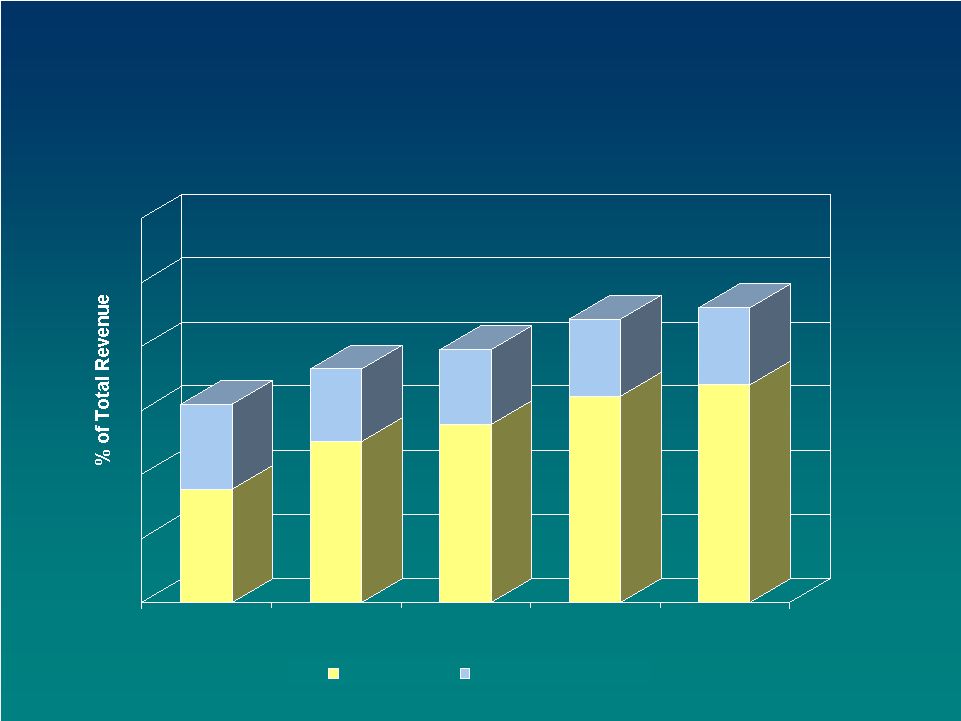 38 Growing Non-Interest Revenue Contribution Growing Non-Interest Revenue Contribution 18% 13% 25% 12% 28% 12% 32% 12% 34% 12% 2002 2003 2004 2005 2006 ABD Other Fee-Based 40% 31% 37% 44% 46% |
 39 Strong Financial Foundation |
 40 Solid Capital Base December 31, 2006 Solid Capital Base December 31, 2006 6.3% 6.8% 10.0% 9.2% 13.5% 12.0% GBBK GBBK Peer Group* Tangible Common Total Common Total Risk-Based Ratio * Comparable bank holding companies with assets between $5-$11 billion. |
 41 Interest Rate Risk Profile Interest Rate Risk Profile Neutral risk positioning orientation. – Basically matched across maturity spectrum. – Balanced under 1-year gap, but note that assets reset before liabilities. Investment portfolio continues to be managed for minimal credit and controlled convexity risk. Deposit repricing lag, speed, and customer balance behaviors expected to be primary drivers of uncertainty. |
 42 Quality Management |
 43 Experienced and Committed Management Team Experienced and Committed Management Team Stanford University, Bank of America, EurekaBank Peggy Hiraoka Human Resources Franklin Templeton, KeyCorp Allen Gula Chief Information Officer ABD, Minet, COMPRO Dan R. Francis Insurance Brokerage Wells Fargo Colleen M. Anderson Community Banking Wells Fargo, ATT Capital Keith Wilton Specialty Finance Cal Fed, OTS Kenneth Shannon Chief Risk Officer Bank of America James S. Westfall Chief Financial Officer Wells Fargo, Bank of America, EurekaBank Byron A. Scordelis Chief Executive Officer Experience Name Officer |
 44 2006 – Year in Review 2006 – Year in Review |
 45 2006 Accomplishments of Note 2006 Accomplishments of Note Continuation of solid and quality growth realized in specialty finance and commercial insurance brokerage businesses. – Integration of insurance acquisition successfully completed. – Sustained brisk expansion of MATSCO and GBC franchises. Repositioning of community bank asset portfolio proceeding in concert with stated objectives. – Balanced migration from CRE to construction and commercial lending. – BDO initiative established. Disciplined risk management. – Positive credit quality trends – Firm adherence to underwriting principles. Redoubled focus on expense discipline. – Reduction in workforce undertaken to align resources and revenues. – Outsourcing of mainframe data processing effectively executed. – Procurement and facilities cost reduction actions in process to serve as “funding source” for prioritized technology initiatives. |
 46 Other Recent Developments Other Recent Developments Reduced number of bank brands from twelve to eight. – Strategic positioning around “natural” regional community banking economic markets. – Including coalescence of four previously unfocused identities in the Santa Clara Valley around single new regional brand. Established de novo banking and loan production offices in Monterey Peninsula, Oakland and Santa Rosa. New banking office to open in Livermore in Q2 2007. Engaged highly-regarded and widely-recognized strategic consulting firm in late 2006 to conduct business unit-level strategy audit and to refine/revise/redirect and rationalize unit-level strategic plans. – To assess current and prospective competitiveness and potential source(s) of sustainable advantages. – To assist in capital deployment, prioritization, and potential reinvestment elections. – Anticipate first phase project completion in Q2 2007. |
 47 Focus on the Future |
 48 Key Objectives for 2007 Key Objectives for 2007 Drive top-line revenue growth. – Loan and deposit growth in targeted product types and client profiles. • Emphasis on continued building of C&I, construction, and specialty finance lending. • Focus on deposit franchise growth through expanded banking clientele relationships and service quality differentiation. – Continued insurance brokerage franchise development. Improve operating cost efficiency – Rationalize responsibilities and structures. – Streamline administrative processes. – Leverage technology. Maintain quality imperative in areas of credit, service, operations, and control. |
 49 Guidance for 2007 Guidance for 2007 Core Loan Growth – we expect core loan portfolio growth in the high single digits. Core Deposit Growth – we expect core deposit growth in the low single digits. Credit Quality – we expect full year net charge-offs to range from 25 basis points to 35 basis points of average loans outstanding. Net Interest Margin – we expect the full year margin level in the 3.70% to 3.85% range. – Downward revision from prior guidance to reflect the impact of anticipated issuance of trust preferred securities and redemption of Series B preferred stock as announced on 2/21/07. |
 50 Additional Insights Additional Insights ABD Revenue Growth – we expect ABD revenue (excluding potential acquisitions) to grow in the low single digit range compared to actual 2006 results. Normalized Operating Expenses – we anticipate a low single digit decline in operating expenses compared to 2006 levels. – Reduced workforce size, procurement costs, and IT processing expenses partially offset by relocation costs and new business initiatives. Loan Loss Provision – our provision level is model-driven, and is a function of overall portfolio quality and trends. While not predicting a point in time or value, our expectation is that our long- term provisioning should approximate our net charge-off rate plus that required by normal asset portfolio growth. |
 51 Focus on Shareholder Value |
 52 Appendix – Custom Peer Group Appendix – Custom Peer Group Provident Bankshares Corp. Republic Bancorp Inc. Santander Bancorp Sterling Financial Corp. Susquehanna Bancshares, Inc. SVB Financial Group Texas Regional Bancshares, Inc. Trustmark Corp. UCBH Holdings, Inc. UMB Financial Corp. Westamerica Bancorporation Whitney Holding Corp. AMCORE Financial, Inc. Bank of Hawaii Corp. Cathay General Bancorp Central Pacific Financial Corp. Chittenden Corporation Citizens Banking Corp. CVB Financial Corp. First Commonwealth Financial Corp. First Midwest Bancorp, Inc. First Republic Bank FirstMerit Corp. Old National Bancorp Pacific Capital Bancorp |