 1 Greater Bay Bancorp Annual Meeting Presentation May 30, 2007 Exhibit 99.1 |
 2 Certain matters discussed in this presentation constitute forward-looking statements within the meaning of the Private Securities Litigation Reform Act of 1995. These forward looking statements relate to the Company’s current expectations regarding future operating results, net interest margin, net loan charge-offs, asset quality, level of loan loss reserves, growth in loans and deposits, and the strength of the local economy. These forward looking statements are subject to certain risks and uncertainties that could cause the actual results, performance or achievements to differ materially from those expressed, suggested or implied by the forward looking statements. These risks and uncertainties include, but are not limited to: (1) the impact of changes in interest rates, a decline in economic conditions at the local, national and international levels and increased competition among financial service providers on the Company’s results of operations and the quality of the Company’s earning assets; (2) government regulation, including ABD’s receipt of requests for information from state insurance commissioners and subpoenas from state attorneys general related to the ongoing insurance industry-wide investigations into contingent commissions and override payments; (3) the successful completion of the merger between the Company and Wells Fargo & Company, and; 4) the other risks set forth in the Company‘s reports filed with the Securities and Exchange Commission, including its Annual Report on Form 10-K for the year ended December 31, 2006. Greater Bay does not undertake, and specifically disclaims, any obligation to update any forward-looking statements to reflect occurrences or unanticipated events or circumstances after the date of such statements. Greater Bay Bancorp Forward Looking Statements |
 3 Company Profile As of March 31, 2007 0.98% / 9.65% Q1 ROA/ROCE (annualized) $ 4.7 billion Core Loans (1) $ 1.4 billion Market Capitalization (3) $747.8 million Common Equity 51.0 million Common Shares Outstanding $0.31 Q1 Diluted EPS $ 17.8 million Q1 Net Income $ 4.3 billion Core Deposits (2) $ 7.4 billion Total Assets (1) Excludes purchased residential mortgage loans of $211 million. (2) Excludes brokered and wholesale institutional deposits of $1.0 billion. (3) As of May 25, 2007 |
 4 Balance Sheet/Margin Metrics |
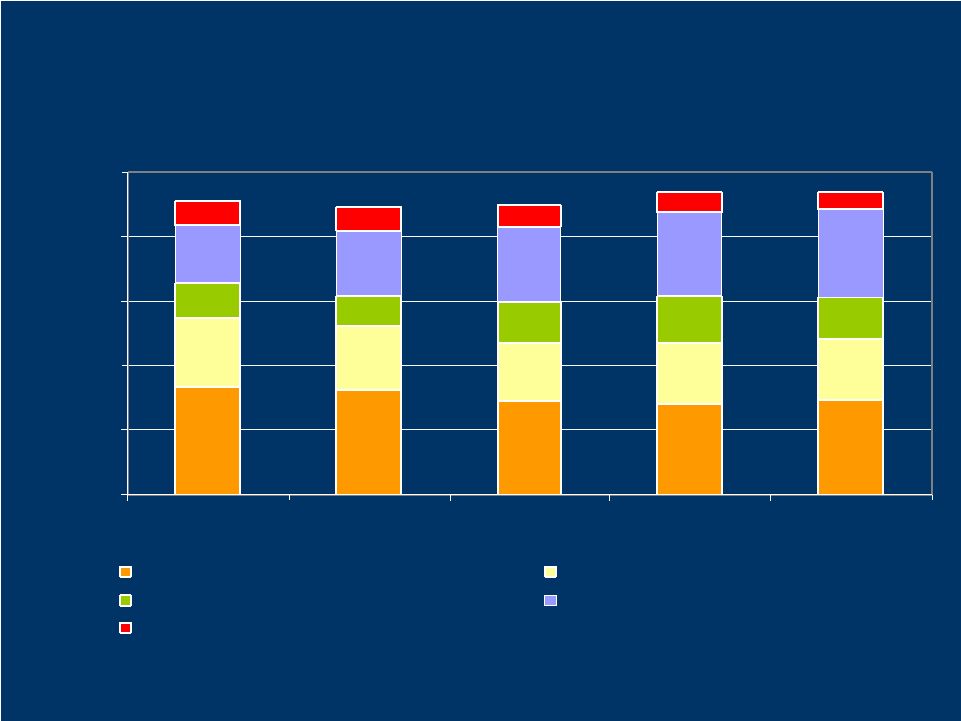 5 Core Loan Portfolio Composition (1) Combined Community Banking and Specialty Finance $- $1 $2 $3 $4 $5 2003 2004 2005 2006 Q1 07 Commercial-Term RE Commercial - Community Banking Construction and Land Commercial - Specialty Finance All Other ($ in Billions) $4.56 $4.47 $4.49 $4.69 $4.69 9% 19% 12% 23% 37% 9% 22% 11% 22% 36% 8% 26% 14% 20% 32% 7% 27% 16% 20% 30% ( 1) Total Loans, gross of deferred costs and fees. In Q3’06 $15.4 million of deferred costs and fees on leases were reclassified from commercial, consumer and other loans into net deferred costs and fees. Prior periods have been changed to conform with current period presentation; core loans exclude purchased residential mortgage loans. 6% 29% 14% 20% 31% |
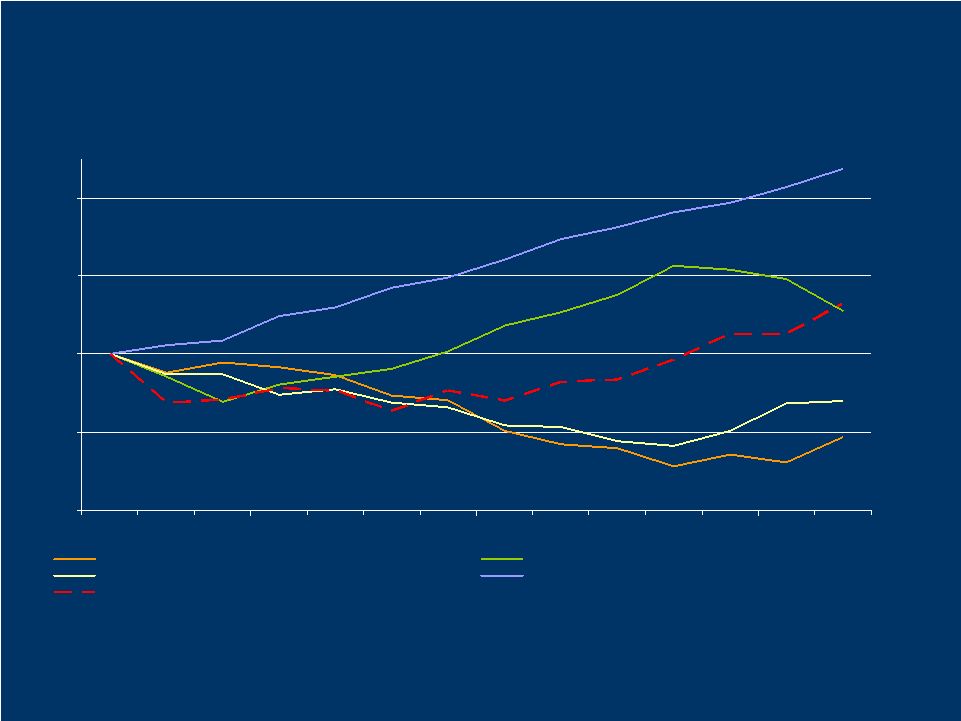 6 -400 -200 0 200 400 Dec-03 Dec-04 Dec-05 Dec-06 Mar-07 Commercial - Term RE Construction and Land Commercial - Community Banking Commercial - Specialty Finance Total Loans, gross of deferred costs and fees Core Loan Portfolio Evolution (1) (Cumulative Change Since December 2003) ($ in Millions) (1) In Q3’06 $15.4 million of deferred costs and fees on leases were reclassified from commercial, consumer and other loans into net deferred costs and fees. Prior periods have been changed to conform with current period presentation; core loans exclude purchased residential mortgage loans. |
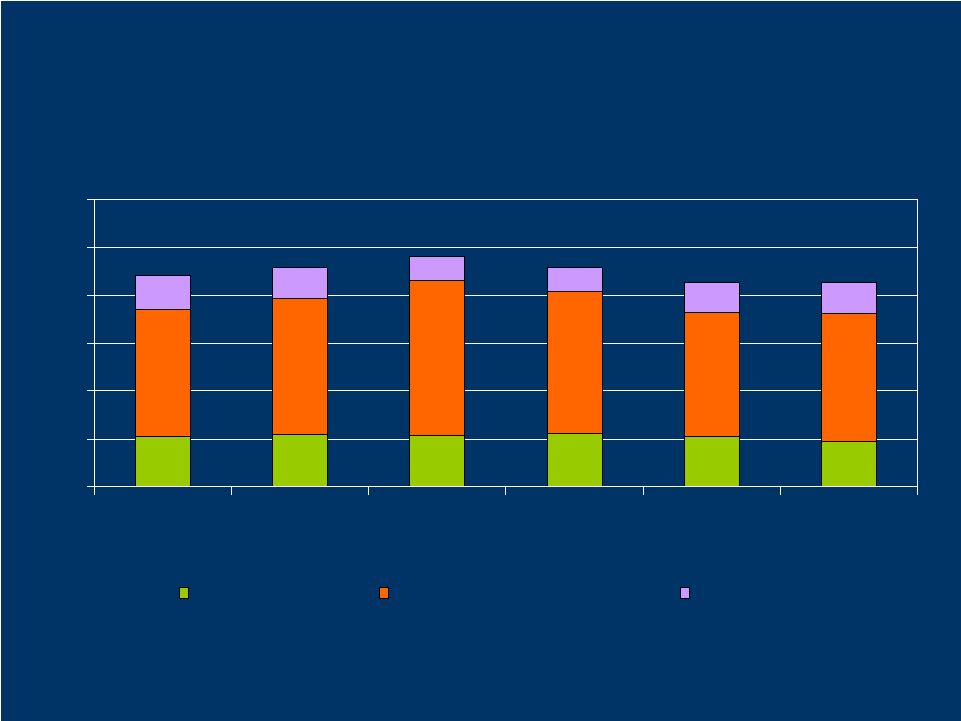 7 Core Deposit Balances (1) $0 $1 $2 $3 $4 $5 $6 2002 2003 2004 2005 2006 Q1 '07 Demand Deposits Liquid Interest-Bearing Deposits Time Deposits ($ in Billions) (1) Core deposits exclude brokered and wholesale institutional deposits. $4.43 $4.56 $4.81 $4.56 $4.25 $4.27 |
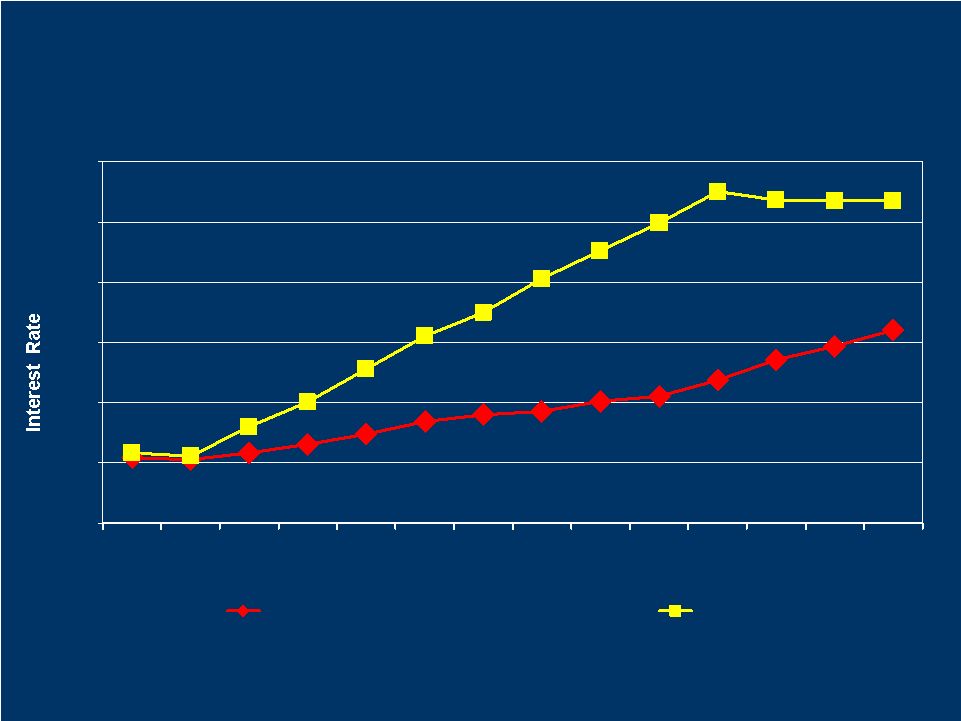 8 0% 1% 2% 3% 4% 5% 6% Dec '03 Dec '04 Dec '05 Dec '06 Interest Bearing Core Deposit Cost LIBOR Core deposits exclude brokered and wholesale institutional deposits. Mar 07 Core Deposit Pricing |
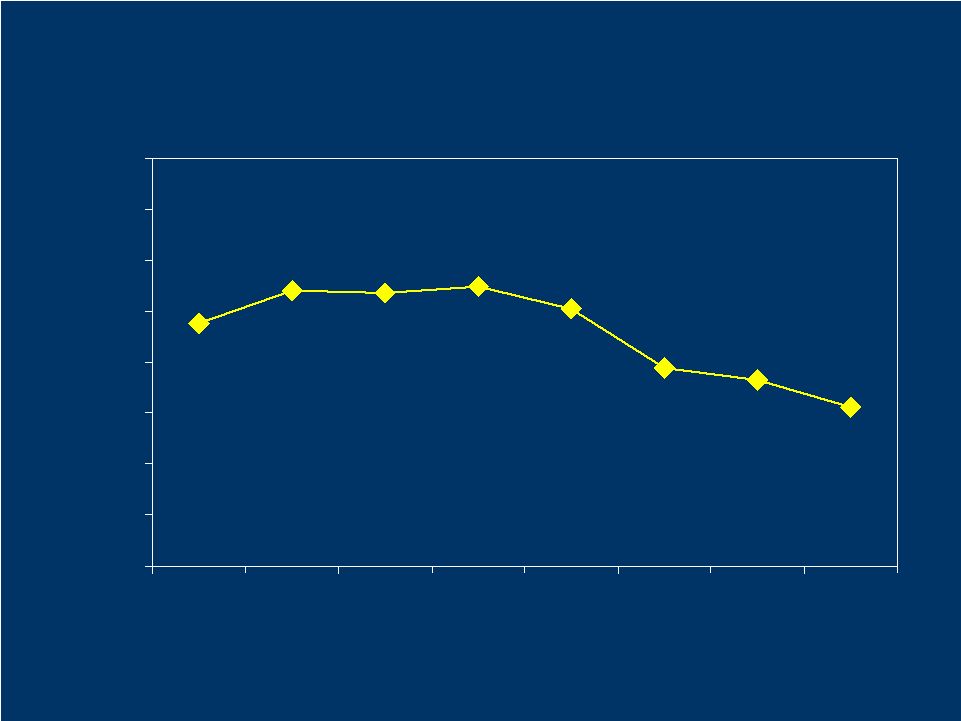 9 3.97% 4.26% 4.37% 4.34% 4.35% 4.19% 3.91% 3.78% 3.00% 3.25% 3.50% 3.75% 4.00% 4.25% 4.50% 4.75% 5.00% 2003 2004 2005 Q1 06* Q2 06* Q3 06* Q4 06* Q1 07* Net Interest Margin * Annualized |
 10 Credit Metrics |
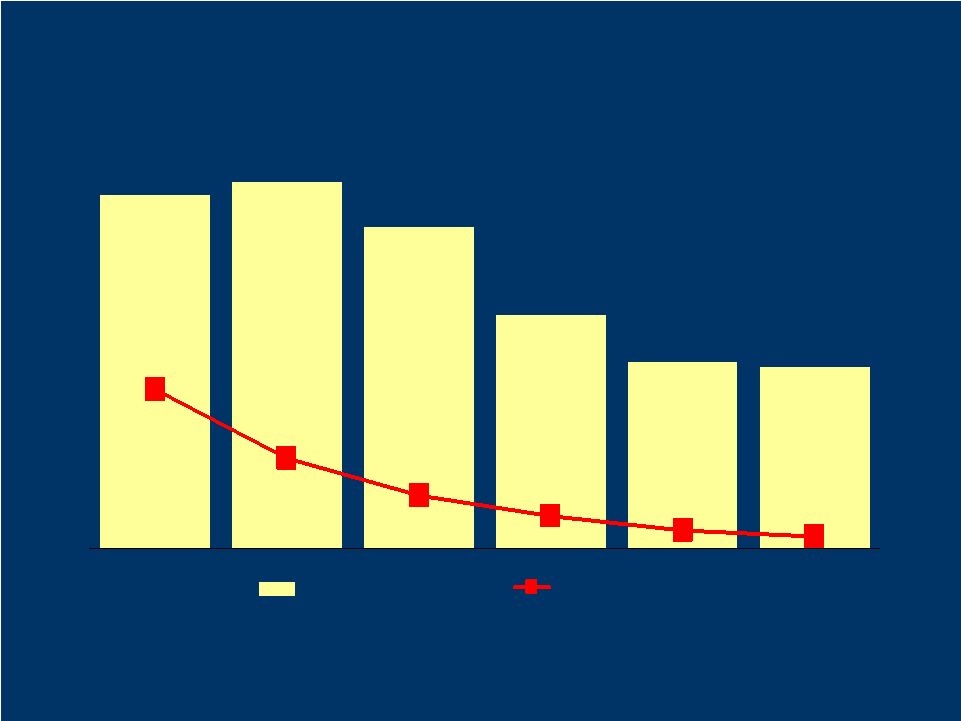 11 2.72% 2.63% 2.39% 1.39% 1.74% 1.35% 0.67% 1.18% 0.39% 0.09% 0.24% 0.13% Allowance% Net charge-off % * Allowance ratio is a percentage of end of period total loans. YTD net charge-offs are an annualized percentage of YTD average loans. 2002 2003 2004 2005 2006 Q1 ‘07 Strong Credit Quality* |
 12 Commercial Insurance Brokerage |
 13 Commercial Insurance Services Business • Acquired ABD Insurance and Financial Services in March 2002 – a highly-respected provider of commercial insurance brokerage and risk management services. • Strategic focus on expansion (via organic growth and acquisitions) into key western regional markets. – Leverage existing lines of business expertise – and to develop enhanced “provider-of-choice” branding and pricing positions. – Successful expansion into Seattle (2003) and Nevada (2005). – Entered Oregon in late 2006. |
 14 ABD Geographic Distribution % of 2006 Revenue 13% 17% 10% 46% 14% Seattle Sacramento Nevada Southern CA/ Central Coast San Francisco Bay Area |
 15 Capital Metrics |
 16 6.5% 7.0% 10.1% 9.5% 13.8% 12.0% GBBK GBBK Peer Group* Tangible Common Total Common Total Risk-Based Ratio * Comparable bank holding companies with assets between $5-$11 billion. Solid Capital Base March 31, 2007 |
 17 2006 Accomplishments of Note • Continuation of solid and quality growth realized in specialty finance and commercial insurance brokerage businesses. – Integration of insurance acquisition successfully completed. – Sustained brisk expansion of MATSCO and GBC franchises. • Sustained repositioning of community bank asset portfolio and branding in concert with stated objectives. – Balanced migration from CRE to construction and commercial lending. – BDO initiative established. – Reduced number of bank identities, and coalesced strategic positioning around “natural” regional community banking markets. |
 18 • Disciplined risk management. – Positive credit quality trends. – Firm adherence to underwriting principles. • Redoubled focus on expense discipline. – Reduction in workforce undertaken to align resources and revenues. – Outsourcing of mainframe data processing effectively executed. – Procurement and facilities cost reduction actions in process. 2006 Accomplishments of Note (continued) |
 19 Recent Developments |
 20 What Was Announced • Greater Bay announced that it has entered into a definitive agreement to be merged with Wells Fargo & Company (WFC) – each GBBK share will be exchanged in the merger for WFC common stock having: – A fixed value of $28.50 based on an average trading price of WFC common stock within the “collar” of $32.175 to $39.325 during a measurement period prior to the special shareholders’ meeting, or – A fixed exchange rate of (1) 0.8858 if the WFC average trading price is below the “collar”, or (2) 0.7247 if the WFC average trading price is above the “collar”. • Subject to shareholder and regulatory approval, and to the other terms and conditions described in the definitive agreement. • If approved and if agreement terms are met, currently expected to close in the fourth quarter. |
 21 Decision Making Process • Board of Directors carefully weighed a number of factors in reaching its decision. • Process was deliberate, thoughtful, and focused on maximizing shareholder interests. • Added detail with respect to process will be provided in proxy statement. |
 22 Considerations in Merger with Wells Fargo • The Board determined that it was in the best interests of our shareholders -- and that it was a good and responsible fulfillment of its fiduciary duties -- to agree to merge with Wells Fargo. – Competitively comparable transaction metrics. – And in a “currency” of proven financial performance. • Wells Fargo exhibited active interest in owning and growing each of our major businesses. – And is culturally aligned with our relationship-oriented values -- as well as our strong sense of community. • It can immediately deliver broad array of new products, services and value to our clients that we would otherwise have needed to build. • Leading to the Board’s decision that this was the right thing to do at the right time, and at the right price with the right partner. |
 23 Transaction Metrics Multiple to LTM EPS (1) 19.9x Multiple to Tangible Book Value 3.17x Implied Deposit Premium (2) 27% (1) LTM = April 2006 through March 2007. (2) Excludes brokered CDs and time deposits of $100,000 or more. |
 24 Wells Fargo As a Currency • Wells Fargo & Company is a diversified financial services company with $486 billion in assets. • Wells Fargo Bank, N.A. is one of only two banks worldwide to enjoy the highest possible credit rating from both Standard & Poors and Moody’s. • Transaction will provide Greater Bay shareholders with an increase in annual cash dividends per share of 39%. (1) (1) Based on Greater Bay’s current annual cash dividend payout rate of $0.64 per share, WFC’s current annual cash dividend payout rate of $1.12 per share and an implied exchange ratio of 0.7952 based on WFC’s stock price of $35.84 as of May 3, 2007. |
 25 Appendix – Custom Peer Group Provident Bankshares Corp. Republic Bancorp Inc. Santander Bancorp Sterling Financial Corp. Susquehanna Bancshares, Inc. SVB Financial Group Texas Regional Bancshares, Inc. Trustmark Corp. UCBH Holdings, Inc. UMB Financial Corp. Westamerica Bancorporation Whitney Holding Corp. AMCORE Financial, Inc. Bank of Hawaii Corp. Cathay General Bancorp Central Pacific Financial Corp. Chittenden Corporation Citizens Banking Corp. CVB Financial Corp. First Commonwealth Financial Corp. First Midwest Bancorp, Inc. First Republic Bank FirstMerit Corp. Old National Bancorp Pacific Capital Bancorp |