Item 1: Report to Shareholders
 |
| Equity Income Fund | December 31, 2006 |
The views and opinions in this report were current as of December 31, 2006. They are not guarantees of performance or investment results and should not be taken as investment advice. Investment decisions reflect a variety of factors, and the managers reserve the right to change their views about individual stocks, sectors, and the markets at any time. As a result, the views expressed should not be relied upon as a forecast of the fund’s future investment intent. The report is certified under the Sarbanes-Oxley Act, which requires mutual funds and other public companies to affirm that, to the best of their knowledge, the information in their financial reports is fairly and accurately stated in all material respects.
REPORTS ON THE WEB
Sign up for our E-mail Program, and you can begin to receive updated fund reports and prospectuses online rather than through the mail. Log in to your account at troweprice.com for more information.
Fellow Shareholders
Financial markets proved to be more rewarding last year than the headlines would have suggested. While the first half of the year was marked by some turmoil and volatility, the last six months proved to be a very profitable period for equity investors. The combination of a stable interest rate environment, continued good corporate earnings growth, declining energy prices, and significant merger-and-acquisition activity fueled the healthy advance. The S&P 500 Stock Index generated total returns of 12.74% and 15.79% for the 6- and 12-month periods ended December 31, 2006, respectively—more than satisfying by any reasonable measure.
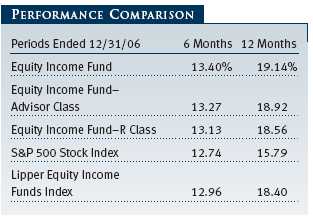

Your fund performed well in this environment, returning 13.40% during the last six months, ahead of both the broad stock market measured by the S&P 500 Stock Index and the Lipper Equity Income Funds Index. For the full year, the fund’s 19.14% return was comfortably ahead of the broad market and its Lipper benchmark. In our letter to shareholders 12 months ago, we mentioned that market forecasting “is a fruitless exercise” and discussed our outlook for 2006. Overall, we believed it would be a healthy year for stocks. The year, however, ended up much better than we expected at the end of 2005—which calls to mind our view that it usually makes sense to invest with modest expectations and hope to be pleasantly surprised. (Performance for the Advisor and R shares was lower due to their higher expense ratios.)
DIVIDEND DISTRIBUTION
On December 18, the fund’s Board of Trustees declared a fourth-quarter income dividend of $0.15 per share, bringing the total income dividend for 2006 to $0.49. In addition, the Board declared a capital gain distribution of $0.70 per share on the same date, $0.07 of which was short term and $0.63 long term. These distributions were paid to shareholders of record on December 20, 2006, and you should have already received a check or statement reflecting them. (For the Advisor and R Shares, the fourth-quarter income dividends were $0.13 and $0.12, respectively.)
PORTFOLIO REVIEW
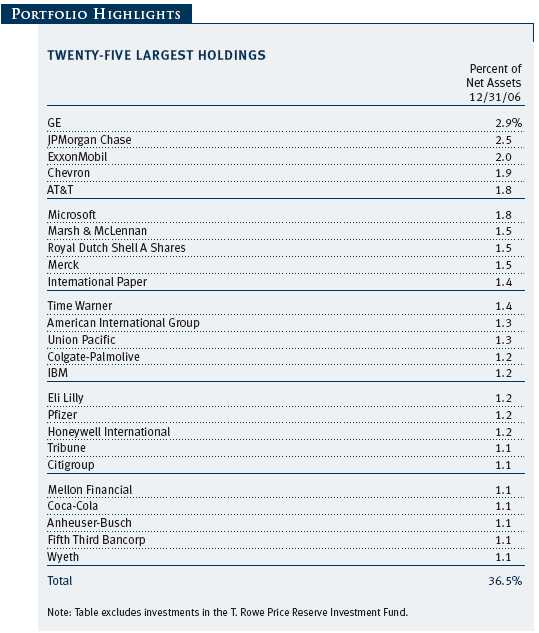
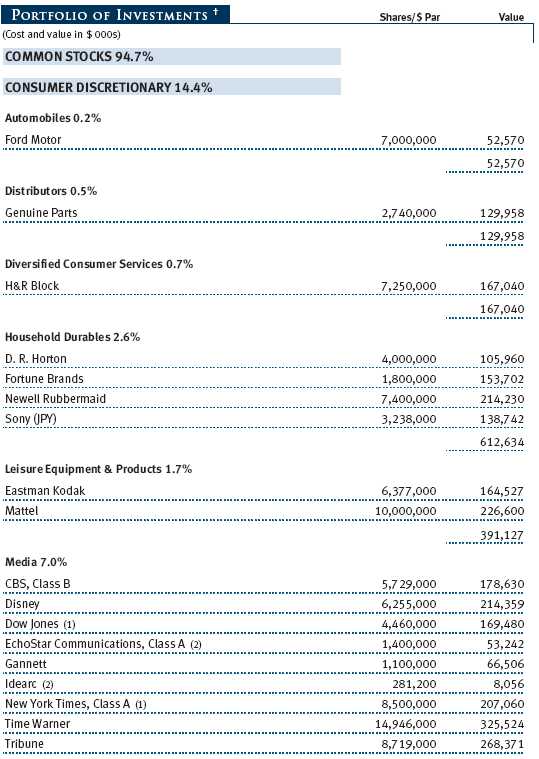
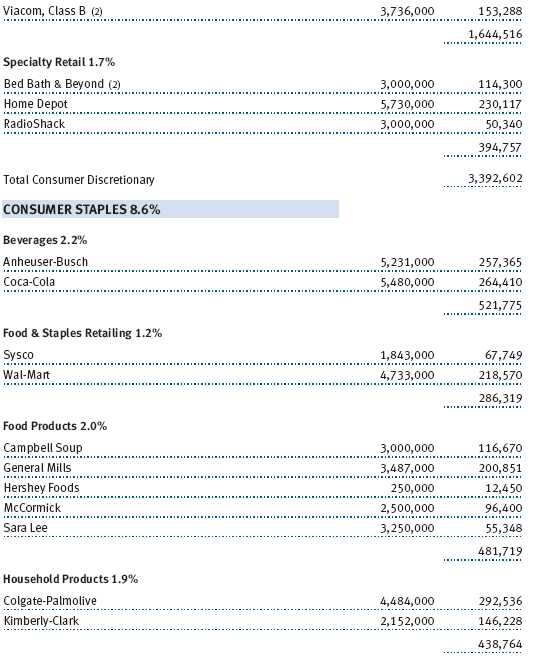
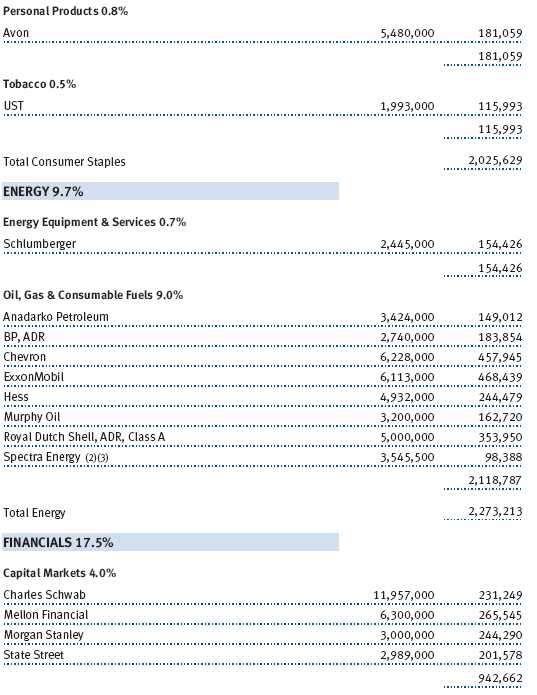
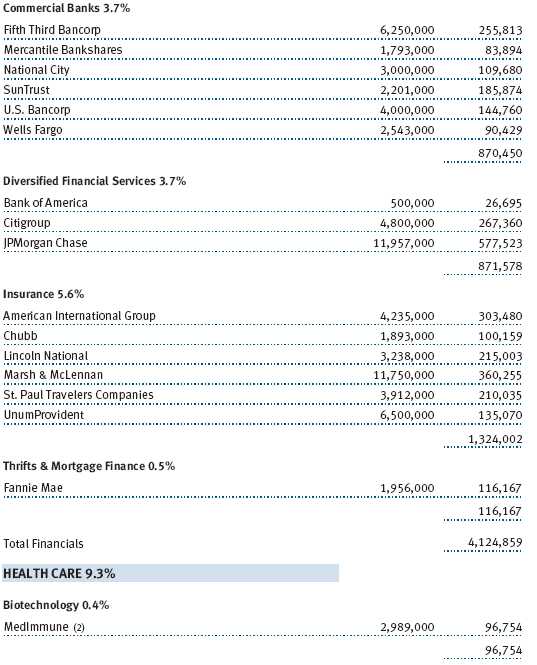
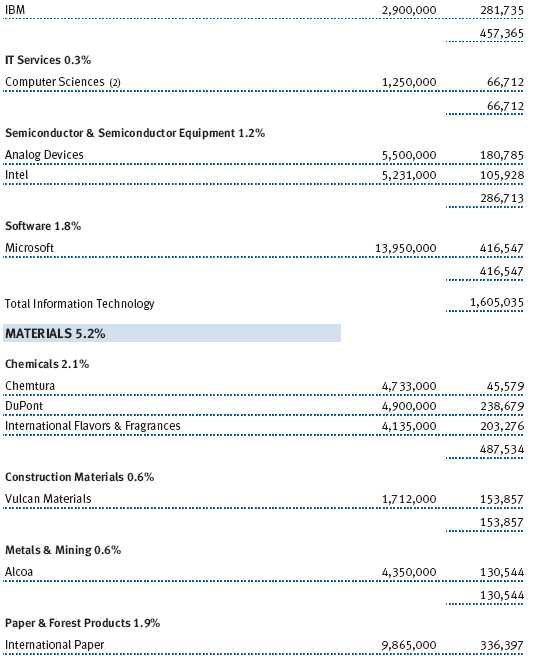
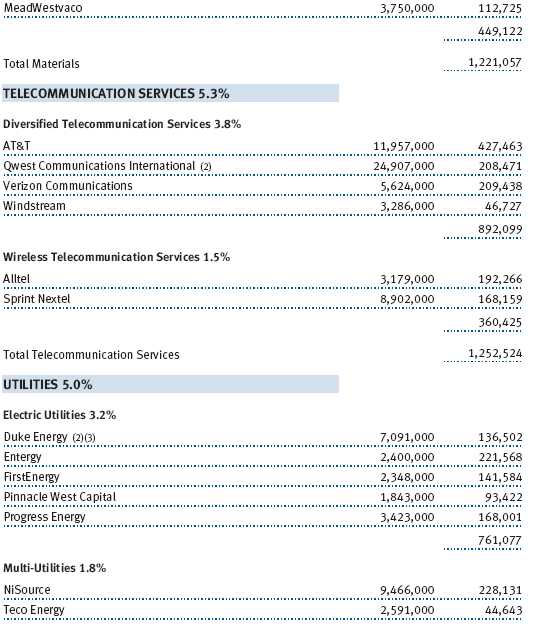
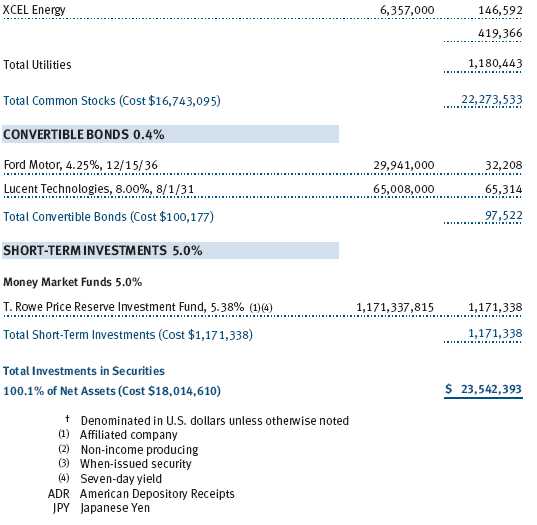
As is usually the case, there were many pleasant surprises in 2006 as well as a few inevitable disappointments. Fund performance was boosted by its investments in several energy, telecommunications, electric utility, and media companies. Comcast, ExxonMobil, Morgan Stanley, AT&T, Cisco Systems, Merck, and Entergy were among our better performers over the year. Our disappointments included Wal-Mart, Boston Scientific, Marsh & McLennan, and the New York Times. The managements of the latter group of companies have been struggling to turn around their businesses and generate investor enthusiasm. (Please refer to our portfolio of investments for a complete listing of fund holdings and the amount each represents in the portfolio.)
Performance varied significantly within sectors and industries. For example, in technology we benefited from strong results from Cisco Systems while we were simultaneously hobbled by Intel. Merck performed well while Eli Lilly lagged. A year ago, we had equally positive expectations for both pharmaceutical companies, and it is worth noting that investor psychology can change dramatically in either direction. Not long ago, Merck, Comcast, and Disney were viewed as out-of-favor companies with challenging prospects, yet they all generated strong returns in 2006 as their fundamentals improved.

The Major Portfolio Changes table at the end of this report lists some of our purchases and sales during the past 6- and 12-month periods. Worth noting are significant investments we made in 3M, Masco, Illinois Tool Works, and U.S. Bancorp. The first three all suffered share price declines in 2006, which created excellent entry points in our view. 3M, Masco, and Illinois Tool Works enjoy strong competitive positions and balance sheets, good dividend histories, and they have shown a willingness to repurchase their own stock at opportune times. They may not be exciting companies, but they execute well, and we are excited by the valuation opportunities in their share prices. The fourth stock mentioned, U.S. Bancorp, has done well by investors over time and is a great source of both dividend income and dividend growth. We financed this investment with proceeds from our sale of Bank of America, a fine company in its own right, but one that has been somewhat more acquisitive in its business expansion than we would like to see.
Most of the companies we sold over the course of the year were holdings whose prices advanced to the point where we no longer felt that their valuations and upside potential were as compelling as when we originally bought them. Comcast, for example, is an outstanding company that was very much out of favor a few years back due to investor skepticism about the company’s ability to successfully integrate the cable assets of AT&T. Comcast steadily produced solid operating results, and as its stock advanced by more than 60% in 2006, we felt it made sense to move on to more undervalued situations. The same rationale is true for portfolio eliminations such as Lockheed Martin, Simon Property Group, Hewlett-Packard, and McDonald’s; we sold all of them last year after the shares had generated strong returns. As mentioned in prior reports, when we sell a stock it does not necessarily mean that we no longer like the company, but rather that we’re concerned about the share price and believe there are better opportunities elsewhere.
OUTLOOK
We feel the same today as we did a year ago. We enter the year with modest expectations with hopes of being pleasantly surprised by year-end. The economic environment appears supportive for further gains in equities. While there is a reasonable chance that economic and earnings growth will slow in 2007, any such deceleration is likely to be followed by a decline in interest rates later in the year. In such a scenario, there is some precedent for price/earnings multiples to expand. Although we wouldn’t like to go out on a limb in making that type of forecast, it remains a distinct possibility over the course of the year. We continue to be amazed by the tremendous amount of private equity and leveraged-buyout activity in the marketplace. When you combine these deals with very strong corporate balance sheets and significant investor liquidity, you come up with a recipe for significant buying power for stocks in the months ahead.
The risks are always out there, of course. The world is filled with hot spots that threaten to erupt at any time. This is always the case, and predicting when and where the next crisis will develop is beyond our purview here. When such events occur they invariably rattle investor confidence. Markets have a way of recovering quickly, however, as long as sound fundamentals remain intact. Despite the ebbs and flows of markets, we believe our value-oriented investment approach will enable us to continue to uncover rewarding investments for you in the year ahead.
As always, we appreciate your continued confidence and support.
Respectfully submitted,

Brian C. Rogers
President of the fund and chairman of its Investment Advisory Committee
January 19, 2007
The committee chairman has day-to-day responsibility for managing the portfolio and works with committee members in developing and executing the fund’s investment program.
RISKS OF INVESTING IN THE FUND
Value investors seek to invest in companies whose stock prices are low in relation to their real worth or future prospects. By identifying companies whose stocks are currently out of favor or misunderstood, value investors hope to realize significant appreciation as other investors recognize the stock’s intrinsic value and the price rises accordingly. The value approach carries the risk that the market will not recognize a security’s intrinsic value for a long time, or that a stock judged to be undervalued may actually be appropriately priced.
GLOSSARY
Lipper index: An index of mutual fund performance returns for specified periods in defined categories as tracked by Lipper Inc.
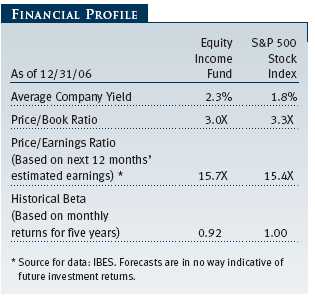
Price/earnings ratio: Calculated by dividing a stock’s market value per share by the company’s earnings per share for the past 12 months or by expected earnings for the coming year.
S&P 500 Stock Index: A market-cap-weighted index of 500 widely held stocks often used as a proxy for the overall stock market. Performance is reported on a total-return basis.

| GROWTH OF $10,000 |
This chart shows the value of a hypothetical $10,000 investment in the fund over the past 10 fiscal year periods or since inception (for funds lacking 10-year records). The result is compared with benchmarks, which may include a broad-based market index and a peer group average or index. Market indexes do not include expenses, which are deducted from fund returns as well as mutual fund averages and indexes.
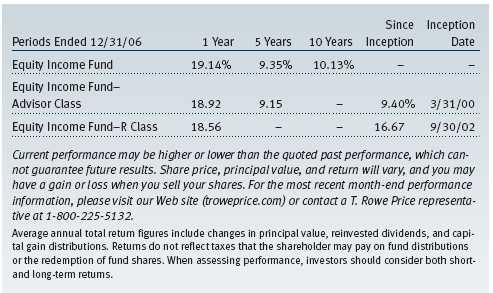
| AVERAGE ANNUAL COMPOUND TOTAL RETURN |
This table shows how the fund would have performed each year if its actual (or cumulative) returns had been earned at a constant rate.
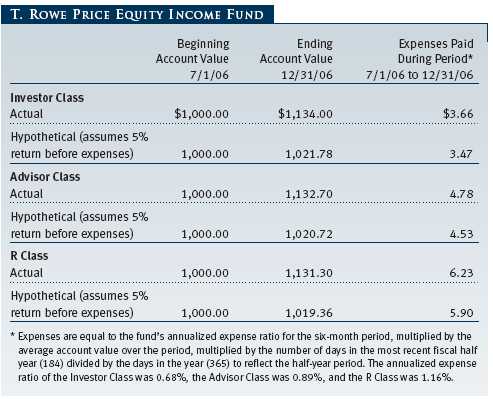
| FUND EXPENSE EXAMPLE |
As a mutual fund shareholder, you may incur two types of costs: (1) transaction costs, such as redemption fees or sales loads, and (2) ongoing costs, including management fees, distribution and service (12b-1) fees, and other fund expenses. The following example is intended to help you understand your ongoing costs (in dollars) of investing in the fund and to compare these costs with the ongoing costs of investing in other mutual funds. The example is based on an investment of $1,000 invested at the beginning of the most recent six-month period and held for the entire period.
Please note that the fund has three share classes: The original share class (“investor class”) charges no distribution and service (12b-1) fee; Advisor Class shares are offered only through unaffiliated brokers and other financial intermediaries and charge a 0.25% 12b-1 fee; R Class shares are available to retirement plans serviced by intermediaries and charge a 0.50% 12b-1 fee. Each share class is presented separately in the table.
Actual Expenses
The first line of the following table (“Actual”) provides information about actual account values and expenses based on the fund’s actual returns. You may use the information in this line, together with your account balance, to estimate the expenses that you paid over the period. Simply divide your account value by $1,000 (for example, an $8,600 account value divided by $1,000 = 8.6), then multiply the result by the number in the first line under the heading “Expenses Paid During Period” to estimate the expenses you paid on your account during this period.
Hypothetical Example for Comparison Purposes
The information on the second line of the table (“Hypothetical”) is based on hypothetical account values and expenses derived from the fund’s actual expense ratio and an assumed 5% per year rate of return before expenses (not the fund’s actual return). You may compare the ongoing costs of investing in the fund with other funds by contrasting this 5% hypothetical example and the 5% hypothetical examples that appear in the shareholder reports of the other funds. The hypothetical account values and expenses may not be used to estimate the actual ending account balance or expenses you paid for the period.
Note: T. Rowe Price charges an annual small-account maintenance fee of $10, generally for accounts with less than $2,000 ($500 for UGMA/UTMA). The fee is waived for any investor whose T. Rowe Price mutual fund accounts total $25,000 or more, accounts employing automatic investing, and IRAs and other retirement plan accounts that utilize a prototype plan sponsored by T. Rowe Price (although a separate custodial or administrative fee may apply to such accounts). This fee is not included in the accompanying table. If you are subject to the fee, keep it in mind when you are estimating the ongoing expenses of investing in the fund and when comparing the expenses of this fund with other funds.
You should also be aware that the expenses shown in the table highlight only your ongoing costs and do not reflect any transaction costs, such as redemption fees or sales loads. Therefore, the second line of the table is useful in comparing ongoing costs only and will not help you determine the relative total costs of owning different funds. To the extent a fund charges transaction costs, however, the total cost of owning that fund is higher.

The accompanying notes are an integral part of these financial statements.

The accompanying notes are an integral part of these financial statements.
The accompanying notes are an integral part of these financial statements.

The accompanying notes are an integral part of these financial statements.

The accompanying notes are an integral part of these financial statements.

The accompanying notes are an integral part of these financial statements.
The accompanying notes are an integral part of these financial statements.
| NOTES TO FINANCIAL STATEMENTS |
NOTE 1 - SIGNIFICANT ACCOUNTING POLICIES
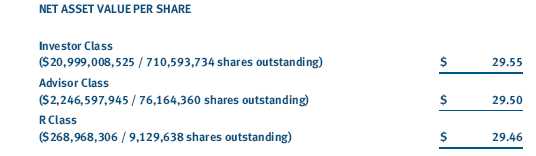
T. Rowe Price Equity Income Fund, Inc. (the fund), is registered under the Investment Company Act of 1940 (the 1940 Act) as a diversified, open-end management investment company. The fund seeks to provide substantial dividend income as well as long-term growth of capital through investments in the common stocks of established companies. The fund has three classes of shares: the Equity Income Fund original share class, referred to in this report as the Investor Class, offered since October 31, 1985; the Equity Income Fund—Advisor Class (Advisor Class), offered since March 31, 2000; and the Equity Income Fund—R Class (R Class), offered since September 30, 2002. Advisor Class shares are sold only through unaffiliated brokers and other unaffiliated financial intermediaries, and R Class shares are available to retirement plans serviced by intermediaries. The Advisor Class and R Class each operate under separate Board-approved Rule 12b-1 plans, pursuant to which each class compensates financial intermediaries for distribution, shareholder servicing, and/or certain administrative services. Each class has exclusive voting rights on matters related solely to that class, separate voting rights on matters that relate to all classes, and, in all other respects, the same rights and obligations as the other classes.
The accompanying financial statements were prepared in accordance with accounting principles generally accepted in the United States of America, which require the use of estimates made by fund management. Fund management believes that estimates and security valuations are appropriate; however, actual results may differ from those estimates, and the security valuations reflected in the financial statements may differ from the value the fund ultimately realizes upon sale of the securities.
Valuation The fund values its investments and computes its net asset value per share at the close of the New York Stock Exchange (NYSE), normally 4 p.m. ET, each day that the NYSE is open for business. Equity securities listed or regularly traded on a securities exchange or in the over-the-counter (OTC) market are valued at the last quoted sale price or, for certain markets, the official closing price at the time the valuations are made, except for OTC Bulletin Board securities, which are valued at the mean of the latest bid and asked prices. A security that is listed or traded on more than one exchange is valued at the quotation on the exchange determined to be the primary market for such security. Listed securities not traded on a particular day are valued at the mean of the latest bid and asked prices for domestic securities and the last quoted sale price for international securities.
Debt securities are generally traded in the over-the-counter market. Securities with original maturities of one year or more are valued at prices furnished by dealers who make markets in such securities or by an independent pricing service, which considers yield or price of bonds of comparable quality, coupon, maturity, and type, as well as prices quoted by dealers who make markets in such securities. Securities with original maturities of less than one year are valued at amortized cost in local currency, which approximates fair value when combined with accrued interest.
Investments in mutual funds are valued at the mutual fund’s closing net asset value per share on the day of valuation. Financial futures contracts are valued at closing settlement prices.
Other investments, including restricted securities, and those for which the above valuation procedures are inappropriate or are deemed not to reflect fair value are stated at fair value as determined in good faith by the T. Rowe Price Valuation Committee, established by the fund’s Board of Trustees.
Most foreign markets close before the close of trading on the NYSE. If the fund determines that developments between the close of a foreign market and the close of the NYSE will, in its judgment, materially affect the value of some or all of its portfolio securities, which in turn will affect the fund’s share price, the fund will adjust the previous closing prices to reflect the fair value of the securities as of the close of the NYSE, as determined in good faith by the T. Rowe Price Valuation Committee, established by the fund’s Board of Trustees. A fund may also fair value securities in other situations, such as when a particular foreign market is closed but the fund is open. In deciding whether to make fair value adjustments, the fund reviews a variety of factors, including developments in foreign markets, the performance of U.S. securities markets, and the performance of instruments trading in U.S. markets that represent foreign securities and baskets of foreign securities. The fund uses outside pricing services to provide it with closing market prices and information used for adjusting those prices. The fund cannot predict when and how often it will use closing prices and when it will adjust those prices to reflect fair value. As a means of evaluating its fair value process, the fund routinely compares closing market prices, the next day’s opening prices in the same markets, and adjusted prices.
Currency Translation Assets, including investments, and liabilities denominated in foreign currencies are translated into U.S. dollar values each day at the prevailing exchange rate, using the mean of the bid and asked prices of such currencies against U.S. dollars as quoted by a major bank. Purchases and sales of securities, income, and expenses are translated into U.S. dollars at the prevailing exchange rate on the date of the transaction. The effect of changes in foreign currency exchange rates on realized and unrealized security gains and losses is reflected as a component of security gains and losses.
Class Accounting The Advisor Class and R Class each pay distribution, shareholder servicing, and/or certain administrative expenses in the form of Rule 12b-1 fees, in an amount not exceeding 0.25% and 0.50%, respectively, of the class’s average daily net assets. Shareholder servicing, prospectus, and shareholder report expenses incurred by each class are charged directly to the class to which they relate. Expenses common to all classes, investment income, and realized and unrealized gains and losses are allocated to the classes based upon the relative daily net assets of each class.
Rebates and Credits Subject to best execution, the fund may direct certain security trades to brokers who have agreed to rebate a portion of the related brokerage commission to the fund in cash. Commission rebates are reflected as realized gain on securities in the accompanying financial statements and totaled $385,000 for the year ended December 31, 2006. Additionally, the fund earns credits on temporarily uninvested cash balances at the custodian that reduce the fund’s custody charges. Custody expense in the accompanying financial statements is presented before reduction for credits, which are reflected as expenses paid indirectly.
In-Kind Redemptions In accordance with guidelines described in the fund’s prospectus, the fund may distribute portfolio securities rather than cash as payment for a redemption of fund shares (in-kind redemption). For financial reporting purposes, the fund recognizes a gain on in-kind redemptions to the extent the value of the distributed securities on the date of redemption exceeds the cost of those securities. Gains and losses realized on in-kind redemptions are not recognized for tax purposes and are reclassified from undistributed realized gain (loss) to paid-in capital. During the year ended December 31, 2006, the fund realized $27,038,000 of net gain on $72,787,000 of in-kind redemptions.
Investment Transactions, Investment Income, and Distributions Income and expenses are recorded on the accrual basis. Premiums and discounts on debt securities are amortized for financial reporting purposes. Dividends received from mutual fund investments are reflected as dividend income; capital gain distributions are reflected as realized gain/loss. Dividend income and capital gain distributions are recorded on the ex-dividend date. Investment transactions are accounted for on the trade date. Realized gains and losses are reported on the identified cost basis. Payments (“variation margin”) made or received to settle the daily fluctuations in the value of futures contracts are recorded as unrealized gains or losses until the contracts are closed. Distributions to shareholders are recorded on the ex-dividend date. Income distributions are declared and paid by each class on a quarterly basis. Capital gain distributions, if any, are declared and paid by the fund, typically on an annual basis.
New Accounting Pronouncements In June 2006, the Financial Accounting Standards Board (“FASB”) issued FASB Interpretation No. 48 (“FIN 48”), Accounting for Uncertainty in Income Taxes, a clarification of FASB Statement No. 109, Accounting for Income Taxes. FIN 48 establishes financial reporting rules regarding recognition and measurement of tax positions taken or expected to be taken on a tax return. Management is evaluating the anticipated impact, if any, that FIN 48 will have on the fund upon adoption, which, pursuant to a delay granted by the U.S. Securities and Exchange Commission, is expected to be on the last business day of the fund’s semi-annual period, June 29, 2007.
In September 2006, the FASB released the Statement of Financial Accounting Standard No. 157 (“FAS 157”), Fair Value Measurements. FAS 157 clarifies the definition of fair value and establishes the framework for measuring fair value, as well as proper disclosure of this methodology in the financial statements. It will be effective for the fund’s fiscal year beginning January 1, 2008. Management is evaluating the effects of FAS 157; however, it is not expected to have a material impact on the fund’s net assets or results of operations.
NOTE 2 - INVESTMENT TRANSACTIONS
Consistent with its investment objective, the fund engages in the following practices to manage exposure to certain risks or to enhance performance. The investment objective, policies, program, and risk factors of the fund are described more fully in the fund’s prospectus and Statement of Additional Information.
Futures Contracts During the year ended December 31, 2006, the fund was a party to futures contracts, which provide for the future sale by one party and purchase by another of a specified amount of a specific financial instrument at an agreed upon price, date, time, and place. Risks arise from possible illiquidity of the futures market and from movements in security values.
Securities Lending The fund lends its securities to approved brokers to earn additional income. It receives as collateral cash and U.S. government securities valued at 102% to 105% of the value of the securities on loan. Cash collateral is invested in a money market pooled trust managed by the fund’s lending agent in accordance with investment guidelines approved by fund management. Collateral is maintained over the life of the loan in an amount not less than the value of loaned securities, as determined at the close of fund business each day; any additional collateral required due to changes in security values is delivered to the fund the next business day. Although risk is mitigated by the collateral, the fund could experience a delay in recovering its securities and a possible loss of income or value if the borrower fails to return the securities. Securities lending revenue recognized by the fund consists of earnings on invested collateral and borrowing fees, net of any rebates to the borrower and compensation to the lending agent. At December 31, 2006, there were no securities on loan.
Other Purchases and sales of portfolio securities, other than short-term securities, aggregated $3,565,379,000 and $4,156,571,000, respectively, for the year ended December 31, 2006.
NOTE 3 - FEDERAL INCOME TAXES
No provision for federal income taxes is required since the fund intends to continue to qualify as a regulated investment company under Subchapter M of the Internal Revenue Code and distribute to shareholders all of its taxable income and gains. Federal income tax regulations differ from generally accepted accounting principles; therefore, distributions determined in accordance with tax regulations may differ significantly in amount or character from net investment income and realized gains for financial reporting purposes. Financial reporting records are adjusted for permanent book/tax differences to reflect tax character. Financial records are not adjusted for temporary differences.
Distributions during the year ended December 31, 2006, were characterized as follows for tax purposes:

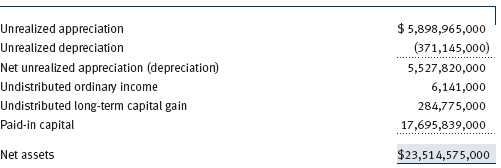
At December 31, 2006, the tax-basis components of net assets were as follows:
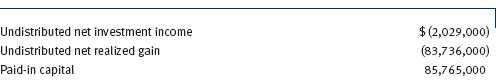
For the year ended December 31, 2006, the fund recorded the following permanent reclassifications to reflect tax character. Reclassifications to paid-in capital relate primarily to redemptions in kind and a tax practice that treats a portion of the proceeds from each redemption of capital shares as a distribution of taxable net investment income and/or realized capital gain. Results of operations and net assets were not affected by these reclassifications.
At December 31, 2006, the cost of investments for federal income tax purposes was $18,014,610,000.
NOTE 4 - RELATED PARTY TRANSACTIONS
The fund is managed by T. Rowe Price Associates, Inc. (the manager or Price Associates), a wholly owned subsidiary of T. Rowe Price Group, Inc. The investment management agreement between the fund and the manager provides for an annual investment management fee, which is computed daily and paid monthly. The fee consists of an individual fund fee and a group fee. The individual fund fee is equal to 0.25% of the fund’s average daily net assets up to $15 billion and 0.21% of the fund’s average daily net assets in excess of $15 billion; previously, through May 31, 2005, the individual fund fee had been a flat rate of 0.25% of the fund’s average daily net assets. The group fee rate is calculated based on the combined net assets of certain mutual funds sponsored by Price Associates (the group) applied to a graduated fee schedule, with rates ranging from 0.48% for the first $1 billion of assets to 0.29% for assets in excess of $160 billion. The fund’s group fee is determined by applying the group fee rate to the fund’s average daily net assets. At December 31, 2006, the effective annual group fee rate was 0.31%.
In addition, the fund has entered into service agreements with Price Associates and two wholly owned subsidiaries of Price Associates (collectively, Price). Price Associates computes the daily share prices and provides certain other administrative services to the fund. T. Rowe Price Services, Inc., provides shareholder and administrative services in its capacity as the fund’s transfer and dividend disbursing agent. T. Rowe Price Retirement Plan Services, Inc., provides subaccounting and recordkeeping services for certain retirement accounts invested in the Investor Class and R Class. For the year ended December 31, 2006, expenses incurred pursuant to these service agreements were $84,000 for Price Associates, $6,680,000 for T. Rowe Price Services, Inc., and $11,073,000 for T. Rowe Price Retirement Plan Services, Inc. The total amount payable at period-end pursuant to these service agreements is reflected as Due to Affiliates in the accompanying financial statements.
Additionally, the fund is one of several mutual funds in which certain college savings plans managed by Price Associates may invest. As approved by the fund’s Board of Trustees, shareholder servicing costs associated with each college savings plan are borne by the fund in proportion to the average daily value of its shares owned by the college savings plan. For the year ended December 31, 2006, the fund was charged $401,000 for shareholder servicing costs related to the college savings plans, of which $299,000 was for services provided by Price. The amount payable at period-end pursuant to this agreement is reflected as Due to Affiliates in the accompanying financial statements. At December 31, 2006, approximately 1% of the outstanding shares of the Investor Class were held by college savings plans.
The fund is also one of several mutual funds sponsored by Price Associates (underlying Price funds) in which the T. Rowe Price Spectrum Funds (Spectrum Funds) may invest. The Spectrum Funds do not invest in the underlying Price funds for the purpose of exercising management or control. Pursuant to a special servicing agreement, expenses associated with the operation of the Spectrum Funds are borne by each underlying Price fund to the extent of estimated savings to it and in proportion to the average daily value of its shares owned by the Spectrum Funds. Expenses allocated under this agreement are reflected as shareholder servicing expense in the accompanying financial statements. For the year ended December 31, 2006, the fund was allocated $1,914,000 of Spectrum Funds’ expenses, of which $1,431,000 related to services provided by Price. The amount payable at period-end pursuant to this agreement is reflected as Due to Affiliates in the accompanying financial statements. At December 31, 2006, approximately 6% of the outstanding shares of the Investor Class were held by the Spectrum Funds.
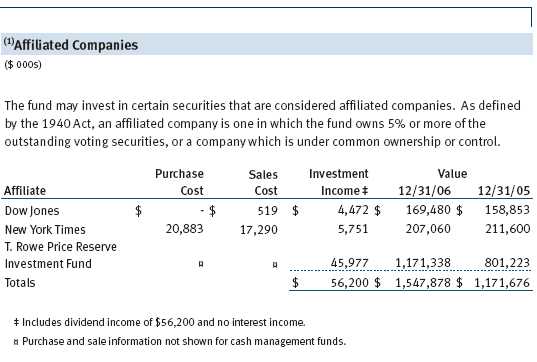
The fund may invest in the T. Rowe Price Reserve Investment Fund and the T. Rowe Price Government Reserve Investment Fund (collectively, the T. Rowe Price Reserve Funds), open-end management investment companies managed by Price Associates and affiliates of the fund. The T. Rowe Price Reserve Funds are offered as cash management options to mutual funds, trusts, and other accounts managed by Price Associates and/or its affiliates, and are not available for direct purchase by members of the public. The T. Rowe Price Reserve Funds pay no investment management fees.
As of December 31, 2006, T. Rowe Price Group, Inc., and/or its wholly owned subsidiaries owned 981,753 shares of the fund, representing less than 1% of the fund’s net assets.
| REPORT OF INDEPENDENT REGISTERED PUBLIC ACCOUNTING FIRM |
To the Board of Directors and Shareholders of T. Rowe Price Equity Income Fund
In our opinion, the accompanying statement of assets and liabilities, including the portfolio of investments, and the related statements of operations and of changes in net assets and the financial highlights present fairly, in all material respects, the financial position of T. Rowe Price Equity Income Fund (the “Fund”) at December 31, 2006, the results of its operations for the year then ended, the changes in its net assets for each of the two years in the period then ended and the financial highlights for each of the fiscal periods presented, in conformity with accounting principles generally accepted in the United States of America. These financial statements and financial highlights (hereafter referred to as “financial statements”) are the responsibility of the Fund’s management; our responsibility is to express an opinion on these financial statements based on our audits. We conducted our audits of these financial statements in accordance with the auditing standards of the Public Company Accounting Oversight Board (United States). Those standards require that we plan and perform the audit to obtain reasonable assurance about whether the financial statements are free of material misstatement. An audit includes examining, on a test basis, evidence supporting the amounts and disclosures in the financial statements, assessing the accounting principles used and significant estimates made by management, and evaluating the overall financial statement presentation. We believe that our audits, which included confirmation of securities at December 31, 2006 by correspondence with the custodian and by agreement to the underlying ownership records for T. Rowe Price Reserve Investment Fund, provide a reasonable basis for our opinion.
PricewaterhouseCoopers LLP
Baltimore, Maryland
February 12, 2007
| TAX INFORMATION (UNAUDITED) FOR THE TAX YEAR ENDED 12/31/06 |
We are providing this information as required by the Internal Revenue Code. The amounts shown may differ from those elsewhere in this report because of differences between tax and financial reporting requirements.
The fund’s distributions to shareholders included:
• $99,432,000 from short-term capital gains,
• $574,078,000 from long-term capital gains, of which $573,794,000 was subject to the 15% rate gains category, and $284,000 to the 25% rate gains category.
For taxable non-corporate shareholders, $452,888,000 of the fund’s income represents qualified dividend income subject to the 15% rate category.
For corporate shareholders, $445,266,000 of the fund’s income qualifies for the dividends-received deduction.
| INFORMATION ON PROXY VOTING POLICIES, PROCEDURES, AND RECORDS |
A description of the policies and procedures used by T. Rowe Price funds and portfolios to determine how to vote proxies relating to portfolio securities is available in each fund’s Statement of Additional Information, which you may request by calling 1-800-225-5132 or by accessing the SEC’s Web site, www.sec.gov. The description of our proxy voting policies and procedures is also available on our Web site, www.troweprice.com. To access it, click on the words “Company Info” at the top of our homepage for individual investors. Then, in the window that appears, click on the “Proxy Voting Policy” navigation button in the top left corner.
Each fund’s most recent annual proxy voting record is available on our Web site and through the SEC’s Web site. To access it through our Web site, follow the directions above, then click on the words “Proxy Voting Record” at the bottom of the Proxy Voting Policy page.
| HOW TO OBTAIN QUARTERLY PORTFOLIO HOLDINGS |
The fund files a complete schedule of portfolio holdings with the Securities and Exchange Commission for the first and third quarters of each fiscal year on Form N-Q. The fund’s Form N-Q is available electronically on the SEC’s Web site (www.sec.gov); hard copies may be reviewed and copied at the SEC’s Public Reference Room, 450 Fifth St. N.W., Washington, DC 20549. For more information on the Public Reference Room, call 1-800-SEC-0330.
| ABOUT THE FUND’S TRUSTEES AND OFFICERS |
Your fund is governed by a Board of Trustees that meets regularly to review a wide variety of matters affecting the fund, including performance, investment programs, compliance matters, advisory fees and expenses, service providers, and other business affairs. The Board of Trustees elects the fund’s officers, who are listed in the final table. At least 75% of Board members are independent of T. Rowe Price Associates, Inc. (T. Rowe Price), and T. Rowe Price International, Inc. (T. Rowe Price International); “inside” or “interested” trustees are officers of T. Rowe Price. The business address of each trustee and officer is 100 East Pratt Street, Baltimore, Maryland 21202. The Statement of Additional Information includes additional information about the fund trustees and is available without charge by calling a T. Rowe Price representative at 1-800-225-5132.
| Independent Trustees | |
| Name | |
| (Year of Birth) | Principal Occupation(s) During Past 5 Years and Directorships of |
| Year Elected * | Other Public Companies |
| Jeremiah E. Casey | Director, Allfirst Financial Inc. (previously First Maryland Bankcorp) |
| (1940) | (1983 to 2002); Director, National Life Insurance (2001 to 2005); |
| 2005 | Director, The Rouse Company, real estate developers (1990 to 2004) |
| Anthony W. Deering | Chairman, Exeter Capital, LLC, a private investment firm (2004 to |
| (1945) | present); Director, Vornado Real Estate Investment Trust (3/04 to |
| 2001 | present); Director, Mercantile Bankshares (4/03 to present); Member, |
| Advisory Board, Deutsche Bank North America (2004 to present); | |
| Director, Chairman of the Board, and Chief Executive Officer, The | |
| Rouse Company, real estate developers (1997 to 2004) | |
| Donald W. Dick, Jr. | Principal, EuroCapital Advisors, LLC, an acquisition and management |
| (1943) | advisory firm; Chairman, President, and Chief Executive Officer, |
| 1994 | The Haven Group, a custom manufacturer of modular homes (1/04 |
| to present) | |
| David K. Fagin | Chairman and President, Nye Corporation (6/88 to present); Director, |
| (1938) | Canyon Resources Corp., Golden Star Resources Ltd. (5/92 to pres- |
| 1988 | ent), and Pacific Rim Mining Corp. (2/02 to present) |
| Karen N. Horn | Director, Federal National Mortgage Association (9/06 to present); |
| (1943) | Managing Director and President, Global Private Client Services, |
| 2003 | Marsh Inc. (1999 to 2003); Director, Georgia Pacific (5/04 to |
| 12/05), Eli Lilly and Company, and Simon Property Group | |
| Theo C. Rodgers | President, A&R Development Corporation |
| (1941) | |
| 2005 | |
| John G. Schreiber | Owner/President, Centaur Capital Partners, Inc., a real estate invest- |
| (1946) | ment company; Partner, Blackstone Real Estate Advisors, L.P. |
| 2001 | |
| * Each independent trustee oversees 115 T. Rowe Price portfolios and serves until retirement, resignation, or | |
| election of a successor. | |
| Inside Trustees | |
| Name | |
| (Year of Birth) | |
| Year Elected * | |
| [Number of T. Rowe Price | Principal Occupation(s) During Past 5 Years and Directorships of |
| Portfolios Overseen] | Other Public Companies |
| Edward C. Bernard | Director and Vice President, T. Rowe Price and T. Rowe Price Group, |
| (1956) | Inc.; Chairman of the Board, Director, and President, T. Rowe Price |
| 2006 | Investment Services, Inc.; Chairman of the Board and Director, |
| [115] | T. Rowe Price International, Inc., T. Rowe Price Retirement Plan |
| Services, Inc., T. Rowe Price Services, Inc., and T. Rowe Price Savings | |
| Bank; Director, T. Rowe Price Global Asset Management Limited and | |
| T. Rowe Price Global Investment Services Limited; Chief Executive | |
| Officer, Chairman of the Board, Director, and President, T. Rowe Price | |
| Trust Company; Chairman of the Board, all funds | |
| Brian C. Rogers, CFA, CIC | Chief Investment Officer, Director, and Vice President, T. Rowe Price |
| (1955) | and T. Rowe Price Group, Inc.; Vice President, T. Rowe Price Trust |
| 2006 | Company; President, Equity Income Fund |
| [62] | |
| * Each inside trustee serves until retirement, resignation, or election of a successor. | |
| Officers | |
| Name (Year of Birth) | |
| Title and Fund(s) Served | Principal Occupation(s) |
| Jeffrey W. Arricale, CPA (1971) | Vice President, T. Rowe Price and T. Rowe Price |
| Vice President, Equity Income Fund | Group, Inc. |
| Stephen W. Boesel (1944) | Vice President, T. Rowe Price, T. Rowe Price |
| Vice President, Equity Income Fund | Group, Inc., and T. Rowe Price Trust Company |
| Andrew M. Brooks (1956) | Vice President, T. Rowe Price and T. Rowe Price |
| Vice President, Equity Income Fund | Group, Inc. |
| Joseph A. Carrier, CPA (1960) | Vice President, T. Rowe Price, T. Rowe Price |
| Treasurer, Equity Income Fund | Group, Inc., T. Rowe Price Investment Services, |
| Inc., and T. Rowe Price Trust Company | |
| Roger L. Fiery III, CPA (1959) | Vice President, T. Rowe Price, T. Rowe Price |
| Vice President, Equity Income Fund | Group, Inc., T. Rowe Price International, Inc., |
| and T. Rowe Price Trust Company | |
| Mark S. Finn, CFA, CPA (1963) | Vice President, T. Rowe Price and T. Rowe Price |
| Vice President, Equity Income Fund | Group, Inc. |
| John R. Gilner (1961) | Chief Compliance Officer and Vice President, |
| Chief Compliance Officer, Equity Income Fund | T. Rowe Price; Vice President, T. Rowe Price |
| Group, Inc., and T. Rowe Price Investment | |
| Services, Inc. | |
| David R. Giroux, CFA (1975) | Vice President, T. Rowe Price and T. Rowe Price |
| Vice President, Equity Income Fund | Group, Inc. |
| Gregory S. Golczewski (1966) | Vice President, T. Rowe Price and T. Rowe Price |
| Vice President, Equity Income Fund | Trust Company |
| Michael W. Holton (1968) | Vice President, T. Rowe Price and T. Rowe Price |
| Vice President, Equity Income Fund | Group, Inc. |
| Henry H. Hopkins (1942) | Director and Vice President, T. Rowe Price |
| Vice President, Equity Income Fund | Investment Services, Inc., T. Rowe Price |
| Services, Inc., and T. Rowe Price Trust | |
| Company; Vice President, T. Rowe Price, | |
| T. Rowe Price Group, Inc., T. Rowe Price | |
| International, Inc., and T. Rowe Price | |
| Retirement Plan Services, Inc. | |
| John D. Linehan, CFA (1965) | Vice President, T. Rowe Price and T. Rowe Price |
| Vice President, Equity Income Fund | Group, Inc. |
| Patricia B. Lippert (1953) | Assistant Vice President, T. Rowe Price and |
| Secretary, Equity Income Fund | T. Rowe Price Investment Services, Inc. |
| William J. Stromberg, CFA (1960) | Vice President, T. Rowe Price, T. Rowe Price |
| Vice President, Equity Income Fund | Group, Inc., and T. Rowe Price Trust Company |
| Julie L. Waples (1970) | Vice President, T. Rowe Price |
| Vice President, Equity Income Fund | |
| Unless otherwise noted, officers have been employees of T. Rowe Price or T. Rowe Price International for at | |
| least five years. | |
Item 2. Code of Ethics.
The registrant has adopted a code of ethics, as defined in Item 2 of Form N-CSR, applicable to its principal executive officer, principal financial officer, principal accounting officer or controller, or persons performing similar functions. A copy of this code of ethics is filed as an exhibit to this Form N-CSR. No substantive amendments were approved or waivers were granted to this code of ethics during the period covered by this report.
Item 3. Audit Committee Financial Expert.
The registrant’s Board of Directors/Trustees has determined that Mr. Donald W. Dick Jr. qualifies as an audit committee financial expert, as defined in Item 3 of Form N-CSR. Mr. Dick is considered independent for purposes of Item 3 of Form N-CSR.
Item 4. Principal Accountant Fees and Services.
(a) – (d) Aggregate fees billed to the registrant for the last two fiscal years for professional services rendered by the registrant’s principal accountant were as follows:
Audit fees include amounts related to the audit of the registrant’s annual financial statements and services normally provided by the accountant in connection with statutory and regulatory filings. Audit-related fees include amounts reasonably related to the performance of the audit of the registrant’s financial statements and specifically include the issuance of a report on internal controls and, if applicable for 2006, agreed-upon procedures related to fund acquisitions. Tax fees include amounts related to services for tax compliance, tax planning, and tax advice. The nature of these services specifically includes the review of distribution calculations and the preparation of Federal, state, and excise tax returns. Reclassification from tax fees to audit fees of fiscal 2005 amounts related to the auditing of tax disclosures within the registrant’s annual financial statements has been made in order to conform to fiscal 2006 presentation. All other fees include the registrant’s pro-rata share of amounts for agreed-upon procedures in conjunction with service contract approvals by the registrant’s Board of Directors/Trustees.
(e)(1) The registrant’s audit committee has adopted a policy whereby audit and non-audit services performed by the registrant’s principal accountant for the registrant, its investment adviser, and any entity controlling, controlled by, or under common control with the investment adviser that provides ongoing services to the registrant require pre-approval in advance at regularly scheduled audit committee meetings. If such a service is required between regularly scheduled audit committee meetings, pre-approval may be authorized by one audit committee member with ratification at the next scheduled audit committee meeting. Waiver of pre-approval for audit or non-audit services requiring fees of a de minimis amount is not permitted.
(2) No services included in (b) – (d) above were approved pursuant to paragraph (c)(7)(i)(C) of Rule 2-01 of Regulation S-X.
(f) Less than 50 percent of the hours expended on the principal accountant’s engagement to audit the registrant’s financial statements for the most recent fiscal year were attributed to work performed by persons other than the principal accountant’s full-time, permanent employees.
(g) The aggregate fees billed for the most recent fiscal year and the preceding fiscal year by the registrant’s principal accountant for non-audit services rendered to the registrant, its investment adviser, and any entity controlling, controlled by, or under common control with the investment adviser that provides ongoing services to the registrant were $1,401,000 and $883,000, respectively, and were less than the aggregate fees billed for those same periods by the registrant’s principal accountant for audit services rendered to the T. Rowe Price Funds. Preceding fiscal year amount reflects the reclassification of tax fees described in (a) – (d) above.
(h) All non-audit services rendered in (g) above were pre-approved by the registrant’s audit committee. Accordingly, these services were considered by the registrant’s audit committee in maintaining the principal accountant’s independence.Item 5. Audit Committee of Listed Registrants.
Not applicable.
Item 6. Schedule of Investments.
Not applicable. The complete schedule of investments is included in Item 1 of this Form N-CSR.
Item 7. Disclosure of Proxy Voting Policies and Procedures for Closed-End Management Investment Companies.
Not applicable.
Item 8. Portfolio Managers of Closed-End Management Investment Companies.
Not applicable.
Item 9. Purchases of Equity Securities by Closed-End Management Investment Company and Affiliated Purchasers.
Not applicable.
Item 10. Submission of Matters to a Vote of Security Holders.
Not applicable.
Item 11. Controls and Procedures.
(a) The registrant’s principal executive officer and principal financial officer have evaluated the registrant’s disclosure controls and procedures within 90 days of this filing and have concluded that the registrant’s disclosure controls and procedures were effective, as of that date, in ensuring that information required to be disclosed by the registrant in this Form N-CSR was recorded, processed, summarized, and reported timely.
(b) The registrant’s principal executive officer and principal financial officer are aware of no change in the registrant’s internal control over financial reporting that occurred during the registrant’s second fiscal quarter covered by this report that has materially affected, or is reasonably likely to materially affect, the registrant’s internal control over financial reporting.
Item 12. Exhibits.
(a)(1) The registrant’s code of ethics pursuant to Item 2 of Form N-CSR is attached.
(2) Separate certifications by the registrant's principal executive officer and principal financial officer, pursuant to Section 302 of the Sarbanes-Oxley Act of 2002 and required by Rule 30a-2(a) under the Investment Company Act of 1940, are attached.
(3) Written solicitation to repurchase securities issued by closed-end companies: not applicable.
(b) A certification by the registrant's principal executive officer and principal financial officer, pursuant to Section 906 of the Sarbanes-Oxley Act of 2002 and required by Rule 30a-2(b) under the Investment Company Act of 1940, is attached.
SIGNATURES | |
| Pursuant to the requirements of the Securities Exchange Act of 1934 and the Investment | |
| Company Act of 1940, the registrant has duly caused this report to be signed on its behalf by the | |
| undersigned, thereunto duly authorized. | |
| T. Rowe Price Equity Income Fund | |
| By | /s/ Edward C. Bernard |
| Edward C. Bernard | |
| Principal Executive Officer | |
| Date | February 16, 2007 |
| Pursuant to the requirements of the Securities Exchange Act of 1934 and the Investment | |
| Company Act of 1940, this report has been signed below by the following persons on behalf of | |
| the registrant and in the capacities and on the dates indicated. | |
| By | /s/ Edward C. Bernard |
| Edward C. Bernard | |
| Principal Executive Officer | |
| Date | February 16, 2007 |
| By | /s/ Joseph A. Carrier |
| Joseph A. Carrier | |
| Principal Financial Officer | |
| Date | February 16, 2007 |