UNITED STATES
SECURITIES AND EXCHANGE COMMISSION
Washington, D.C. 20549
FORM N-CSR
CERTIFIED SHAREHOLDER REPORT OF REGISTERED
MANAGEMENT INVESTMENT COMPANIES
Investment Company Act File Number: 811-04400
| T. Rowe Price Equity Income Fund |
| (Exact name of registrant as specified in charter) |
| 100 East Pratt Street, Baltimore, MD 21202 |
| (Address of principal executive offices) |
| David Oestreicher |
| 100 East Pratt Street, Baltimore, MD 21202 |
| (Name and address of agent for service) |
Registrant’s telephone number, including area code: (410) 345-2000
Date of fiscal year end: December 31
Date of reporting period: June 30, 2015
Item 1. Report to Shareholders
 |
| Equity Income Fund | June 30, 2015 |
The views and opinions in this report were current as of June 30, 2015. They are not guarantees of performance or investment results and should not be taken as investment advice. Investment decisions reflect a variety of factors, and the managers reserve the right to change their views about individual stocks, sectors, and the markets at any time. As a result, the views expressed should not be relied upon as a forecast of the fund’s future investment intent. The report is certified under the Sarbanes-Oxley Act, which requires mutual funds and other public companies to affirm that, to the best of their knowledge, the information in their financial reports is fairly and accurately stated in all material respects.
REPORTS ON THE WEB
Sign up for our E-mail Program, and you can begin to receive updated fund reports and prospectuses online rather than through the mail. Log in to your account at troweprice.com for more information.
Manager’s Letter
Fellow Shareholders
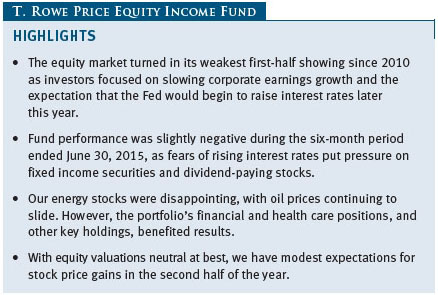
The equity market advanced only slightly in the first half of 2015, its weakest first-half showing since 2010. Investors focused on slowing corporate earnings growth and the expectation that the Fed would begin to raise interest rates later this year. These concerns had an impact on fixed income markets and stocks paying good dividends, which declined as long-term rates rose slightly. In addition, worries about Greece, the eurozone, and the Chinese economy subdued investor sentiment. After six years of stock price gains, investors were content to take a breather.
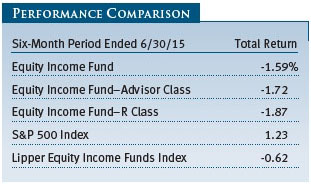
Dividends accounted for the bulk of the S&P 500 Index’s return during the first half of the year. The Equity Income Fund returned -1.59% during the six-month period ended June 30, 2015, compared with 1.23% for the S&P 500 Index and -0.62% for the Lipper Equity Income Funds Index. (Returns for the Advisor and R Class shares are also shown and reflect their different fee structures.) Weakness in fixed income, which affected higher-yielding stocks, took a toll on fund results during the period. In addition, our holdings in the energy sector, which declined sharply as oil prices remained volatile, trimmed fund performance.
DIVIDEND DISTRIBUTION
On June 26, 2015, your Board of Trustees declared a second-quarter dividend of $0.17 per share for shareholders of record on the same date, bringing the year-to-date dividend distributions to $0.28 per share. You should have received your check or statement reflecting this most recent distribution. (Distributions for the Advisor and R Class shares were different.)
PORTFOLIO REVIEW
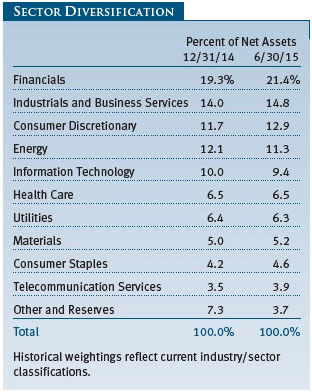
From the beginning of the year to the end of June, there was not much overall movement in equity prices, which masked the dramatic volatility in individual stocks and throughout sectors over the six-month period. As fixed income markets weakened, the electric utility sector was notably weak, with most companies posting price declines in excess of 10%. Oil stocks continued to lose ground, with the sector off almost 5% in the first half.
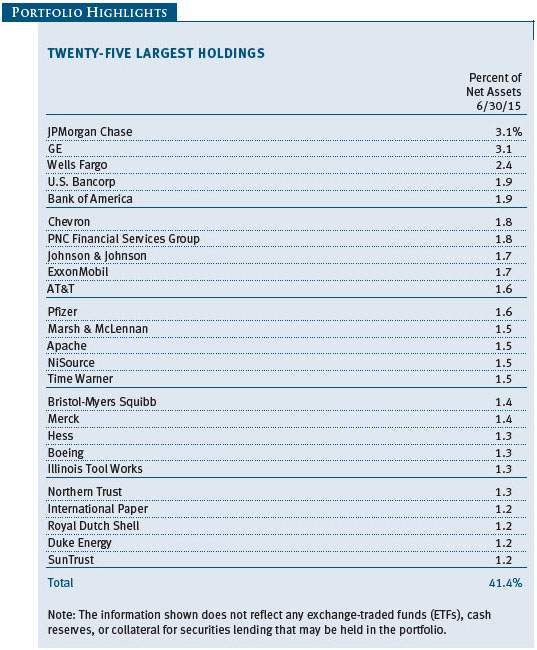
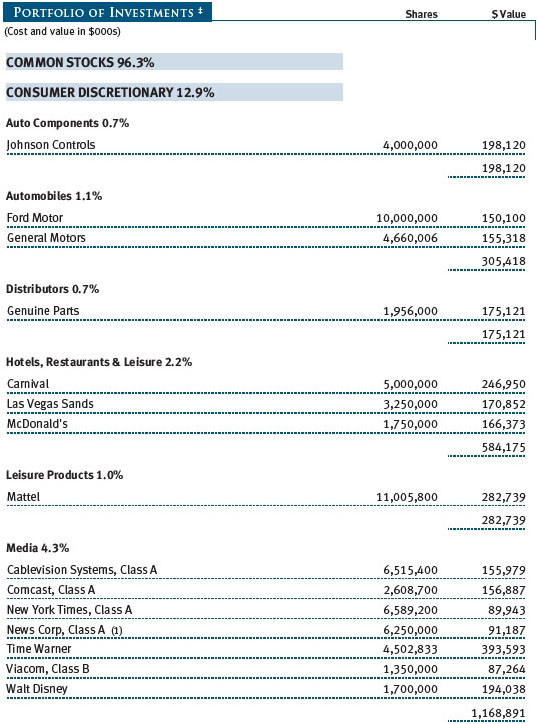
Financials and other sectors performed better, and two of our holdings, JPMorgan Chase and GE, which had underperformed in 2014, contributed positively to fund results in the first half. Other portfolio holdings, such as Vulcan Materials, Boeing, Harris, Stanley Black & Decker, Walt Disney, Bristol-Myers Squibb, and Pfizer, were profitable investments. Our disappointments included several energy stocks—Apache, Chevron, and Royal Dutch Shell among them. American Express struggled through the period. A few technology holdings, which included Qualcomm and Corning, also detracted from performance. (Please refer to the fund’s portfolio of investments for a complete list of holdings and the amount each represents in the portfolio.)
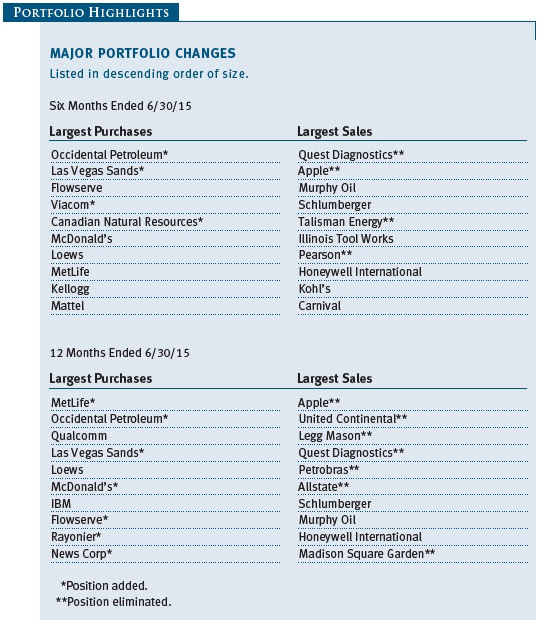
The Major Portfolio Changes table shows that we invested in companies that have the characteristics we like to see in our portfolio. Occidental Petroleum, Las Vegas Sands, and Canadian Natural Resources are examples of firms that have been out of favor and exhibit contrarian appeal. Their recent price declines have created opportunities to initiate positions in solid companies with undervalued stocks. Their dividend yields are attractive, and we believe their share prices do not reflect the underlying value of the companies.

Regarding our sales, we eliminated Quest Diagnostics and Apple, and we reduced our exposure to Murphy Oil. Both Quest Diagnostics and Apple had performed well for us, and they advanced to the point where we felt that other investment opportunities were more attractive.
OUTLOOK
We expect steady, albeit modest, economic growth in the second half of the year. Earnings growth should be similarly modest as the impact of lower oil prices and the strong U.S. dollar should continue to weigh on S&P 500 earnings. While record corporate profit margins have had a positive effect on earnings, we believe that there will be some downward pressure on margins as the economy continues to grow and cost pressures rise. Investors continue to focus on every statement from the Federal Reserve, which is suggesting that it is likely to raise rates sometime in the second half. The Fed will evaluate both global economic conditions and the underlying tone of the U.S. economy as it considers its next move. With equity valuations neutral at best, we have modest expectations for stock price gains in the second half of the year. As always, we hope to be pleasantly surprised if our expectations are exceeded.
In closing, we announced last year that John Linehan would succeed me as Equity Income Fund portfolio manager on November 1, 2015. Consequently, this will be my last shareholder report to you. John and I have been working together closely to ensure a smooth transition. November 1 will be the 30th anniversary of the introduction of the Equity Income Fund, and it has been an honor for me to work for you during the past three decades. I have every confidence that John will do an outstanding job in the years ahead.
Respectfully submitted,

Brian C. Rogers
President of the fund and chairman of its Investment Advisory Committee
July 20, 2015
The committee chairman has day-to-day responsibility for managing the portfolio and works with committee members in developing and executing the fund’s investment program.
RISKS OF INVESTING IN THE FUND
Value investors seek to invest in companies whose stock prices are low in relation to their real worth or future prospects. By identifying companies whose stocks are currently out of favor or misunderstood, value investors hope to realize significant appreciation as other investors recognize the stock’s intrinsic value and the price rises accordingly. The value approach carries the risk that the market will not recognize a security’s intrinsic value for a long time or that a stock judged to be undervalued may actually be appropriately priced.
GLOSSARY
Dividend yield: The annual dividend of a stock divided by the stock’s price.
Earnings growth rate – current fiscal year: Measures the annualized percent change in earnings per share from the prior fiscal year to the current fiscal year.
Lipper indexes: Fund benchmarks that consist of a small number (10 to 30) of the largest mutual funds in a particular category as tracked by Lipper Inc.
Price-to-earnings (P/E) ratio – current fiscal year: A valuation measure calculated by dividing the price of a stock by its reported earnings per share from the latest fiscal year. The ratio is a measure of how much investors are willing to pay for the company’s earnings. The higher the P/E, the more investors are paying for the company’s current earnings.
Price-to-earnings (P/E) ratio – next fiscal year: A valuation measure calculated by dividing the price of a stock by its estimated earnings for the next fiscal year. The ratio is a measure of how much investors are willing to pay for the company’s future earnings. The higher the P/E, the more investors are paying for the company’s expected earnings growth in the next fiscal year.
Price-to-earnings (P/E) ratio – 12 months forward: A valuation measure calculated by dividing the price of a stock by the analysts’ forecast of the next 12 months’ expected earnings. The ratio is a measure of how much investors are willing to pay for the company’s future earnings. The higher the P/E, the more investors are paying for the company’s earnings growth in the next 12 months.
Projected earnings growth rate (IBES): A company’s expected earnings per share growth rate for a given time period based on the forecast from the Institutional Brokers’ Estimate System, which is commonly referred to as IBES.
S&P 500 Index: An unmanaged index that tracks the stocks of 500 primarily large-cap U.S. companies.
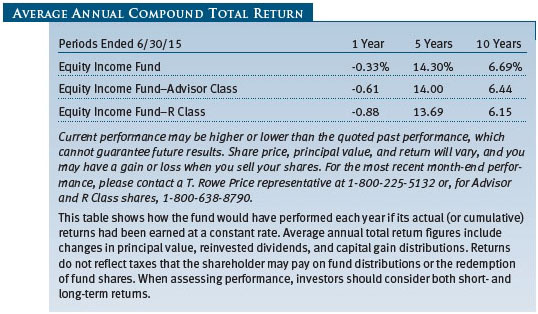
Performance and Expenses
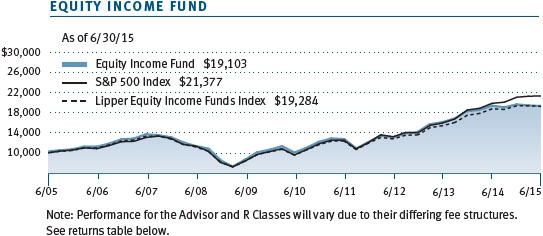
| Growth of $10,000 |
This chart shows the value of a hypothetical $10,000 investment in the fund over the past 10 fiscal year periods or since inception (for funds lacking 10-year records). The result is compared with benchmarks, which may include a broad-based market index and a peer group average or index. Market indexes do not include expenses, which are deducted from fund returns as well as mutual fund averages and indexes.
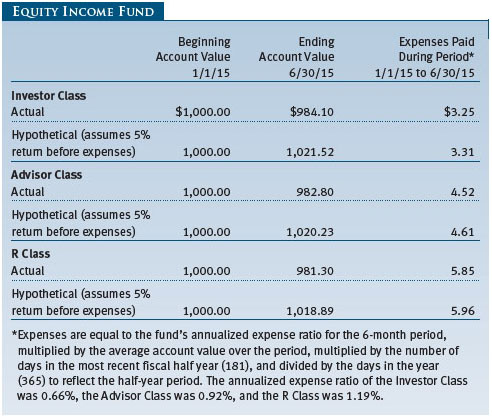
| Fund Expense Example |
As a mutual fund shareholder, you may incur two types of costs: (1) transaction costs, such as redemption fees or sales loads, and (2) ongoing costs, including management fees, distribution and service (12b-1) fees, and other fund expenses. The following example is intended to help you understand your ongoing costs (in dollars) of investing in the fund and to compare these costs with the ongoing costs of investing in other mutual funds. The example is based on an investment of $1,000 invested at the beginning of the most recent six-month period and held for the entire period.
Please note that the fund has three share classes: The original share class (Investor Class) charges no distribution and service (12b-1) fee, Advisor Class shares are offered only through unaffiliated brokers and other financial intermediaries and charge a 0.25% 12b-1 fee, and R Class shares are available to retirement plans serviced by intermediaries and charge a 0.50% 12b-1 fee. Each share class is presented separately in the table.
Actual Expenses
The first line of the following table (Actual) provides information about actual account values and expenses based on the fund’s actual returns. You may use the information on this line, together with your account balance, to estimate the expenses that you paid over the period. Simply divide your account value by $1,000 (for example, an $8,600 account value divided by $1,000 = 8.6), then multiply the result by the number on the first line under the heading “Expenses Paid During Period” to estimate the expenses you paid on your account during this period.
Hypothetical Example for Comparison Purposes
The information on the second line of the table (Hypothetical) is based on hypothetical account values and expenses derived from the fund’s actual expense ratio and an assumed 5% per year rate of return before expenses (not the fund’s actual return). You may compare the ongoing costs of investing in the fund with other funds by contrasting this 5% hypothetical example and the 5% hypothetical examples that appear in the shareholder reports of the other funds. The hypothetical account values and expenses may not be used to estimate the actual ending account balance or expenses you paid for the period.
Note: T. Rowe Price charges an annual account service fee of $20, generally for accounts with less than $10,000. The fee is waived for any investor whose T. Rowe Price mutual fund accounts total $50,000 or more; accounts electing to receive electronic delivery of account statements, transaction confirmations, prospectuses, and shareholder reports; or accounts of an investor who is a T. Rowe Price Preferred Services, Personal Services, or Enhanced Personal Services client (enrollment in these programs generally requires T. Rowe Price assets of at least $100,000). This fee is not included in the accompanying table. If you are subject to the fee, keep it in mind when you are estimating the ongoing expenses of investing in the fund and when comparing the expenses of this fund with other funds.
You should also be aware that the expenses shown in the table highlight only your ongoing costs and do not reflect any transaction costs, such as redemption fees or sales loads. Therefore, the second line of the table is useful in comparing ongoing costs only and will not help you determine the relative total costs of owning different funds. To the extent a fund charges transaction costs, however, the total cost of owning that fund is higher.
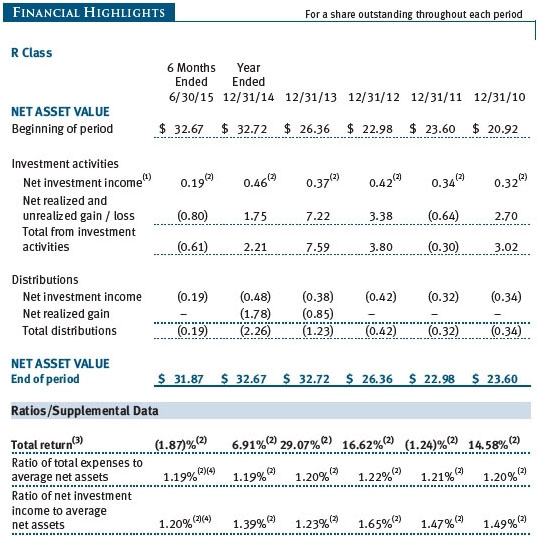
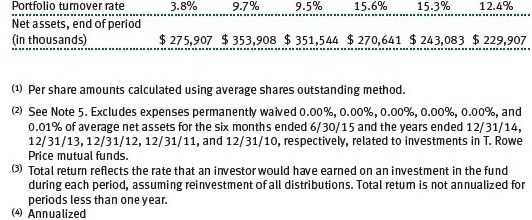
Unaudited

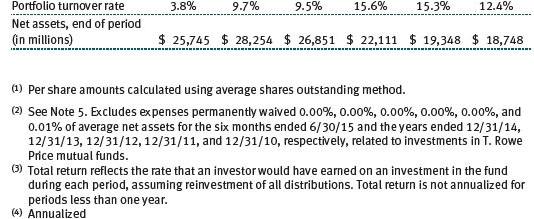
The accompanying notes are an integral part of these financial statements.
Unaudited


The accompanying notes are an integral part of these financial statements.
Unaudited
The accompanying notes are an integral part of these financial statements.
Unaudited


The accompanying notes are an integral part of these financial statements.
Unaudited
The accompanying notes are an integral part of these financial statements.
Unaudited
The accompanying notes are an integral part of these financial statements.
Unaudited
The accompanying notes are an integral part of these financial statements.
Unaudited
| Notes to Financial Statements |
T. Rowe Price Equity Income Fund (the fund), is registered under the Investment Company Act of 1940 (the 1940 Act) as a diversified, open-end management investment company. The fund seeks a high level of dividend income and long-term capital growth primarily through investments in stocks. The fund has three classes of shares: the Equity Income Fund original share class, referred to in this report as the Investor Class, offered since October 31, 1985; the Equity Income Fund–Advisor Class (Advisor Class), offered since March 31, 2000; and the Equity Income Fund–R Class (R Class), offered since September 30, 2002. Advisor Class shares are sold only through unaffiliated brokers and other unaffiliated financial intermediaries, and R Class shares are available to retirement plans serviced by intermediaries. The Advisor Class and R Class each operate under separate Board-approved Rule 12b-1 plans, pursuant to which each class compensates financial intermediaries for distribution, shareholder servicing, and/or certain administrative services. Each class has exclusive voting rights on matters related solely to that class; separate voting rights on matters that relate to all classes; and, in all other respects, the same rights and obligations as the other classes.
NOTE 1 - SIGNIFICANT ACCOUNTING POLICIES
Basis of Preparation The fund is an investment company and follows accounting and reporting guidance in the Financial Accounting Standards Board (FASB) Accounting Standards Codification Topic 946 (ASC 946). The accompanying financial statements were prepared in accordance with accounting principles generally accepted in the United States of America (GAAP), including but not limited to ASC 946. GAAP requires the use of estimates made by management. Management believes that estimates and valuations are appropriate; however, actual results may differ from those estimates, and the valuations reflected in the accompanying financial statements may differ from the value ultimately realized upon sale or maturity.
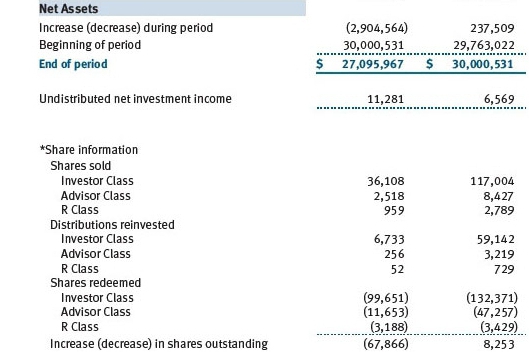
Investment Transactions, Investment Income, and Distributions Income and expenses are recorded on the accrual basis. Dividends received from mutual fund investments are reflected as dividend income; capital gain distributions are reflected as realized gain/loss. Earnings on investments recognized as partnerships for federal income tax purposes reflect the tax character of such earnings. Dividend income and capital gain distributions are recorded on the ex-dividend date. Income tax-related interest and penalties, if incurred, would be recorded as income tax expense. Investment transactions are accounted for on the trade date. Realized gains and losses are reported on the identified cost basis. Distributions to shareholders are recorded on the ex-dividend date. Distributions from REITs are initially recorded as dividend income and, to the extent such represent a return of capital or capital gain for tax purposes, are reclassified when such information becomes available. Income distributions are declared and paid by each class quarterly. Capital gain distributions, if any, are generally declared and paid by the fund annually.
Currency Translation Assets, including investments, and liabilities denominated in foreign currencies are translated into U.S. dollar values each day at the prevailing exchange rate, using the mean of the bid and asked prices of such currencies against U.S. dollars as quoted by a major bank. Purchases and sales of securities, income, and expenses are translated into U.S. dollars at the prevailing exchange rate on the date of the transaction. The effect of changes in foreign currency exchange rates on realized and unrealized security gains and losses is reflected as a component of security gains and losses.
Class Accounting The Advisor Class and R Class each pay distribution, shareholder servicing, and/or certain administrative expenses in the form of Rule 12b-1 fees, in an amount not exceeding 0.25% and 0.50%, respectively, of the class’s average daily net assets. Shareholder servicing, prospectus, and shareholder report expenses incurred by each class are charged directly to the class to which they relate. Expenses common to all classes, investment income, and realized and unrealized gains and losses are allocated to the classes based upon the relative daily net assets of each class.
Rebates Subject to best execution, the fund may direct certain security trades to brokers who have agreed to rebate a portion of the related brokerage commission to the fund in cash. Commission rebates are reflected as realized gain on securities in the accompanying financial statements and totaled $52,000 for the six months ended June 30, 2015.
New Accounting Guidance In June 2014, FASB issued Accounting Standards Update (ASU) No. 2014-11, Transfers and Servicing (Topic 860), Repurchase-to-Maturity Transactions, Repurchase Financings, and Disclosures. The ASU changes the accounting for certain repurchase agreements and expands disclosure requirements related to repurchase agreements, securities lending, repurchase-to-maturity and similar transactions. The ASU is effective for interim and annual reporting periods beginning after December 15, 2014. Adoption will have no effect on the fund’s net assets or results of operations.
In May 2015, FASB issued ASU No. 2015-07, Fair Value Measurement (Topic 820), Disclosures for Investments in Certain Entities That Calculate Net Asset Value per Share (or Its Equivalent). The ASU removes the requirement to categorize within the fair value hierarchy all investments for which fair value is measured using the net asset value per share practical expedient and amends certain disclosure requirements for such investments. The ASU is effective for interim and annual reporting periods beginning after December 15, 2015. Adoption will have no effect on the fund’s net assets or results of operations.
NOTE 2 - VALUATION
The fund’s financial instruments are valued and each class’s net asset value (NAV) per share is computed at the close of the New York Stock Exchange (NYSE), normally 4 p.m. ET, each day the NYSE is open for business.
Fair Value The fund’s financial instruments are reported at fair value, which GAAP defines as the price that would be received to sell an asset or paid to transfer a liability in an orderly transaction between market participants at the measurement date. The T. Rowe Price Valuation Committee (the Valuation Committee) has been established by the fund’s Board of Trustees (the Board) to ensure that financial instruments are appropriately priced at fair value in accordance with GAAP and the 1940 Act. Subject to oversight by the Board, the Valuation Committee develops and oversees pricing-related policies and procedures and approves all fair value determinations. Specifically, the Valuation Committee establishes procedures to value securities; determines pricing techniques, sources, and persons eligible to effect fair value pricing actions; oversees the selection, services, and performance of pricing vendors; oversees valuation-related business continuity practices; and provides guidance on internal controls and valuation-related matters. The Valuation Committee reports to the Board; is chaired by the fund’s treasurer; and has representation from legal, portfolio management and trading, operations, and risk management.
Various valuation techniques and inputs are used to determine the fair value of financial instruments. GAAP establishes the following fair value hierarchy that categorizes the inputs used to measure fair value:
Level 1 – quoted prices (unadjusted) in active markets for identical financial instruments that the fund can access at the reporting date
Level 2 – inputs other than Level 1 quoted prices that are observable, either directly or indirectly (including, but not limited to, quoted prices for similar financial instruments in active markets, quoted prices for identical or similar financial instruments in inactive markets, interest rates and yield curves, implied volatilities, and credit spreads)
Level 3 – unobservable inputs
Observable inputs are developed using market data, such as publicly available information about actual events or transactions, and reflect the assumptions that market participants would use to price the financial instrument. Unobservable inputs are those for which market data are not available and are developed using the best information available about the assumptions that market participants would use to price the financial instrument. GAAP requires valuation techniques to maximize the use of relevant observable inputs and minimize the use of unobservable inputs. When multiple inputs are used to derive fair value, the financial instrument is assigned to the level within the fair value hierarchy based on the lowest-level input that is significant to the fair value of the financial instrument. Input levels are not necessarily an indication of the risk or liquidity associated with financial instruments at that level but rather the degree of judgment used in determining those values.
Valuation Techniques Equity securities listed or regularly traded on a securities exchange or in the over-the-counter (OTC) market are valued at the last quoted sale price or, for certain markets, the official closing price at the time the valuations are made. OTC Bulletin Board securities are valued at the mean of the closing bid and asked prices. A security that is listed or traded on more than one exchange is valued at the quotation on the exchange determined to be the primary market for such security. Listed securities not traded on a particular day are valued at the mean of the closing bid and asked prices for domestic securities and the last quoted sale or closing price for international securities.
For valuation purposes, the last quoted prices of non-U.S. equity securities may be adjusted to reflect the fair value of such securities at the close of the NYSE. If the fund determines that developments between the close of a foreign market and the close of the NYSE will, in its judgment, materially affect the value of some or all of its portfolio securities, the fund will adjust the previous quoted prices to reflect what it believes to be the fair value of the securities as of the close of the NYSE. In deciding whether it is necessary to adjust quoted prices to reflect fair value, the fund reviews a variety of factors, including developments in foreign markets, the performance of U.S. securities markets, and the performance of instruments trading in U.S. markets that represent foreign securities and baskets of foreign securities. The fund may also fair value securities in other situations, such as when a particular foreign market is closed but the fund is open. The fund uses outside pricing services to provide it with quoted prices and information to evaluate or adjust those prices. The fund cannot predict how often it will use quoted prices and how often it will determine it necessary to adjust those prices to reflect fair value. As a means of evaluating its security valuation process, the fund routinely compares quoted prices, the next day’s opening prices in the same markets, and adjusted prices.
Actively traded domestic equity securities generally are categorized in Level 1 of the fair value hierarchy. Non-U.S. equity securities generally are categorized in Level 2 of the fair value hierarchy despite the availability of quoted prices because, as described above, the fund evaluates and determines whether those quoted prices reflect fair value at the close of the NYSE or require adjustment. OTC Bulletin Board securities, certain preferred securities, and equity securities traded in inactive markets generally are categorized in Level 2 of the fair value hierarchy.
Investments in mutual funds are valued at the mutual fund’s closing NAV per share on the day of valuation and are categorized in Level 1 of the fair value hierarchy. Assets and liabilities other than financial instruments, including short-term receivables and payables, are carried at cost, or estimated realizable value, if less, which approximates fair value.
Thinly traded financial instruments and those for which the above valuation procedures are inappropriate or are deemed not to reflect fair value are stated at fair value as determined in good faith by the Valuation Committee. The objective of any fair value pricing determination is to arrive at a price that could reasonably be expected from a current sale. Financial instruments fair valued by the Valuation Committee are primarily private placements, restricted securities, warrants, rights, and other securities that are not publicly traded.
Subject to oversight by the Board, the Valuation Committee regularly makes good faith judgments to establish and adjust the fair valuations of certain securities as events occur and circumstances warrant. For instance, in determining the fair value of an equity investment with limited market activity, such as a private placement or a thinly traded public company stock, the Valuation Committee considers a variety of factors, which may include, but are not limited to, the issuer’s business prospects, its financial standing and performance, recent investment transactions in the issuer, new rounds of financing, negotiated transactions of significant size between other investors in the company, relevant market valuations of peer companies, strategic events affecting the company, market liquidity for the issuer, and general economic conditions and events. In consultation with the investment and pricing teams, the Valuation Committee will determine an appropriate valuation technique based on available information, which may include both observable and unobservable inputs. The Valuation Committee typically will afford greatest weight to actual prices in arm’s length transactions, to the extent they represent orderly transactions between market participants; transaction information can be reliably obtained; and prices are deemed representative of fair value. However, the Valuation Committee may also consider other valuation methods such as market-based valuation multiples; a discount or premium from market value of a similar, freely traded security of the same issuer; or some combination. Fair value determinations are reviewed on a regular basis and updated as information becomes available, including actual purchase and sale transactions of the issue. Because any fair value determination involves a significant amount of judgment, there is a degree of subjectivity inherent in such pricing decisions, and fair value prices determined by the Valuation Committee could differ from those of other market participants. Depending on the relative significance of unobservable inputs, including the valuation technique(s) used, fair valued securities may be categorized in Level 2 or 3 of the fair value hierarchy.
Valuation Inputs The following table summarizes the fund’s financial instruments, based on the inputs used to determine their fair values on June 30, 2015:
![]()
There were no material transfers between Levels 1 and 2 during the six months ended June 30, 2015.
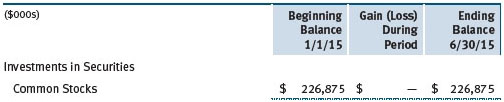
Following is a reconciliation of the fund’s Level 3 holdings for the six months ended June 30, 2015. Gain (loss) reflects both realized and change in unrealized gain/loss on Level 3 holdings during the period, if any, and is included on the accompanying Statement of Operations. The change in unrealized gain/loss on Level 3 instruments held at June 30, 2015, totaled $0 for the six months ended June 30, 2015.
NOTE 3 - OTHER INVESTMENT TRANSACTIONS
Consistent with its investment objective, the fund engages in the following practices to manage exposure to certain risks and/or to enhance performance. The investment objective, policies, program, and risk factors of the fund are described more fully in the fund’s prospectus and Statement of Additional Information.
Restricted Securities The fund may invest in securities that are subject to legal or contractual restrictions on resale. Prompt sale of such securities at an acceptable price may be difficult and may involve substantial delays and additional costs.
Other Purchases and sales of portfolio securities other than short-term securities aggregated $1,053,600,000 and $2,022,392,000, respectively, for the six months ended June 30, 2015.
NOTE 4 - FEDERAL INCOME TAXES
No provision for federal income taxes is required since the fund intends to continue to qualify as a regulated investment company under Subchapter M of the Internal Revenue Code and distribute to shareholders all of its taxable income and gains. Distributions determined in accordance with federal income tax regulations may differ in amount or character from net investment income and realized gains for financial reporting purposes. Financial reporting records are adjusted for permanent book/tax differences to reflect tax character but are not adjusted for temporary differences. The amount and character of tax-basis distributions and composition of net assets are finalized at fiscal year-end; accordingly, tax-basis balances have not been determined as of the date of this report.
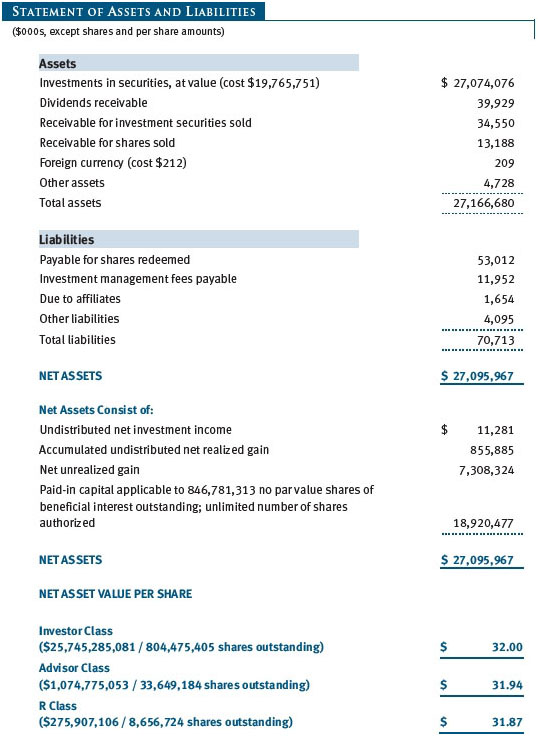
At June 30, 2015, the cost of investments for federal income tax purposes was $19,789,736,000. Net unrealized gain aggregated $7,284,339,000 at period-end, of which $8,728,037,000 related to appreciated investments and $1,443,698,000 related to depreciated investments.
NOTE 5 - RELATED PARTY TRANSACTIONS
The fund is managed by T. Rowe Price Associates, Inc. (Price Associates), a wholly owned subsidiary of T. Rowe Price Group, Inc. (Price Group). The investment management agreement between the fund and Price Associates provides for an annual investment management fee, which is computed daily and paid monthly. The fee consists of an individual fund fee and a group fee. The individual fund fee is equal to 0.25% of the fund’s average daily net assets up to $15 billion and 0.21% of the fund’s average daily net assets in excess of $15 billion. The group fee rate is calculated based on the combined net assets of certain mutual funds sponsored by Price Associates (the group) applied to a graduated fee schedule, with rates ranging from 0.48% for the first $1 billion of assets to 0.275% for assets in excess of $400 billion. The fund’s group fee is determined by applying the group fee rate to the fund’s average daily net assets. At June 30, 2015, the effective annual group fee rate was 0.29%.
In addition, the fund has entered into service agreements with Price Associates and two wholly owned subsidiaries of Price Associates (collectively, Price). Price Associates computes the daily share prices and provides certain other administrative services to the fund. T. Rowe Price Services, Inc., provides shareholder and administrative services in its capacity as the fund’s transfer and dividend-disbursing agent. T. Rowe Price Retirement Plan Services, Inc., provides subaccounting and recordkeeping services for certain retirement accounts invested in the Investor Class and R Class. For the six months ended June 30, 2015, expenses incurred pursuant to these service agreements were $72,000 for Price Associates; $2,918,000 for T. Rowe Price Services, Inc.; and $3,973,000 for T. Rowe Price Retirement Plan Services, Inc. The total amount payable at period-end pursuant to these service agreements is reflected as Due to Affiliates in the accompanying financial statements.
Additionally, the fund is one of several mutual funds in which certain college savings plans managed by Price Associates may invest. As approved by the fund’s Board of Trustees, shareholder servicing costs associated with each college savings plan are borne by the fund in proportion to the average daily value of its shares owned by the college savings plan. For the six months ended June 30, 2015, the fund was charged $211,000 for shareholder servicing costs related to the college savings plans, of which $127,000 was for services provided by Price. The amount payable at period-end pursuant to this agreement is reflected as Due to Affiliates in the accompanying financial statements. At June 30, 2015, approximately 1% of the outstanding shares of the Investor Class were held by college savings plans.
The fund is also one of several mutual funds sponsored by Price Associates (underlying Price funds) in which the T. Rowe Price Spectrum Funds (Spectrum Funds) may invest. The Spectrum Funds do not invest in the underlying Price funds for the purpose of exercising management or control. Pursuant to a special servicing agreement, expenses associated with the operation of the Spectrum Funds are borne by each underlying Price fund to the extent of estimated savings to it and in proportion to the average daily value of its shares owned by the Spectrum Funds. Expenses allocated under this agreement are reflected as shareholder servicing expense in the accompanying financial statements. For the six months ended June 30, 2015, the fund was allocated $841,000 of Spectrum Funds’ expenses, of which $568,000 related to services provided by Price. At period-end, the amount payable to Price pursuant to this agreement is reflected as Due to Affiliates in the accompanying financial statements. At June 30, 2015, approximately 5% of the outstanding shares of the Investor Class were held by the Spectrum Funds.
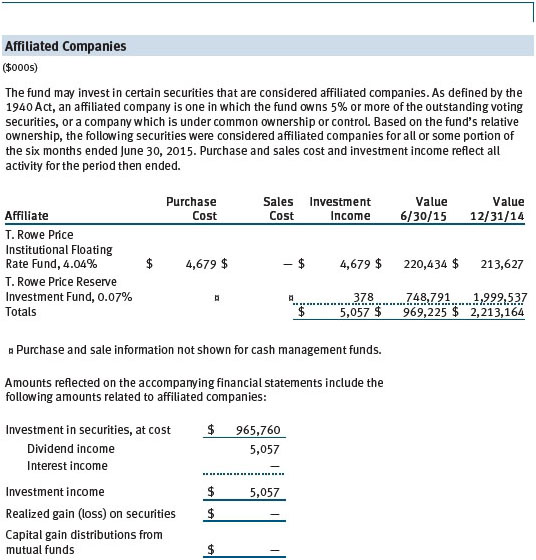
The fund may invest in the T. Rowe Price Reserve Investment Fund, the T. Rowe Price Government Reserve Investment Fund, or the T. Rowe Price Short-Term Reserve Fund (collectively, the Price Reserve Investment Funds), open-end management investment companies managed by Price Associates and considered affiliates of the fund. The Price Reserve Investment Funds are offered as short-term investment options to mutual funds, trusts, and other accounts managed by Price Associates or its affiliates and are not available for direct purchase by members of the public. The Price Reserve Investment Funds pay no investment management fees.
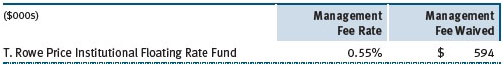
The fund may also invest in certain other T. Rowe Price funds as a means of gaining efficient and cost-effective exposure to certain markets. The fund does not invest for the purpose of exercising management or control; however, investments by the fund may represent a significant portion of an underlying T. Rowe Price fund’s net assets. Each underlying T. Rowe Price fund is an open-end management investment company managed by Price Associates and is considered an affiliate of the fund. To ensure that the fund does not incur duplicate management fees (paid by the underlying T. Rowe Price fund(s) and the fund), Price Associates has agreed to permanently waive a portion of its management fee charged to the fund in an amount sufficient to fully offset that portion of management fees paid by each underlying T. Rowe Price fund related to the fund’s investment therein. The accompanying Statement of Operations reflects management fees permanently waived pursuant to this agreement. Annual fee rates and management fees waived related to investments in the underlying T. Rowe Price fund(s) for the six months ended June 30, 2015, are as follows:
NOTE 6 - LITIGATION
The fund is a named defendant or in a class of defendants in a lawsuit that the Unsecured Creditors Committee (the Committee) of the Tribune Company has filed in Delaware bankruptcy court. The Committee is seeking to recover all payments made to beneficial owners of common stock in connection with a leveraged buyout of Tribune, including those made in connection with a 2007 tender offer in which the fund participated. The fund also is named as a defendant or included in a class of defendants in parallel litigation, which has been dismissed by the district court and is currently on appeal, asserting state law constructive fraudulent transfer claims to recover stock redemption payments made to shareholders. The complaints allege no misconduct by the fund, and management intends to vigorously defend the lawsuits. The value of the proceeds received by the fund is $312,460,000 (1.15% of net assets) and the fund will incur legal expenses. Management is currently assessing the case and has not yet determined the effect, if any, on the fund’s net assets and results of operations.
| Information on Proxy Voting Policies, Procedures, and Records |
A description of the policies and procedures used by T. Rowe Price funds and portfolios to determine how to vote proxies relating to portfolio securities is available in each fund’s Statement of Additional Information. You may request this document by calling 1-800-225-5132 or by accessing the SEC’s website, sec.gov.
The description of our proxy voting policies and procedures is also available on our website, troweprice.com. To access it, click on the words “Social Responsibility” at the top of our corporate homepage. Next, click on the words “Conducting Business Responsibly” on the left side of the page that appears. Finally, click on the words “Proxy Voting Policies” on the left side of the page that appears.
Each fund’s most recent annual proxy voting record is available on our website and through the SEC’s website. To access it through our website, follow the above directions to reach the “Conducting Business Responsibly” page. Click on the words “Proxy Voting Records” on the left side of that page, and then click on the “View Proxy Voting Records” link at the bottom of the page that appears.
| How to Obtain Quarterly Portfolio Holdings |
The fund files a complete schedule of portfolio holdings with the Securities and Exchange Commission for the first and third quarters of each fiscal year on Form N-Q. The fund’s Form N-Q is available electronically on the SEC’s website (sec.gov); hard copies may be reviewed and copied at the SEC’s Public Reference Room, 100 F St. N.E., Washington, DC 20549. For more information on the Public Reference Room, call 1-800-SEC-0330.
| Approval of Investment Management Agreement |
On March 13, 2015, the fund’s Board of Trustees (Board), including a majority of the fund’s independent trustees, approved the continuation of the investment management agreement (Advisory Contract) between the fund and its investment advisor, T. Rowe Price Associates, Inc. (Advisor). In connection with its deliberations, the Board requested, and the Advisor provided, such information as the Board (with advice from independent legal counsel) deemed reasonably necessary. The Board considered a variety of factors in connection with its review of the Advisory Contract, also taking into account information provided by the Advisor during the course of the year, as discussed below:
Services Provided by the Advisor
The Board considered the nature, quality, and extent of the services provided to the fund by the Advisor. These services included, but were not limited to, directing the fund’s investments in accordance with its investment program and the overall management of the fund’s portfolio, as well as a variety of related activities such as financial, investment operations, and administrative services; compliance; maintaining the fund’s records and registrations; and shareholder communications. The Board also reviewed the background and experience of the Advisor’s senior management team and investment personnel involved in the management of the fund, as well as the Advisor’s compliance record. The Board concluded that it was satisfied with the nature, quality, and extent of the services provided by the Advisor.
Investment Performance of the Fund
The Board reviewed the fund’s three-month, one-year, and year-by-year returns, as well as the fund’s average annualized total returns over the 3-, 5-, and 10-year periods, and compared these returns with a wide variety of previously agreed-upon comparable performance measures and market data, including those supplied by Lipper and Morningstar, which are independent providers of mutual fund data.
On the basis of this evaluation and the Board’s ongoing review of investment results, and factoring in the relative market conditions during certain of the performance periods, the Board concluded that the fund’s performance was satisfactory.
Costs, Benefits, Profits, and Economies of Scale
The Board reviewed detailed information regarding the revenues received by the Advisor under the Advisory Contract and other benefits that the Advisor (and its affiliates) may have realized from its relationship with the fund, including any research received under “soft dollar” agreements and commission-sharing arrangements with broker-dealers. The Board considered that the Advisor may receive some benefit from soft-dollar arrangements pursuant to which research is received from broker-dealers that execute the applicable fund’s portfolio transactions. The Board received information on the estimated costs incurred and profits realized by the Advisor from managing T. Rowe Price mutual funds. The Board also reviewed estimates of the profits realized from managing the fund in particular, and the Board concluded that the Advisor’s profits were reasonable in light of the services provided to the fund.
The Board also considered whether the fund benefits under the fee levels set forth in the Advisory Contract from any economies of scale realized by the Advisor. Under the Advisory Contract, the fund pays a fee to the Advisor for investment management services composed of two components—a group fee rate based on the combined average net assets of most of the T. Rowe Price mutual funds (including the fund) that declines at certain asset levels and an individual fund fee rate based on the fund’s average daily net assets—and the fund pays its own expenses of operations. At the March 13, 2015, meeting, the Board approved an additional 0.005% breakpoint to the group fee schedule, effective May 1, 2015. With the new breakpoint, the group fee rate will decline to 0.270% when the combined average net assets of the applicable T. Rowe Price funds exceed $500 billion. The Board concluded that the advisory fee structure for the fund continued to provide for a reasonable sharing of benefits from any economies of scale with the fund’s investors.
Fees
The Board was provided with information regarding industry trends in management fees and expenses, and the Board reviewed the fund’s management fee rate, operating expenses, and total expense ratio (for the fund’s Investor Class, Advisor Class, and R Class) in comparison with fees and expenses of other comparable funds based on information and data supplied by Lipper. The information provided to the Board indicated that the fund’s management fee rate was above the median for certain groups of comparable funds and at or below the median for other groups of comparable funds. The information also indicated that the total expense ratio for the Investor Class was above the median for certain groups of comparable funds and at or below the median for other groups of comparable funds, the total expense ratio for the Advisor Class was below the median for comparable funds, and the total expense ratio for the R Class was above the median for comparable funds.
The Board also reviewed the fee schedules for institutional accounts and private accounts with similar mandates that are advised or subadvised by the Advisor and its affiliates. Management provided the Board with information about the Advisor’s responsibilities and services provided to institutional account clients, including information about how the requirements and economics of the institutional business are fundamentally different from those of the mutual fund business. The Board considered information showing that the mutual fund business is generally more complex from a business and compliance perspective than the institutional business and that the Advisor generally performs significant additional services and assumes greater risk in managing the fund and other T. Rowe Price mutual funds than it does for institutional account clients.
On the basis of the information provided and the factors considered, the Board concluded that the fees paid by the fund under the Advisory Contract are reasonable.
Approval of the Advisory Contract
As noted, the Board approved the continuation of the Advisory Contract. No single factor was considered in isolation or to be determinative to the decision. Rather, the Board concluded, in light of a weighting and balancing of all factors considered, that it was in the best interests of the fund and its shareholders for the Board to approve the continuation of the Advisory Contract (including the fees to be charged for services thereunder). The independent trustees were advised throughout the process by independent legal counsel.
Item 2. Code of Ethics.
A code of ethics, as defined in Item 2 of Form N-CSR, applicable to its principal executive officer, principal financial officer, principal accounting officer or controller, or persons performing similar functions is filed as an exhibit to the registrant’s annual Form N-CSR. No substantive amendments were approved or waivers were granted to this code of ethics during the registrant’s most recent fiscal half-year.
Item 3. Audit Committee Financial Expert.
Disclosure required in registrant’s annual Form N-CSR.
Item 4. Principal Accountant Fees and Services.
Disclosure required in registrant’s annual Form N-CSR.
Item 5. Audit Committee of Listed Registrants.
Not applicable.
Item 6. Investments.
(a) Not applicable. The complete schedule of investments is included in Item 1 of this Form N-CSR.
(b) Not applicable.
Item 7. Disclosure of Proxy Voting Policies and Procedures for Closed-End Management Investment Companies.
Not applicable.
Item 8. Portfolio Managers of Closed-End Management Investment Companies.
Not applicable.
Item 9. Purchases of Equity Securities by Closed-End Management Investment Company and Affiliated Purchasers.
Not applicable.
Item 10. Submission of Matters to a Vote of Security Holders.
Not applicable.
Item 11. Controls and Procedures.
(a) The registrant’s principal executive officer and principal financial officer have evaluated the registrant’s disclosure controls and procedures within 90 days of this filing and have concluded that the registrant’s disclosure controls and procedures were effective, as of that date, in ensuring that information required to be disclosed by the registrant in this Form N-CSR was recorded, processed, summarized, and reported timely.
(b) The registrant’s principal executive officer and principal financial officer are aware of no change in the registrant’s internal control over financial reporting that occurred during the registrant’s second fiscal quarter covered by this report that has materially affected, or is reasonably likely to materially affect, the registrant’s internal control over financial reporting.
Item 12. Exhibits.
(a)(1) The registrant’s code of ethics pursuant to Item 2 of Form N-CSR is filed with the registrant’s annual Form N-CSR.
(2) Separate certifications by the registrant's principal executive officer and principal financial officer, pursuant to Section 302 of the Sarbanes-Oxley Act of 2002 and required by Rule 30a-2(a) under the Investment Company Act of 1940, are attached.
(3) Written solicitation to repurchase securities issued by closed-end companies: not applicable.
(b) A certification by the registrant's principal executive officer and principal financial officer, pursuant to Section 906 of the Sarbanes-Oxley Act of 2002 and required by Rule 30a-2(b) under the Investment Company Act of 1940, is attached.
SIGNATURES
Pursuant to the requirements of the Securities Exchange Act of 1934 and the Investment Company Act of 1940, the registrant has duly caused this report to be signed on its behalf by the undersigned, thereunto duly authorized.
T. Rowe Price Equity Income Fund
| By | /s/ Edward C. Bernard | |
| Edward C. Bernard | ||
| Principal Executive Officer | ||
| Date August 17, 2015 | ||
Pursuant to the requirements of the Securities Exchange Act of 1934 and the Investment Company Act of 1940, this report has been signed below by the following persons on behalf of the registrant and in the capacities and on the dates indicated.
| By | /s/ Edward C. Bernard | |
| Edward C. Bernard | ||
| Principal Executive Officer | ||
| Date August 17, 2015 | ||
| By | /s/ Catherine D. Mathews | |
| Catherine D. Mathews | ||
| Principal Financial Officer | ||
| Date August 17, 2015 | ||