
Acquisition of Peoples Federal Bancshares, Inc. (NASDAQ: PEOP) 1 Exhibit 99.1
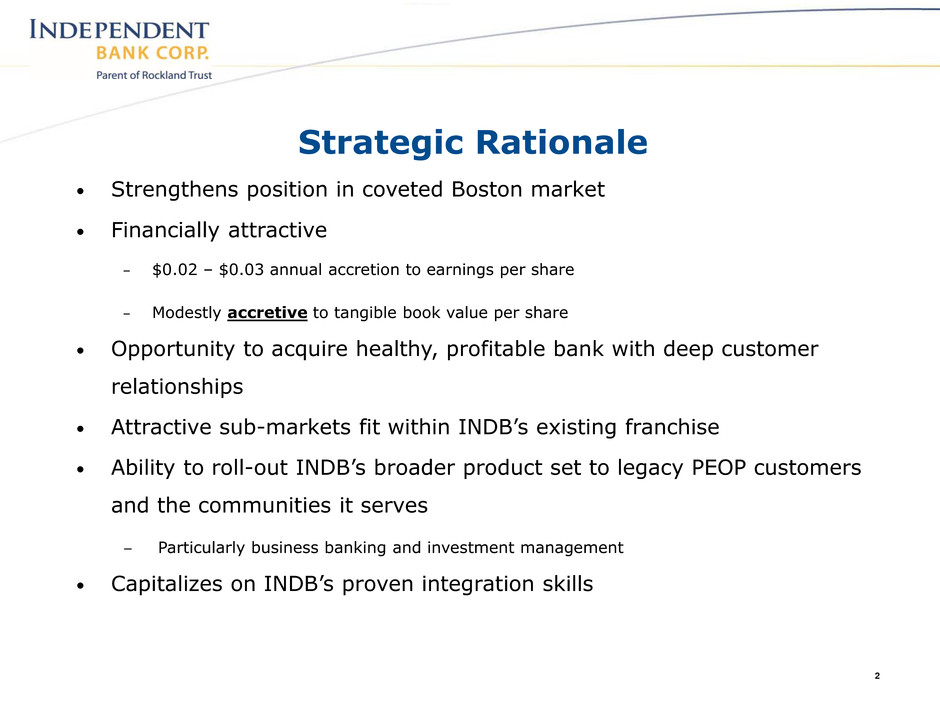
Strategic Rationale • Strengthens position in coveted Boston market • Financially attractive – $0.02 – $0.03 annual accretion to earnings per share – Modestly accretive to tangible book value per share • Opportunity to acquire healthy, profitable bank with deep customer relationships • Attractive sub-markets fit within INDB’s existing franchise • Ability to roll-out INDB’s broader product set to legacy PEOP customers and the communities it serves − Particularly business banking and investment management • Capitalizes on INDB’s proven integration skills 2

Overview of Peoples Federal Bancshares, Inc. • Peoples Federal Bancshares Inc. – Ticker: PEOP – Founded in 1888 • Operates 8 branches in the Greater Boston area – Headquartered in Boston, MA – 4 Branches in the City of Boston Financial Highlights Assets: $606mm Cost of Deposits: 0.42% Gross Loans: $497mm NIM: 3.16% Total Deposits: $435mm Efficiency Ratio: 81% TCE: $104mm NPAs / Assets: 0.30% LTM Net Income: $2.1mm LTM Net Charge Offs: 0.00% Note: Financial data at June 30, 2014 or the most recent quarter available Source: SNL Financial INDB (78) PEOP (8)

• 1st retail locations in Boston • Complements recent commercial lending and IMG office opening in downtown Boston • Solidifies prior investments North and West of the city of Boston • Capitalizes on long-established commercial lending presence in Boston • Provides access to dense small business markets 4 Enhanced Presence in Greater Boston Meaningful Entrance Into Attractive Boston Sub-Markets Brighton Jamaica Plain West Roxbury Allston Rank Institution (ST) Market Share (%) 1 Royal Bank of Scotland Group 31.2 2 Bank of America Corp. (NC) 26.4 3 Peoples Federal Bancshares Inc (MA) 20.5 4 Banco Santander 10.8 5 Commerce Bancshares Corp. (MA) 5.3 6 Toronto-Dominion Bank 3.8 7 Citigroup Inc. (NY) 2.0 Rank Institution (ST) Market Share (%) 1 Royal Bank of Scotland Group 36.2 2 Eastern Bank Corp. (MA) 23.5 3 Meridian Bancorp Inc. (MA) 18.1 4 Bank of America Corp. (NC) 10.1 5 Peoples Federal Bancshares Inc (MA) 7.8 6 Commonwealth Co-operative Bank (MA) 4.4 Rank Institution (ST) Market Share (%) 1 Royal Bank of Scotland Group 31.7 2 Blue Hills Bancorp Inc (MA) 19.1 3 Brookline Bancorp Inc. (MA) 13.4 4 Cooperative Bank (MA) 11.3 5 Banco Santander 9.5 6 Peoples Federal Bancshares Inc (MA) 7.4 7 Meridian Bancorp Inc. (MA) 5.0 8 Eastern Bank Corp. (MA) 1.6 9 Toronto-Dominion Bank 1.1 Rank Institution (ST) Market Share (%) 1 Bank of America Corp. (NC) 38.8 2 Royal Bank of S otland Group 20.4 3 Peoples Federal Bancshares Inc (MA) 14.8 4 Century Bancorp Inc. (MA) 13.3 5 Toronto-Dominion Bank 10.2 6 Meridian Bancorp Inc. (MA) 2.6 Source: SNL Financial
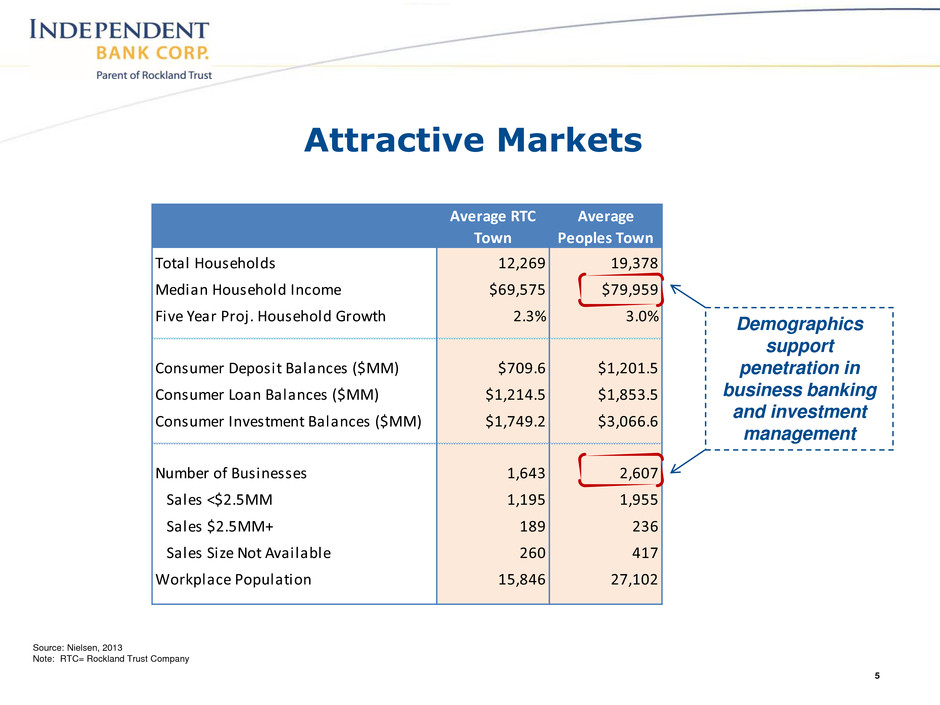
Attractive Markets 5 Source: Nielsen, 2013 Note: RTC= Rockland Trust Company Demographics support penetration in business banking and investment management Average RTC Town Average Peoples Town Total Households 12,269 19,378 Median Household Income $69,575 $79,959 Five Year Proj. Household Growth 2.3% 3.0% Consumer Deposit Balances ($MM) $709.6 $1,201.5 Consumer Loan Balances ($MM) $1,214.5 $1,853.5 Consumer Investment Balances ($MM) $1,749.2 $3,066.6 Number of Businesses 1,643 2,607 Sales <$2.5MM 1,195 1,955 Sales $2.5MM+ 189 236 Sales Size Not Avail ble 260 417 Workplace Population 15,846 27,102

INDB Winning Businesses – Opportunities Investment Management Commercial Banking Retail and Consumer PEOP Customer Base -Almost $2.5 billion AUA -Wealth/Institutional -Strong referral network -Sophisticated products -Expanded presence -In depth market knowledge -Award winning customer service -Electronic/mobile banking -Competitive home equity products Capitalizing on Rockland Trust Brand 6
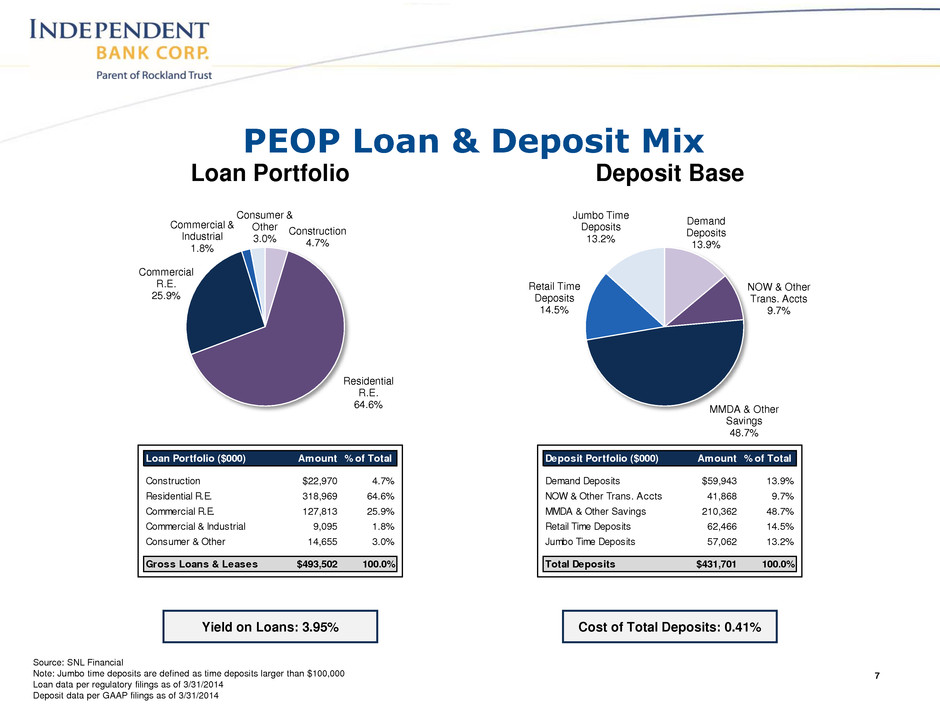
PEOP Loan & Deposit Mix Loan Portfolio Deposit Base 7 Yield on Loans: 3.95% Construction 4.7% Residential R.E. 64.6% Commercial R.E. 25.9% Commercial & Industrial 1.8% Consumer & Other 3.0% Loan Portfolio ($000) Amount % of Total Construction $22,970 4.7% Residential R.E. 318,969 64.6% Commercial R.E. 127,813 25.9% Commercial & Industrial 9,095 1.8% Consumer & Other 14,655 3.0% Gross Loans & Leases $493,502 100.0% Cost of Total Deposits: 0.41% Demand Deposits 13.9% NOW & Other Trans. Accts 9.7% MMDA & Other Savings 48.7% Retail Time Deposits 14.5% Jumbo Time Deposits 13.2% Deposit Portfolio ($000) Amount % of Total Demand Deposits $59,943 13.9% NOW & Other Trans. Accts 41,868 9.7% MMDA & Other Savings 210,362 48.7% Retail Time Deposits 62,466 14.5% Jumbo Time Deposits 57,062 13.2% Total Deposits $431,701 100.0% Source: SNL Financial Note: Jumbo time deposits are defined as time deposits larger than $100,000 Loan data per regulatory filings as of 3/31/2014 Deposit data per GAAP filings as of 3/31/2014

Multiple Levers to Enhance Performance • Greater efficiency ‒ PEOP LTM Efficiency Ratio 80%+ • Lowering usage of costlier wholesale funds • Employ INDB’s strong business banking platform • Enhance fee revenue ‒ Investment management ‒ Cash Management ‒ Merchant Services 8

Multiples: Core Deposit Premium 7.2% Price / Tangible Book Value 1.23x (1) Based on INDB closing price of $36.17 on 8/4/2014 9 Target: PEOP Implied Transaction Value(1): $130.6 million Implied Transaction Value Per Share(1): $20.39 Form of Consideration: 60% Stock / 40% Cash Per Share Consideration: (1) $21.00 cash, or (2) 0.5523 shares of INDB common stock *subject to election procedures Approvals: Regulatory, PEOP shareholders Expected Closing: First Quarter 2015 Summary of Transaction Terms

10 Financial Impact: EPS Accretion: Est. 1% EPS accretion ($0.02 - $0.03) IRR: 16% Effect on Tangible Book Value: Modestly Accretive Attractive Financial Impact Key Assumptions: Cost Saves: 45% 1x After Tax Restructuring Charges: $8.8 MM Loan Credit Mark: 1% Core Deposit Intangibles: $5.5 MM (1.75%)
Appendix 11

Loan Mix 12 Source: SNL Financial INDB loan data per GAAP filings as of 3/31/2014 PEOP loan data per regulatory filings as of 3/31/2014 Yield on Loans: 4.05% Yield on Loans: 3.95% INDB PEOP Pro Forma Construction 5.0% Residential R.E. 11.2% Commercial R.E. 47.5% Commercial & Industrial 18.7% Consumer & Other 17.6% Construction 4.7% Residential R.E. 64.6% Commercial R.E. 25.9% Commercial & Industrial 1.8% Consumer & Other 3.0% Construction 5.0% Residential R.E. 16.2% Commercial R.E. 45.5% Commercial & Industrial 17.2% Consumer & Other 16.2% Loan Portfolio ($000) Amount % of Total Construction $239,536 5.0% Residential R.E. 538,626 11.2% Commercial R.E. 2,282,939 47.5% Commercial & Industrial 900,656 18.7% Consumer & Other 845,512 17.6% Gross Loans & Leases $4,807,269 100.0% Loan Portfolio ($000) Amount % of Total Construction $22,970 4.7% Residential R.E. 318,969 64.6% Commercial R.E. 127,813 25.9% Commercial & Industrial 9,095 1.8% Consumer & Other 14,655 3.0% Gross Loans & Leases $493,502 100.0% L an Portfolio ($000) Amount % of Total Construction $262,506 5.0% Residential R.E. 857,595 16.2% Commercial R.E. 2,410,752 45.5% Commercial & Industrial 909,751 17.2% Consumer & Other 860,167 16.2% Gross Loans & Leases $5,300,771 100.0%
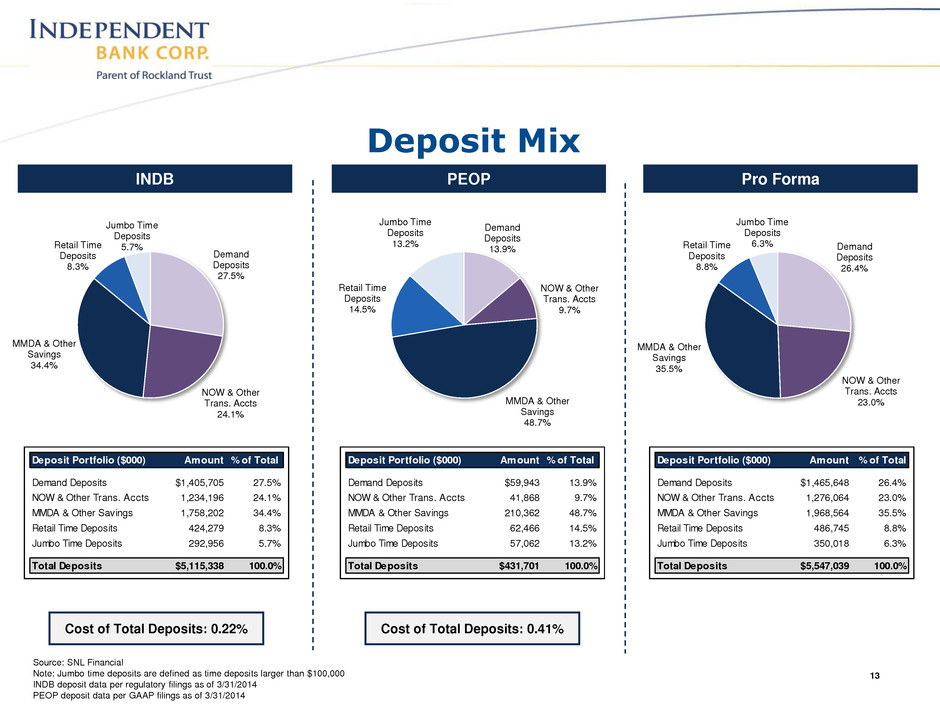
Deposit Mix 13 Source: SNL Financial Note: Jumbo time deposits are defined as time deposits larger than $100,000 INDB deposit data per regulatory filings as of 3/31/2014 PEOP deposit data per GAAP filings as of 3/31/2014 Cost of Total Deposits: 0.22% Cost of Total Deposits: 0.41% INDB PEOP Pro Forma Demand Deposits 27.5% NOW & Other Trans. Accts 24.1% MMDA & Other Savings 34.4% Retail Time Deposits 8.3% Jumbo Time Deposits 5.7% Demand Deposits 13.9% NOW & Other Trans. Accts 9.7% MMDA & Other Savings 48.7% Retail Time Deposits 14.5% Jumbo Time Deposits 13.2% Demand Deposits 26.4% NOW & Other Trans. Accts 23.0% MMDA & Other Savings 35.5% Retail Time Deposits 8.8% Jumbo Time Deposits 6.3% Deposit Portfolio ($000) Amount % of Total Demand Deposits $1,405,705 27.5% NOW & Other Trans. Accts 1,234,196 24.1% MMDA & Other Savings 1,758,202 34.4% Retail Time Deposits 424,279 8.3% Jumbo Time Deposits 292,956 5.7% Total Deposits $5,115,338 100.0% Deposit Portfolio ($000) Amount % of Total Demand Deposits $59,943 13.9% NOW & Other Trans. Accts 41,868 9.7% MMDA & Other Savings 210,362 48.7% Retail Time Deposits 62,466 14.5% Jumbo Time Deposits 57,062 13.2% Total Deposits $431,701 100.0% Deposit Portfolio ($000) Amount % of Total Demand Deposits $1,465,648 26.4% NOW & Other Trans. Accts 1,276,064 23.0% MMDA & Other Savings 1,968,564 35.5% Retail Time Deposits 486,745 8.8% Jumbo Time Deposits 350,018 6.3% Total Deposits $5,547,039 100.0%


