Sandler O'Neill East Coast Financial Services Conference November 6 -7, 2018 Christopher Oddleifson - President and CEO Robert Cozzone - Chief Financial Officer Mark Ruggiero - Controller and Chief Accounting Officer
Who We Are • Main Sub: Rockland Trust • Market: Eastern Massachusetts • Loans: $6.5B • Deposits: $7.0B • $AUA: $3.6B • Market Cap: $2.2B • NASDAQ: INDB (2)
Key Messages • Operating earnings and returns at record levels • Healthy loan and core deposit originations • Growing Investment Management business • Expanding footprint in growth markets • Proven integrator of acquired banks • Tangible book value steadily growing * • Steadily improving operating efficiency • Disciplined risk management culture (3) • Deep, experienced management team * See appendix A for reconciliation
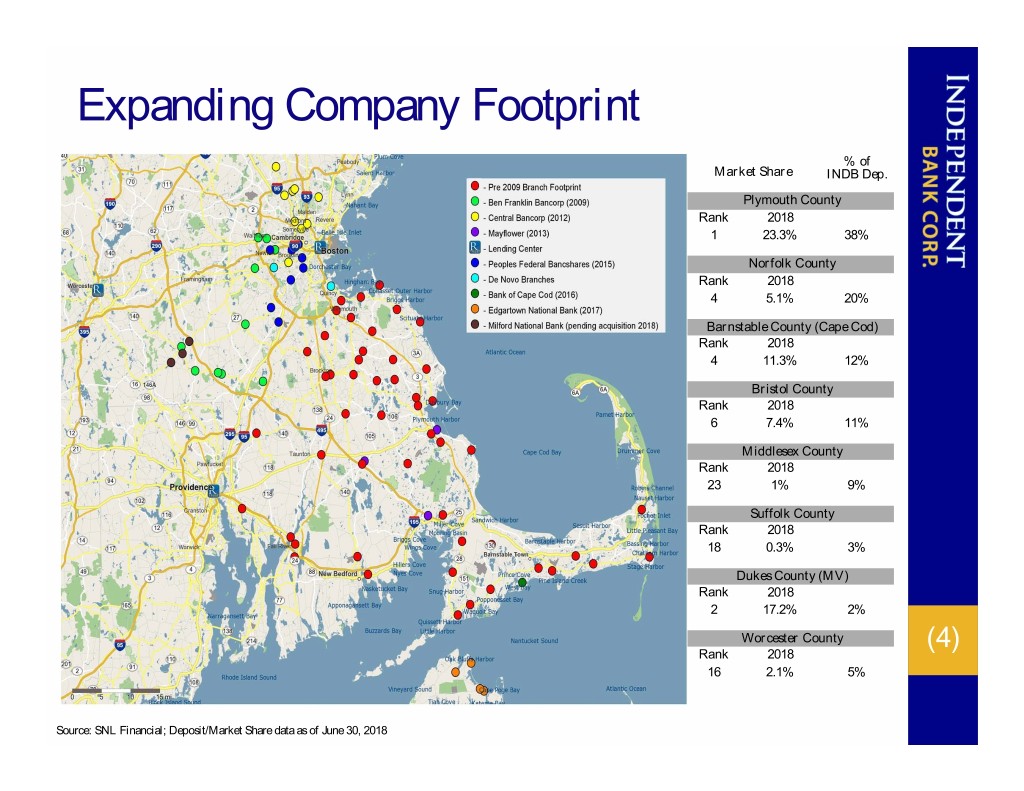
Expanding Company Footprint % of Market Share INDB Dep. Plymouth County Rank 2018 1 23.3% 38% Norfolk County Rank 2018 4 5.1% 20% Barnstable County (Cape Cod) Rank 2018 4 11.3% 12% Bristol County Rank 2018 6 7.4% 11% Middlesex County Rank 2018 23 1% 9% Suffolk County Rank 2018 18 0.3% 3% Dukes County (MV) Rank 2018 2 17.2% 2% Worcester County (4) Rank 2018 16 2.1% 5% Source: SNL Financial; Deposit/Market Share data as of June 30, 2018
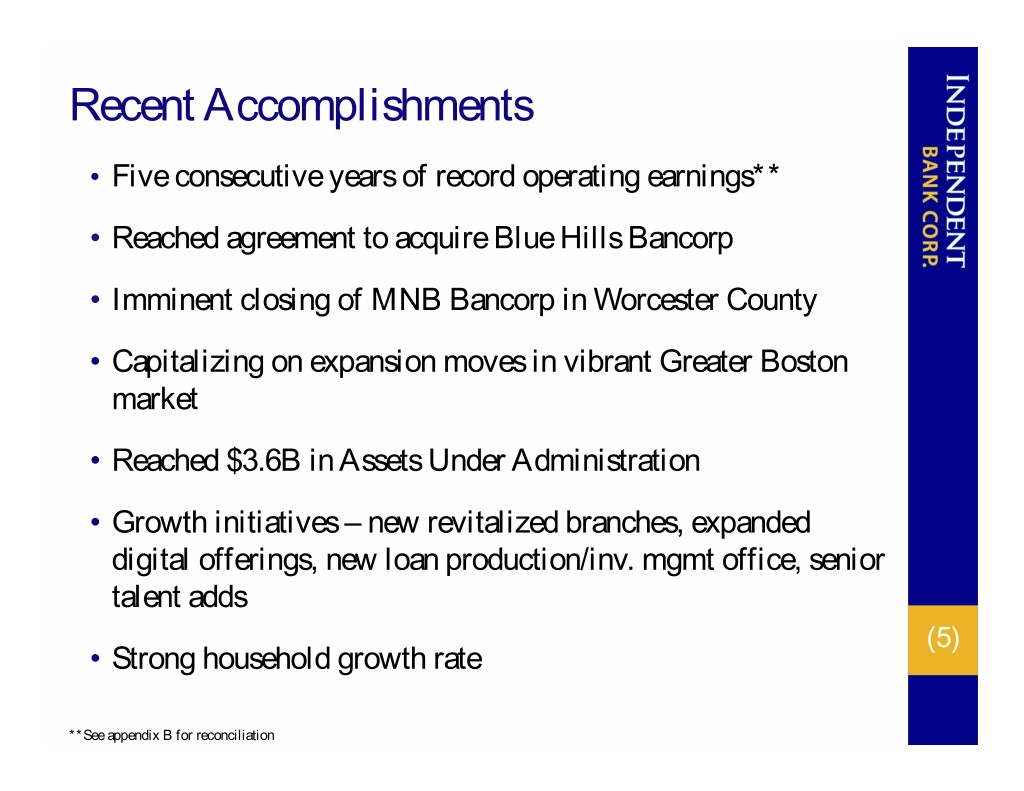
Recent Accomplishments • Five consecutive years of record operating earnings** • Reached agreement to acquire Blue Hills Bancorp • Imminent closing of MNB Bancorp in Worcester County • Capitalizing on expansion moves in vibrant Greater Boston market • Reached $3.6B in Assets Under Administration • Growth initiatives – new revitalized branches, expanded digital offerings, new loan production/inv. mgmt office, senior talent adds (5) • Strong household growth rate **See appendix B for reconciliation
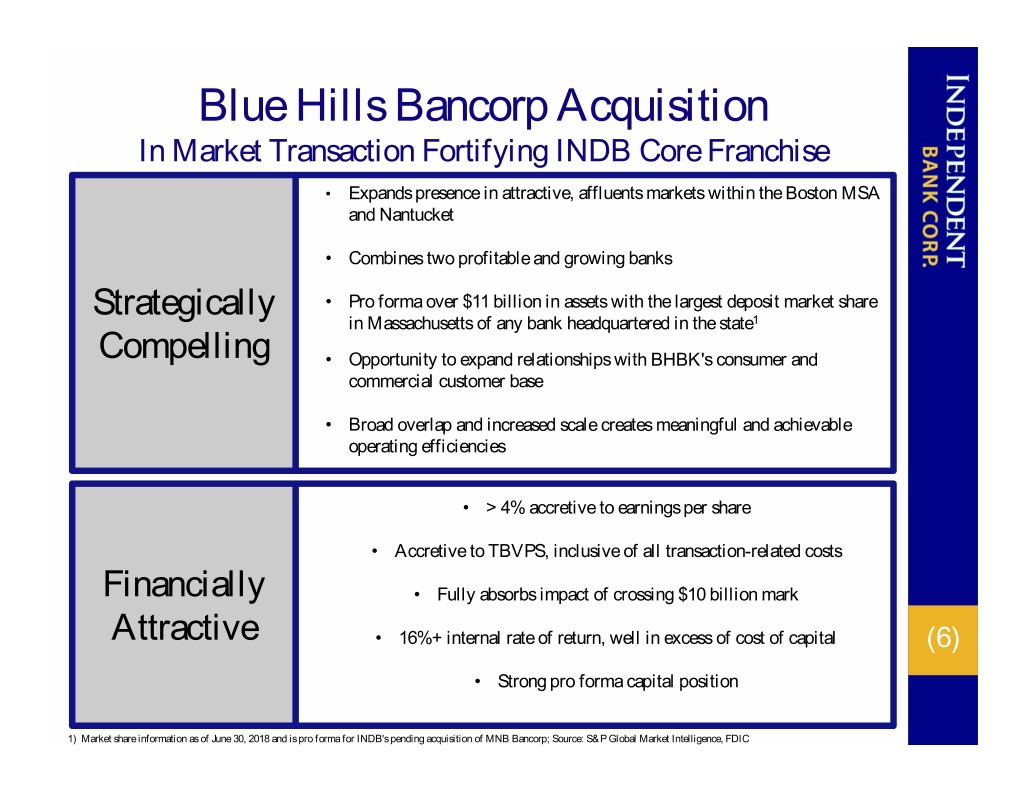
Blue Hills Bancorp Acquisition In Market Transaction Fortifying INDB Core Franchise • Expands presence in attractive, affluents markets within the Boston MSA and Nantucket • Combines two profitable and growing banks Strategically • Pro forma over $11 billion in assets with the largest deposit market share in Massachusetts of any bank headquartered in the state1 Compelling • Opportunity to expand relationships with BHBK's consumer and commercial customer base • Broad overlap and increased scale creates meaningful and achievable operating efficiencies • > 4% accretive to earnings per share • Accretive to TBVPS, inclusive of all transaction-related costs Financially • Fully absorbs impact of crossing $10 billion mark Attractive • 16%+ internal rate of return, well in excess of cost of capital (6) • Strong pro forma capital position 1) Market share information as of June 30, 2018 and is pro forma for INDB's pending acquisition of MNB Bancorp; Source: S&P Global Market Intelligence, FDIC
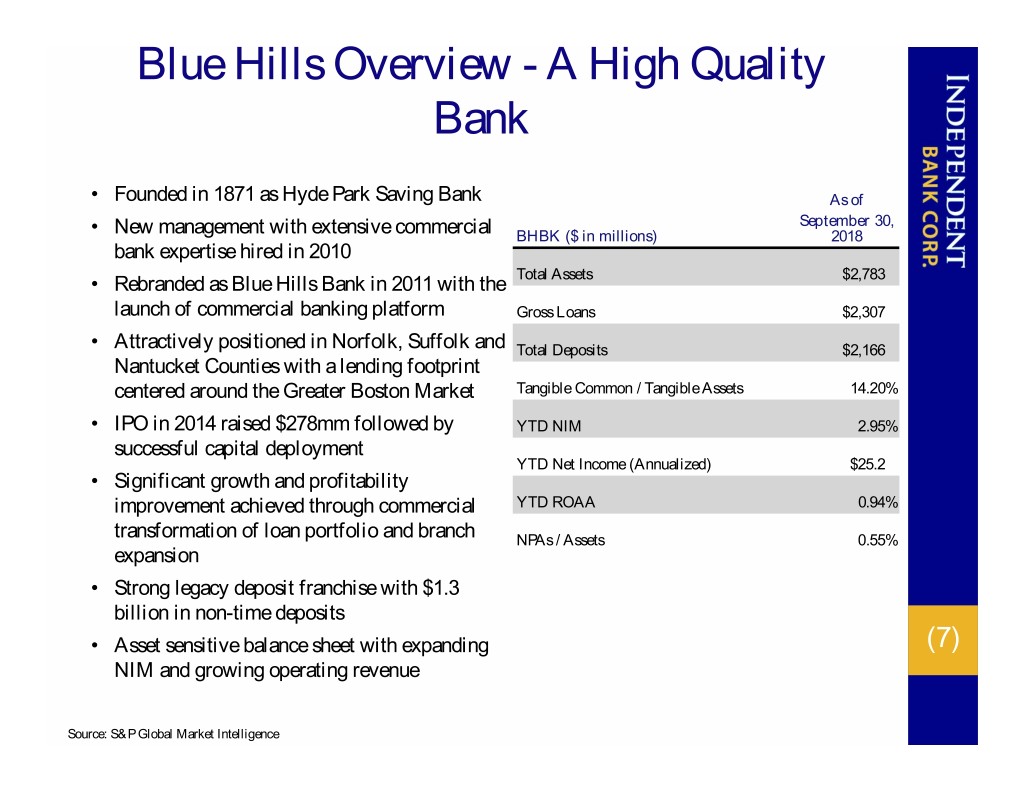
Blue Hills Overview - A High Quality Bank • Founded in 1871 as Hyde Park Saving Bank As of September 30, • New management with extensive commercial BHBK ($ in millions) 2018 bank expertise hired in 2010 • Rebranded as Blue Hills Bank in 2011 with the Total Assets $2,783 launch of commercial banking platform Gross Loans $2,307 • Attractively positioned in Norfolk, Suffolk and Total Deposits $2,166 Nantucket Counties with a lending footprint centered around the Greater Boston Market Tangible Common / Tangible Assets 14.20% • IPO in 2014 raised $278mm followed by YTD NIM 2.95% successful capital deployment YTD Net Income (Annualized) $25.2 • Significant growth and profitability improvement achieved through commercial YTD ROAA 0.94% transformation of loan portfolio and branch NPAs / Assets 0.55% expansion • Strong legacy deposit franchise with $1.3 billion in non-time deposits • Asset sensitive balance sheet with expanding (7) NIM and growing operating revenue Source: S&P Global Market Intelligence
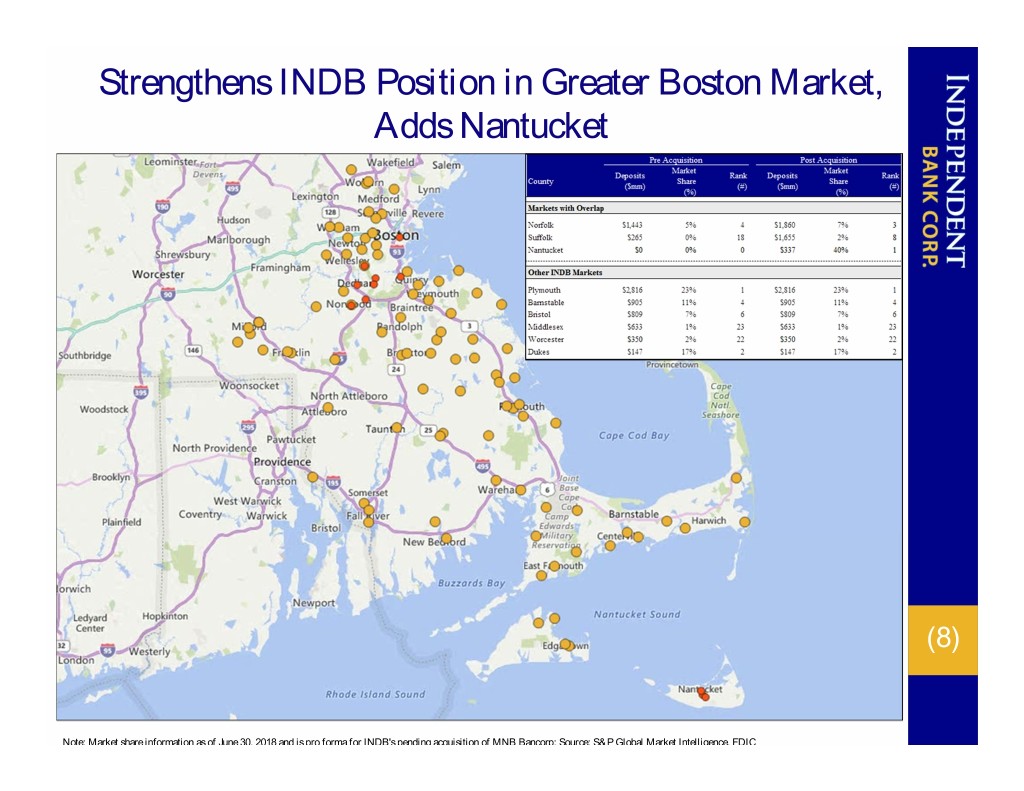
Strengthens INDB Position in Greater Boston Market, Adds Nantucket (8) Note: Market share information as of June 30, 2018 and is pro forma for INDB's pending acquisition of MNB Bancorp; Source: S&PGlobal Market Intelligence, FDIC
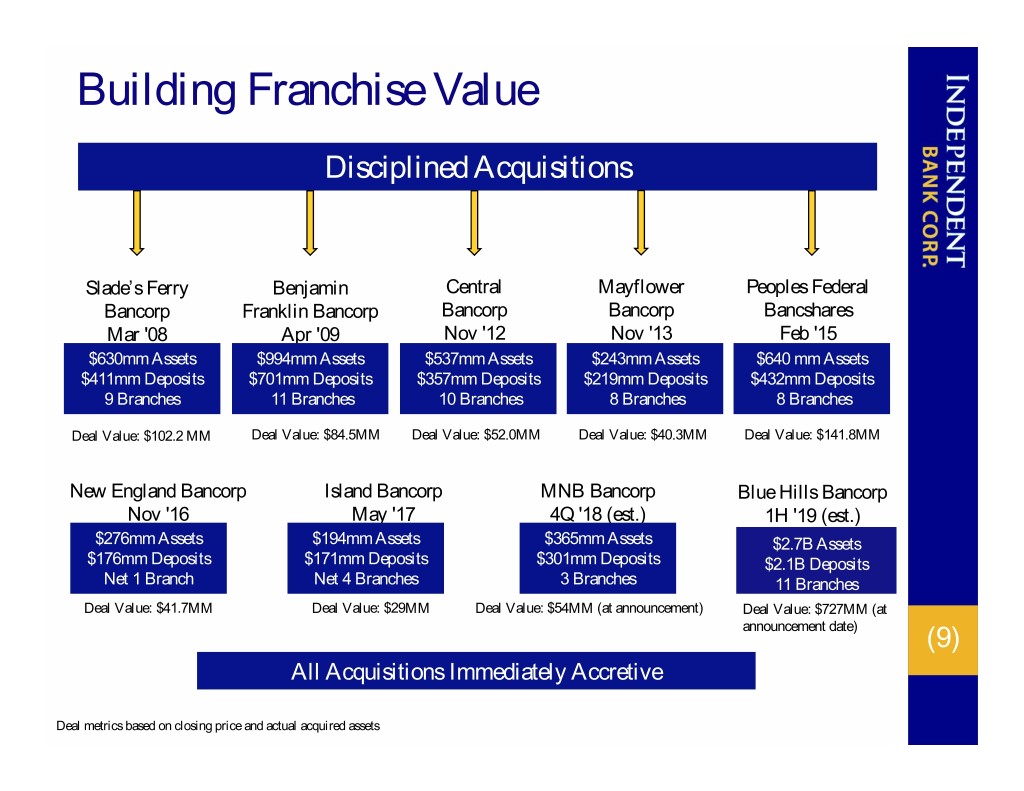
Building Franchise Value Disciplined Acquisitions Slade’s Ferry Benjamin Central Mayflower Peoples Federal Bancorp Franklin Bancorp Bancorp Bancorp Bancshares Mar '08 Apr '09 Nov '12 Nov '13 Feb '15 $630mm Assets $994mm Assets $537mm Assets $243mm Assets $640 mm Assets $411mm Deposits $701mm Deposits $357mm Deposits $219mm Deposits $432mm Deposits 9 Branches 11 Branches 10 Branches 8 Branches 8 Branches Deal Value: $102.2 MM Deal Value: $84.5MM Deal Value: $52.0MM Deal Value: $40.3MM Deal Value: $141.8MM New England Bancorp Island Bancorp MNB Bancorp Blue Hills Bancorp Nov '16 May '17 4Q '18 (est.) 1H '19 (est.) $276mm Assets $194mm Assets $365mm Assets $2.7B Assets $176mm Deposits $171mm Deposits $301mm Deposits $2.1B Deposits Net 1 Branch Net 4 Branches 3 Branches 11 Branches Deal Value: $41.7MM Deal Value: $29MM Deal Value: $54MM (at announcement) Deal Value: $727MM (at announcement date) (9) All Acquisitions Immediately Accretive Deal metrics based on closing price and actual acquired assets
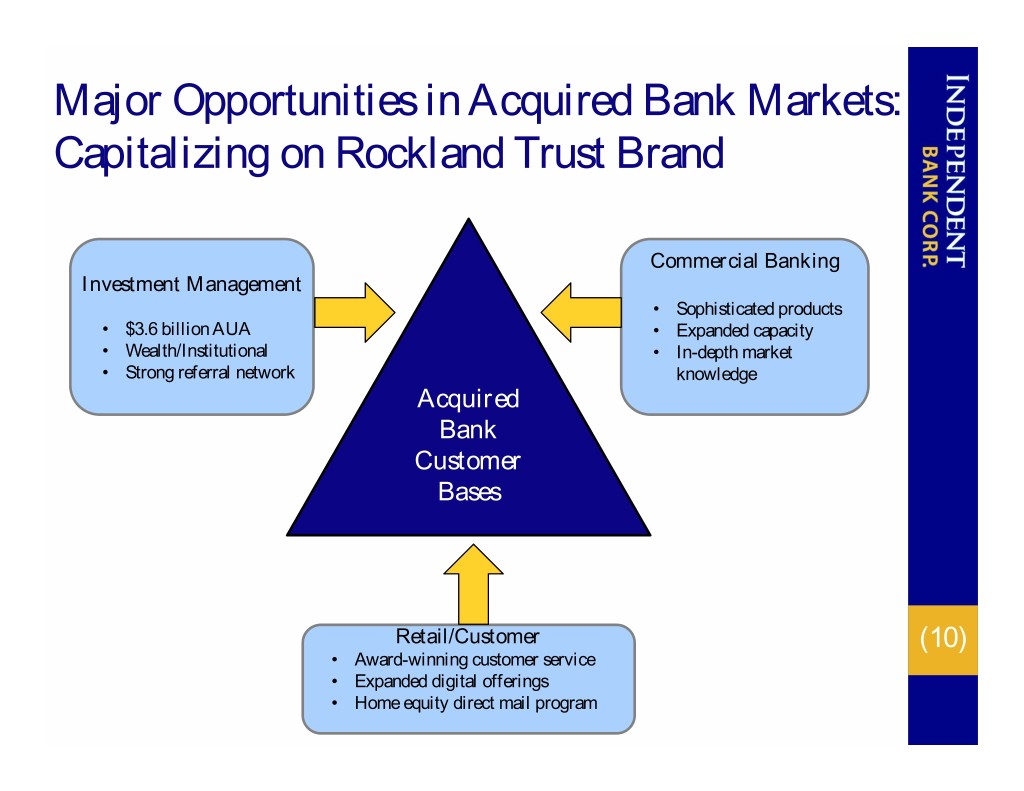
Major Opportunities in Acquired Bank Markets: Capitalizing on Rockland Trust Brand Commercial Banking Investment Management • Sophisticated products • $3.6 billion AUA • Expanded capacity • Wealth/Institutional • In-depth market • Strong referral network knowledge Acquired Bank Customer Bases Retail/Customer (10) • Award-winning customer service • Expanded digital offerings • Home equity direct mail program
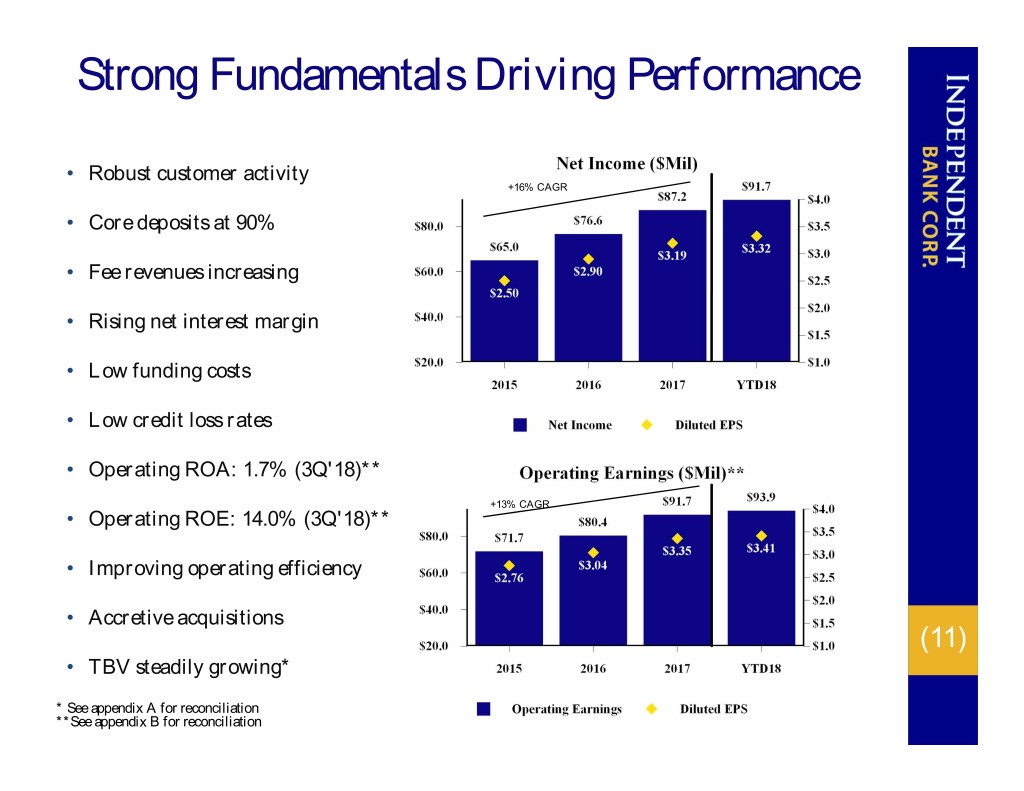
Strong Fundamentals Driving Performance • Robust customer activity +16% CAGR • Core deposits at 90% • Fee revenues increasing • Rising net interest margin • Low funding costs • Low credit loss rates • Operating ROA: 1.7% (3Q'18)** +13% CAGR • Operating ROE: 14.0% (3Q'18)** • Improving operating efficiency • Accretive acquisitions (11) • TBV steadily growing* * See appendix A for reconciliation **See appendix B for reconciliation
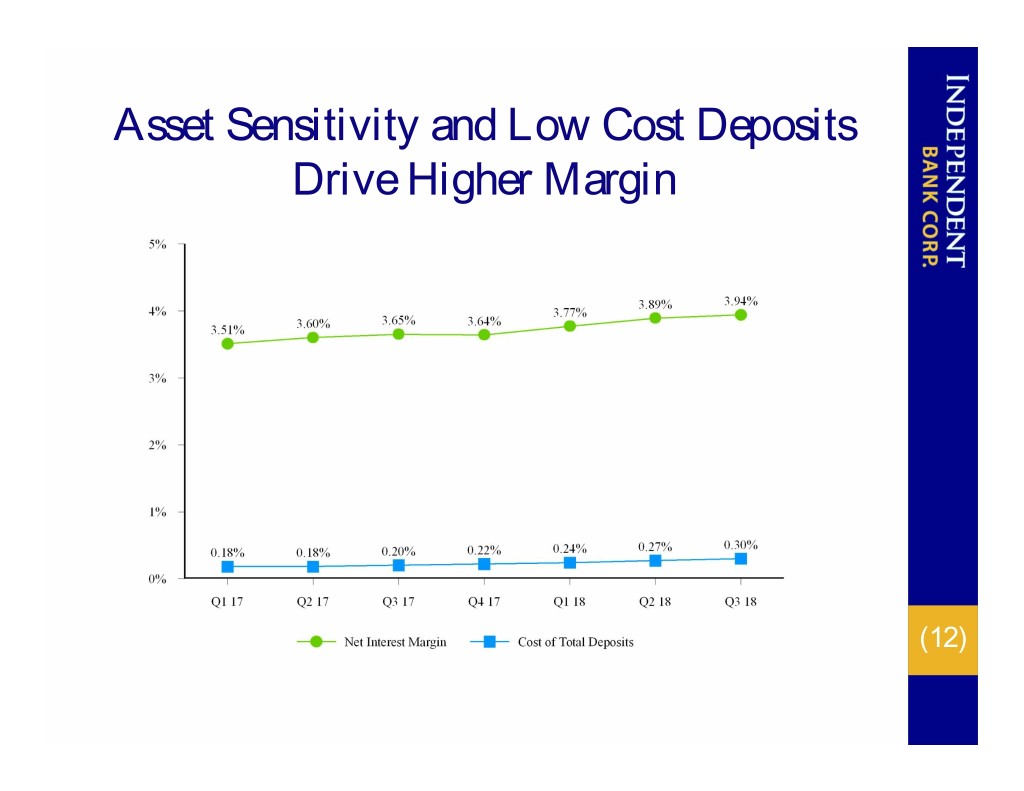
Asset Sensitivity and Low Cost Deposits Drive Higher Margin (12)
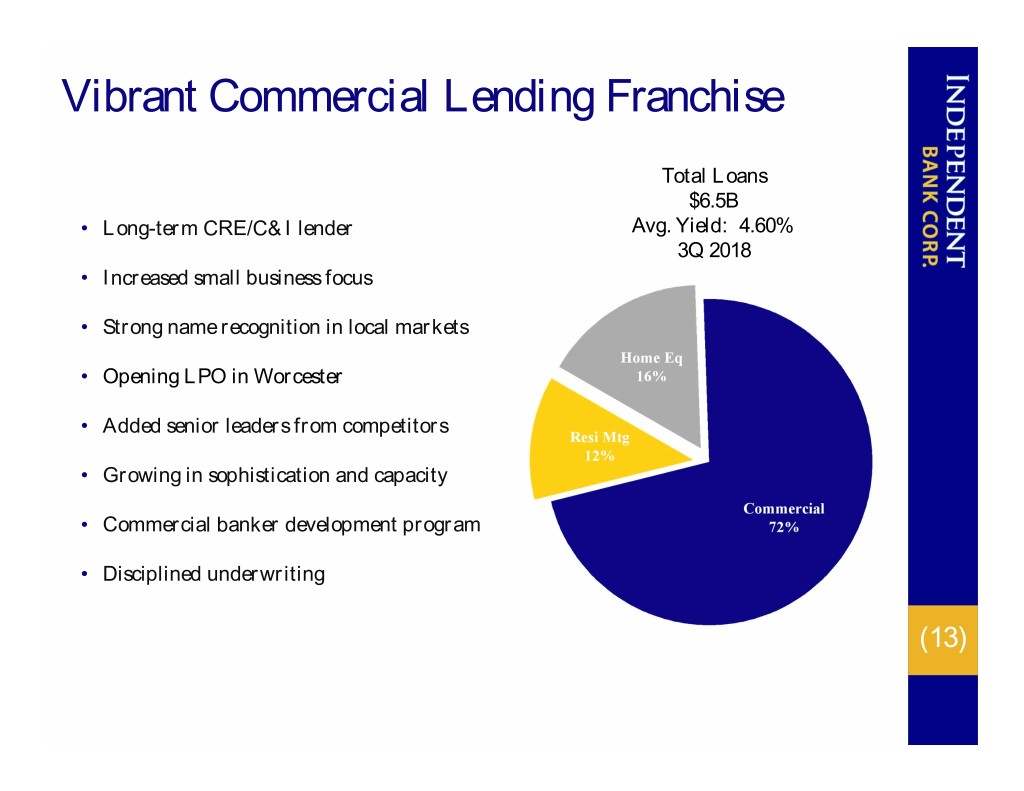
Vibrant Commercial Lending Franchise Total Loans $6.5B • Long-term CRE/C&I lender Avg. Yield: 4.60% 3Q 2018 • Increased small business focus • Strong name recognition in local markets • Opening LPO in Worcester • Added senior leaders from competitors • Growing in sophistication and capacity • Commercial banker development program • Disciplined underwriting (13)
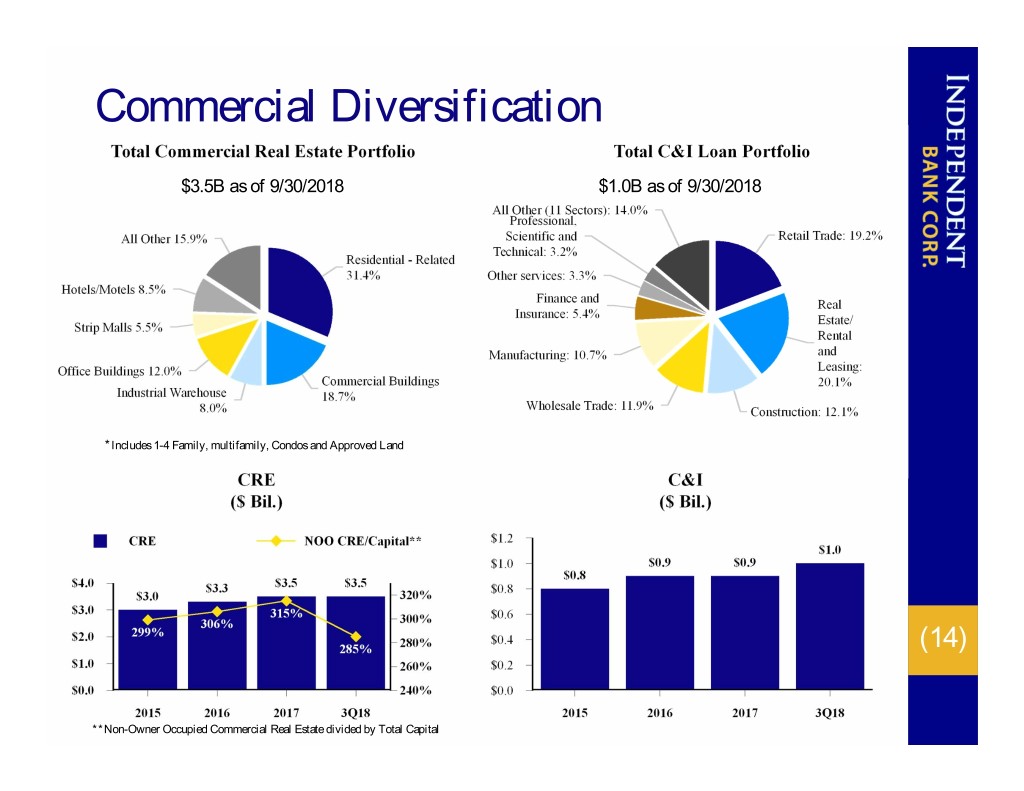
Commercial Diversification $3.5B as of 9/30/2018 $1.0B as of 9/30/2018 *Includes 1-4 Family, multifamily, Condos and Approved Land (14) **Non-Owner Occupied Commercial Real Estate divided by Total Capital
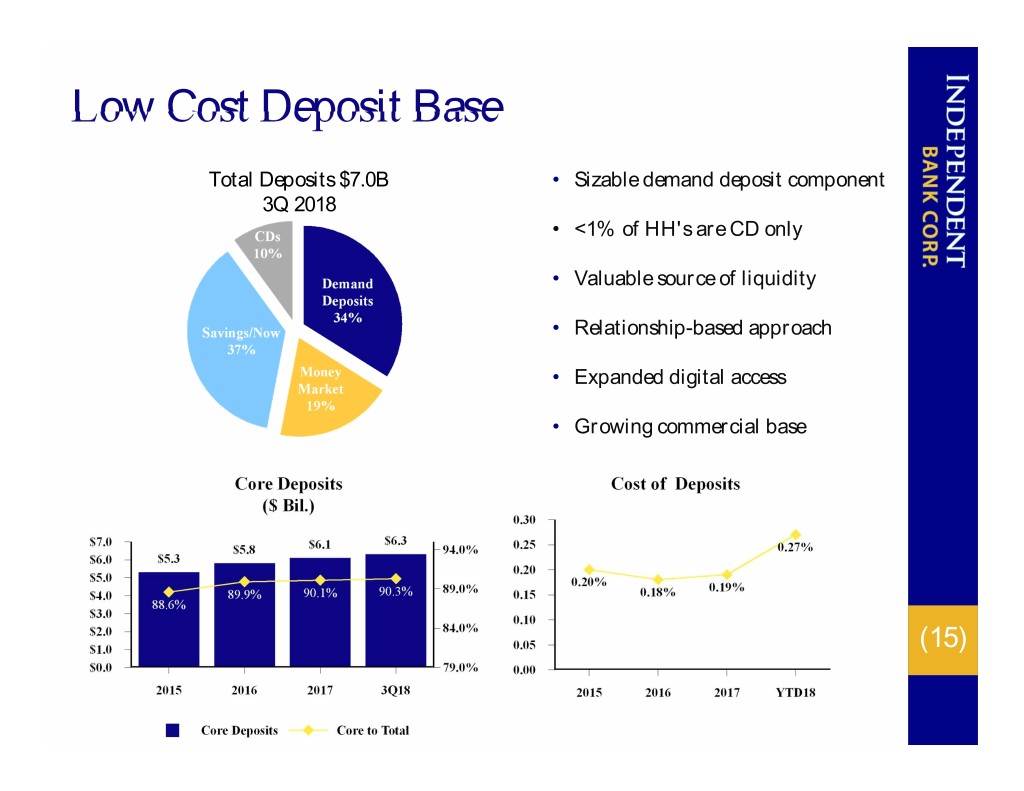
Low Cost Deposit Base Total Deposits $7.0B • Sizable demand deposit component 3Q 2018 • <1% of HH's are CD only • Valuable source of liquidity • Relationship-based approach • Expanded digital access • Growing commercial base (15)
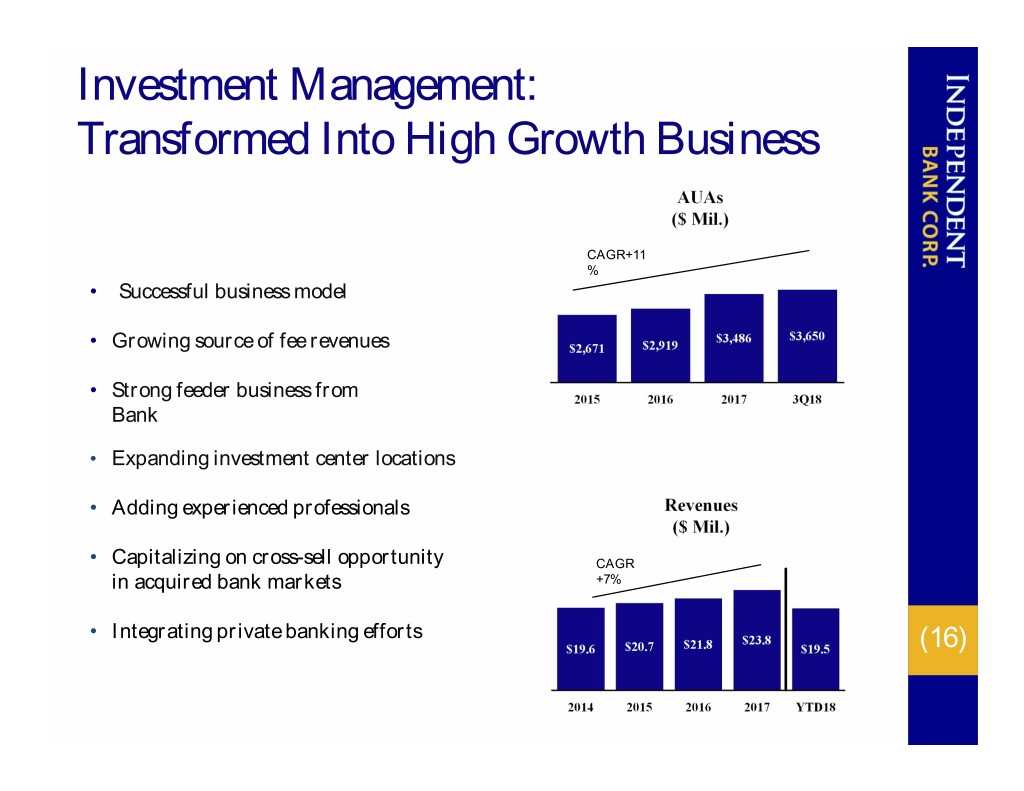
Investment Management: Transformed Into High Growth Business CAGR+11 % • Successful business model • Growing source of fee revenues • Strong feeder business from Bank • Expanding investment center locations • Adding experienced professionals • Capitalizing on cross-sell opportunity CAGR in acquired bank markets +7% • Integrating private banking efforts (16)
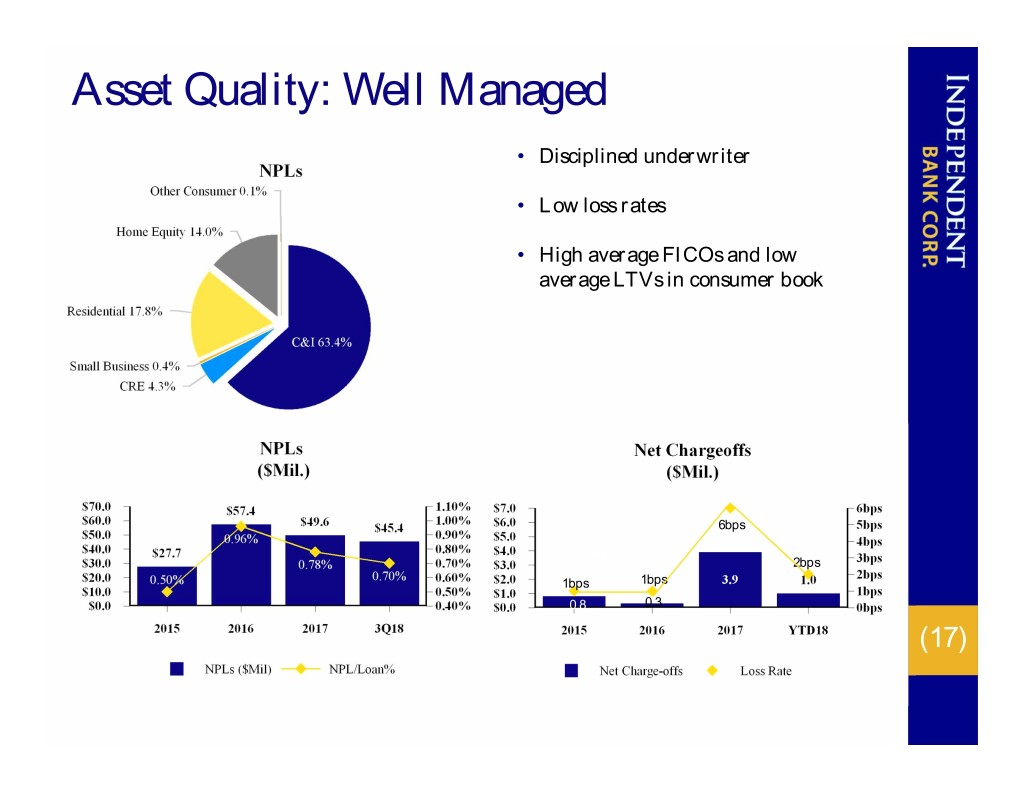
Asset Quality: Well Managed • Disciplined underwriter • Low loss rates • High average FICOs and low average LTVs in consumer book 6bps bps 2bps 1bps 1bps 0.8 0.3 (17)
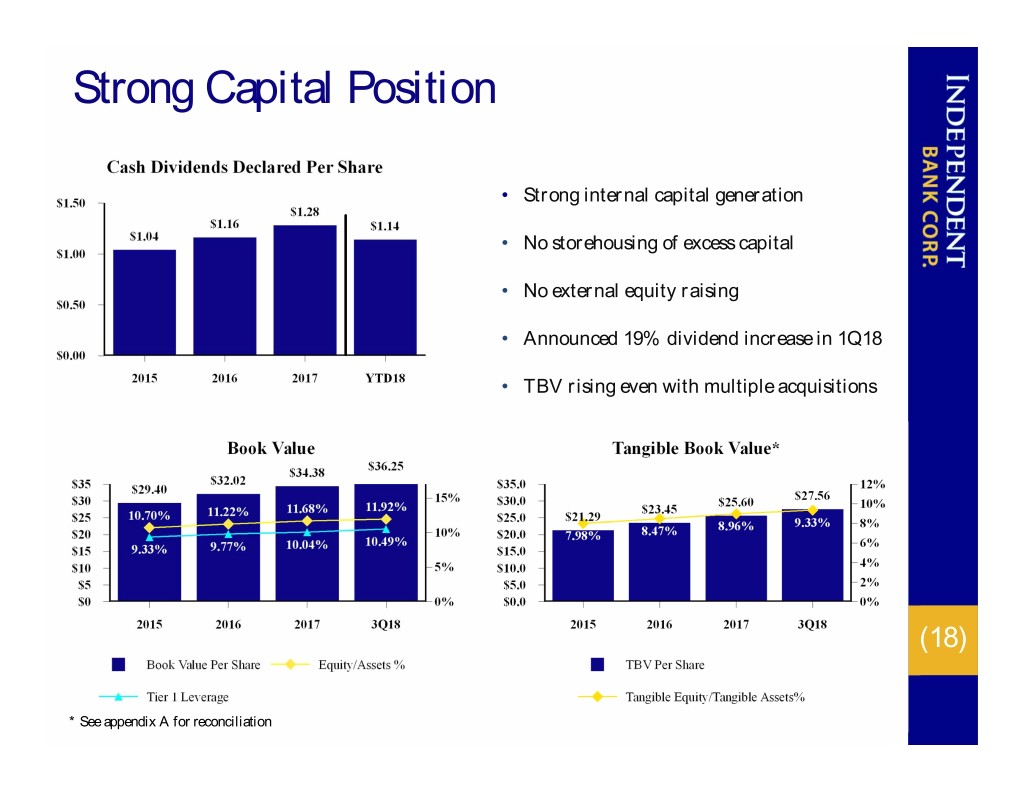
Strong Capital Position • Strong internal capital generation • No storehousing of excess capital • No external equity raising • Announced 19% dividend increase in 1Q18 • TBV rising even with multiple acquisitions (18) * See appendix A for reconciliation
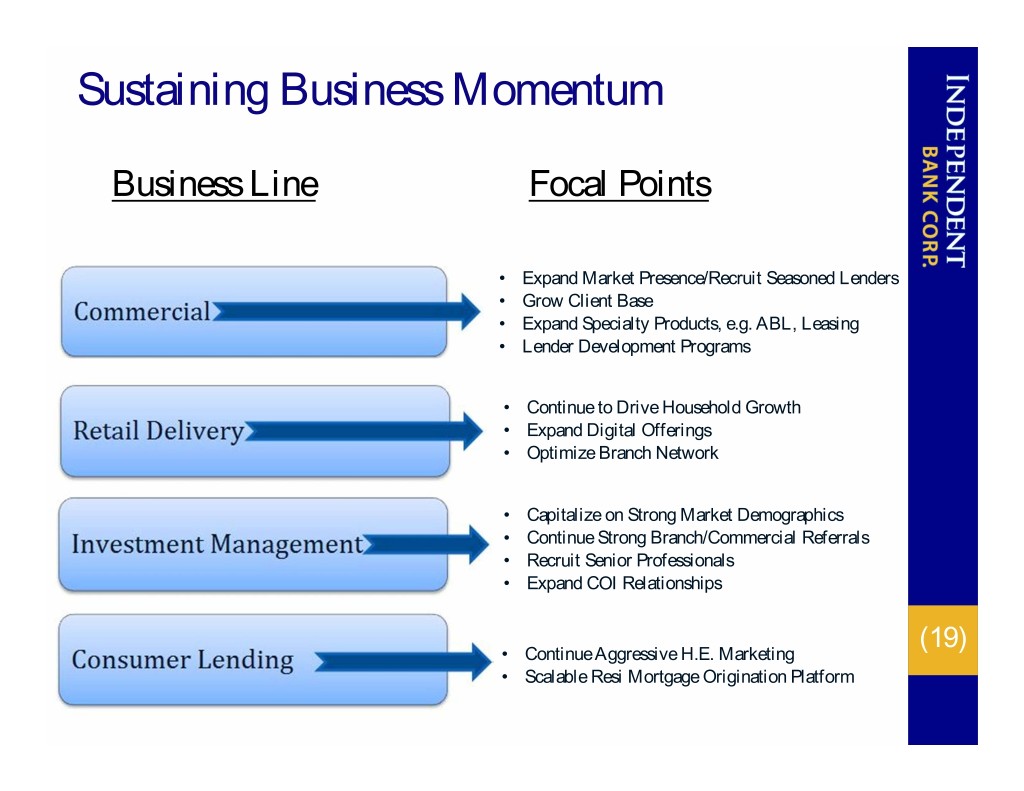
Sustaining Business Momentum Business Line Focal Points • Expand Market Presence/Recruit Seasoned Lenders • Grow Client Base • Expand Specialty Products, e.g. ABL, Leasing • Lender Development Programs • Continue to Drive Household Growth • Expand Digital Offerings • Optimize Branch Network • Capitalize on Strong Market Demographics • Continue Strong Branch/Commercial Referrals • Recruit Senior Professionals • Expand COI Relationships (19) • Continue Aggressive H.E. Marketing • Scalable Resi Mortgage Origination Platform
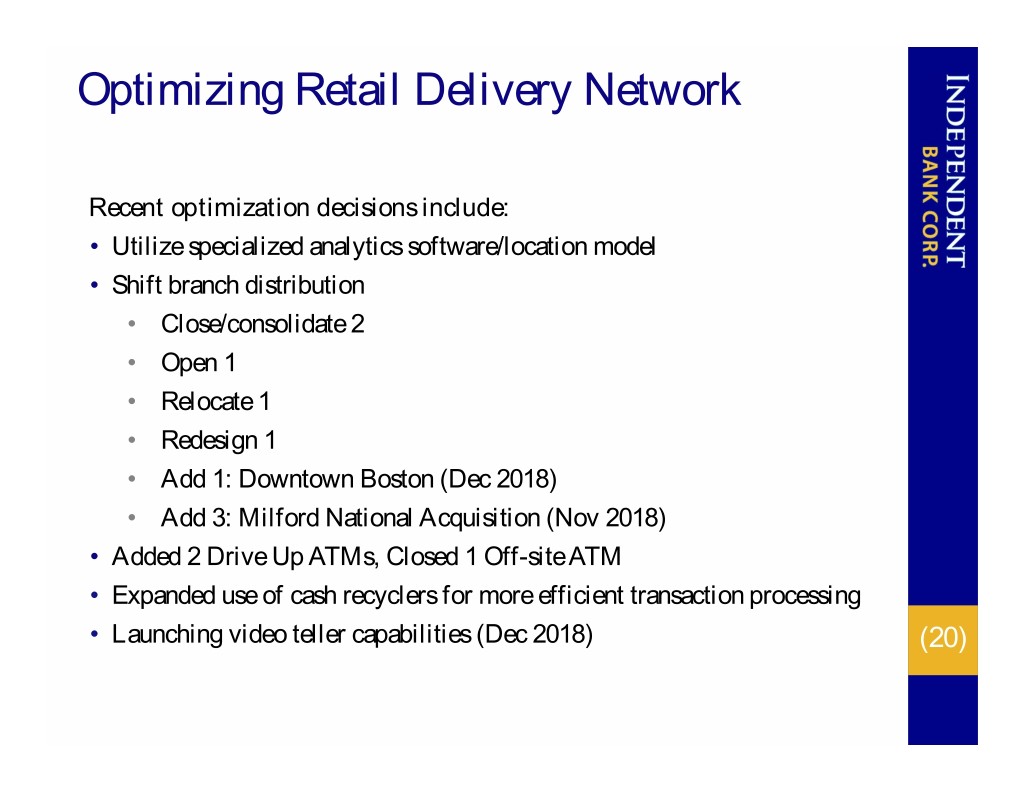
Optimizing Retail Delivery Network Recent optimization decisions include: • Utilize specialized analytics software/location model • Shift branch distribution • Close/consolidate 2 • Open 1 • Relocate 1 • Redesign 1 • Add 1: Downtown Boston (Dec 2018) • Add 3: Milford National Acquisition (Nov 2018) • Added 2 Drive Up ATMs, Closed 1 Off-site ATM • Expanded use of cash recyclers for more efficient transaction processing • Launching video teller capabilities (Dec 2018) (20)
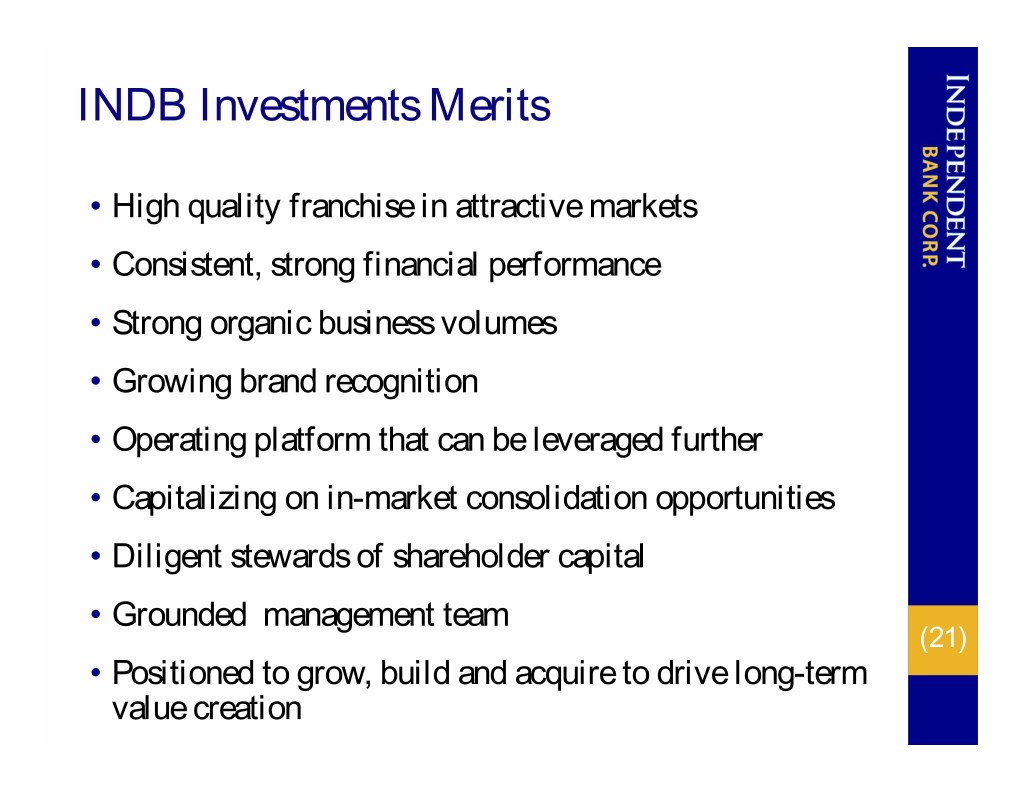
INDB Investments Merits • High quality franchise in attractive markets • Consistent, strong financial performance • Strong organic business volumes • Growing brand recognition • Operating platform that can be leveraged further • Capitalizing on in-market consolidation opportunities • Diligent stewards of shareholder capital • Grounded management team (21) • Positioned to grow, build and acquire to drive long-term value creation
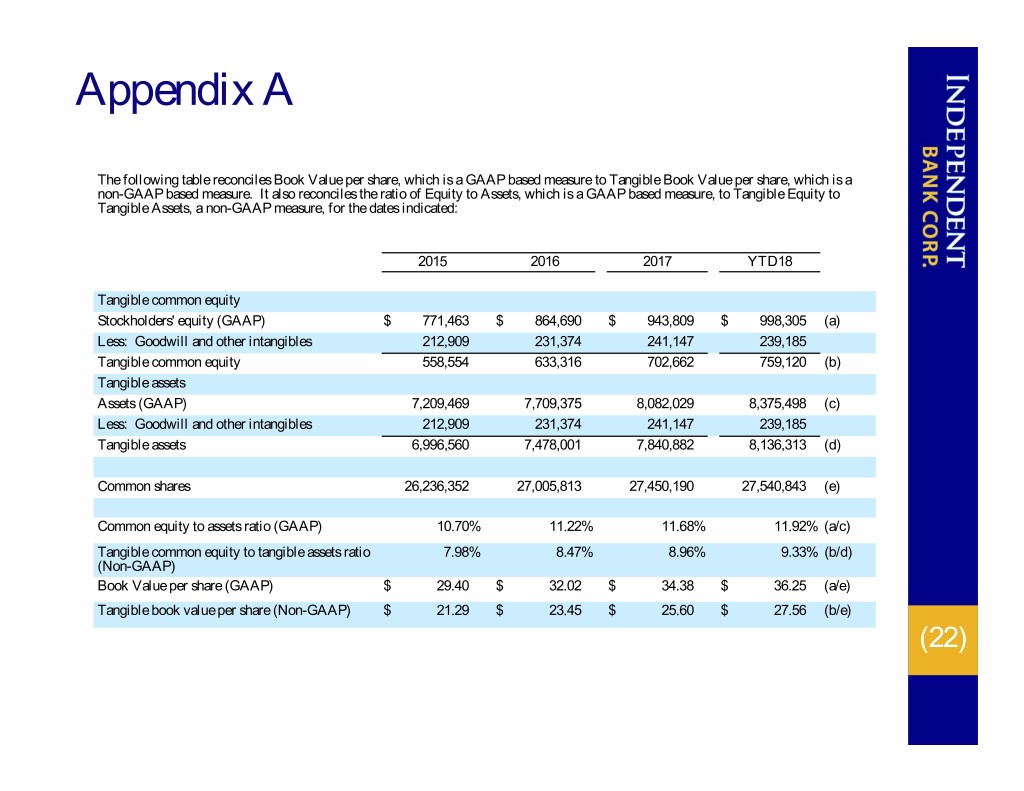
Appendix A The following table reconciles Book Value per share, which is a GAAP based measure to Tangible Book Value per share, which is a non-GAAP based measure. It also reconciles the ratio of Equity to Assets, which is a GAAP based measure, to Tangible Equity to Tangible Assets, a non-GAAP measure, for the dates indicated: 2015 2016 2017 YTD18 Tangible common equity Stockholders' equity (GAAP) $ 771,463 $ 864,690 $ 943,809 $ 998,305 (a) Less: Goodwill and other intangibles 212,909 231,374 241,147 239,185 Tangible common equity 558,554 633,316 702,662 759,120 (b) Tangible assets Assets (GAAP) 7,209,469 7,709,375 8,082,029 8,375,498 (c) Less: Goodwill and other intangibles 212,909 231,374 241,147 239,185 Tangible assets 6,996,560 7,478,001 7,840,882 8,136,313 (d) Common shares 26,236,352 27,005,813 27,450,190 27,540,843 (e) Common equity to assets ratio (GAAP) 10.70% 11.22% 11.68% 11.92% (a/c) Tangible common equity to tangible assets ratio 7.98% 8.47% 8.96% 9.33% (b/d) (Non-GAAP) Book Value per share (GAAP) $ 29.40 $ 32.02 $ 34.38 $ 36.25 (a/e) Tangible book value per share (Non-GAAP) $ 21.29 $ 23.45 $ 25.60 $ 27.56 (b/e) (22)
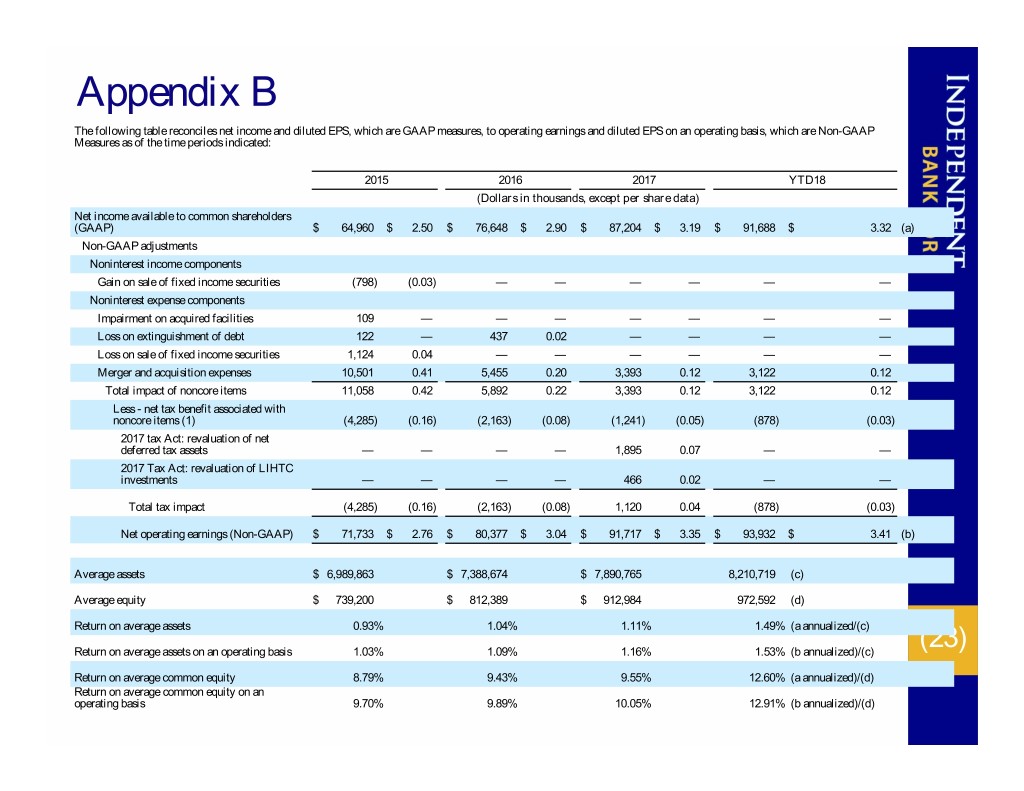
Appendix B The following table reconciles net income and diluted EPS, which are GAAP measures, to operating earnings and diluted EPS on an operating basis, which are Non-GAAP Measures as of the time periods indicated: 2015 2016 2017 YTD18 (Dollars in thousands, except per share data) Net income available to common shareholders (GAAP) $ 64,960 $ 2.50 $ 76,648 $ 2.90 $ 87,204 $ 3.19 $ 91,688 $ 3.32 (a) Non-GAAP adjustments Noninterest income components Gain on sale of fixed income securities (798) (0.03) — — — — — — Noninterest expense components Impairment on acquired facilities 109 — — — — — — — Loss on extinguishment of debt 122 — 437 0.02 — — — — Loss on sale of fixed income securities 1,124 0.04 — — — — — — Merger and acquisition expenses 10,501 0.41 5,455 0.20 3,393 0.12 3,122 0.12 Total impact of noncore items 11,058 0.42 5,892 0.22 3,393 0.12 3,122 0.12 Less - net tax benefit associated with noncore items (1) (4,285) (0.16) (2,163) (0.08) (1,241) (0.05) (878) (0.03) 2017 tax Act: revaluation of net deferred tax assets — — — — 1,895 0.07 — — 2017 Tax Act: revaluation of LIHTC investments — — — — 466 0.02 — — Total tax impact (4,285) (0.16) (2,163) (0.08) 1,120 0.04 (878) (0.03) Net operating earnings (Non-GAAP) $ 71,733 $ 2.76 $ 80,377 $ 3.04 $ 91,717 $ 3.35 $ 93,932 $ 3.41 (b) Average assets $ 6,989,863 $ 7,388,674 $ 7,890,765 8,210,719 (c) Average equity $ 739,200 $ 812,389 $ 912,984 972,592 (d) Return on average assets 0.93% 1.04% 1.11% 1.49% (a annualized/(c) Return on average assets on an operating basis 1.03% 1.09% 1.16% 1.53% (b annualized)/(c) (23) Return on average common equity 8.79% 9.43% 9.55% 12.60% (a annualized)/(d) Return on average common equity on an operating basis 9.70% 9.89% 10.05% 12.91% (b annualized)/(d)
NASDAQ Ticker: INDB www.rocklandtrust.com Robert Cozzone – CFO & EVP Consumer and Business Banking Shareholder Relations: (781) 982-6737 Statements contained in this presentation that are not historical facts are “forward-looking statements” that are subject to risks and uncertainties which could cause actual results to differ materially from (24) those currently anticipated due to a number of factors, which include, but are not limited to, factors discussed in documents filed by the Company with the Securities and Exchange Commission from time to time.


