
Exhibit 99.2 Q1 2022 Earnings Presentation April 22, 2022
Forward Looking Statements This presentation contains certain “forward-looking statements” within the meaning of the Private Securities Litigation Reform Act of 1995 with respect to the financial condition, results of operations and business of the Company. These statements may be identified by such forward-looking terminology as “expect,” “achieve,” “plan,” “believe,” “future,” “positioned,” “continued,” “will,” “would,” “potential,” "anticipated," "guidance," "targeted" or similar statements or variations of such terms. Actual results may differ from those contemplated by these forward-looking statements. Factors that may cause actual results to differ materially from those contemplated by such forward-looking statements include, but are not limited to: further weakening in the United States economy in general and the regional and local economies within the New England region and the Company’s market area, including any future weakening caused by the COVID-19 pandemic and any uncertainty regarding the length and extent of economic contraction as a result of the pandemic; the potential effects of inflationary pressures, labor market shortages and supply chain issues; instability or volatility in financial markets and unfavorable general economic or business conditions, globally, nationally or regionally, caused by geopolitical concerns, including as a result of the conflict between Russia and Ukraine, could have an adverse effect on our business or results of operations; unanticipated loan delinquencies, loss of collateral, decreased service revenues, and other potential negative effects on our business caused by severe weather, pandemics or other external events; adverse changes or volatility in the local real estate market; adverse changes in asset quality and any unanticipated credit deterioration in our loan portfolio including those related to one or more large commercial relationships; acquisitions, may not produce results at levels or within time frames originally anticipated and may result in unforeseen integration issues or impairment of goodwill and/or other intangibles; additional regulatory oversight and related compliance costs; changes in trade, monetary and fiscal policies and laws, including interest rate policies of the Board of Governors of the Federal Reserve System; higher than expected tax expense, resulting from failure to comply with general tax laws and changes in tax laws; changes in market interest rates for interest earning assets and/or interest bearing liabilities and changes related to the phase-out of LIBOR; increased competition in the Company’s market areas; adverse weather, changes in climate, natural disasters, geopolitical concerns, including those arising from the conflict between Russia and Ukraine, the emergence of widespread health emergencies or pandemics, including the magnitude and duration of the COVID-19 pandemic, other public health crises or man-made events could negatively affect our local economies or disrupt our operations, which would have an adverse effect on our business or results of operations; a deterioration in the conditions of the securities markets; a deterioration of the credit rating for U.S. long-term sovereign debt; inability to adapt to changes in information technology, including changes to industry accepted delivery models driven by a migration to the internet as a means of service delivery; electronic fraudulent activity within the financial services industry, especially in the commercial banking sector; adverse changes in consumer spending and savings habits; the effect of laws and regulations regarding the financial services industry; changes in laws and regulations (including laws and regulations concerning taxes, banking, securities and insurance) generally applicable to the Company’s business; the Company's potential judgments, claims, damages, penalties, fines and reputational damage resulting from pending or future litigation and regulatory and government actions, including as a result of our participation in and execution of government programs related to the COVID-19 pandemic; changes in accounting policies, practices and standards, as may be adopted by the regulatory agencies as well as the Public Company Accounting Oversight Board, the Financial Accounting Standards Board, and other accounting standard setters including, but not limited to, changes to how the Company accounts for credit losses; cyber security attacks or intrusions that could adversely impact our businesses; and other unexpected material adverse changes in our operations or earnings. Further, the foregoing factors may be exacerbated by the ultimate impact of the COVID-19 pandemic, which remains unknown at this time due to factors and future developments that are uncertain, unpredictable and, in many cases, beyond the Company's control, including the scope, duration and extent of the pandemic and any further resurgences, the efficacy, availability and public acceptance of vaccines, boosters or other treatments, actions taken by governmental authorities in response to the pandemic and the direct and indirect impact of these actions and the pandemic generally on the Company’s employees, customers, business and third-parties with which the Company conducts business. The Company wishes to caution readers not to place undue reliance on any forward-looking statements as the Company’s business and its forward- looking statements involve substantial known and unknown risks and uncertainties described in the Company’s Annual Report on Form 10-K and subsequent Quarterly Reports on Form 10-Q (“Risk Factors”). Except as required by law, the Company disclaims any intent or obligation to update publicly any such forward- looking statements, whether in response to new information, future events or otherwise. Any public statements or disclosures by the Company following this release which modify or impact any of the forward-looking statements contained in this release will be deemed to modify or supersede such statements in this release. In addition to the information set forth in this press release, you should carefully consider the Risk Factors. 2
Non-GAAP Financial Measures This presentation contains financial information determined by methods other than in accordance with accounting principles generally accepted in the United States of America (“GAAP”). This information includes operating net income and operating earnings per share ("EPS"), operating return on average assets, operating return on average common equity, operating return on average tangible common equity, core net interest margin ("core NIM"), tangible book value per share and the tangible common equity ratio. Operating net income, operating EPS, operating return on average assets and operating return on average common equity exclude items that management believes are unrelated to the Company's core banking business such as merger and acquisition expenses, provision for credit losses on acquired loan portfolios, and other items, if applicable. Management uses operating net income and related ratios and operating EPS to measure the strength of the Company’s core banking business and to identify trends that may to some extent be obscured by such items. Management reviews its core margin to determine any items that may impact the net interest margin that may be one-time in nature or not reflective of its core operating environment, such as out-sized cash balances, unique low-yielding loans originated through government programs in response to the pandemic, or significant purchase accounting adjustments. Management believes that adjusting for these items to arrive at a core margin provides additional insight into the operating environment and how management decisions impact the net interest margin. Similarly, management reviews certain loan metrics such as growth rates and allowance as a percentage of total loans, adjusted to exclude loans that are not considered part of its core portfolio, which includes loans originated in association with government sponsored and guaranteed programs in response to the pandemic, to arrive at adjusted numbers more representative of the core growth of the portfolio and core reserve to loan ratio. Management also supplements its evaluation of financial performance with analysis of tangible book value per share (which is computed by dividing stockholders' equity less goodwill and identifiable intangible assets, or "tangible common equity", by common shares outstanding), the tangible common equity ratio (which is computed by dividing tangible common equity by "tangible assets", defined as total assets less goodwill and other intangibles), and return on average tangible common equity (which is computed by dividing net income by average tangible common equity). The Company has included information on tangible book value per share, the tangible common equity ratio and return on average tangible common equity because management believes that investors may find it useful to have access to the same analytical tools used by management. As a result of merger and acquisition activity, the Company has recognized goodwill and other intangible assets in conjunction with business combination accounting principles. Excluding the impact of goodwill and other intangibles in measuring asset and capital values for the ratios provided, along with other bank standard capital ratios, provides a framework to compare the capital adequacy of the Company to other companies in the financial services industry. These non-GAAP measures should not be viewed as a substitute for operating results and other financial measures determined in accordance with GAAP. An item which management deems to be noncore and excludes when computing these non-GAAP measures can be of substantial importance to the Company’s results for any particular quarter or year. The Company’s non-GAAP performance measures, including operating net income, operating EPS, operating return on average assets, operating return on average common equity, core margin, tangible book value per share and the tangible common equity ratio, are not necessarily comparable to non-GAAP performance measures which may be presented by other companies. 3
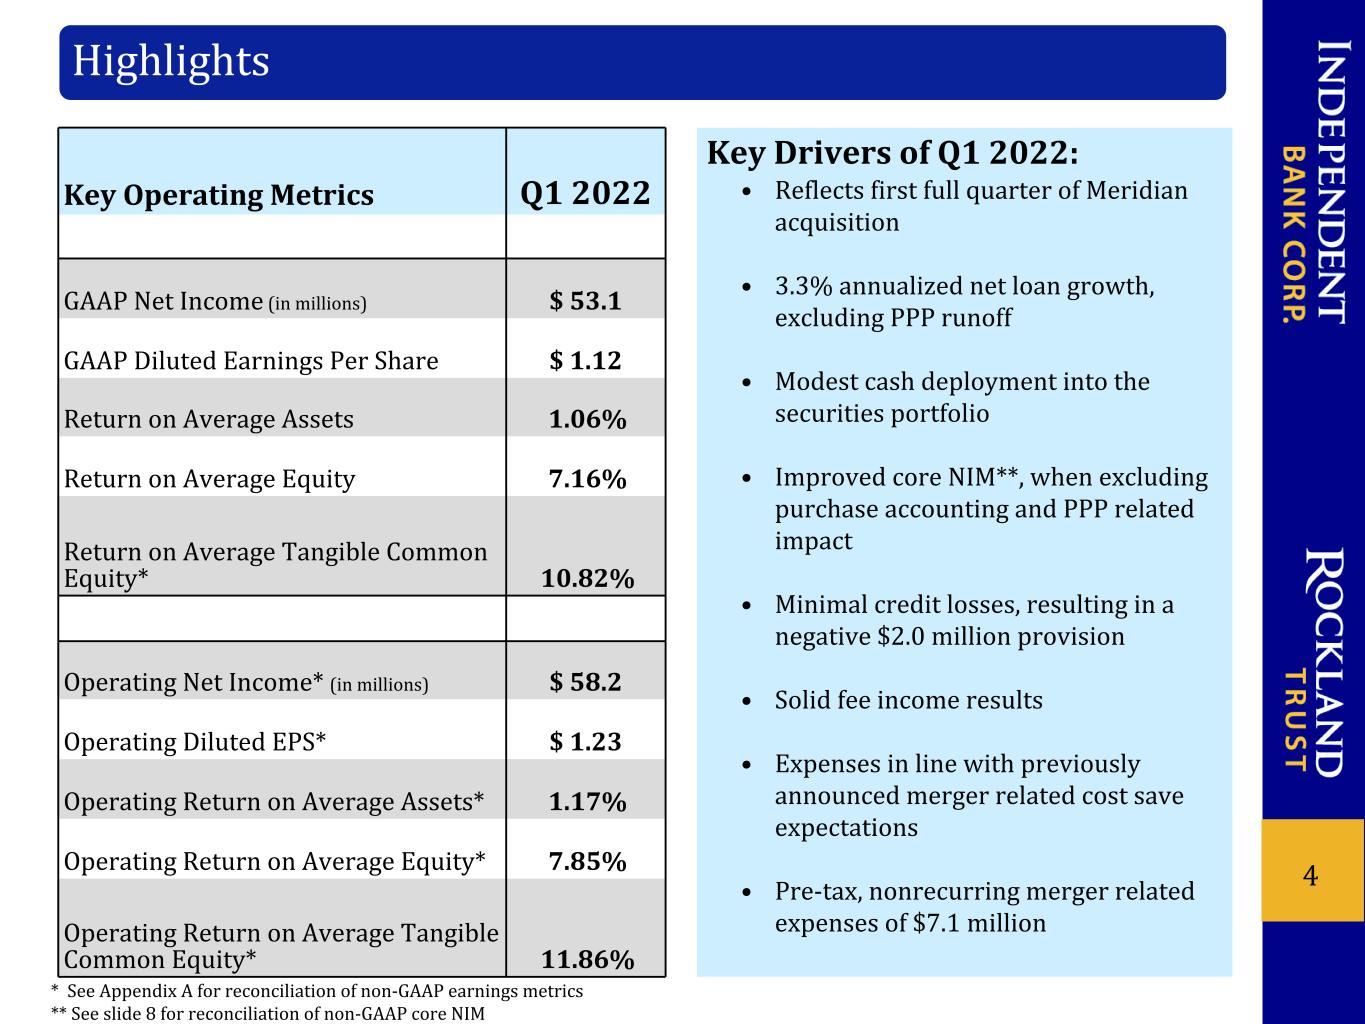
Key Operating Metrics Q1 2022 GAAP Net Income (in millions) $ 53.1 GAAP Diluted Earnings Per Share $ 1.12 Return on Average Assets 1.06% Return on Average Equity 7.16% Return on Average Tangible Common Equity* 10.82% Operating Net Income* (in millions) $ 58.2 Operating Diluted EPS* $ 1.23 Operating Return on Average Assets* 1.17% Operating Return on Average Equity* 7.85% Operating Return on Average Tangible Common Equity* 11.86% 4 Highlights * See Appendix A for reconciliation of non-GAAP earnings metrics ** See slide 8 for reconciliation of non-GAAP core NIM Key Drivers of Q1 2022: • Reflects first full quarter of Meridian acquisition • 3.3% annualized net loan growth, excluding PPP runoff • Modest cash deployment into the securities portfolio • Improved core NIM**, when excluding purchase accounting and PPP related impact • Minimal credit losses, resulting in a negative $2.0 million provision • Solid fee income results • Expenses in line with previously announced merger related cost save expectations • Pre-tax, nonrecurring merger related expenses of $7.1 million
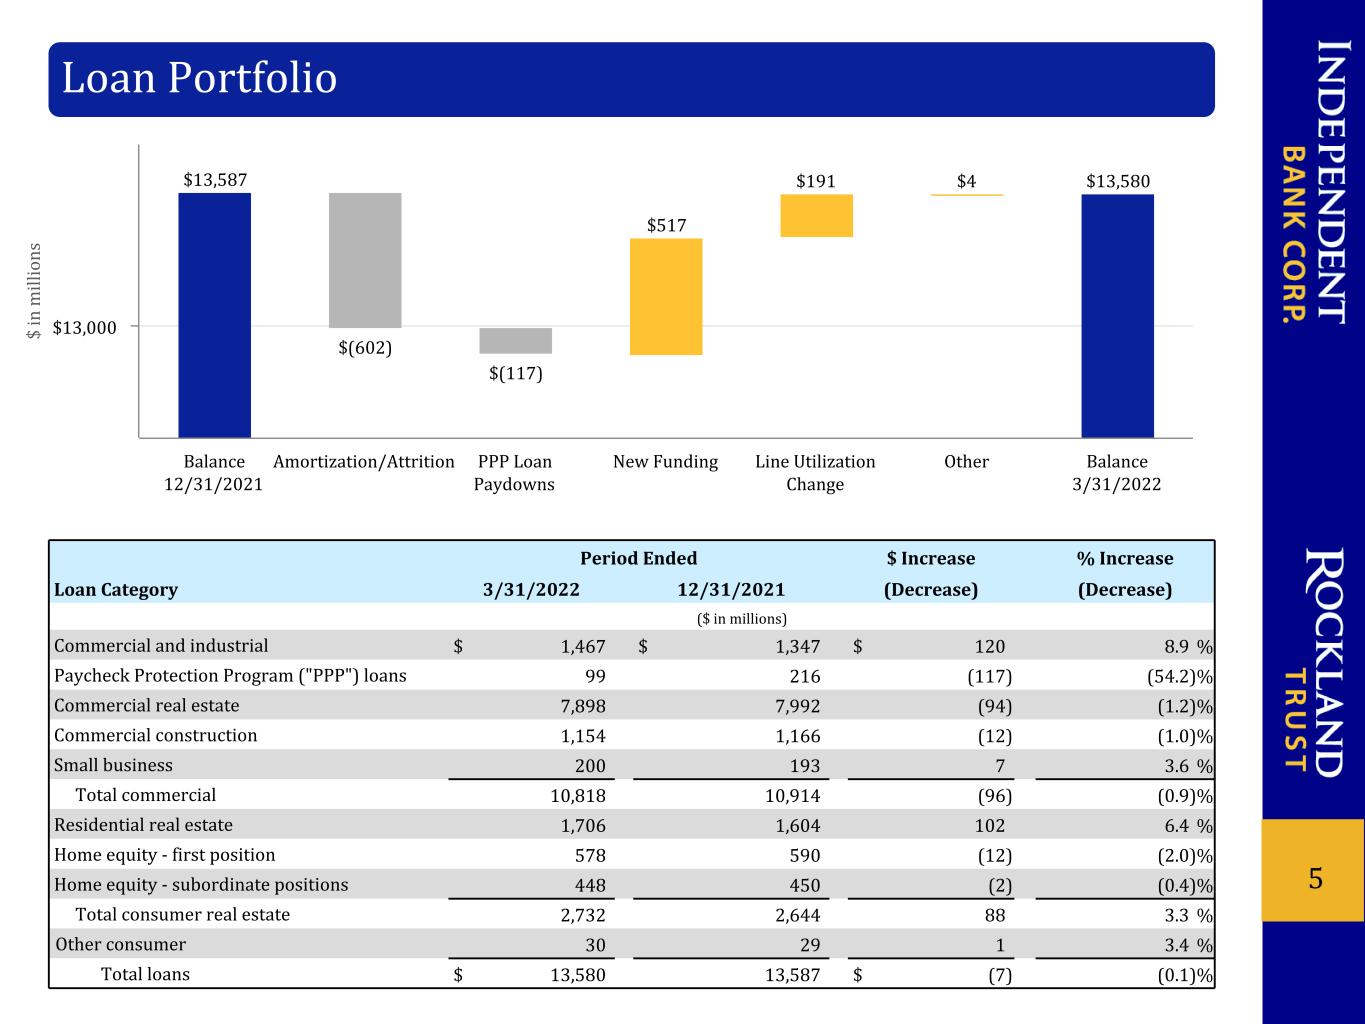
5 $ in m ill io ns $13,587 $(602) $(117) $517 $191 $4 $13,580 Balance 12/31/2021 Amortization/Attrition PPP Loan Paydowns New Funding Line Utilization Change Other Balance 3/31/2022 $13,000 Loan Portfolio Period Ended $ Increase % Increase Loan Category 3/31/2022 12/31/2021 (Decrease) (Decrease) ($ in millions) Commercial and industrial $ 1,467 $ 1,347 $ 120 8.9 % Paycheck Protection Program ("PPP") loans 99 216 (117) (54.2) % Commercial real estate 7,898 7,992 (94) (1.2) % Commercial construction 1,154 1,166 (12) (1.0) % Small business 200 193 7 3.6 % Total commercial 10,818 10,914 (96) (0.9) % Residential real estate 1,706 1,604 102 6.4 % Home equity - first position 578 590 (12) (2.0) % Home equity - subordinate positions 448 450 (2) (0.4) % Total consumer real estate 2,732 2,644 88 3.3 % Other consumer 30 29 1 3.4 % Total loans $ 13,580 13,587 $ (7) (0.1) %
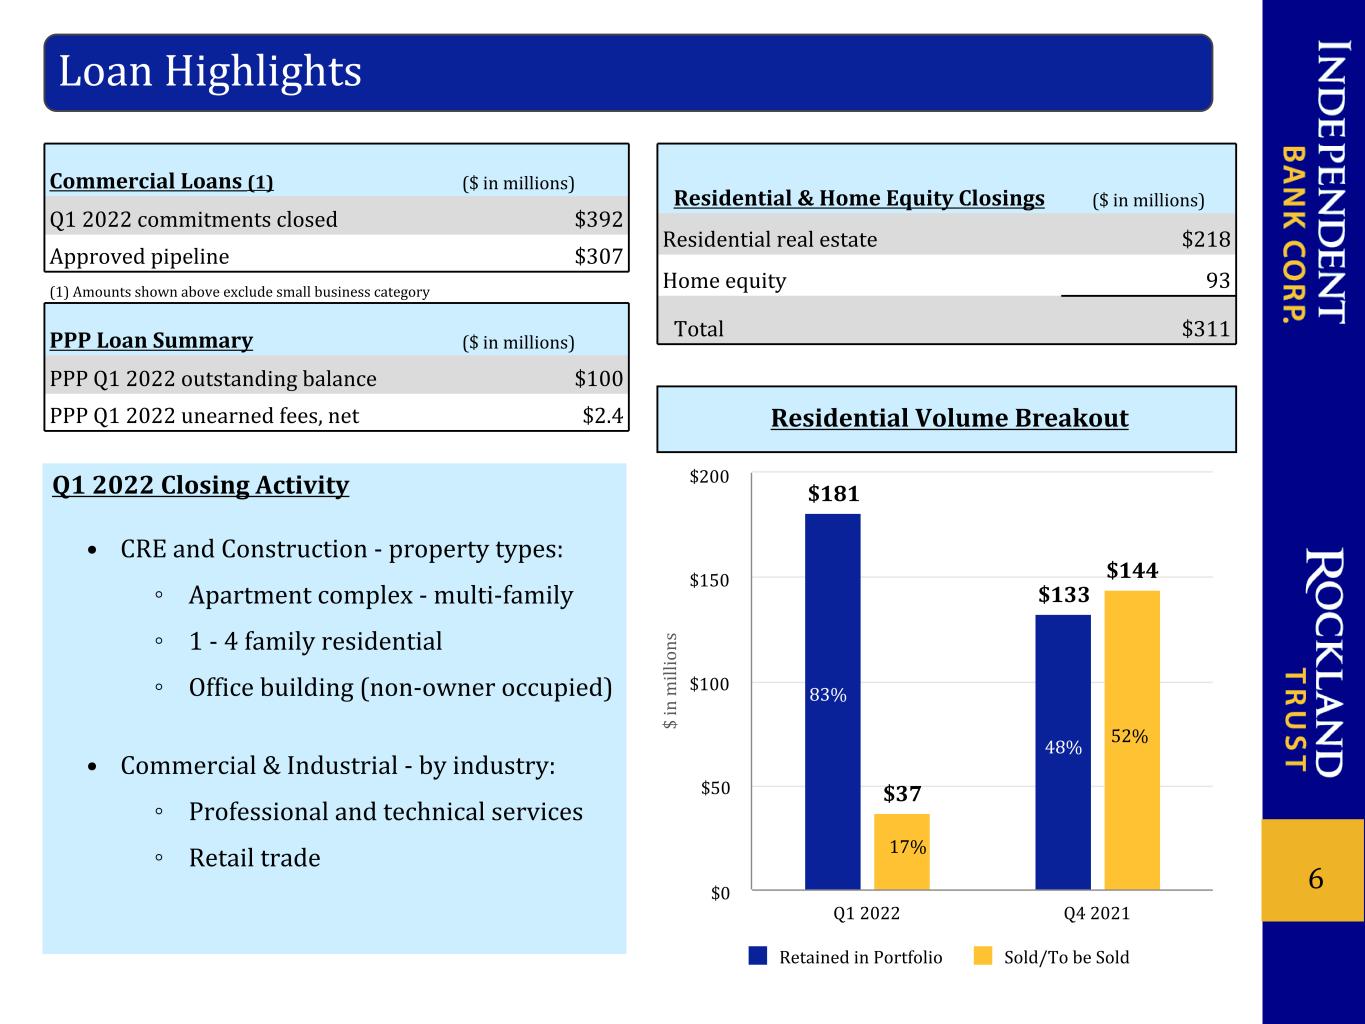
6 Commercial Loans (1) ($ in millions) Q1 2022 commitments closed $392 Approved pipeline $307 (1) Amounts shown above exclude small business category PPP Loan Summary ($ in millions) PPP Q1 2022 outstanding balance $100 PPP Q1 2022 unearned fees, net $2.4 Loan Highlights Residential & Home Equity Closings ($ in millions) Residential real estate $218 Home equity 93 Total $311 Residential Volume Breakout Q1 2022 Closing Activity • CRE and Construction - property types: ◦ Apartment complex - multi-family ◦ 1 - 4 family residential ◦ Office building (non-owner occupied) • Commercial & Industrial - by industry: ◦ Professional and technical services ◦ Retail trade $ in m ill io ns $181 $133 $37 $144 Retained in Portfolio Sold/To be Sold Q1 2022 Q4 2021 $0 $50 $100 $150 $200 83% 17% 48% 52%
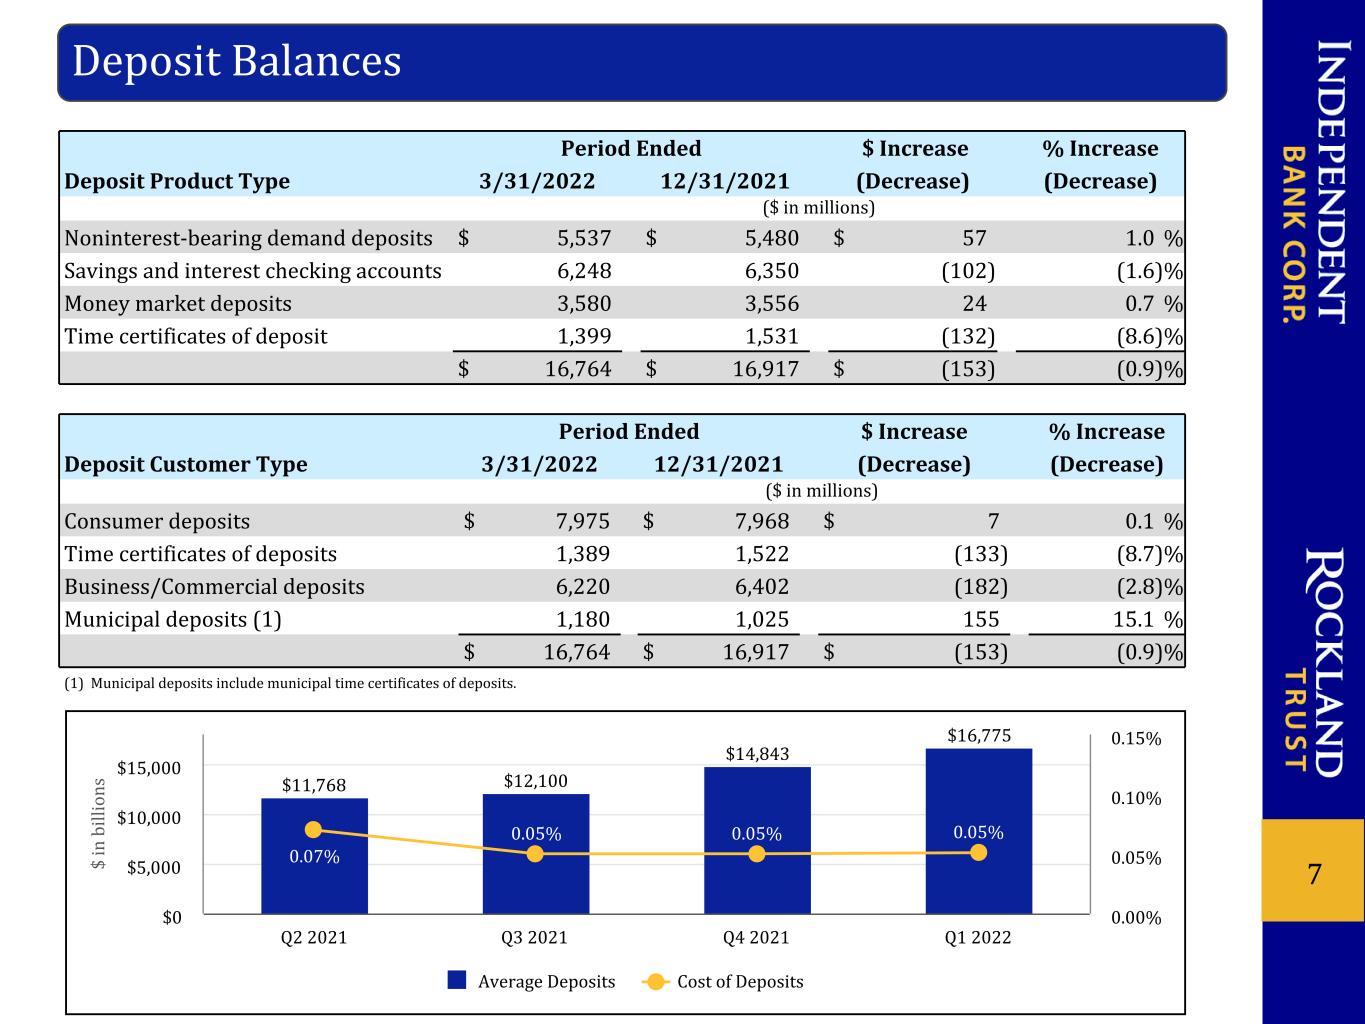
Period Ended $ Increase % Increase Deposit Customer Type 3/31/2022 12/31/2021 (Decrease) (Decrease) ($ in millions) Consumer deposits $ 7,975 $ 7,968 $ 7 0.1 % Time certificates of deposits 1,389 1,522 (133) (8.7) % Business/Commercial deposits 6,220 6,402 (182) (2.8) % Municipal deposits (1) 1,180 1,025 155 15.1 % $ 16,764 $ 16,917 $ (153) (0.9) % (1) Municipal deposits include municipal time certificates of deposits. 7 Period Ended $ Increase % Increase Deposit Product Type 3/31/2022 12/31/2021 (Decrease) (Decrease) ($ in millions) Noninterest-bearing demand deposits $ 5,537 $ 5,480 $ 57 1.0 % Savings and interest checking accounts 6,248 6,350 (102) (1.6) % Money market deposits 3,580 3,556 24 0.7 % Time certificates of deposit 1,399 1,531 (132) (8.6) % $ 16,764 $ 16,917 $ (153) (0.9) % Deposit Balances $ in b ill io ns $11,768 $12,100 $14,843 $16,775 0.07% 0.05% 0.05% 0.05% Average Deposits Cost of Deposits Q2 2021 Q3 2021 Q4 2021 Q1 2022 $0 $5,000 $10,000 $15,000 0.00% 0.05% 0.10% 0.15%
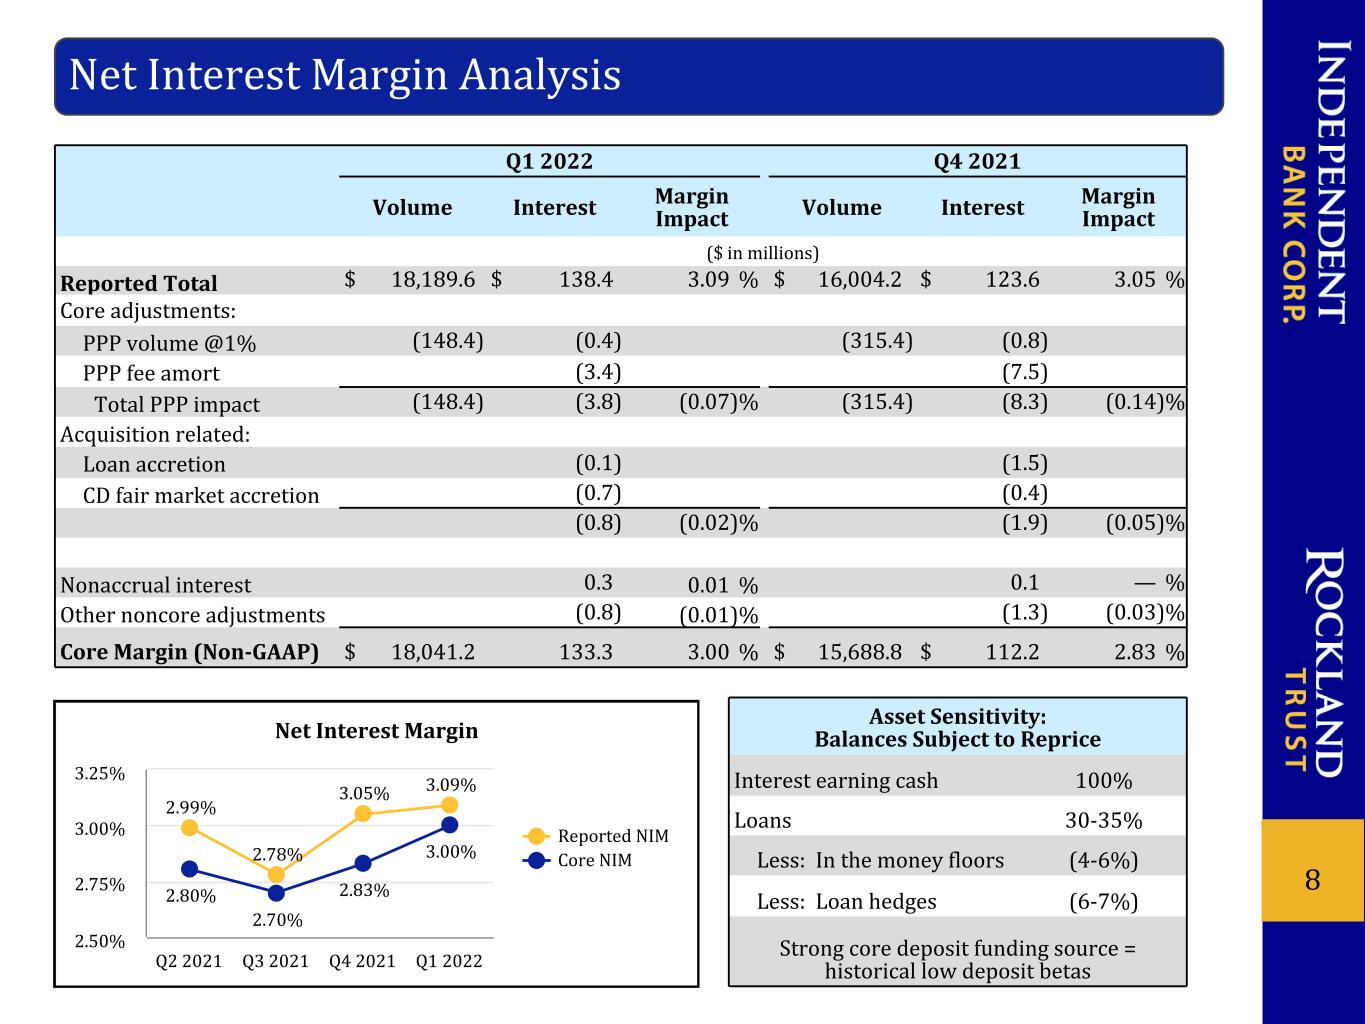
Q1 2022 Q4 2021 Volume Interest Margin Impact Volume Interest Margin Impact ($ in millions) Reported Total $ 18,189.6 $ 138.4 3.09 % $ 16,004.2 $ 123.6 3.05 % Core adjustments: PPP volume @1% (148.4) (0.4) (315.4) (0.8) PPP fee amort (3.4) (7.5) Total PPP impact (148.4) (3.8) (0.07) % (315.4) (8.3) (0.14) % Acquisition related: Loan accretion (0.1) (1.5) CD fair market accretion (0.7) (0.4) (0.8) (0.02) % (1.9) (0.05) % Nonaccrual interest 0.3 0.01 % 0.1 — % Other noncore adjustments (0.8) (0.01) % (1.3) (0.03) % Core Margin (Non-GAAP) $ 18,041.2 133.3 3.00 % $ 15,688.8 $ 112.2 2.83 % 8 Net Interest Margin Analysis Net Interest Margin 2.99% 2.78% 3.05% 3.09% 2.80% 2.70% 2.83% 3.00% Reported NIM Core NIM Q2 2021 Q3 2021 Q4 2021 Q1 2022 2.50% 2.75% 3.00% 3.25% Asset Sensitivity: Balances Subject to Reprice Interest earning cash 100% Loans 30-35% Less: In the money floors (4-6%) Less: Loan hedges (6-7%) Strong core deposit funding source = historical low deposit betas
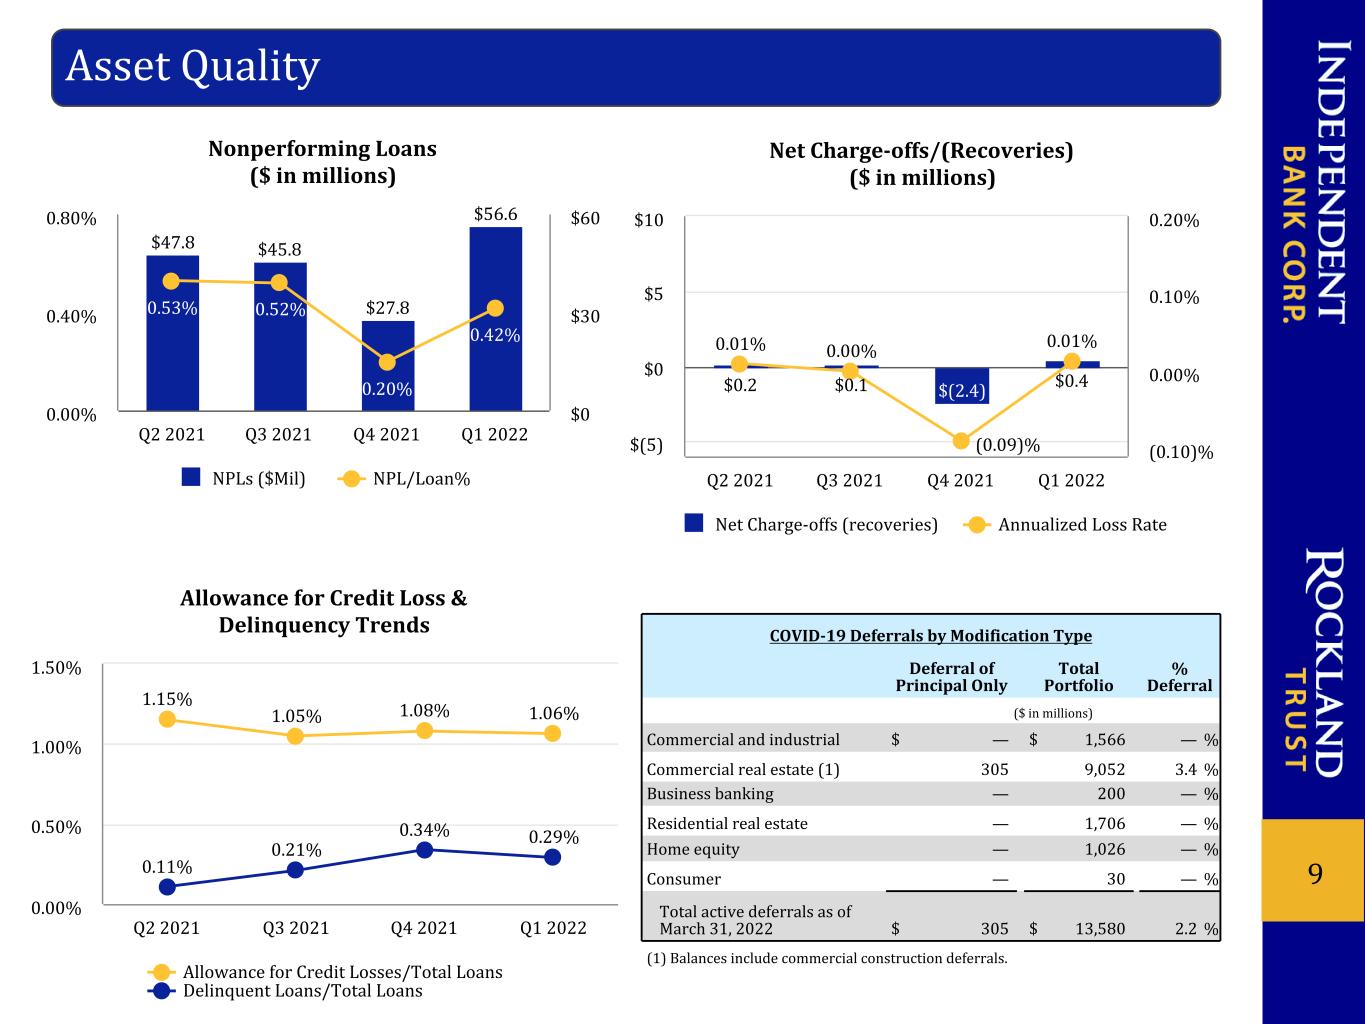
9 Nonperforming Loans ($ in millions) $47.8 $45.8 $27.8 $56.6 0.53% 0.52% 0.20% 0.42% NPLs ($Mil) NPL/Loan% Q2 2021 Q3 2021 Q4 2021 Q1 2022 0.00% 0.40% 0.80% $0 $30 $60 Net Charge-offs/(Recoveries) ($ in millions) $0.2 $0.1 $(2.4) $0.4 0.01% 0.00% (0.09)% 0.01% Net Charge-offs (recoveries) Annualized Loss Rate Q2 2021 Q3 2021 Q4 2021 Q1 2022 $(5) $0 $5 $10 (0.10)% 0.00% 0.10% 0.20% COVID-19 Deferrals by Modification Type Deferral of Principal Only Total Portfolio % Deferral ($ in millions) Commercial and industrial $ — $ 1,566 — % Commercial real estate (1) 305 9,052 3.4 % Business banking — 200 — % Residential real estate — 1,706 — % Home equity — 1,026 — % Consumer — 30 — % Total active deferrals as of March 31, 2022 $ 305 $ 13,580 2.2 % (1) Balances include commercial construction deferrals. Asset Quality Allowance for Credit Loss & Delinquency Trends 1.15% 1.05% 1.08% 1.06% 0.11% 0.21% 0.34% 0.29% Allowance for Credit Losses/Total Loans Delinquent Loans/Total Loans Q2 2021 Q3 2021 Q4 2021 Q1 2022 0.00% 0.50% 1.00% 1.50%
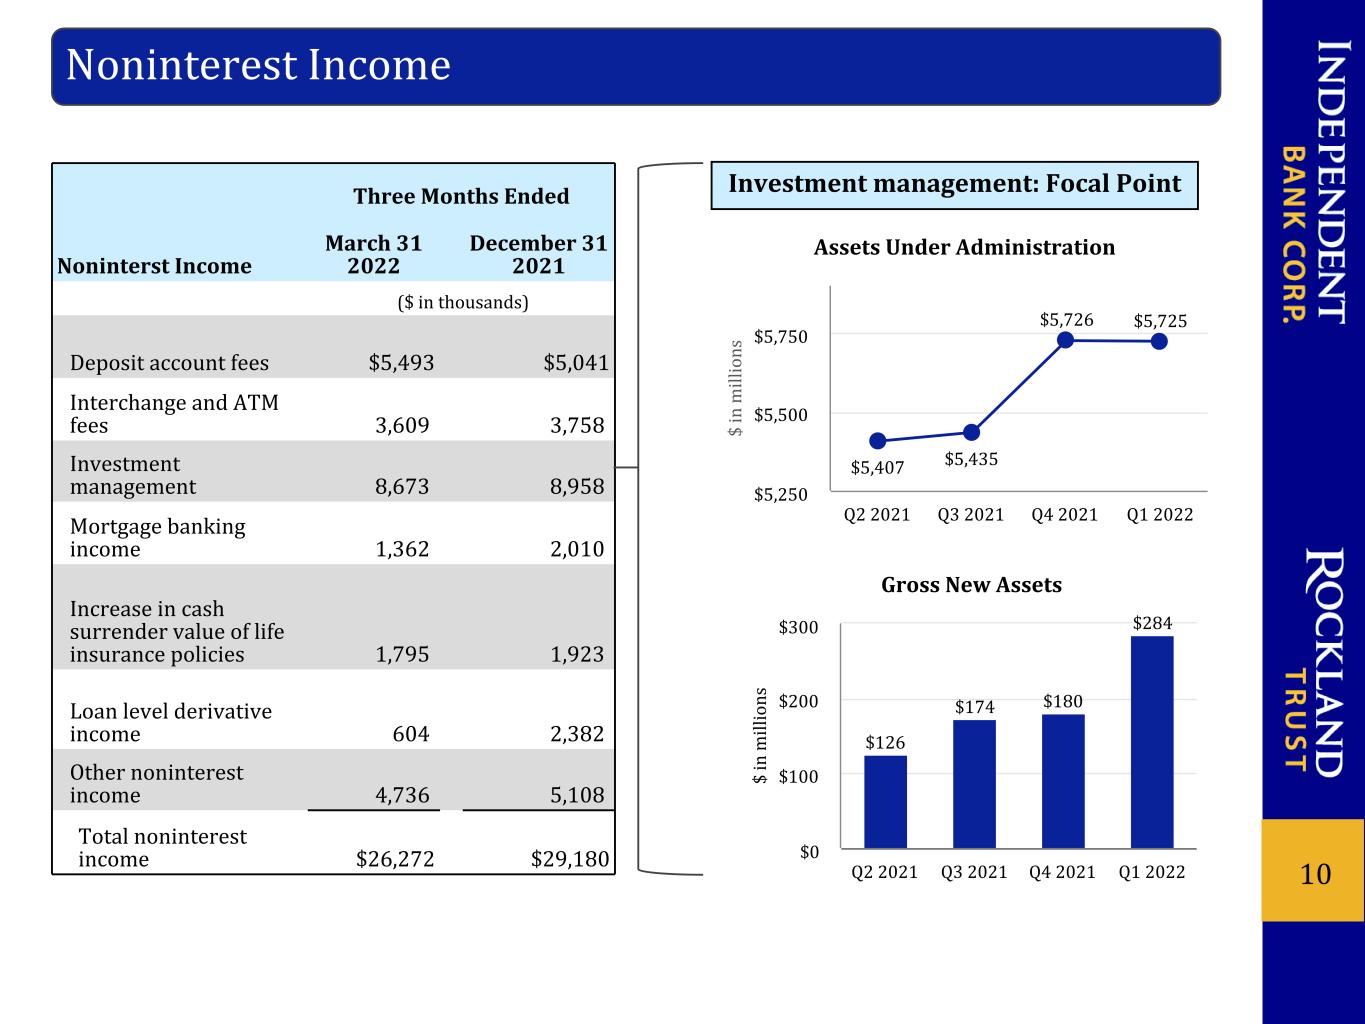
10 Noninterest Income Three Months Ended Noninterst Income March 31 2022 December 31 2021 ($ in thousands) Deposit account fees $5,493 $5,041 Interchange and ATM fees 3,609 3,758 Investment management 8,673 8,958 Mortgage banking income 1,362 2,010 Increase in cash surrender value of life insurance policies 1,795 1,923 Loan level derivative income 604 2,382 Other noninterest income 4,736 5,108 Total noninterest income $26,272 $29,180 $ in m ill io ns Assets Under Administration $5,407 $5,435 $5,726 $5,725 Q2 2021 Q3 2021 Q4 2021 Q1 2022 $5,250 $5,500 $5,750 Investment management: Focal Point $ in m ill io ns Gross New Assets $126 $174 $180 $284 Q2 2021 Q3 2021 Q4 2021 Q1 2022 $0 $100 $200 $300
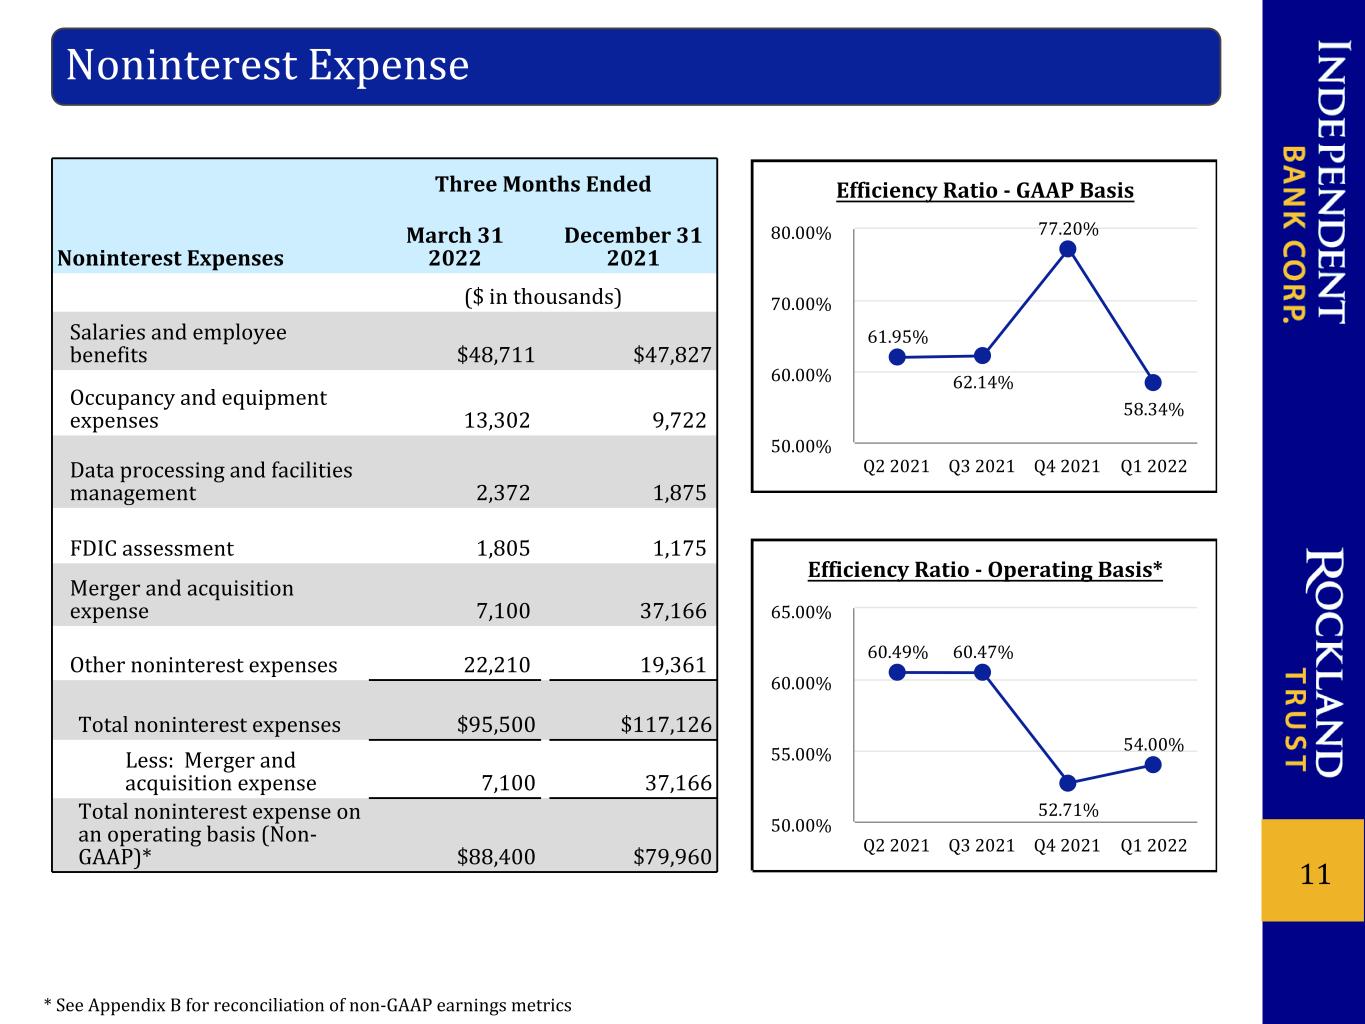
11 Efficiency Ratio - Operating Basis* 60.49% 60.47% 52.71% 54.00% Q2 2021 Q3 2021 Q4 2021 Q1 2022 50.00% 55.00% 60.00% 65.00% Noninterest Expense * See Appendix B for reconciliation of non-GAAP earnings metrics Three Months Ended Noninterest Expenses March 31 2022 December 31 2021 ($ in thousands) Salaries and employee benefits $48,711 $47,827 Occupancy and equipment expenses 13,302 9,722 Data processing and facilities management 2,372 1,875 FDIC assessment 1,805 1,175 Merger and acquisition expense 7,100 37,166 Other noninterest expenses 22,210 19,361 Total noninterest expenses $95,500 $117,126 Less: Merger and acquisition expense 7,100 37,166 Total noninterest expense on an operating basis (Non- GAAP)* $88,400 $79,960 Efficiency Ratio - GAAP Basis 61.95% 62.14% 77.20% 58.34% Q2 2021 Q3 2021 Q4 2021 Q1 2022 50.00% 60.00% 70.00% 80.00%
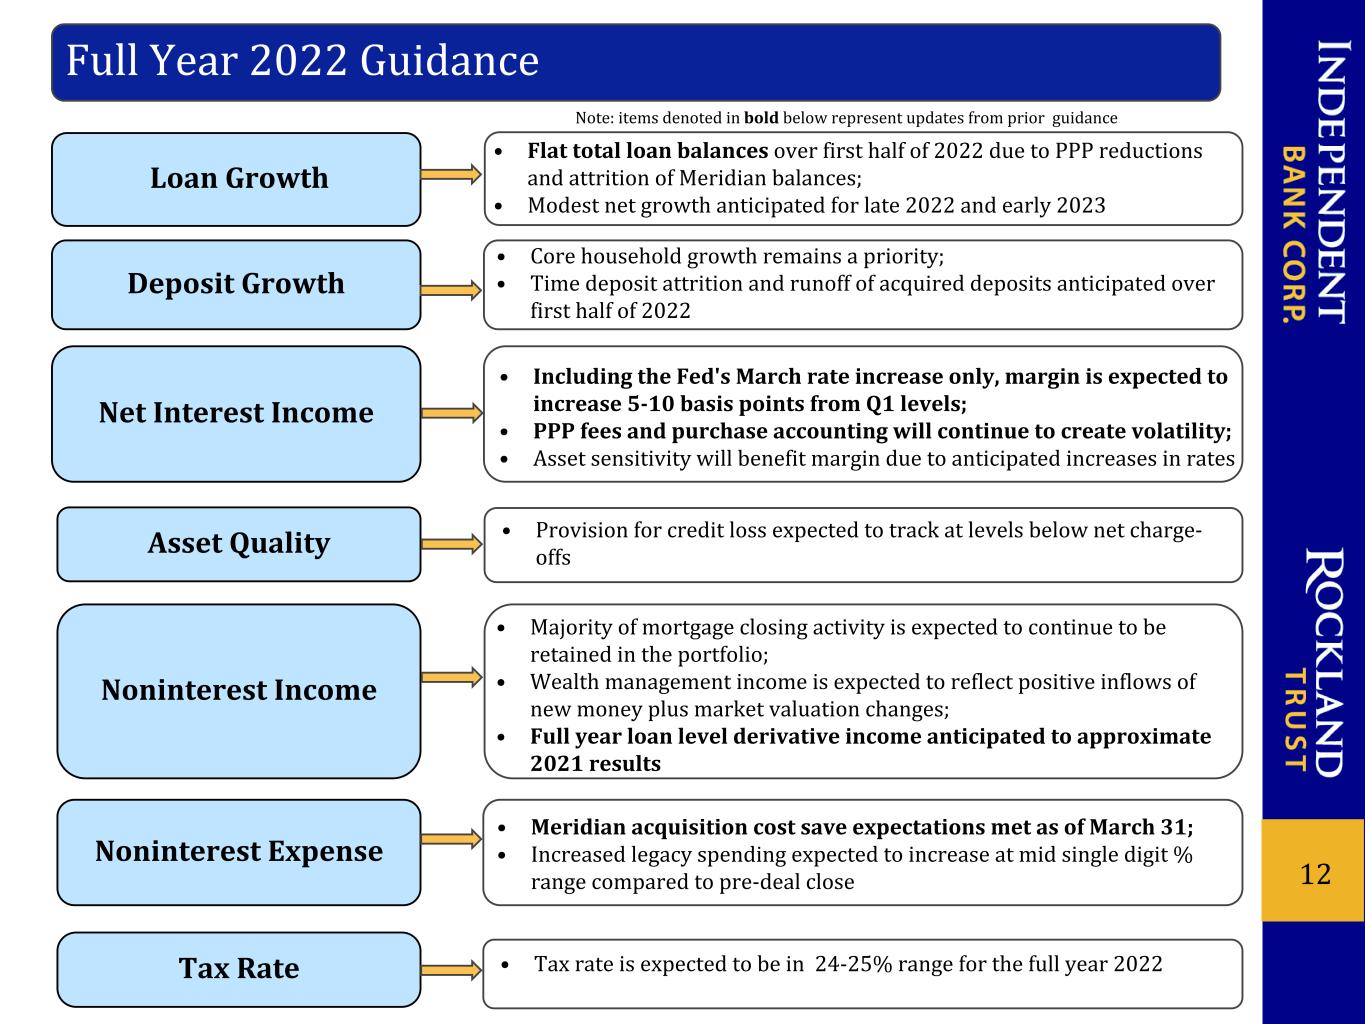
12 Tax Rate Loan Growth Deposit Growth Noninterest Income Asset Quality Full Year 2022 Guidance • Flat total loan balances over first half of 2022 due to PPP reductions and attrition of Meridian balances; • Modest net growth anticipated for late 2022 and early 2023 • Including the Fed's March rate increase only, margin is expected to increase 5-10 basis points from Q1 levels; • PPP fees and purchase accounting will continue to create volatility; • Asset sensitivity will benefit margin due to anticipated increases in rates • Core household growth remains a priority; • Time deposit attrition and runoff of acquired deposits anticipated over first half of 2022 • Majority of mortgage closing activity is expected to continue to be retained in the portfolio; • Wealth management income is expected to reflect positive inflows of new money plus market valuation changes; • Full year loan level derivative income anticipated to approximate 2021 results • Tax rate is expected to be in 24-25% range for the full year 2022 Net Interest Income • Provision for credit loss expected to track at levels below net charge- offs Noninterest Expense • Meridian acquisition cost save expectations met as of March 31; • Increased legacy spending expected to increase at mid single digit % range compared to pre-deal close Note: items denoted in bold below represent updates from prior guidance
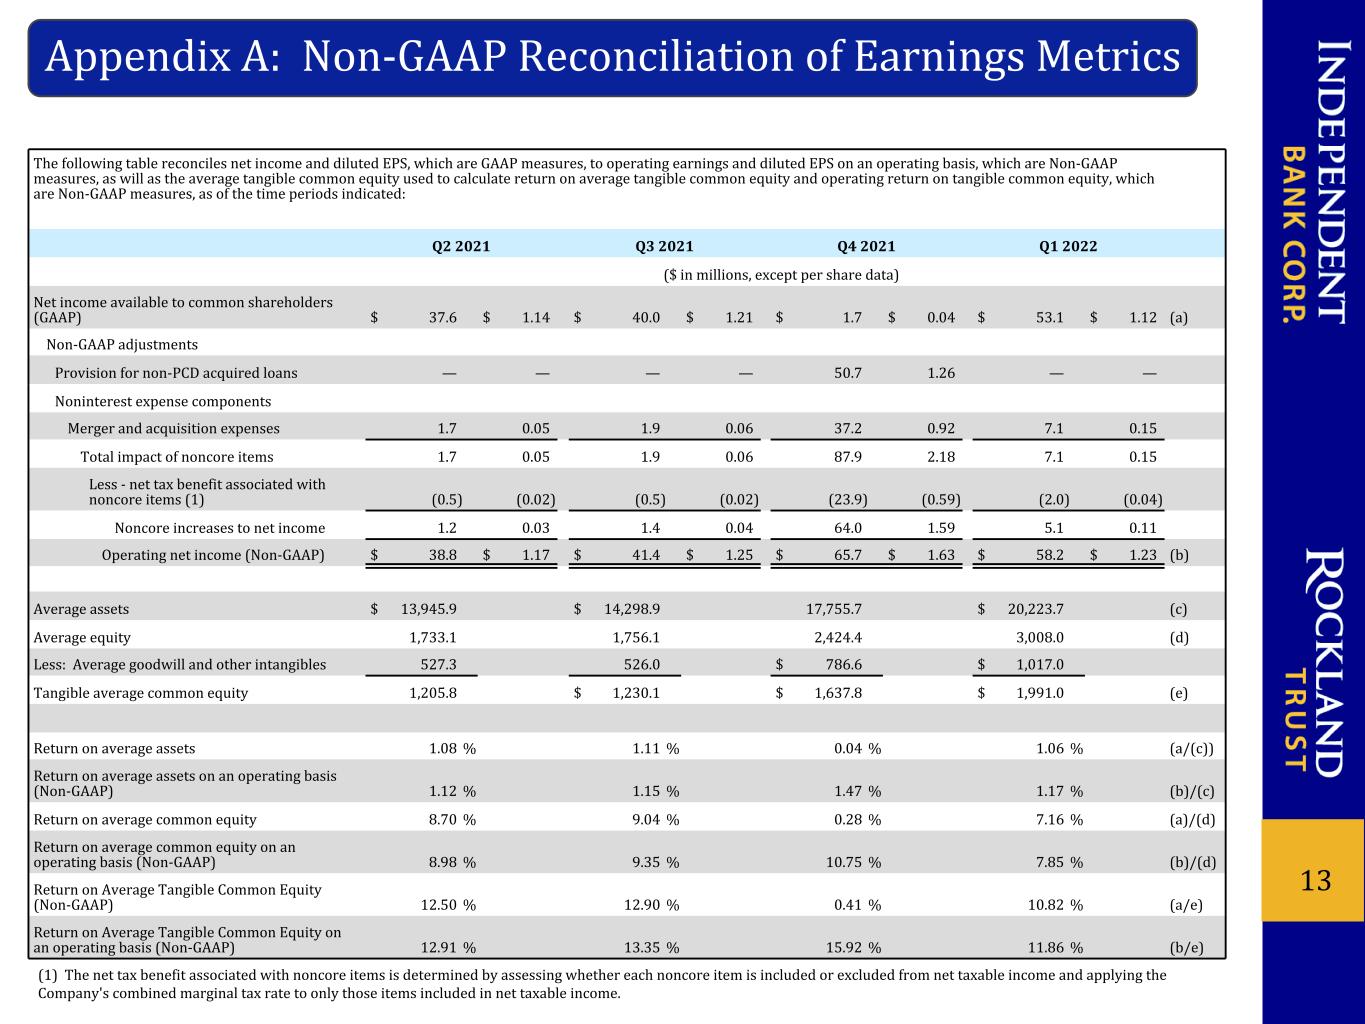
The following table reconciles net income and diluted EPS, which are GAAP measures, to operating earnings and diluted EPS on an operating basis, which are Non-GAAP measures, as will as the average tangible common equity used to calculate return on average tangible common equity and operating return on tangible common equity, which are Non-GAAP measures, as of the time periods indicated: Q2 2021 Q3 2021 Q4 2021 Q1 2022 ($ in millions, except per share data) Net income available to common shareholders (GAAP) $ 37.6 $ 1.14 $ 40.0 $ 1.21 $ 1.7 $ 0.04 $ 53.1 $ 1.12 (a) Non-GAAP adjustments Provision for non-PCD acquired loans — — — — 50.7 1.26 — — Noninterest expense components Merger and acquisition expenses 1.7 0.05 1.9 0.06 37.2 0.92 7.1 0.15 Total impact of noncore items 1.7 0.05 1.9 0.06 87.9 2.18 7.1 0.15 Less - net tax benefit associated with noncore items (1) (0.5) (0.02) (0.5) (0.02) (23.9) (0.59) (2.0) (0.04) Noncore increases to net income 1.2 0.03 1.4 0.04 64.0 1.59 5.1 0.11 Operating net income (Non-GAAP) $ 38.8 $ 1.17 $ 41.4 $ 1.25 $ 65.7 $ 1.63 $ 58.2 $ 1.23 (b) Average assets $ 13,945.9 $ 14,298.9 17,755.7 $ 20,223.7 (c) Average equity 1,733.1 1,756.1 2,424.4 3,008.0 (d) Less: Average goodwill and other intangibles 527.3 526.0 $ 786.6 $ 1,017.0 Tangible average common equity 1,205.8 $ 1,230.1 $ 1,637.8 $ 1,991.0 (e) Return on average assets 1.08 % 1.11 % 0.04 % 1.06 % (a/(c)) Return on average assets on an operating basis (Non-GAAP) 1.12 % 1.15 % 1.47 % 1.17 % (b)/(c) Return on average common equity 8.70 % 9.04 % 0.28 % 7.16 % (a)/(d) Return on average common equity on an operating basis (Non-GAAP) 8.98 % 9.35 % 10.75 % 7.85 % (b)/(d) Return on Average Tangible Common Equity (Non-GAAP) 12.50 % 12.90 % 0.41 % 10.82 % (a/e) Return on Average Tangible Common Equity on an operating basis (Non-GAAP) 12.91 % 13.35 % 15.92 % 11.86 % (b/e) Appendix A: Non-GAAP Reconciliation of Earnings Metrics 13 (1) The net tax benefit associated with noncore items is determined by assessing whether each noncore item is included or excluded from net taxable income and applying the Company's combined marginal tax rate to only those items included in net taxable income.
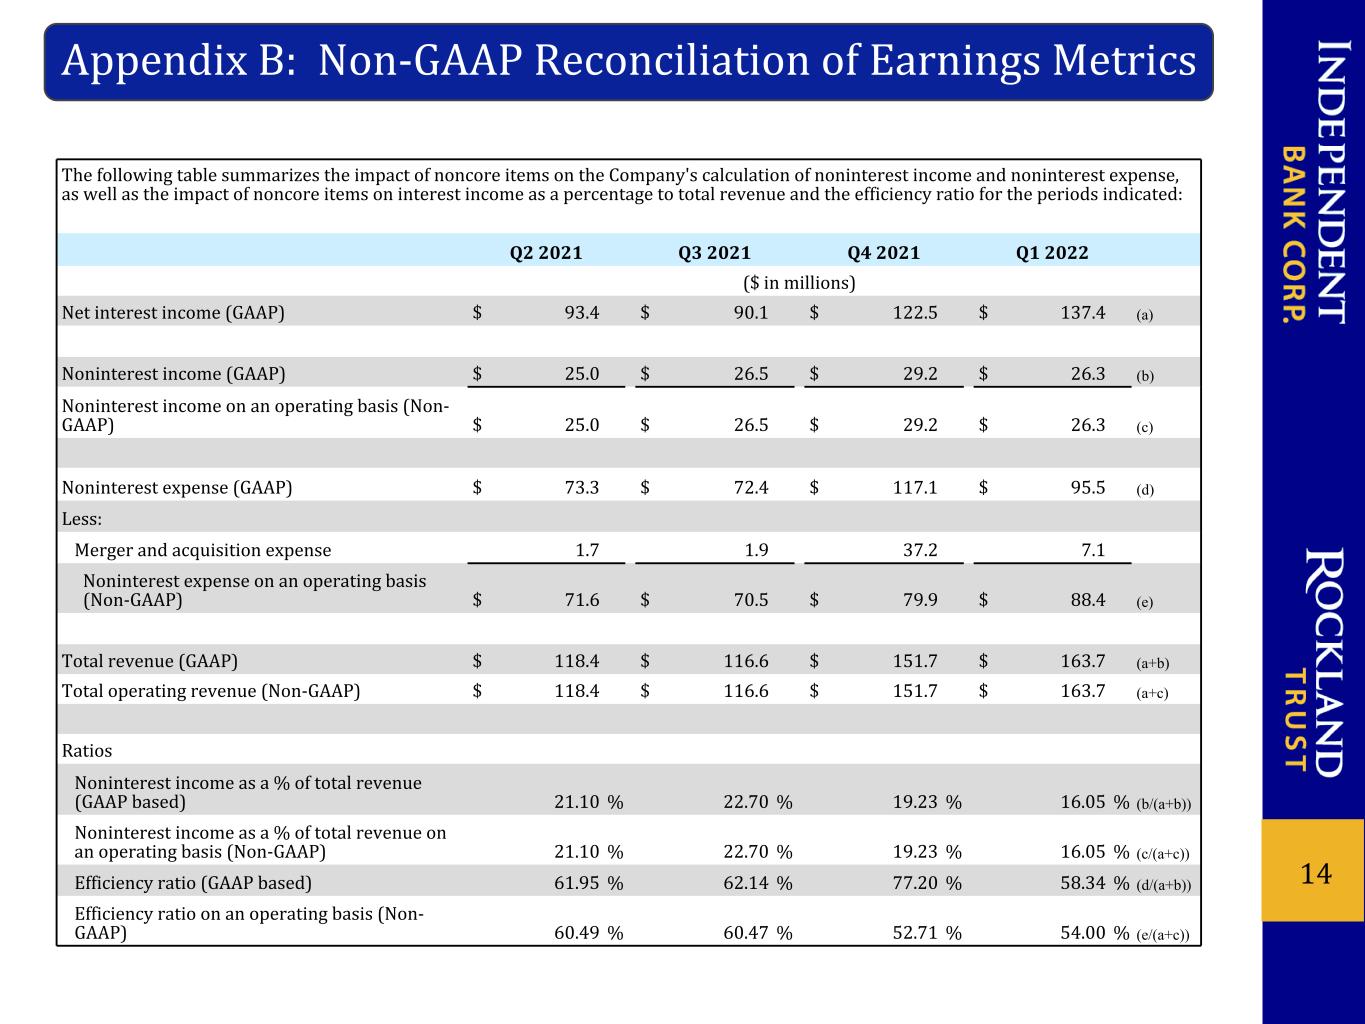
The following table summarizes the impact of noncore items on the Company's calculation of noninterest income and noninterest expense, as well as the impact of noncore items on interest income as a percentage to total revenue and the efficiency ratio for the periods indicated: Q2 2021 Q3 2021 Q4 2021 Q1 2022 ($ in millions) Net interest income (GAAP) $ 93.4 $ 90.1 $ 122.5 $ 137.4 (a) Noninterest income (GAAP) $ 25.0 $ 26.5 $ 29.2 $ 26.3 (b) Noninterest income on an operating basis (Non- GAAP) $ 25.0 $ 26.5 $ 29.2 $ 26.3 (c) Noninterest expense (GAAP) $ 73.3 $ 72.4 $ 117.1 $ 95.5 (d) Less: Merger and acquisition expense 1.7 1.9 37.2 7.1 Noninterest expense on an operating basis (Non-GAAP) $ 71.6 $ 70.5 $ 79.9 $ 88.4 (e) Total revenue (GAAP) $ 118.4 $ 116.6 $ 151.7 $ 163.7 (a+b) Total operating revenue (Non-GAAP) $ 118.4 $ 116.6 $ 151.7 $ 163.7 (a+c) Ratios Noninterest income as a % of total revenue (GAAP based) 21.10 % 22.70 % 19.23 % 16.05 % (b/(a+b)) Noninterest income as a % of total revenue on an operating basis (Non-GAAP) 21.10 % 22.70 % 19.23 % 16.05 % (c/(a+c)) Efficiency ratio (GAAP based) 61.95 % 62.14 % 77.20 % 58.34 % (d/(a+b)) Efficiency ratio on an operating basis (Non- GAAP) 60.49 % 60.47 % 52.71 % 54.00 % (e/(a+c)) Appendix B: Non-GAAP Reconciliation of Earnings Metrics 14


