Exhibit 99.1 Investor Meeting Materials Hosted by Raymond James June 12, 2023

Forward Looking Statements This presentation contains certain “forward-looking statements” within the meaning of the Private Securities Litigation Reform Act of 1995 with respect to the financial condition, results of operations and business of the Company. These statements may be identified by such forward-looking terminology as “expect,” “achieve,” “plan,” “believe,” “future,” “positioned,” “continued,” “will,” “would,” “potential,” "anticipated," "guidance," "targeted" or similar statements or variations of such terms. Actual results may differ from those contemplated by these forward-looking statements. Factors that may cause actual results to differ materially from those contemplated by such forward-looking statements include, but are not limited to: further weakening in the United States economy in general and the regional and local economies within the New England region and the Company’s market area; the effects of inflationary pressures, labor market shortages and supply chain issues; the instability or volatility in financial markets and unfavorable general economic or business conditions, globally, nationally or regionally, caused by geopolitical concerns, including as a result of the conflict between Russia and Ukraine, and as a result of recent disruptions in the banking industry; unanticipated loan delinquencies, loss of collateral, decreased service revenues, and other potential negative effects on our business caused by severe weather, pandemics or other external events; adverse changes or volatility in the local real estate market; adverse changes in asset quality and any unanticipated credit deterioration in our loan portfolio including those related to one or more large commercial relationships; acquisitions may not produce results at levels or within time frames originally anticipated and may result in unforeseen integration issues or impairment of goodwill and/or other intangibles; additional regulatory oversight and related compliance costs; changes in trade, monetary and fiscal policies and laws, including interest rate policies of the Board of Governors of the Federal Reserve System; higher than expected tax expense, resulting from failure to comply with general tax laws and changes in tax laws; changes in market interest rates for interest earning assets and/or interest bearing liabilities and changes related to the phase-out of the London Interbank Offered Rate ("LIBOR"); increased competition in the Company’s market areas; adverse weather, changes in climate, natural disasters, geopolitical concerns, including those arising from the conflict between Russia and Ukraine; the emergence of widespread health emergencies or pandemics, any further resurgences or variants of the COVID-19 virus, actions taken by governmental authorities in response thereto, other public health crises or man-made events, and their impact on the Company's local economies or the Company's operations; a deterioration in the conditions of the securities markets, a deterioration in the conditions of the securities markets; a deterioration of the credit rating for U.S. long-term sovereign debt, actions that the U.S. government may take to avoid exceeding the debt ceiling, or uncertainties surrounding the debt ceiling and the federal budget; inability to adapt to changes in information technology, including changes to industry accepted delivery models driven by a migration to the internet as a means of service delivery; electronic fraudulent activity within the financial services industry, especially in the commercial banking sector; adverse changes in consumer spending and savings habits; the effect of laws and regulations regarding the financial services industry; changes in laws and regulations (including laws and regulations concerning taxes, banking, securities and insurance) generally applicable to the Company’s business, including any such changes in laws and regulations as a result of recent disruption in the banking industry, and the associated costs of such changes; the Company's potential judgments, claims, damages, penalties, fines and reputational damage resulting from pending or future litigation and regulatory and government actions; changes in accounting policies, practices and standards, as may be adopted by the regulatory agencies as well as the Public Company Accounting Oversight Board, the Financial Accounting Standards Board, and other accounting standard setters; cyber security attacks or intrusions that could adversely impact our businesses; and other unexpected material adverse changes in our operations or earnings. The Company wishes to caution readers not to place undue reliance on any forward-looking statements as the Company’s business and its forward- looking statements involve substantial known and unknown risks and uncertainties described in the Company’s Annual Report on Form 10-K and subsequent Quarterly Reports on Form 10-Q (“Risk Factors”). Except as required by law, the Company disclaims any intent or obligation to update publicly any such forward- looking statements, whether in response to new information, future events or otherwise. Any public statements or disclosures by the Company following this presentation which modify or impact any of the forward-looking statements contained in this presentation will be deemed to modify or supersede such statements in this presentation. In addition to the information set forth in this presentation, you should carefully consider the Risk Factors. 2

3 Deposits Period Ended Household Count 5/31/2023 3/31/2023 # Increase % Increase Total Households 326,427 324,470 1,957 0.6% ($ in millions) Period Ended $ Increase (Decrease) % Increase (Decrease)Deposit Product Type 5/31/2023 3/31/2023 Noninterest-bearing demand deposits $4,856 $5,084 $(228) (4.5)% Savings and interest checking accounts 5,522 5,639 (117) (2.1)% Money market deposits 3,026 3,094 (68) (2.2)% Time certificates of deposit 1,698 1,455 243 16.7% Total deposits $15,102 $15,272 $(170) (1.1)%

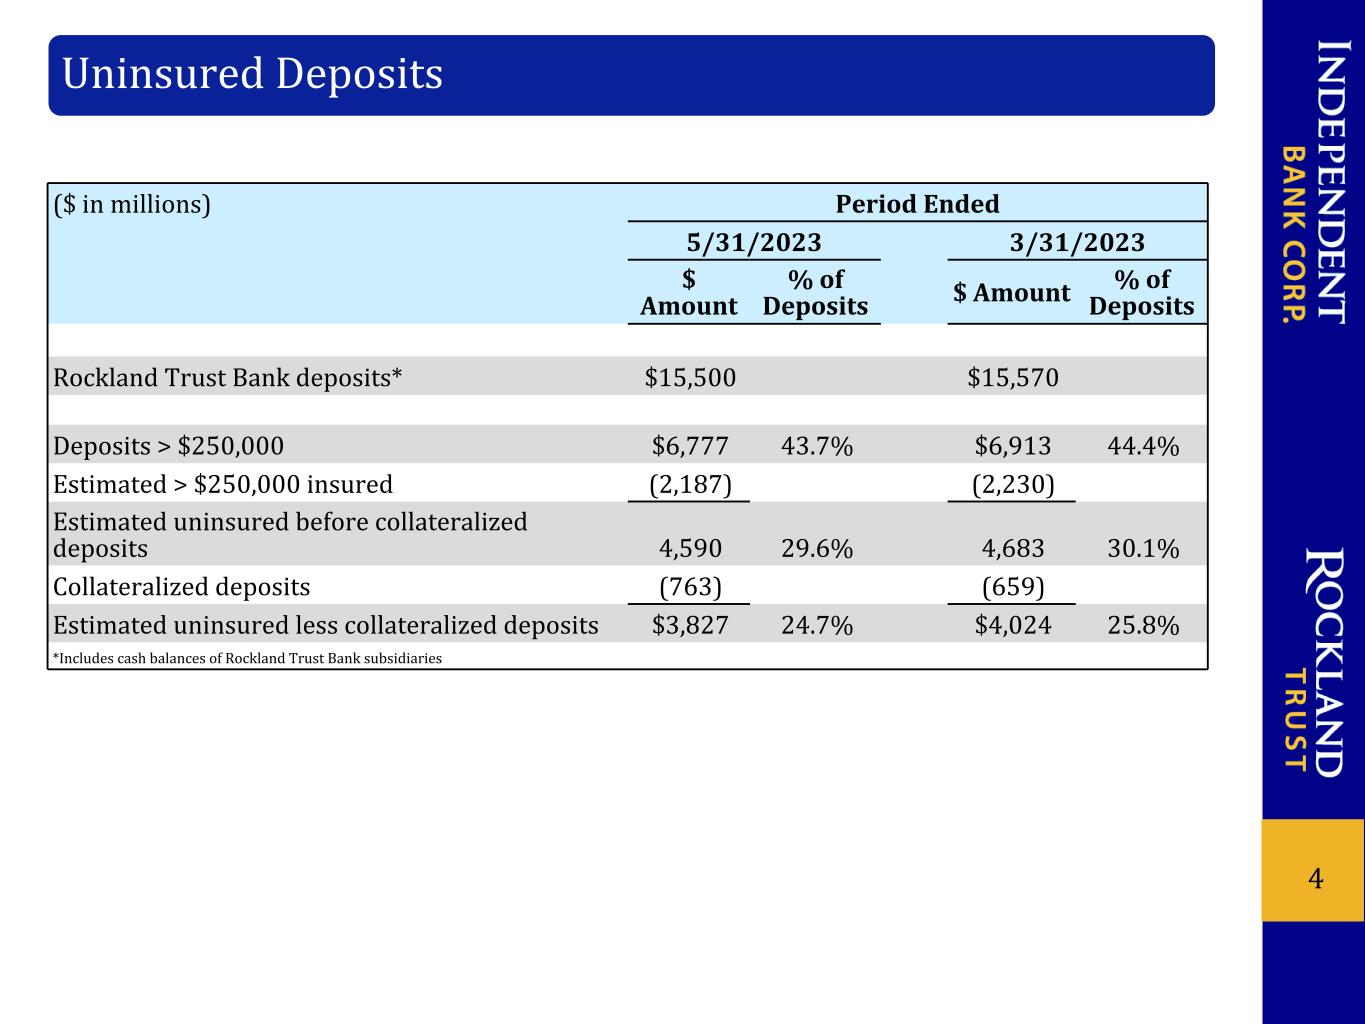
4 Uninsured Deposits ($ in millions) Period Ended 5/31/2023 3/31/2023 $ Amount % of Deposits $ Amount % of Deposits Rockland Trust Bank deposits* $15,500 $15,570 Deposits > $250,000 $6,777 43.7% $6,913 44.4% Estimated > $250,000 insured (2,187) (2,230) Estimated uninsured before collateralized deposits 4,590 29.6% 4,683 30.1% Collateralized deposits (763) (659) Estimated uninsured less collateralized deposits $3,827 24.7% $4,024 25.8% *Includes cash balances of Rockland Trust Bank subsidiaries

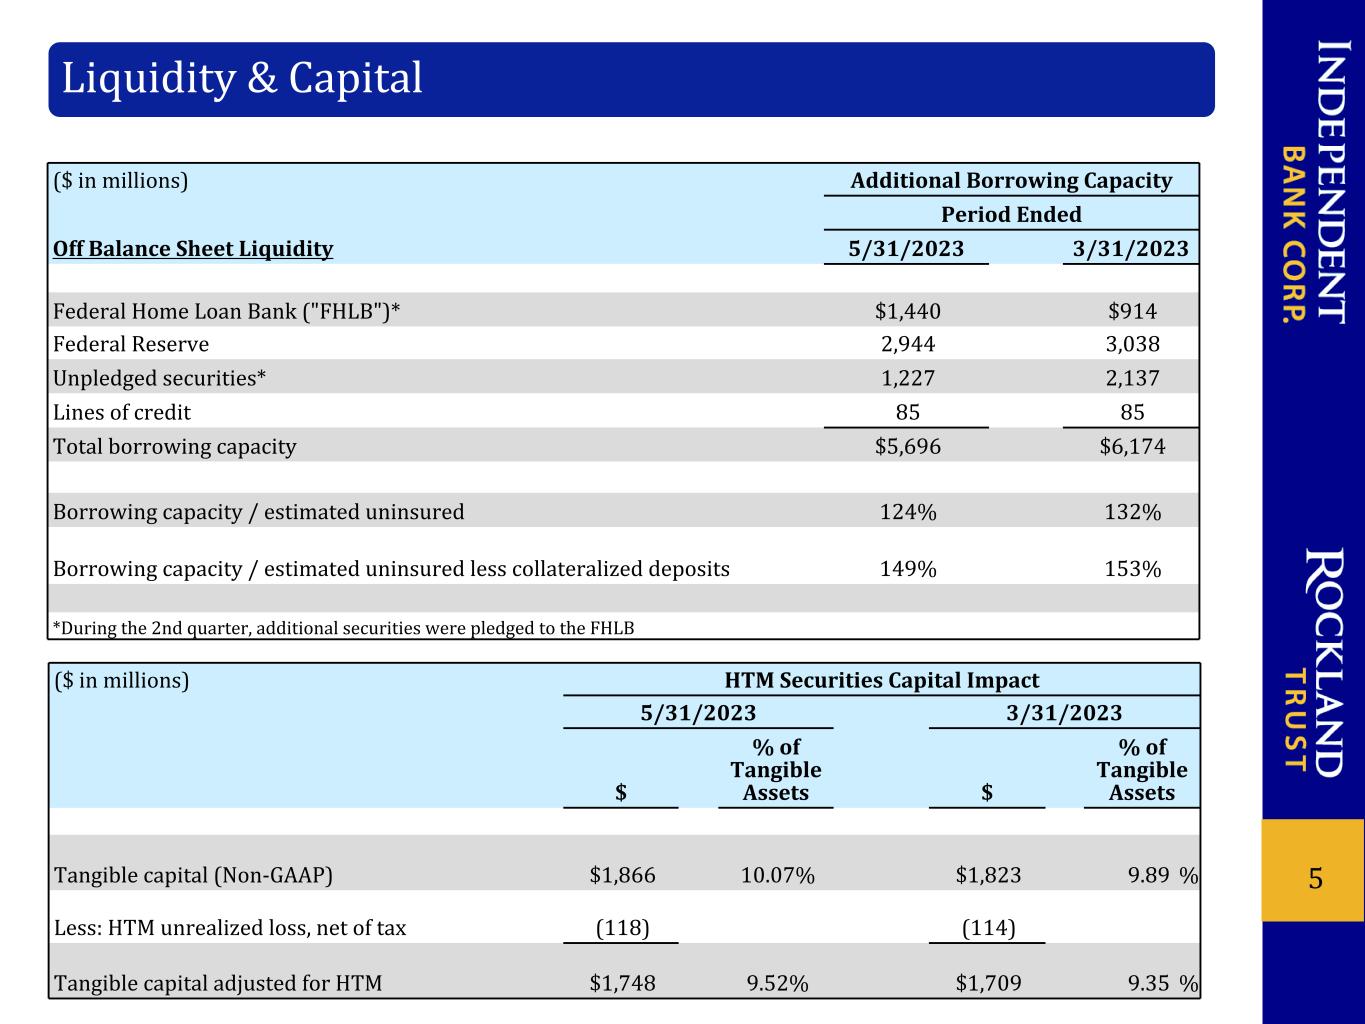
5 Liquidity & Capital ($ in millions) Additional Borrowing Capacity Period Ended Off Balance Sheet Liquidity 5/31/2023 3/31/2023 Federal Home Loan Bank ("FHLB")* $1,440 $914 Federal Reserve 2,944 3,038 Unpledged securities* 1,227 2,137 Lines of credit 85 85 Total borrowing capacity $5,696 $6,174 Borrowing capacity / estimated uninsured 124% 132% Borrowing capacity / estimated uninsured less collateralized deposits 149% 153% *During the 2nd quarter, additional securities were pledged to the FHLB ($ in millions) HTM Securities Capital Impact 5/31/2023 3/31/2023 $ % of Tangible Assets $ % of Tangible Assets Tangible capital (Non-GAAP) $1,866 10.07% $1,823 9.89 % Less: HTM unrealized loss, net of tax (118) (114) Tangible capital adjusted for HTM $1,748 9.52% $1,709 9.35 %

6 Loans ($ in millions) Period Ended $ Increase % Increase Loan Category 5/31/2023 3/31/2023 (Decrease) (Decrease) Commercial and industrial $1,713 $1,650 $63 3.8% Commercial real estate 7,778 7,820 (42) (0.5)% Commercial construction 1,052 1,046 6 0.6% Small business 232 226 6 2.7% Total commercial 10,775 10,742 33 0.3% Residential real estate 2,180 2,096 84 4.0% Home equity - first position 551 557 (6) (1.1)% Home equity - subordinate positions 544 534 10 1.9% Total consumer real estate 3,275 3,187 88 2.8% Other consumer 29 19 10 52.6% Total loans $14,079 $13,948 $131 0.9%

7 95% ($ in millions) Period End 5/31/2023 3/31/2023 Total CRE Office $1,672 $1,662 Less: Owner Occupied CRE Office 219 218 Non-Owner Occupied CRE Office ("NOO Office")* $1,453 $1,444 NOO Office 5/31/2023 % of Total Loans Avg. Loan Size ($ in millions) Class A $500 3.6% $10.5 Class B/C 454 3.2% 6.6 Medical office 115 0.8% 2.5 Mixed use office/retail 384 2.7% 15.1 $1,453 10.3% $8.7 NOO Office Credit Characteristics Weighted Average LTV 56% Weighted Average DSC 1.6 ($ in millions) 5/31/2023 % of NOO Office Total Criticized $107 7.4% Total Classified $14 1.0% Focal Point: Non-Owner Occupied CRE Office (inclusive of construction) *NOO Office balances above are inclusive of $133 million and $126 million of construction loans at 5/31/2023 and 3/31/23, respectively. Other NOO Office Characteristics • $174 million, or 12%, of NOO Office is located in Boston Financial District/Back Bay • 80% of NOO Office is fixed to customers • 23% will mature and an additional 10% will reprice in the next 2 years • Unfunded construction commitments of $102 million

8 Q2 2023 Forward Guidance Previous Guidance - 4/20/2023 Updated Guidance - 6/12/2023 Loans Flat overall loan balances Q2 2023: flat to up slightly H2 2023: flat overall loan balances Deposits Deposit pricing remains elevated Composition: continued migration from noninterest-bearing to interest-bearing Total deposit balances remain under pressure Deposit pricing remains elevated Composition: continued migration from noninterest-bearing to interest-bearing Total deposit balances stabilizing Borrowings Balances to fluctuate based on loan and deposit flows Guidance unchanged Net Interest Margin Continue to contract due to increased cost of deposits and funding costs Q2 2023 estimated net interest margin at 3.50% Asset Quality Provision amounts expected to decline, barring no change to current credit environment Guidance unchanged Non-interest items Noninterest income expect flat to low single digit growth Noninterest expense expected to remain relatively flat Noninterest income guidance unchanged Noninterest expense expected to be flat to down slightly


