As filed with the Securities and Exchange Commission on August 3, 2012
Registration No. 333-
SECURITIES AND EXCHANGE COMMISSION
Washington, D.C. 20549
REGISTRATION STATEMENT
UNDER
SCHEDULE B
OF
THE SECURITIES ACT OF 1933
Republic of Peru
(Name of Registrant)
Fortunato Quesada Seminario
Consulate General of Peru
241 East 49th Street
New York, New York 10017
(Name and address of Authorized Representative
of the Registrant in the United States)
Copies to:
Jaime Mercado, Esq.
Simpson Thacher & Bartlett LLP
425 Lexington Avenue
New York, New York 10017
Approximate date of commencement of proposed sale to the public:
From time to time after this Registration Statement becomes effective.
CALCULATION OF REGISTRATION FEE
| | | | | | | | |
|
Title of Each Class of Securities To Be Registered | | Amount To Be
Registered(1)(2) | | Proposed Maximum Offering Price Per Unit(3)(4) | | Proposed Maximum Aggregate Offering
Price(1)(2)(3)(4) | | Amount of
Registration Fee |
Debt Securities | | (5)(6) | | | | | | |
Warrants | | (5)(7) | | | | | | |
Units | | (5) | | | | | | |
Total: | | $4,500,000,000 | | 100% | | $4,500,000,000 | | (8) |
|
|
| (1) | In United States dollars or the equivalent thereof in any other currency, currency unit or units, or composite currency or currencies. |
| (2) | Such amount represents the principal amount of any debt securities issued at their principal amount, the issue price rather than the principal amount of any debt securities issued at an original issue discount, the issue price of any warrants and the exercise price of any debt securities issuable upon exercise of warrants. |
| (3) | Estimated solely for the purpose of computing the amount of the registration fee. |
| (4) | Exclusive of accrued interest, if any. |
| (5) | Such indeterminate number or principal amount of debt securities, warrants and units as may from time to time be issued at indeterminate prices. The securities registered hereunder shall not have an aggregate offering price which exceeds $5,000,000,000 in United States dollars or the equivalent in any other currency. |
| (6) | Also includes such indeterminate number of debt securities as may be issued upon conversion or exchange of any debt securities that provide for exchange into other securities or upon exercise of warrants for such securities. |
| (7) | Warrants may be sold separately or with debt securities. |
| (8) | This Registration Statement carries forward $4,500,000,000 aggregate principal amount of debt securities covered by the Registrant’s Registration Statement No. 333-174779 filed on August 23, 2011. |
The registrant hereby amends this registration statement on such date or dates as may be necessary to delay its effective date until the registrant shall file a further amendment which specifically states that this registration statement shall thereafter become effective in accordance with Section 8(a) of the Securities Act of 1933 or until the registration statement shall become effective on such date as the Commission, acting pursuant to said Section 8(a), may determine.
Pursuant to the provisions of Rule 429 under the Securities Act of 1933, the Prospectus contained herein also relates to debt securities, warrants and/or units having an aggregate principal amount of $4,500,000,000 or the equivalent thereof in currency, currency units or units, registered under the Registrant’s Registration Statement No. 333-174779 under Schedule B and not previously sold in the United States. In the event any previously registered debt securities and/or units are offered prior to the effective date of this Registration Statement, they will not be included in any prospectus hereunder.
CROSS REFERENCE SHEET
Between Schedule B of the Securities Act of 1933
and the Prospectus
| | |
Schedule B Item Number | | Location in Prospectus |
| |
1. | | Cover Page |
2. | | Use of Proceeds* |
3. | | Public Sector Debt; Description of the Securities; Tables and Other Supplemental Information* |
4. | | Public Sector Debt |
5. | | Public Sector Finances |
6. | | * |
7. | | Authorized Representative |
8. | | * |
9. | | * |
10. | | Plan of Distribution* |
11. | | ** |
12. | | Validity of the Securities** |
13. | | ** |
14. | | ** |
| * | Information to be provided from time to time in prospectus supplements to be delivered in connection with an offering of debt securities, warrants or units. |
| ** | Information included in Part II of this Registration Statement or as an exhibit thereto or to be filed by one or more amendments to this Registration Statement. |
The information in this prospectus is not complete and may be changed. We may not sell these securities until the registration statement filed with the Securities and Exchange Commission is effective. This prospectus is not an offer to sell these securities and it is not soliciting an offer to buy these securities in any state where the offer or sale is not permitted.
SUBJECT TO COMPLETION DATED AUGUST 3, 2012
PROSPECTUS

The Republic of Peru
Debt Securities
Warrants
Units
Peru may from time to time offer and sell its debt securities, warrants and units in amounts, at prices and on terms to be determined at the time of sale and provided in one or more supplements to this prospectus. Peru may offer securities with an aggregate principal amount of up to U.S.$4,500,000,000 (or its equivalent in other currencies). The debt securities will be direct, general, unconditional, unsubordinated and unsecured obligations of Peru. Peru has pledged its full faith and credit to make all payments on the debt securities when due. The debt securities will rank equally, without any preference among themselves, with all other existing and future unsecured and unsubordinated external indebtedness of Peru.
Peru will provide specific terms of the securities in one or more supplements to this prospectus. This prospectus may not be used to make offers or sales of securities unless accompanied by a prospectus supplement.
Peru may sell the securities directly, through agents designated from time to time or through underwriters or dealers. The names of any agents or underwriters will be provided in the applicable prospectus supplement.
You should read this prospectus and any prospectus supplements carefully before you invest. You should rely only on the information contained or incorporated by reference in this prospectus or any prospectus supplement. Peru has not authorized anyone to provide you with different or additional information. You should not assume that the information in this prospectus, any prospectus supplement or any document incorporated by reference in them is accurate as of any date other than the date on the front of those documents.
Neither the Securities and Exchange Commission nor any state securities commission has approved or disapproved of these securities or determined if this prospectus is truthful or complete. Any representation to the contrary is a criminal offense.
The date of this prospectus is August 3, 2012.
You should rely only on the information contained in this prospectus or the information to which Peru has referred you. Peru has not authorized anyone to provide you with different information. Peru is not making an offer of these securities in any jurisdiction where the offer is not permitted. This prospectus may be used only where it is legal to sell these securities. The information in this document may be accurate only on the date of this document.
TABLE OF CONTENTS
ABOUT THIS PROSPECTUS
This prospectus provides you with a general description of the securities that Peru may offer under the “shelf” registration statement it has filed with the SEC. Each time Peru sells some of the securities pursuant to that registration statement, it will provide a prospectus supplement that will contain specific information about the terms of that offering. A prospectus supplement may also add, update or change information contained in this prospectus. If the information in this prospectus differs from that in any prospectus supplement, you should rely on the updated information in the prospectus supplement. You should read both this prospectus and the accompanying prospectus supplement, together with additional information described under the heading “Where You Can Find More Information”.
i
DEFINED TERMS AND CONVENTIONS
Defined Terms
References in this prospectus to “we,” “us,” “our” and “Peru” are to the Republic of Peru. All references in this prospectus to the “Government” are to the central government of Peru and its authorized representatives.
The terms described below have the following meanings for the purposes of this prospectus:
| | • | | Gross domestic product, or GDP, is a measure of the total value of final products and services produced in a country in a specific year. Nominal GDP measures the total value of final production in current prices. Real GDP measures the total value of final production in constant prices of a particular year, allowing historical GDP comparisons that exclude the effects of inflation. In this prospectus, real GDP figures are based on constant 1994 prices, the year used by the Banco Central de Reserva del Perú, or the Central Bank, for purposes of maintaining real GDP statistics. GDP growth rates and growth rates for the various sectors of Peru’s economy are based on constant 1994 prices. |
| | • | | For balance of payments purposes, imports and exports are calculated based upon statistics reported to Peru’s customs upon the entry of goods into and the departure of goods from Peru on a free-on-board, or FOB, basis at a given point of departure. Import data include data on imports through the Tacna Special Processing Area, the only one of Peru’s five free trade zones that is currently active, purchases of goods abroad by resident transport companies and ship repairs by non-residents. Export data include the gross value of marine resource catches by non-resident vessels operating with fishing licenses and the value of goods sold to non-resident transport companies. |
| | • | | The inflation rate provides an aggregate measure of the rate of change in the prices of goods and services in the economy. Peru measures the inflation rate by the percentage change in the Peruvian consumer price index, or CPI, between two periods. The CPI is based on a basket of goods and services identified by the Instituto Nacional de Estadística e Informática, or INEI. The price for each good and service that constitutes the basket is weighted according to its relative importance in order to calculate the CPI. The annual percentage change in the CPI is calculated by comparing the index as of a specific December against the index for the immediately preceding December. The average annual percentage change in the CPI is calculated by comparing the average index for a 12-month period against the average index for the immediately preceding 12-month period. INEI also compiles statistics to calculate the wholesale price index, which is used to measure the evolution in prices of a representative group of goods sold in the wholesale market in 25 cities. |
Currency of Presentation and Exchange Rate
Unless otherwise specified, references to “U.S. dollars” and “U.S.$” are to United States dollars, references to “nuevos soles” and “S/.” are to Peruvian nuevos soles, and references to “SDR” are to International Monetary Fund special drawing rights. Unless otherwise indicated, we have made translations of nuevos soles into U.S. dollars and U.S. dollars, or any other currency, into nuevos soles for each year at the year’s average exchange rate, calculated by taking an average of the exchange rates for each calendar day of the year. Currency translations are included for convenient reference only and you should not construe these conversions as a representation that the amounts in question have been, could have been or could be, converted into any particular denomination, at any particular rate or at all.
For the year ended December 31, 2011, the average nuevo sol/U.S. dollar exchange rate, as reported by the Central Bank, was S/.2.75 per U.S.$1.00. For more information, see “The Monetary System—Foreign Exchange and International Reserves—Foreign Exchange” below.
ii
Presentation of Financial Information
All annual information in this prospectus is based upon January 1 to December 31 periods, unless otherwise indicated. Totals in some tables in this prospectus may differ from the sum of the individual items in those tables due to rounding.
Some statistical information included in this prospectus is preliminary in nature and reflects the most recent reliable data readily available to Peru. The Central Bank regularly reviews Peru’s current and historical official financial and economic statistics. Accordingly, some financial and economic information presented in this prospectus may be adjusted or revised subsequent to the date of this prospectus to reflect new or more accurate data or in accordance with Peru’s ongoing maintenance of its economic data. In particular, some information and data contained in this prospectus for 2007, 2008, 2009, 2010 and 2011, are preliminary and subject to routine revisions by the Central Bank and other institutions to ensure their accuracy. Peru will make available any revised data in accordance with its normal practices for releasing data. The Government believes that this review process is substantially similar to the practices of many industrialized nations. The Government does not expect any revisions of the data contained in this prospectus to be material, although it cannot assure you that material revisions will not be made.
FORWARD-LOOKING STATEMENTS
This prospectus and any prospectus supplements relating to the securities offered by this prospectus may contain forward-looking statements. Forward-looking statements are statements that are not historical facts. These statements are based on Peru’s current plans, estimates, assumptions and projections. Therefore, you should not place undue reliance on them. Forward-looking statements speak only as of the date they are made, and Peru undertakes no obligation to update them in light of new information or future events.
Forward-looking statements involve inherent risks. Peru cautions you that many factors could adversely affect the future performance of the Peruvian economy. These factors include, but are not limited to:
| | • | | external factors, such as: |
| | • | | interest rates in financial markets outside Peru; |
| | • | | changes in Peru’s credit ratings; |
| | • | | changes in import tariffs and exchange rates; |
| | • | | changes in international commodity prices; |
| | • | | recession, low economic growth or economic contraction affecting Peru’s trading partners; |
| | • | | deterioration in the economic condition of Peru’s neighboring countries; |
| | • | | the extreme contraction of liquidity in the international financial markets and equity, debt and foreign exchange market volatility, which could lead to domestic volatility, declines in foreign direct and portfolio investment and potentially lower international reserves; international hostilities; |
| | • | | the decisions of international financial institutions, such as the International Monetary Fund, or IMF, the Inter-American Development Bank, or IADB, the International Bank for Reconstruction and Development, or World Bank, and the Andean Development Corporation, or CAF, regarding the terms of their financial assistance to Peru; and |
iii
| | • | | internal factors, such as: |
| | • | | deterioration in general economic and business conditions in Peru; |
| | • | | social, political or military events in Peru; |
| | • | | increase in crime rates; |
| | • | | natural events, such as climate changes, earthquakes and floods; |
| | • | | reduction in foreign currency reserves; |
| | • | | reduction in fiscal revenue; |
| | • | | reduced levels of foreign direct investment; |
| | • | | the ability of the Government to enact key economic reforms; |
| | • | | increased rates of domestic inflation; |
| | • | | the level of foreign direct and portfolio investment in Peru; and |
| | • | | prevailing Peruvian domestic interest rates. |
DATA DISSEMINATION
Peru subscribes to the International Monetary Fund’s Special Data Dissemination Standard, or SDDS, which is designed to improve the timeliness and quality of information of subscribing member countries. The SDDS requires subscriber countries to provide schedules indicating the date on which data will be released, referred to as the “Advance Release Calendar.” Summary methodologies of all metadata to enhance transparency of statistical compilation are also provided on the Internet under the IMF’s Dissemination Standards Bulletin Board. The Internet website is located at http://dsbb.imf.org/Applications/web/sddscountrylist/. Neither Peru nor any agents or underwriters acting on behalf of Peru accept any responsibility for information included on that website, and its contents are not intended to be incorporated by reference into this prospectus or any prospectus supplement.
iv
SUMMARY
This summary highlights certain information contained elsewhere in this prospectus. This summary does not contain all the information you should consider before investing in the securities. Before making a decision to invest in any securities, you should carefully read this entire prospectus and the related prospectus supplement.
Republic of Peru
Overview
Peru is a representative democracy located in western South America, with an estimated population, as of October 2007, of approximately 28 million. Peru’s population is multi-racial and multi-cultural, and the official languages are Spanish, Quechua and Aymara. The World Bank classifies Peru as an upper-middle-income developing country.
In November 2000, Peru emerged from more than a decade of rule by President Alberto Fujimori, whose years in office were characterized by a reduction in domestic terrorism perpetrated by armed guerrilla forces, by economic reforms that led Peru to a free market economy with low inflation and high growth rates, and by nearly dictatorial powers concentrated in the executive branch. Political instability, coupled with a series of external shocks, resulted in a reduction in economic activity during the final years of President Fujimori’s last administration, which led to higher rates of unemployment, underemployment and poverty, and a reduction in access to basic healthcare and public services. In November 2000, President Fujimori resigned the Presidency. In the aftermath of President Fujimori’s sudden resignation and political and bribery scandals, Valentín Paniagua assumed the role of President and his interim administration was in office from November 2000 to July 2001.
In June 2001, Alejandro Toledo Manrique was elected President to a five-year term based on a platform of reform that recognized the value of an open economic system and reform away from President Fujimori’s legacy of political coercion and financial misdealing. During the administration of President Toledo, Peru had one of the best performing economies in Latin America, with GDP growth of 6.8% in both 2005 and the six-month period ended June 30, 2006, compared to the comparable period in 2005, mainly attributable to growth in the mining and export sectors that was fueled by higher international commodities prices for these exports.
In June 2006, Alan García was elected President to a five-year term. President García had served as president in the period 1985-1990, and his first administration faced many challenges and confronted many crises that ended with political instability. The first García administration was followed by the administration of President Fujimori. The second García administration, which was inaugurated on July 28, 2006, was elected on a platform that sought to implement social and political reforms and continuity to the macro-economic stability of the last years, as well as solidifying Peru’s relationships with its international partners. During his time in office, President García had responsibly managed public finances, while strengthening the decentralization process and promoting free trade agreements with Peru’s trading partners. During this period, Peru’s was among the best performing economies in Latin America, with annual GDP growth rates of 7.7% during 2006, 8.9% during 2007, 9.8% during 2008, 0.9% during 2009 and 8.8% during 2010, compared to 2009.
On June 5, 2011, Ollanta Humala, the leader of Gana Peru, was elected president to a five-year term after winning a run-off election against Keiko Fujimori. While the election of President Humala initially generated political and economic uncertainty, President Humala took decisive steps to demonstrate continuity with the prior administrations’ economic policies. Shortly after his inauguration, President Humala ratified Julio Velarde as president of the Central Bank of Peru and appointed Luis Miguel Castilla as minister of economy and finance, both of whom served as senior members in the prior administration and have been strong proponents of open market policies.
Since taking office on July 28, 2011, President Humala’s administration has continued to implement policies that promote macroeconomic stability, fiscal discipline and domestic and foreign investment. In addition, President Humala’s administration has not made any significant shift in trade policy and has not experienced any adverse changes with its major trading partners, relative to the prior administration.
1
In addition to strong economic growth, the President Humala’s administration is also focused on promoting a broader agenda of social inclusion by developing social programs that benefit the poorest sectors of the population. President Humala has vowed to lift the country out of extreme poverty by investing in social inclusion programs, with an emphasis on health, education and infrastructure projects.
Beginning in the second half of 2007, short-term lending in the United States encountered several issues, leading to liquidity disruptions in various markets throughout the world. In particular, subprime mortgage loans in the United States faced increased rates of delinquency, foreclosure and loss. These and other related events had and continue to have a significant adverse impact on the international economic environment, including the global credit, commodities and financial markets as a whole and have resulted in bankruptcy filings by, and the acquisition, restructuring and nationalization of, certain financial institutions. Recent events in other developed economies in Europe, including in Greece, Spain and Portugal, have also adversely affected global economic conditions. Regulators in the United States, Europe and Latin America have taken steps in response to these unprecedented conditions.
Although Peru has comparably limited exposure to subprime assets and financial institutions generally are stable, the country has been affected by the contraction of liquidity in the international financial markets, and by volatility in the equity, debt and foreign exchange markets, by volatility in commodity prices, and the contraction in some of Peru’s most important export markets. GDP growth for 2008, while ultimately exceeding levels recorded during 2007, decelerated in the fourth quarter of 2008 as compared to GDP growth rates for prior periods in 2008. The deceleration in GDP growth persisted in 2009 with lower GDP growth as compared 2008. After the deceleration of growth in 2009 primarily due to the global economic and financial crisis, Peru’s economy experienced a significant recovery. In 2010, GDP growth was 8.8% as compared to the 0.9% GDP growth in 2009. In 2011, GDP growth was 6.9% as compared to the 8.8% growth rate recorded in 2010. The deceleration in growth in 2011 was primarily due to a moderation in the domestic demand dynamic, as a result of a decrease in public expenditures principally due to the issuance in March 2011 of Supreme Decree No. 012-2011 which sought to increase public savings in order to withstand the adverse effects of a downturn in the international economy after the 2009 crisis, and decrease private investments.
Improved market conditions have also had positive effects on the Peruvian economy, including:
| | • | | an increase in exports and imports for 2011, compared to levels recorded in 2010; |
| | • | | an increase in foreign direct investment inflows during 2011 compared to 2010; and |
| | • | | an increase in commodity prices, leading to increased export earnings, increased external and fiscal accounts and a resulting increase in tax revenues in 2011 as compared in 2010. |
The 2012 budget was approved by Congress on December 8, 2011 under Law No. 29,812. The Government has used the following assumptions in its budget for 2012:
| | • | | projected real GDP growth in 2012 at 6%; |
| | • | | projected cumulative inflation in 2012 at 2%; |
| | • | | projected average exchange rate of S./2.75 per dollar. |
Based on these assumptions, the 2012 budget proposal projects the following:
| | • | | fiscal revenues of S/.95.5 billion, or approximately U.S.$34.7 billion; |
| | • | | non financial public expenditures of S/.86.5 billion, or approximately U.S.$31.5 billion; and |
| | • | | an overall non-financial public sector surplus of U.S.$4.9 billion, or 1.0% of projected GDP. |
2
Peru’s macroeconomic indicators used for budget purposes are prepared by the Government based on estimates and assumptions that are inherently subject to significant uncertainties, many of which are beyond Peru’s control. See “Forward-looking Statements”. Peru can provide no assurance that such estimates and assumptions will not change.
A significant portion of Peru’s economy is related to commodity exports. Export earnings and tax revenues are expected to increase during 2012. The Government estimates a current account deficit of approximately 1.5% of GDP in 2012, which it currently expects will be financed principally through foreign direct investment and long-term capital inflows. International reserves have increased since 2007 and as of December 31, 2011, net international reserves were U.S.$48.8 billion and the non-financial public sector had registered an overall balance of U.S.$3.2 billion.
The Government took preventive fiscal and monetary actions in response to the international economic environment. In January 2009, the Government authorized an economic stimulus package. The primary purpose of the stimulus package was to sustain economic growth through a substantial increase in public investment and by providing liquidity to the financial system in order to prevent a decrease in the availability of credit. As of December 31, 2011, preliminary data available from the Banking, Insurance and AFP Superintendency, or SBS, signaled that bank lending was registering growth of approximately 17.0% compared with 2010.
On August 30, 2011, Standard & Poor’s upgraded Peru’s long-term foreign currency debt rating from BBB- to BBB with an outlook of Stable. On November 11, 2011, Fitch upgraded Peru’s long term foreign currency debt rating from BBB- to BBB with an outlook of Stable.
Government Stimulus Package. In January 2009, the Government initially authorized a U.S.$3.7 billion stimulus package intended to mitigate the adverse impact on the economy of the international economic crisis for the period 2009—2010. As of September 30, 2009, the Government authorized an additional U.S.$0.7 billion in stimulus spending. The Government executed, during 2009 and the first half of 2010, 94% of stimulus plan investments.
The principal objectives of the stimulus package were:
| | • | | To increase and accelerate expenditures on targeted social programs, which includes an increase in spending for the maintenance of educational institutions, maintenance of healthcare facilities and providing guarantees and subsidies for government housing programs, such as Fondo MiVivienda, Mi Barrio and Techo Propio. |
| | • | | To support construction activity through an increase in public investment in infrastructure. |
| | • | | To support small and medium-sized enterprises, through guarantee funds, the extension of credit lines and other mechanisms. |
| | • | | To provide support to individuals seeking mortgages through the extension of credit lines. |
| | • | | To reduce the Central Bank’s reserve requirements for financial institutions and interest rates on available mortgages. |
| | • | | To reduce the time required for private investment to receive governmental approval. |
Revised Multi-Annual Macroeconomic Plan for the period 2012-2014. On May 25, 2011, the Meeting of Ministers approved the Multi-Annual Macroeconomic Plan, which was revised on August 24, 2011. The Revised Multi-Annual Macroeconomic Plan considered that estimated GDP increase for Peru’s principal commercial partners was 3% for the full year in 2011. Assuming a scenario where there is not a renewed deterioration of the world economy and a resulting decrease in projected foreign direct investment, Peru expects that it would have sustainable GDP growth rates of approximately 6% in 2012. Notwithstanding the expected stability of the world
3
economy based on the foregoing projected growth rate, Peru is aware that a fiscal crisis in either the European Economic Area or in the United States, or a strong contraction in growth in China is also possible, which, although less likely to materialize, would have a material adverse effect on local economic activity. In that regard, Peru has simulated a stress scenario in which the world economy would grow in 2012 at a much lower rate of 1.6% and contract in 2013 by 1%.
The stress scenario also assumes a 50% decrease in private investment compared to the base case for 2012 and a similar decrease in 2013 (to similar levels as those registered in 2009), and a recurrence of severe climatic effects caused by “El Nino” on the Peruvian economy. In these stress conditions, Peruvian GDP would contract by 2.4% compared to a 6% increase considered in the current base case. The principal factors that would cause this result are the following: (i) decrease in value of exports resulting from reduced volumes and lower prices; (ii) slower growth of domestic consumption, as a result of disposable income and deferral of consumption decisions caused by the adverse economic environment; and (iii) decreased private investment resulting from deferral of investments in projects caused by uncertainty in the international economic environment. In an effort to counter the effects of the contraction in local economic activity, Peru expects that it would be required to adopt an expansive fiscal policy similar in magnitude to that adopted in 2009 (which contributed approximately 2.9 percentage points to GDP growth in that year), that will allow for growth in GDP to neutralize the impact from the stress scenarios discussed above. Peru expects that, under these stress circumstances, GDP growth will be approximately 4.5% for 2012 and 3.0% for 2014.
Fiscal Contingency Plan: In September and October of 2011, the Government authorized a U.S.$1.1 billion fiscal contingency plan which is designed to complete certain public works and promote public investments in order to generate a fiscal stimulus as a preventive measure in an adverse international economy. As of December 31 2011, 34% of the new stimulus plan was executed, principally in maintenance works and employment programs.
Material Loan Agreements. As of December 31, 2011, outstanding public sector external debt amounted to approximately U.S.$20.2 billion equivalent to 11.4% of GDP, an increase of U.S.$0.3 billion compared to debt outstanding at December 31, 2010. This increase resulted primarily from the net effect of new disbursements minus amortizations, which amounted to U.S.$150.8 million.
During 2011, disbursements included U.S.$678.7 million for projects and U.S.$311.1 million for freely available payments.
Privatizations and concessions. In 2011, concessions and privatizations reached U.S.$42.2 million with U.S.$4.1 billion in projected investments. For a description of Peru’s privatization efforts, see “The Economy—Privatization and the Role of the State in the Economy—Privatizations and Concessions.”
For the 2012-2013 period and based on Peru’s privatization and concession initiatives, the Government has announced a portfolio of 26 projects worth U.S.$10 billion to promote private investments. The projects include initiatives in the economic sectors such as ports, airports, highways, railways, energy, tourism, capital markets, mining, culture, agribusiness, telecommunications and sanitation.
Investor Considerations
In the past, Peru has experienced economic and political instability and terrorist insurgency. At present, Peru is a stable democracy having completed a peaceful transition from the administration of President Alan García to Ollanta Humala in July of 2011. Peru’s growth, low inflation, and both fiscal and external surpluses reflect, in part, the strength of Peru’s economic fundamentals. The Government cannot assure you that Peru will not face political, economic or social problems in the future or that these problems will not interfere with Peru’s ability to service its indebtedness, including the securities offered by this prospectus and by any prospectus supplement. In addition, the world economic crisis that began in the second half of 2008 and developments in other emerging countries in Latin America, such as Argentina, Bolivia, Brazil, Ecuador and Venezuela, in addition to Peru’s principal trading partners, may have an adverse effect on other countries in the region, including Peru. Moreover, fluctuations in the international prices of commodities like copper and other minerals of which Peru is a major exporter could have an adverse effect on the economy of Peru and the overall level of economic activity.
4
Selected Economic Information
(in millions of U.S. dollars, except as otherwise indicated)
| | | | | | | | | | | | | | | | | | | | |
| | | 2007(1) | | | 2008(1) | | | 2009(1) | | | 2010(1) | | | 2011(1) | |
Domestic economy | | | | | | | | | | | | | | | | | | | | |
GDP (at current prices) | | | 107,443 | | | | 127,115 | | | | 127,370 | | | | 153,935 | | | | 176,728 | |
Real GDP (in millions of S/. at constant 1994 prices) | | | 174,407 | | | | 191,505 | | | | 193,155 | | | | 210,143 | | | | 224,669 | |
Real GDP growth rate (in %) | | | 8.9 | | | | 9.8 | | | | 0.9 | | | | 8.8 | | | | 6.9 | |
CPI (change for the period in %) | | | 3.9 | | | | 6.7 | | | | 0.2 | | | | 2.1 | | | | 4.7 | |
Unemployment rate (in %)(2) (11) | | | 7.1 | | | | 6.2 | | | | 6.3 | | | | 5.1 | | | | N.A. | |
Underemployment rate (in %)(3) (11) | | | 44.3 | | | | 39.3 | | | | 40.6 | | | | 37.9 | | | | N.A. | |
Unemployment rate (in %)(2) 912) | | | 8.4 | | | | 8.4 | | | | 8.4 | | | | 7.9 | | | | 7.7 | |
Underemployment rate (in %)(3) (12) | | | 49.7 | | | | 46.1 | | | | 40.6 | | | | 40.6 | | | | N.A. | |
| | | | | |
Balance of payments | | | | | | | | | | | | | | | | | | | | |
Total current account | | | 1,460 | | | | (5,318 | ) | | | 211 | | | | (2,625 | ) | | | (2,267 | ) |
Of which: | | | | | | | | | | | | | | | | | | | | |
Trade balance | | | 8,503 | | | | 2,569 | | | | 5,951 | | | | 6,750 | | | | 9,302 | |
| | | | | |
Total capital account | | | 8,400 | | | | 8,674 | | | | 1,499 | | | | 12,865 | | | | 8,363 | |
Of which: | | | | | | | | | | | | | | | | | | | | |
Foreign direct investment | | | 5,425 | | | | 6,188 | | | | 5,178 | | | | 7,113 | | | | 7,548 | |
| | | | | |
Errors and omissions(4) | | | (272 | ) | | | (244 | ) | | | (702 | ) | | | 933 | | | | (1,402 | ) |
Overall balance of payments(5) | | | 9,588 | | | | 3,112 | | | | 1,007 | | | | 11,173 | | | | 4,694 | |
Change in Central Bank net international reserves (period end in %) | | | 60.3 | | | | 12.7 | | | | 6.2 | | | | 33.1 | | | | 10.7 | |
Central Bank net international reserves (period end) | | | 27,689 | | | | 31,196 | | | | 33,135 | | | | 44,105 | | | | 48,816 | |
| | | | | |
Public sector balance | | | | | | | | | | | | | | | | | | | | |
Central government revenue(6) | | | 19,409 | | | | 23,320 | | | | 20,231 | | | | 26,429 | | | | 32,028 | |
As a % of GDP | | | 18.1 | | | | 18.3 | | | | 15.9 | | | | 17.2 | | | | 18.1 | |
Central government expenditure(7) | | | 17,920 | | | | 20,686 | | | | 22,426 | | | | 26,639 | | | | 30,569 | |
As a % of GDP | | | 16.6 | | | | 16.3 | | | | 17.5 | | | | 17.3 | | | | 17.3 | |
Central government fiscal balance | | | 1,611 | | | | 2,769 | | | | (2,046 | ) | | | 53 | | | | 1,563 | |
As a % of GDP | | | 1.8 | | | | 2.2 | | | | (1.8 | ) | | | 0.1 | | | | 0.9 | |
Overall non-financial public sector fiscal balance(8) | | | 3,009 | | | | 3,164 | | | | (1,861 | ) | | | (502 | ) | | | 3,158 | |
As a % of GDP | | | 2.9 | | | | 2.4 | | | | (1.3 | ) | | | (0.3 | ) | | | 1.8 | |
| | | | | |
Public sector debt | | | | | | | | | | | | | | | | | | | | |
Public sector external debt | | | 20,081 | | | | 19,237 | | | | 20,600 | | | | 19,905 | | | | 20,204 | |
As a % of GDP | | | 18.7 | | | | 15.1 | | | | 16.2 | | | | 12.9 | | | | 11.4 | |
Public sector domestic debt(9) | | | 11,828 | | | | 11,397 | | | | 13,876 | | | | 16,113 | | | | 18,101 | |
As a % of GDP | | | 11.0 | | | | 9.0 | | | | 10.9 | | | | 10.5 | | | | 10.2 | |
Total public sector debt | | | 31,910 | | | | 30,364 | | | | 34,476 | | | | 36,018 | | | | 38,305 | |
As a % of GDP | | | 29.7 | | | | 24.1 | | | | 27.1 | | | | 23.4 | | | | 21.7 | |
| | | | | |
Public sector external debt service: | | | | | | | | | | | | | | | | | | | | |
Amortizations(9) | | | 5,466 | | | | 2,580 | | | | 1,847 | | | | 4,916 | | | | 839 | |
Interest payments(9) | | | 1,411 | | | | 1,156 | | | | 1,078 | | | | 1,093 | | | | 1,036 | |
| | | | | | | | | | | | | | | | | | | | |
Total external debt service | | | 6,877 | | | | 3,736 | | | | 2,924 | | | | 6,009 | | | | 1,875 | |
As a % of exports of goods and services(10) | | | 20.9 | | | | 10.2 | | | | 9.1 | | | | 14.8 | | | | 3.6 | |
Exchange rate (end of period, S/. per U.S.$) | | | 3.00 | | | | 3.14 | | | | 2.89 | | | | 2.81 | | | | 2.70 | |
Exchange rate (average, S/. per U.S.$) | | | 3.13 | | | | 2.92 | | | | 3.01 | | | | 2.83 | | | | 2.75 | |
| (2) | In Metropolitan Lima. Percentage of the working-age population (14 years old or older) that, in the week the employment survey was conducted, was seeking remunerated employment. |
| (3) | In Metropolitan Lima. Percentage of the working-age population (14 years old or older) working part-time which would prefer to work more hours, plus the percentage of the working-age population that usually works full-time but which, in the week the employment survey was conducted, worked less than 35 hours per week as a result of economic constraints. |
| (4) | Represents errors and omissions in compiling balance of payments accounts based on double-entry accounting resulting from incomplete or overlapping coverage, different prices and incomplete times of recording and conversion practices. |
| (5) | Includes current account balance, financial account and errors and omissions. |
| (6) | Excludes privatization receipts. |
| (7) | Includes interest payments. |
| (8) | Includes the non-financial public sector and the Central Bank. |
| (9) | Excludes Central Bank debt. |
| (10) | Includes exports of goods and services and investment income. |
| (11) | Source: Ministry of Labor |
| (12) | Source: National Institute of Statistics |
N.A. = Not Available.
Source: Central Bank, unless otherwise indicated.
5
USE OF PROCEEDS
Unless otherwise specified in a prospectus supplement, Peru will use the net proceeds from the sale of securities offered by this prospectus for the general purposes of the Government, including, but not limited to, financial investment and the refinancing, repurchasing or retiring of its domestic and external indebtedness. Peru may also issue securities offered by this prospectus in exchange for any of its outstanding securities.
6
THE REPUBLIC OF PERU
Territory and Population
The Republic of Peru is located in western South America. It shares its borders with Ecuador and Colombia to the north, Brazil and Bolivia to the east and Chile to the south. Its territory covers an area of approximately 496,222 square miles, including a 1,500 mile-long Pacific Ocean coastline and a 200 mile-wide maritime zone. Peru’s major cities are Lima, the nation’s capital, Arequipa, Trujillo, Chiclayo, Iquitos, Piura, Chimbote and Cuzco.
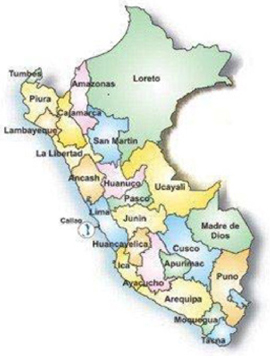
Peru is divided by the Andes Mountains into three geographic regions—a narrow strip of desert along the western coast, a central region of high mountains that form part of the Andes and a large, heavily forested area leading to the Amazonian plains in the east. Peru’s climate varies significantly by region, from tropical rain forests in the east and a dry desert in the west, to temperate and frigid regions in the mountainous central part of the country. The Andes rise over 20,000 feet and contain large plateaus and extensive valleys. Lima and other major cities, such as Trujillo and Chiclayo, are located along the coast. The map below shows Peru and its territorial subdivisions.
Peru’s central coast is occasionally affected by an atmospheric phenomenon known as El Niño, which raises the temperature of the superficial coastal waters, causing an increase in air temperature, a decrease in atmospheric pressure along the coast and an increase in the sea level along the Peruvian coastline. These conditions produce increased rainfall in the northern coast, which may result in severe flooding and mudslides. In 1998, the warm waters caused by El Niño disrupted Peru’s fishing and agricultural industries as marine life migrated to deeper, colder waters, crops were destroyed by flooding and elevated temperatures along the coast gave rise to new crop pests and plagues. The flooding caused approximately U.S.$1.2 billion in damage to Peru’s infrastructure. El Niño recurs on average every six years; however, the timing of each recurrence, its length and its severity cannot be predicted.
Peru’s southern region is located on seismic faults, which make the area susceptible to earthquakes. In June and July 2001, two earthquakes of 8.4 and 7.6 magnitude on the Richter scale, respectively, struck along the coast of south-central Peru, causing an estimated U.S.$300 million in damage. The same area was hit with an 8.0 magnitude on the Richter scale earthquake in August 2007, which killed approximately 600 people, injured approximately 1,800 people, destroyed approximately 76,000 houses and caused damages estimated at over U.S.$230 million.
7
Peru’s population, estimated at October 2007 to be approximately 28 million, is multi-racial and multi-cultural. Approximately 45.0% of the population is native, 37.0% is Mestizo, or mixed native and Caucasian, 15.0% is Caucasian, 2.0% is of African descent and 1.0% is of Asian descent. Spanish, Quechua and Aymara are Peru’s official languages. Approximately 83.9% of Peru’s population speaks Spanish and approximately 24.1% resides in rural areas. The population grew at an estimated average rate of approximately 1.6% per year in the period from 1993 to 2007.
In 2010, Peru’s adult literacy rate was approximately 92.6%. Approximately 87.7% of Peruvian adult women are literate and approximately 96.0% of Peruvian adult men are literate. In 2010, approximately 96.5% of children aged 6 to 11 attended school, while approximately 81.6% of children ages 12 to 16 attended school. In the same year, 28.3% of the population had higher education. As of 2010, there were approximately 782,970 students in Peru’s 100 universities, of which 35.0% are public and the remainder private. There were 32 private universities and 8 national universities in Lima in 2010, including the Universidad Nacional Mayor de San Marcos, or National University of San Marcos, which was founded in 1551 and is the oldest university in South America.
The World Bank classifies Peru as an upper-middle-income developing country. The following table provides comparative per capita GDP figures and other selected comparative statistics as of the years indicated.
| | | | | | | | | | | | | | | | | | | | | | | | | | | | | | | | | | | | |
| | | Bolivia | | | Ecuador | | | Peru | | | Colombia | | | Brazil | | | Venezuela | | | Argentina | | | Chile | | | United
States | |
| | | | | | | | | |
Per capita GDP(1) | | U.S.$ | 4,013 | | | U.S.$ | 7,508 | | | U.S.$ | 7,836 | | | U.S.$ | 8,959 | | | U.S.$ | 8,136 | | | U.S.$ | 9,414 | | | U.S.$ | 11,190 | | | U.S.$ | 13,057 | | | U.S.$ | 41,761 | |
United Nations index of human development (world ranking)(1) | | | 108 | | | | 83 | | | | 80 | | | | 87 | | | | 84 | | | | 73 | | | | 45 | | | | 44 | | | | 4 | |
Life expectancy at birth (in years)(2) | | | 66.0 | | | | 75.3 | | | | 73.5 | | | | 73.2 | | | | 72.8 | | | | 73.9 | | | | 75.5 | | | | 78.8 | | | | 78.1 | |
Infant mortality (per 1,000 live births)(3) | | | 41.7 | | | | 17.6 | | | | 14.9 | | | | 16.5 | | | | 17.3 | | | | 15.7 | | | | 12.3 | | | | 7.7 | | | | 6.5 | |
Adult illiteracy rate(4) | | | 9.3 | % | | | 15.8 | % | | | 10.4 | % | | | 6.8 | % | | | 10 | % | | | 4.8 | % | | | 2.3 | % | | | 1.4 | % | | | N.A. | |
Population below the poverty line(5) | | | N.A. | | | | 32.8 | % | | | 31.3 | % | | | 37.2 | % | | | N.A. | | | | N.A | | | | N.A. | | | | N.A. | | | | N.A. | |
| (1) | 2009 data. Adjusted for purchasing power parity. |
| (4) | Data refer to most recent year between 2007 and 209, when available. Adults are aged 15 years and older. |
| (5) | 2010 data. The poverty line is defined as the population living on a daily per capita income of U.S.$ or less. |
N.A. = Not Available.
Source: World Bank and United Nations Development Program.
History, Government and Political Parties
History
Beginning in the ninth millennium B.C., several developed cultures began to settle in Peru, including the Chavín, Sechín, Chimú, Mochica, Paracas, Nazca, Tiahuanaco and Wari. In the 12th century A.D., the Quechua-speaking Inca settled around the Cuzco Valley. By the time the Spanish arrived in 1531, the Inca had created an empire that encompassed areas of modern Peru, Ecuador, Bolivia and Colombia. In 1533, the Spanish captured the Inca capital at Cuzco and by 1542 had consolidated their control over the entire Inca territory. In 1542, the Spanish established the viceroyalty of Lima, which governed vast portions of Spanish territorial possessions in South America.
Peru remained under Spanish rule until 1821, when José de San Martín proclaimed Peru’s independence, although the Spanish were not defeated until 1824. In the first two decades of the post-independence era, political fragmentation and political instability plagued Peru and it was ruled by at least 24 regimes between 1821 and 1845. During this period, Peru’s constitution was rewritten six times. In the 1840s, Peru initiated a period of extraordinary economic growth driven by the exportation of guano, a form of fertilizer obtained from the droppings of birds in the Chincha Islands.
In 1879, Peru allied itself with Bolivia to fight an unsuccessful war against Chile over the disputed nitrate-rich Atacama Desert. This war, known as the War of the Pacific, ended in 1883 with the signing of the Treaty of Ancón, in which Peru ceded to Chile in perpetuity the nitrate-rich province of Tarapacá and relinquished, for a
8
period of ten years, the provinces of Tacna and Arica. Tensions over these two provinces continued until 1929, when the United States brokered a deal that returned the province of Tacna to Peru but allowed Chile to retain control over the province of Arica.
From 1895 to 1914, Peru experienced political stability and economic growth. In 1914, Colonel Oscar R. Benavides (1914-15, 1933-39) orchestrated a military coup that ended almost two decades of uninterrupted civilian rule. In the early stages of World War I, Peru experienced a recession as the war temporarily isolated Peru from its export markets. When overseas trade resumed, demand for Peru’s export products increased dramatically and Peru suffered through a period of sustained inflation. This inflation had a particularly negative impact on Lima’s working classes and led to a wave of labor strikes in 1918 and 1919.
In 1919, Augusto B. Leguía (1908-12, 1919-30) began an 11-year rule known as the oncenio and created a new, progressive constitution, adopted in 1920, that enhanced the power of the state to carry out a number of popular social and economic reforms. The regime weathered a brief postwar recession and then generated considerable economic growth by opening Peru to foreign loans and investment. Leguía’s popularity waned, however, as a result of a border dispute with Colombia involving territory in the rubber-tapping region between the Río Caquetá and the northern watershed of the Río Napo. Under the U.S.-brokered Salomón-Lozano Treaty of March 1922, the Río Putumayo was established as the boundary between Colombia and Peru.
During the 1930s, a popular movement, with origins in Mexico, known as the Alianza Popular Revolucionaria Americana, or American Popular Revolutionary Alliance, or APRA, spread to Peru under the leadership of Víctor Raúl Haya de la Torre. This continent-wide popular alliance quickly became a prominent center-left political party in Peru and a strong antagonist to Peru’s armed forces. In the presidential election of 1931, Luis Sánchez-Cerro (1931-33) defeated APRA’s Haya de la Torre, who accused Sánchez-Cerro of fraud.
Despite the political turmoil, Peru’s economy was one of the least affected by the Great Depression because of Peru’s relatively diversified range of exports, led by cotton, lead and zinc. Unlike many other Latin American countries that adopted import-substitution industrialization measures to counteract the effects of the Great Depression, Peru made relatively few alterations to its long-term model of export-oriented growth.
In 1939, Manuel Prado y Ugarteche (1939-45), a Lima banker from a prominent family and son of a former president, was elected president. He was soon confronted with a border conflict with Ecuador that led to a brief war in 1941. The conflict dated back to the post-independence period. Following independence, Ecuador had been left without access to either the Amazon River or the Río Marañón, the region’s other major waterway, and thus without direct access to the Atlantic Ocean. In an effort to assert its territorial claims in a region near the Río Marañón in the Amazon Basin, Ecuador’s military occupied the town of Zarumilla along its southwestern border with Peru. The Peruvian army responded and defeated the Ecuadorian army. For a discussion of Peru’s relations with Ecuador, see “—Foreign Policy and Membership in International and Regional Organizations—Relations with Ecuador.”
During the 1950s and 1960s, Peru experienced export-led growth and increased national and foreign investment. During this time, many peasants migrated to the coast, the center of Peru’s economic growth. As a result of heavy migration, the population of metropolitan Lima increased from 100,000 in 1940 to over 1.6 million in 1961.
In 1968, Peru returned to military rule when General Juan Velasco Alvarado (1968-1975) overthrew elected President Fernando Belaúnde Terry of Acción Popular, or AP. Velasco implemented an extensive program of agrarian reform and nationalized the fishmeal and oil industries, several banks and petroleum and mining companies. General Francisco Morales-Bermúdez Cerruti replaced Velasco in 1975. He presided over the transition to civilian rule and the adoption of a new constitution in 1979.
In 1980, voters reelected Belaúnde in the first popular elections since 1968. Belaúnde attempted to cut spending and dismantle many of the military government’s populist reforms. Soaring inflation and unemployment, however, made it difficult to curb public spending. At the same time, Belaúnde’s government was destabilized by the rise of subversive movements.
9
The Sendero Luminoso, or the Shining Path, was founded in 1970 as an offshoot of the Peruvian Communist Party. The group espoused a Maoist ideology and initiated terrorist activities in 1980 as a means of overthrowing the government. The Movimiento Revolucionario Túpac Amaru, or Tupac Amaru, was founded in 1984 as a radical leftist organization that promoted communal ownership of property and advocated an armed struggle against capitalism. These two groups took advantage of mounting social unrest produced by 12 years of military rule and growing class consciousness among indigenous communities to recruit members. They raised funds by establishing a financial alliance with drug traffickers and protecting expanding coca fields. Drawing on these funds, the Shining Path and Tupac Amaru waged a guerilla war against the government and engaged in rural terrorism.
Alan García Pérez of the APRA party was elected president in 1985. The first García administration was plagued by terrorist activity from the Shining Path and Tupac Amaru and by allegations of corruption. President García pursued a populist agenda, financed by substantial increases in government spending that led to a record 7,650% inflation rate in 1990. President García attempted to nationalize the banking system and limited Peru’s debt service payments to no more than 10% of total exports. In response, international creditors refused to extend new credit to Peru. During the first García administration, GDP contracted by 20% from levels in the early 1980s.
In 1990, voters elected Alberto Fujimori of the Cambio 90 party as president. Fujimori implemented a comprehensive neo-liberal economic program based on fiscal discipline, a stable monetary policy and aggressive privatization of state-owned industries. These initiatives succeeded in curbing inflation, reducing public external debt and fostering economic growth. For a discussion of Fujimori’s economic policies, see “The Economy—History and Background” below.
President Fujimori also launched a successful campaign against the terrorist activities of the Shining Path and Tupac Amaru. In September 1992, the police captured the Shining Path’s founder, Abimael Guzmán, and its other principal leaders. In 1997, Peruvian armed forces killed several Tupac Amaru leaders, including its principal leader, Néstor Cerpa Cartolini, in a rescue operation to free hostages being held by Tupac Amaru at the Japanese Embassy in Lima.
In 1995, Peru and Ecuador fought a brief war over a disputed area on their border. This dispute dated to the Protocolo de Río de Janeiro of 1942, or Rio de Janeiro Protocol, a treaty between Peru and Ecuador signed after the brief war these countries fought in 1941. The dispute was finally settled in 1998. For a description of this dispute and Peru’s relations with Ecuador, see “—Foreign Policy and Membership in International and Regional Organizations—Relations with Ecuador” below.
Fujimori’s harsh governing style created significant congressional opposition. On April 5, 1992, Fujimori dissolved Congress and, in November 1992, called for the election of a constitutional congress, which adopted a new constitution in 1993. The new 1993 Constitution gave the President authority to issue emergency decrees relating to economic and financial matters, if those decrees are in the national interest and do not relate to tax matters. Emergency decrees have the force of law and do not require previous legislative approval, although Congress may subsequently modify or derogate those decrees. Under the 1993 Constitution, Congress may censure or obtain a no-confidence resolution against the President’s Consejo de Ministros, or Council of Ministers, forcing their removal. The 1993 Constitution bars the President from dissolving Congress during the last year of the President’s term in office. In addition, the 1993 Constitution allowed sitting presidents to stand for re-election to two consecutive terms, which was prohibited under the 1979 Constitution. President Fujimori was reelected for a second term in 1995 by a wide margin.
Following the dissolution of Congress in 1992 and the adoption of the 1993 Constitution, President Fujimori centralized power in the executive branch, thus undermining legal mechanisms of accountability, strengthening the powers of the military and intelligence service and compromising the autonomy of the legislative and judicial branches, and curtailing freedom of the press. These measures debilitated Peru’s political system, fostered widespread political corruption, and, in the later years of President Fujimori’s administration, undermined the success of his economic program.
Although the 1993 Constitution allowed presidents to serve for only two consecutive terms, in August 1996 Congress passed an interpretative law clarifying that this limit applied only to presidential terms beginning after
10
1993. In December 1996, the Constitutional Tribunal, with the vote of three members, with four justices abstaining, ruled that the 1996 interpretative law did not apply to President Fujimori. In May 1997, Congress removed the three justices who voted in favor of this ruling on the basis that they had exceeded their authority by attempting to issue a binding opinion with the vote of only a minority of the Constitutional Tribunal’s members. The president of the Constitutional Tribunal later resigned in protest over Congress’ action. On July 28, 2000, Fujimori began a controversial third term as president amid allegations of electoral fraud.
In September 2000, a bribery scandal involving Vladimiro Montesinos, a former army captain and lawyer who became an advisor to Peru’s intelligence agency and a close ally of President Fujimori, prompted charges of political corruption within the Fujimori administration. President Fujimori responded to the increased criticism and mounting protests by calling for new presidential elections to be held in April 2001. He also announced that he would not seek reelection. Weeks later, however, the growing investigation into corruption charges and condemnation of Montesinos and his ties to the President led President Fujimori to resign while on an international presidential trip but the Peruvian Congress refused to accept Fujimori’s resignation. Rather, Congress removed President Fujimori from office, declared the post of Chief of State vacant due to moral incapacity and barred him from holding any Peruvian public office for ten years.
Fearing prosecution and claiming that he could not be tried in Peru because of his Japanese citizenship, President Fujimori refused to return to Peru. Under the 1993 Constitution, the First Vice President was next in line for the presidency, but Peru’s First Vice President had resigned in October 2000 in protest of Montesinos’ influence within the Fujimori administration. The Second Vice President also resigned following President Fujimori’s removal as a result of his connection to Fujimori and pressure by opposition congressmen. Under the 1993 Constitution, executive authority shifted to Valentín Paniagua Corazao, the president of Congress, who became president on November 22, 2000.
Presidential and congressional elections were held on April 8, 2001. In the presidential contest, Alejandro Toledo Manrique of the Perú Posible party obtained 36.5% of the vote, former President Alan García Pérez of the APRA obtained 25.8% of the vote and Lourdes Flores Nano of the Unidad Nacional party, or UN, obtained 24.3% of the vote. In June 2001, Toledo won the presidency in a runoff election against Alan García, receiving 53.1% of the vote to García’s 46.9% of the vote.
On August 27, 2001, Congress voted to remove President Fujimori���s presidential immunity. On September 5, 2001, Peru’s Attorney General formally charged Fujimori with the murder of 15 people in 1991 and the forced disappearance and murder of nine students and a professor in 1992. Since 2000, Congress has, at seven different times, approved charges against President Fujimori, including embezzlement and murder. In July 2003, the Government presented a formal extradition request to the Japanese government for President Fujimori, based on these criminal charges. The Japanese government rejected the request because Peru and Japan do not have an extradition treaty and President Fujimori, the son of Japanese immigrants, was protected from extradition by virtue of his Japanese citizenship. On October 15, 2004, Peru made a second request for extradition based on forgery and embezzlement charges. Japan tabled its consideration of this request. By March 2005, the extradition request to the Japanese government had stalled. On November 6, 2005, President Fujimori arrived in Chile, where he was arrested and subjected to an extradition process petitioned by the Government. After 34 months in Chile, President Fujimori was extradited to Peru in September 2007 to face criminal charges in seven separate trials. In December 2008, he was sentenced to a six-year term in prison for the illegal search and seizure of his former intelligence advisor’s home. In December 2009, the sentence was confirmed by an appellate court. In April 2009, President Fujimori was sentenced to a twenty five-year term in prison for the massacres in La Cantuta and Barrios Altos and the abductions of a journalist and businessman. In January 2010, the sentence was confirmed. In July 2009, President Fujimori was sentenced to a seven and a half year term in prison for for embezzlement charges, in connection with a $15 million “severance” payment to then-intelligence chief Vladimiro Montesinos. In September 2009, President Fujimori was sentenced to a six-year term in prison for illegal wiretaps and bribing congressmen and journalists.
In June 2001, Alejandro Toledo Manrique was elected president based on a platform that recognized the value of an open economic system and rejected Fujimori’s legacy of political coercion and financial misdealing. Despite the economic achievements between 1990 and 2000, poverty remains a persistent problem in Peru. More than half of the population lives below the poverty line, as defined by the World Bank, adjusted to reflect differences in purchasing power. A significant number of Peruvians still live on monthly per capita income of less than U.S.$30.
11
President Toledo implemented a number of measures designed to stimulate Peru’s economy, including privatization and fiscal austerity programs. President Toledo’s policies spurred sustained economic growth since the fourth quarter of 2001. Despite this economic growth, the Toledo administration saw a drop in approval ratings and faced ongoing social protests and unrest spurred by disappointment that President Toledo’s policies had not immediately led to a significant reduction in the high rates of unemployment, underemployment and poverty, and political scandals.
Under President Toledo, Peru had one of the best performing economies in Latin America attributable to the growth in the mining and export sectors; however, major challenges remained as the Government faced strong social pressures to reduce poverty and unemployment levels.
Presidential elections were held on April 9, 2006. In the first round of elections, Ollanta Humala obtained 3.78 million votes (30.6%), Alan García obtained 3.0 million votes (24.3%), Lourdes Flores of the Unidad Nacional coalition obtained 2.9 million votes (23.8%), Martha Chávez of the pro-Fujimori alliance or Alianza Por El Futuro party obtained 912,000 votes (7.4%) and Valentín Paniagua obtained 706,000 (5.8%). Keiko Fujimori, President Fujimori’s daughter obtained the highest number of votes for congress. Since no single presidential candidate obtained a majority of the votes, a run-off election was held on June 4, 2006 between Ollanta Humala and Alan García, in which García was elected to a five-year term, sixteen years after his first administration (1985-90). On July 28, 2006, Alan García was sworn in as the new president of Peru after winning approximately 53% of the nationwide vote in the run-off election held on June 4, 2006. During García’s administration, Peru’s economy experienced consistent and sustained growth, increased employment levels and reducing poverty levels, principally due to an increase in public and private investments.
On June 5, 2011, Ollanta Humala, the leader of Gana Peru, was elected president to a five-year term after winning a run-off election against Keiko Fujimori. While the election of President Humala initially generated political and economic uncertainty, President Humala took decisive steps to demonstrate continuity with the prior administrations’ economic policies. Shortly after his inauguration, President Humala ratified Julio Velarde as president of the Central Bank of Peru and appointed Luis Miguel Castilla as minister of economy and finance, both of whom served as senior members in the prior administration and have been strong proponents of open market policies.
Since taking office on July 28, 2011, President Humala’s administration has continued to implement policies that promote macroeconomic stability, fiscal discipline and domestic and foreign investment. In addition, President Humala’s administration has not made any significant shift in trade policy and has not experienced any adverse changes with its major trading partners, relative to the prior administration.
In addition to strong economic growth, the President Humala’s administration is also focused on promoting a broader agenda of social inclusion by developing social programs that benefit the poorest sectors of the population. President Humala has vowed to lift the country out of extreme poverty by investing in social inclusion programs, with an emphasis on health, education and infrastructure projects.
In December 2011, Mr. Salomón Lerner resigned as premier of the cabinet’s council and was replaced by Mr. Oscar Valdés, a former military official. In a reorganization of his administration, President Humala also replaced the ministers of agriculture, defense, interior, production and energy and mines, among others. As the new president of the cabinet’s council, Mr. Oscar Valdés has ratified the Government’s policy of strong economic growth with a focus towards social inclusion, highlighting the importance of macroeconomic stability, private investment and job creation.
Government
Regional Governments. Peru is a representative democracy that is geographically and administratively divided into 25 regional governments. Prior to January 1, 2003, Peru was divided into 24 Temporary Regional Administration Councils, or “regional councils.” The regional councils were divided into 193 provinces and the constitutional province of Callao, Peru’s principal port, adjacent to Lima, and 1,828 districts. Each regional council was governed by an administrative official appointed by the President and formed part of the Government. Provinces and districts have their own civil governments, which are independent of the national government.
12
As of January 1, 2003, Peru’s regional councils were replaced by 25 new regional governments, each governed by elected officials and independent of the Government. Elections were last held in November 2006 for the presidents, vice presidents and members of local councils for each of the regional governments. The elected officials will serve five-year terms. The APRA won three of the 25 regional presidencies and Unión Por el Perú, or UPP, won one. The 21 other regional presidencies were won by independents and smaller parties.
On November 8, 2002, Congress passed the law establishing the framework under which the regional governments operate. The law grants to the regional governments the authority to borrow money and issue debt domestically or internationally, so long as, in the latter case, the debt is guaranteed by the national government. In addition, the law grants to the regional governments the power to propose the creation or elimination of regional taxes. Under the 1993 Constitution, only Congress and the Executive Branch, pursuant to legislative authority delegated by Congress, may create, amend or eliminate taxes.
On January 1, 2003, Congress granted to the national government the exclusive power to determine, conduct and manage national and regional policies in accordance with national and regional needs. As of 2003 the national budget has been distributed among the national government, the regional governments and the municipal governments in accordance with the new governmental structure. A portion of the national budgets that are earmarked for the regional governments are to be funded from privatization proceeds.
National Government. The 1993 Constitution provides for a presidential system of government in which national powers are divided among independent executive, legislative and judicial branches.
Executive power is exercised by the President, who appoints ministers, enacts the laws passed by the legislative branch and is the commander-in-chief of the armed forces. The President may enter into treaties without prior congressional approval, except for treaties relating to human rights, Peru’s sovereignty, national defense, financial obligations to be assumed by the Government and treaties that create, modify, or repeal taxes or overrule existing laws. The President is directly elected for a five-year term. The 1993 Constitution abrogated the ban on presidential reelection and provided that a President may be reelected only to one consecutive term. The 1993 Constitution was amended in November 2000, reinstating the ban on consecutive presidential terms. Former presidents may seek the presidency again after a presidential term has elapsed.
The 1993 Constitution provides for two electoral rounds. If the first round does not yield a majority vote for any one presidential candidate, a majority in the first round being 50% plus one of the total votes cast, a second round is held between the two presidential candidates who obtained the greatest number of votes in the first round. The 1993 Constitution introduced the positions of First and Second Vice President. These officials are popularly elected but have no constitutional functions unless the President is unable to discharge his duties. If the President cannot discharge his duties, the First Vice President assumes the presidency. The Second Vice President assumes the presidency if the First Vice President is unable to discharge his duties.
After the President, executive authority is vested in the Council of Ministers, which is headed by the President of the Council of Ministers, who is appointed by the President. The Council of Ministers oversees and coordinates the activities of Peru’s various ministries and approves all legislative proposals sent by the President to Congress. However, the Council of Ministers may not approve laws without the President’s approval. Each member of the Council of Ministers may approve ministerial resolutions without the President’s consent, but these are regulations that do not have the force of laws approved by Congress and are superseded by laws proposed by the Council of Ministers and approved by the President.
The legislative branch consists of a unicameral congress composed of 120 members who are elected for a five-year term, with all seats subject to reelection at the end of each five-year period. There are 25 electoral districts and the number of members elected by each district is proportional to the district’s population. Lima, the most populous district, elects 35 members. The next congressional elections are scheduled for April 2011.
In addition to passing laws, Congress is empowered to approve the Government’s budget and to approve treaties. Congress may delegate to the executive branch, for defined periods of time, legislative authority over specific matters.
13
The highest courts in Peru are the 18-member Supreme Court of Justice and the seven-member Constitutional Tribunal. The Peruvian judicial system is also composed of:
| | • | | justices of the peace, who preside over district court proceedings related to alimony, landlord-tenant, personal debt and real and personal property disputes and who function as arbiters but cannot issue legally-binding decisions; |
| | • | | courts of first instance, which include civil, penal and special-chamber courts having jurisdiction over all cases not under the express jurisdiction of other courts, and a series of specialized courts dealing with matters such as drug-related cases, and which were established to reduce the backlog of cases pending final action in the other courts of first instance; |
| | • | | military courts, which adjudicate charges of criminal conduct brought against members of the armed forces and the police while discharging their duties and charges of national treason and terrorism brought against civilians; and |
| | • | | superior courts, which review judgments rendered by all lower courts, except military courts. |
All judges in the Peruvian judicial system, with the exception of justices of the peace, who are elected by popular vote, and members of the Constitutional Tribunal, who are elected by Congress, are appointed and may be removed only by the Consejo Nacional de la Magistratura, or Judiciary Council. This independent body is composed of seven members who are elected for five-year terms by several national entities, through secret votes, as follows:
| | • | | one member is elected by the Supreme Court of Justice; |
| | • | | one member is elected by the Junta de Fiscales Supremos, or Board of Supreme Prosecutors; |
| | • | | one member is elected by the members of the bar associations; |
| | • | | one member is elected by the presidents of the national universities; |
| | • | | one member is elected by the presidents of the private universities; and |
| | • | | two members are elected by Peru’s other collegiate associations of professionals. |
In addition, the Judiciary Council may elect two additional members. The Judiciary Council reviews and ratifies all judges every seven years, including the members of the Supreme Court of Justice and justices of the peace.
The Supreme Court of Justice has ultimate jurisdiction over all matters adjudicated by the superior courts and over all military court rulings in which the death penalty is imposed. Its members must be over age 45 and must retire by age 70. The Judiciary Council may refuse to ratify or may remove a member of the Supreme Court of Justice only because of physical or mental incapacity, or for engaging in conduct incompatible with his or her duties.
The Constitutional Tribunal is the final arbiter of the Constitution. Its members are appointed by Congress for five-year terms, are not subject to reelection and cannot be removed before their term expires, unless Congress determines that a magistrate has:
| | • | | become physically incapacitated or morally unfit; |
| | • | | engaged in conduct incompatible with his or her duties; or |
| | • | | been found guilty of a crime. |
14
Political Parties
With the exception of the APRA, AP and PPC, Peru’s political parties do not have deep historical roots and often change, merge or dissolve. Currently, the principal political parties and alliances in Peru that participated in the last presidential elections in 2011 are:
AP (Acción Popular). The AP supports a moderate reform program that emphasizes modernization and development through an activist public sector. Fernando Belaúnde, who served as President from 1963 to 1968 and from 1980 to 1985, founded the AP in 1956. The AP’s membership included Valentín Paniagua, who became President during the transition government that followed Fujimori’s removal in 2000. In the 2006 elections AP run as part of the now dissolved Frente de Centro political alliance. It is a center wing party and it is based in the populist action ideology. Among the current political parties, this party has held presidency most frequently.
Alianza Fuerza 2011 (Alliance Strength 2011). This alliance was formed in 2010 by the Partido Nueva Mayoría (New Majority party) and Partido Renovación Nacional (National Novation Party) principally to participate in the presidential elections held in 2011. This party is headed by Keiko Fujimori who was the presidential candidate, with Rafael Rey y Jaime Yoshiyama as vice presidential candidates. Fuerza 2011, obtained the second highest number of votes cast in the presidential elections.
Alianza Gana Perú (Win Peru Alliance). Founded at the end of 2010 by Ollanta Humala in preparation for the presidential elections held in 2011, this alliance consists of various left-leaning parties such as the Partido Comunista del Perú (Communist Party of Peru), the Partido Socialista (Socialist Party), el Partido Socialista Revolucionario (Socialist Revolutionary Party), the Movimiento Político Voz Socialista (Socialist Voice Political Movement), and a significant constituency of the Movimiento Político Lima para Todos (Political Movement Lima for All). Alianza Gana Perú won the presidential elections, in a second round run-off, with 51.45% of valid votes cast.
APRA (Alianza Popular Revolucionaria Americana—Partido Aprista Peruano). Initially left wing in its outlook, the APRA became a conservative force during the 1950s and is now a center-left party. President Alan García, a member of the APRA, first became president in 1985. In the 2001 presidential election, García obtained significant support, forcing a runoff election in which Alejandro Toledo prevailed. On June 4, 2006, García won a run-off vote having campaigned on promises to tackle poverty and boost economic growth.
Partido Popular Cristiano (Christian People’s Party). The party was founded at the end of 1966 by a dissenting group of members of the Partido Democracia Cristiana (Christian Democratic Party). It is a right wing party and it is based in the christian social doctrine.
Perú Posible (Possible Peru). The party was founded in 1999 replacing the formerly known Partido Pais Posible (Possible Country Party) that was founded by Peru’s former president, Alejandro Toledo, in 1994. The party seeks to promote economic growth through a liberal economic program designed to foster domestic and foreign investment and fiscal and macroeconomic stability, while investing in social programs designed to alleviate poverty and create employment.
PPK (Alianza por el Gran Cambio or Alliance por Major Change). PPK is a political alliance formed in December 2010 by the Partido Popular Cristiano (Christian Popular party), the Partido Humanista Peruano (Peruvian Humanist party), the Partido Restauración Nacional (National Restoration party) and the Partido Alianza por el Progreso (Alliance for Progress party). The PPK nominated Pedro Pablo Kuczynski as presidential candidate in the general elections held in 2011.
Solidaridad Nacional (National Solidarity). Founded and headed by the former mayor of Lima, Luis Castañeda Lossio in 1998, this party is a center-right party that espouses principles of liberalism and social-Christian agenda. This party was recognized as a formal party on May 4, 2006 by the National Elections Forum.
15
The following table provides congressional representation of each of the political parties as of the most recent election in 2011.
| | | | | | | | |
| | | Congressional
Seats | | | % | |
| | |
Gana Perú | | | 47 | | | | 36.0 | |
Fuerza 2011 | | | 37 | | | | 29.0 | |
Perú Posible | | | 21 | | | | 16.0 | |
Alianza por el Gran Cambio | | | 12 | | | | 9.0 | |
Alianza Solidaridad Nacional | | | 9 | | | | 7.0 | |
Partido Aprista Peruano | | | 4 | | | | 3.0 | |
| | | | | | | | |
Total | | | 130 | | | | 100.0 | |
Source: Ministry of Economy and Finance.
President Ollanta Humala is a member of the Gana Peru party, which currently has the largest number of congressional seats.
Foreign Policy and Membership in International and Regional Organizations
Peru has not been involved in any significant international conflicts since the end of its border dispute with Ecuador in 1998. A brief diplomatic dispute erupted in 2001 between Peru and Venezuela in connection with the capture of the former advisor to Peru’s intelligence agency, Vladimiro Montesinos, in Venezuela. Peru alleged that Venezuela had temporarily hidden and protected Montesinos after formal charges had been brought against him in Peru, a claim that Venezuela denied. Venezuela temporarily severed relations with Peru between June 28 and July 28, 2001, but relations between the two countries were restored.
In July 2003, Peru presented a formal extradition request to the Japanese government for Alberto Fujimori based on criminal charges. The request was rejected by the Japanese government due to Fujimori’s Japanese citizenship. On October 15, 2004, Peru made a second request for extradition based on forgery and embezzlement charges, but the extradition process stalled. Peru’s commercial and other ties with Japan were not adversely affected by the dispute. On November 6, 2005, police in Chile arrested Fujimori after he began a surprise visit to Chile. Peruvian authorities presented numerous formal requests for Fujimori’s extradition. On September 21, 2007, Fujimori’s extradition was granted by the Chilean Supreme Court and he was extradited to Peru that same day.
Despite Peru’s and Chile’s dispute concerning the maritime boundary allegedly delineated in the 19th century War of the Pacific, the two countries enjoy good relations. On November 4, 2004, the foreign ministers of Peru and Chile signed a joint statement expressing an intent to forge closer ties and further develop bilateral relations and in August 2006 an economic complementation agreement was signed among both countries. However, the enactment of a declaration of maritime borders by Peru’s Congress on November 15, 2005 created a dispute among Peru and Chile countries over the maritime delimitation of their border. In order to settle the maritime delimitation dispute through established international law channels, Peru instituted on January 16, 2008 proceedings against Chile before the International Court of Justice, or ICJ. These proceedings have not damaged relations between Peru and Chile and economic relations among both countries have continued to strengthen.
Peru maintains diplomatic relations with 167 countries and is a member of 162 regional and international organizations and forums, including:
| | • | | the Organization of American States; |
| | • | | the Community of Andean Nations, formerly known as the Andean Pact; |
| | • | | the World Trade Organization, or WTO; |
| | • | | the Latin American Integration Association; |
16
| | • | | International Finance Corporation; |
| | • | | the Asia-Pacific Economic Cooperation; |
| | • | | the Free Trade Area of the Americas; |
| | • | | the Mercosur (as an associate member). |
Peru joined the General Agreement on Tariffs and Trade in 1951 and is a founding member of the WTO, which was established in January 1995. In addition, Peru participates in several regional initiatives designed to promote trade and foreign investment. The most significant of these initiatives are the following:
| | • | | Since 1980, Peru has been a member of the Latin America Integration Association, which promotes and coordinates bilateral trade agreements between its member countries. Under the auspices of this association, Peru has signed preferential tariff agreements with Argentina, Brazil, Cuba, Mexico, Paraguay and Uruguay. |
| | • | | Since 1990, Peru has been a member of the Community of Andean Nations, which also includes Bolivia, Colombia and Ecuador. This organization seeks to promote economic integration and cooperation. As of December 31, 2005, a free trade zone between the members of the Community of Andean Nations was effectively created. The common market provides for the free trade of goods, services, capital and people between its member countries. In April 1998, the Community of Andean Nations signed a framework agreement with the Common Market of the South, or Mercosur, whose members are Argentina, Brazil, Paraguay and Uruguay, to create a free trade zone between the two economic blocs. The Community of Andean Nations has also reached bilateral agreements with Brazil and Argentina as a first step towards the creation of free trade arrangements with these countries. On December 16, 2003, the Community of Andean Nations reached a trade pact with Mercosur. |
| | • | | Since 1990, Peru has been a beneficiary of the General System of Preferences for the Andean Countries, a program of unilateral trade preferences granted by the European Union that is intended to promote economic development in the Andean region. Under the program, the European Union sets zero tariffs for fishing, agriculture and textile products from Peru. This program was scheduled to expire on December 31, 2001, but was automatically extended for three years on December 10, 2001. In June 2005, a new General System of Preferences was adopted in accordance with the new rules set forth by the WTO, and the program was extended until December 2008. |
| | • | | Since 1991, Peru has been, together with Bolivia, Ecuador and Colombia, a beneficiary of the U.S. ATPDEA, a program of unilateral trade preferences granted by the United States to promote export diversification and broad-based economic development as an alternative to drug-crop production in the Andean region. The United States has repeatedly renewed ATPDEA with the last renewal set to expire on December 31, 2009. The ATPDEA was extended on December 31, 2010 for a period of six weeks that expired on February 12, 2011. Although a majority of Peruvian exporters no longer required the benefits of the ATPDEA given the approval of free trade agreement with the United States (US FTA), which became effective on February 2009, an important group of textile manufacturers and assembly |
17
| | plants benefited from the ATPDEA’s preferential tariff provisions that required lower composition of imported content in exported products. However, the US FTA will allow imports of assembled products and textiles into the North American market, as provided in the agreement. |
| | • | | In 1994, Peru participated in the Summit of the Americas in Miami, which led to the establishment of the Free Trade Agreement of the Americas. This agreement seeks to create a free trade zone in the Western Hemisphere, which, if implemented, would grant preferential treatment to Peruvian goods and services exported to other member countries. |
| | • | | Since November 1998, Peru has been a member of the Asia-Pacific Economic Cooperation, which seeks to achieve free trade in the Asia-Pacific region through a progressive reduction in the tariffs of its member countries. This organization establishes trade rules in areas of foreign investments, rules of origin, customs procedures, technical barriers to trade, unfair trade practices, promotion of competition, intellectual property and dispute resolution. |
| | • | | In August 2003, Peru signed an agreement with Brazil to become an associate member of Mercosur. On December 16, 2003, Peru was accepted as an associate member of Mercosur. Mercosur, formed by Argentina, Brazil, Paraguay and Uruguay, also includes associate members Bolivia, Chile, Colombia, Ecuador and Venezuela, which will become a member. Mercosur seeks to create a full common market in goods, services and factors of production among its members and to establish common external tariffs for trade with non-members. Peru expects to eliminate gradually its trade barriers with the members of Mercosur, with a goal of barrier-free trade with Paraguay and Uruguay in 13 years and with Argentina and Brazil in 15 years. |
| | • | | On December 8, 2004, Peru, together with Argentina, Bolivia, Brazil, Chile, Colombia, Ecuador, Guyana, Paraguay, Suriname, Uruguay and Venezuela, signed an agreement to create the South American Community of Nations, envisioned as an economic and political block similar to the European Union that ultimately will have a single currency. |
| | • | | On December 9, 2004, Peru and Brazil signed an agreement to build a 1,200 km transoceanic roadway from the Brazilian city of Assis, in the state of Acre, to three Peruvian ports, Matarani, Ilo, and Marcona, on Peru’s Pacific coast. Peru has granted a concession to private interests to build the portion of this road that is in its territory. |
| | • | | On November 19, 2005, Peru and Thailand signed a Protocol to Accelerate the Liberalization of Trade in Goods and Trade Facilitation in order to strengthen and enhance economic partnership between the two countries. |
| | • | | On November 30, 2005, Peru signed an Economic Complementation Agreement with Argentina, Brazil, Paraguay and Uruguay, members of Mercosur. |
| | • | | In April 2006, Peru signed the TPA with the United States. In June 2006 and November 2007, the Congress of Peru and the U.S. Congress approved the Peru TPA, and the U.S. Senate approved it in December 2007. The TPA entered into force in February 2009. |
| | • | | In August 2006, Peru signed a free trade agreement with Chile to expand the Economic Complementation Agreement of June 1998. This new free trade agreement gradually eliminates all customs duties between the two countries, provides for a substantial reduction in tariffs over a ten-year period and establishes a framework for cooperation in foreign investment, customs procedures, tourism, services trade, dispute resolution and sanitary requirements. This agreement entered into force in March 2009. |
| | • | | In May 2008, Peru signed a free trade agreement with Canada. This agreement entered into force in August 2009. |
18
| | • | | In May 2008, Peru signed a free trade agreement with Singapore. This agreement entered into force in August 2009. |
| | • | | In April 2009, Peru signed a free trade agreement with the Republic of China. This agreement entered into force in March 2010. |
| | • | | In July 2010, Peru and the European Free Trade Association, or EFTA, entered into a free trade agreement. During 2011, this agreement entered into force with Switzerland, Liechtenstein and Island. The agreement with Norway will enter into force during 2012. |
| | • | | In March 2011, Peru signed a free trade agreement with South Korea. This agreement entered into force in August 2011. |
| | • | | In April 2011, Peru signed a free trade agreement with Mexico. This agreement entered into force in February 2012. |
| | • | | In May 2011, Peru signed a free trade agreement with Panama. This agreement entered into force in May 2012. |
| | • | | In May 2011, Peru signed a free trade agreement with Costa Rica. It is expected that this agreement will enter into force during the second quarter of 2012. |
| | • | | In May 2011, Peru signed a free trade agreement with Japan. This agreement entered into force during March 2012. |
| | • | | In December 2011, Peru signed a free trade agreement with Guatemala. |
| | • | | In March 2012, Peru and Thailand completed the eighth rounds of negotiations for the Peru-Thailand partnership. |
Relations with Ecuador
Peru has had several territorial disputes with Ecuador dating back to colonial times. A significant military clash occurred in 1941, which came to an end in 1942 with the signing of the Rio de Janeiro Protocol. This settlement, sponsored by Argentina, Brazil, Chile and the United States, established territorial limits between Peru and Ecuador but failed to delineate clearly their border in a 78-kilometer section of the Andean foothills. Further disputes over the border in this region led to additional clashes in 1981 and 1995. In the latest clash, thousands of soldiers from each country fought an intense but localized war in the disputed territory of the upper Cenepa valley.
A peace agreement brokered in February 1995 by the four sponsors of the Rio de Janeiro Protocol led to the cessation of hostilities and established the Military Observers Mission to Ecuador-Peru to monitor activities in the disputed area. In 1996, Peru and Ecuador began a series of meetings that led to the 1998 Brasilia Agreement, which defined the border in the disputed area. The border agreed upon tracks the peaks of the Cordillera del Cóndor mountain range. The 1998 Brasilia Agreement granted Ecuador private ownership of a hill known as Tiwinza, but it was agreed that the hill would remain under Peruvian sovereignty. In May 1999, a complete demarcation of the border was completed. The 1998 Brasilia Agreement also established terms of bilateral trade and navigational understandings between the two nations and created the Bi-National Commission for Border Integration. This commission led to the launch of a U.S.$3.0 billion regional development program to improve social and economic conditions along the border.
On May 2, 2011, Peru and the Republic of Ecuador exchanged communiqués with identical content regarding the maritime boundaries that will exist between the two countries. These communiqués establish a geographic parallel as the maritime boundary that will apply between Peru and the Republic of Ecuador to address the existence of islands in the adjacent land frontier, that constitutes a special circumstance under applicable international law. At the same time, the communiqués establish the bases for the development of a joint action plan
19
in advance of a recognition between the parties of the Gulf of Guayaquil as a historic bay and will segregate interior waters in both jurisdictions as sovereign waters of both states. The foregoing agreements are all set forth in a series of annexes that are attached to the communiqués. As a result, by virtue of the exchange of communiqués, Peru presented a communiqué addressed to the Secretary General of the United Nations expressing its agreement that, given the existence of the islands, the parallel at Boca de Capones that is set forth in the Nautical Map of Ecuador IOA 42, will be the maritime boundary between Peru and the Republic of Ecuador. On June 6, 2011, Peru and the Republic of Ecuador registered with the United Nation the agreement that established their maritime boundaries.
Peru currently maintains strong political and economic relations with Ecuador. The two governments have signed further agreements on border development, navigation, security and trade.
Narco-terrorism and Delinquency
In the 1980s and early 1990s, the Shining Path and Tupac Amaru conducted indiscriminate bombings and selective assassinations in Peru. The Government estimates that from 1980 to 1995, the Shining Path’s terrorist activities led to the deaths of approximately 31,300 people. The capture in 1992 of the Shining Path’s founder, Abimael Guzmán, his subsequent life sentence and the jailing of most of the Shining Path’s central committee, considerably weakened the Shining Path. Although the Shining Path is no longer as powerful as it was during the 1980s and early 1990s, members still operate in remote regions in central and southern Peru, where military patrols have decreased due to cuts in military spending. During the last years there have been sporadic subversive actions in rural areas, especially in the jungle, which have been attributed to the Shining Path.
Shining Path members have formed alliances with coca farmers and drug traffickers in drug-growing areas of the Upper Huallaga and Apurimac valleys to provide armed protection against the Government’s interdiction efforts. In response to this activity, security forces in Peru continue to monitor subversive activities and have maintained their efforts to prevent the resurgence of a significant terrorist threat, including by reactivating anti-terrorist bases in the valleys, training farmers in areas where the Shining Path operates to assist the military and heightening security in Lima.
The limited state presence in large portions of the interior challenges the Government’s ability to ensure broad-based development for all Peruvians. Peru’s tropical forests are increasingly threatened by shifting migration patterns, unsustainable exploitation of the forest, and the destructive impact of illicit coca production and processing. The lack of government presence in these areas allows drug trafficking, illegal logging, terrorism and other criminal practices to flourish, creating a corrupt, violent and conflictive environment that limits economic opportunities and prevents sustainable economic growth and development.
During 2010 there was a slight increase in the production of coca from 59,900 hectares in 2009 to 61,200 hectares in 2010. The Government reported the eradication of 12,033 hectares of coca fields in 2010, 20% more than 2009. In 2011, 10,290 hectares were eradicated, 14.5% less than 2010.
In addition to Peru’s coca crop, production of poppies, the source of heroin, has decreased in Peru since 2008. In 2010, the Government eradicated 21.5 hectares of poppies. During 2011, the Government did not eradicate any hectares of poppies.
The Government has also implemented measures to prevent money laundering of funds from drug trafficking and other illegal activities. Peru requires financial institutions to conduct employee training in preventive methods, obtain basic knowledge about their clients and adhere to a code of conduct. Moreover financial institutions are required to report to the Unidad de Inteligencia Financiera (Financial Intelligence Bureau) any suspicious activity which may be related to money laundering or financing of terrorism.
Legal Proceedings
On October 6, 2003, Duke Energy International Peru Investments No. 1 Ltd., or Duke Energy, filed a request for arbitration before the Centro Internacional de Arreglo de Diferencias Relativas a Inversiones, or CIADI (the International Center for Settlement of Investment Disputes), alleging that Peru breached the Legal Stability
20
Agreement between Duke Energy and Peru by imposing a U.S.$48.0 million tax assessment on Duke Energy’s affiliate, Duke Energy International Egenor S. en C. por A. for underpayment of taxes due, interest, fines and penalties. Duke Energy sought compensation for any increased tax costs or effects arising out of the assessment, amounts paid to the Government in connection with the tax assessment and costs of the arbitration proceedings. On August 18, 2008, the CIADI tribunal decided in favor of Duke Energy on one of the pleadings and dismissed the other. The award has found Peru liable to Duke Energy for damages of approximately U.S.$18.4 million plus interest. In November 2009, Peru filed an appeal seeking annulment of the award and Duke Energy filed a response. On March 1, 2011, the CIADI tribunal rendered its decision on the application for annulment in favor of Peru.
On July 17, 2006, Aguaytía Energy LLC, or Aguaytía Energy, filed a request for arbitration before the CIADI, alleging that Peru violated the legal stability agreement between Aguaytía Energy and Peru by the inappropriate classification of the transmission facilities of their wholly owned subsidiaries Eteselva S.R.L. and Termoselva S.R.L. Aguaytía Energy seeks compensation for U.S.$140.6 million. On December 11, 2008, CIADI denied the claim of Aguaytía Energy and ruled in favor of Peru, stating that the wording of the stability agreement did not convey a most-favored-investor status to the claimant.
On September 29, 2006, Mr. Tza Yap Shum and TSG Perú S.A.C., filed a request for arbitration before the CIADI, alleging that Peru had violated its international obligations under the bilateral investments promotion and protection agreement, or BIT, with the People’s Republic of China. Mr. Tza Yap Shum and TSG Perú S.A.C., are seeking U.S.$20 million in compensation. Peru raised a number of objections to the CIADI tribunal’s jurisdiction. On June 19, 2009, the tribunal issued a decision that found it had jurisdiction over the claim. It also concluded that many of Mr. Tza’s claims were beyond the scope of the dispute settlement provisions set forth in the BIT between China and Peru, and thus had to be dismissed. However, the tribunal found that it had jurisdiction over the expropriation claim, which it allowed to proceed on the merits. Resolution of this case is pending.
On January 16, 2008, Peru instituted proceedings against Chile before the ICJ concerning a dispute in relation to the delimitation of the boundary between the maritime zones of both countries in the Pacific Ocean and the recognition in favor of Peru of a maritime zone lying within 200 nautical miles of Peru’s coast, which Chile considers to be part of the high seas. Peru has requested the ICJ to determine the course of the boundary between the maritime zones of Peru and Chile and to adjudge and declare that Peru possesses exclusive sovereign rights in the maritime area in question which is beyond Chile’s exclusive economic zone or continental shelf. On March, 19, 2009, Peru submitted its initial pleading concerning the maritime delimitation dispute with Chile to ICJ. The ICJ authorized the submission of a reply by Peru and a rejoinder by Chile by November 9, 2010 and July 11, 2011, respectively. The ICJ will hold public hearings in the dispute from during December 2012. Resolution of this case is pending.
On February 2 , 2010, Convial Callao S.A. and CCI—Compañía de Concesiones de Infraestructura S.A., or Convial, filed a request for arbitration before the CIADI, alleging that Peru breached the Investment Protection Bilateral Agreement (Convenio Bilateral de Protección de Inversiones) entered between Peru and Argentina in relation with the construction of the Via Expresa Faucett and in relation with certain concession agreements entered with the Callao Municipality. Convial seeks compensation of U.S.$30 million. On February 18, 2011, the claimant filed a memorandum with the arbitral tribunal on the merits of its claim. Resolution of this case is pending.
On July 20, 2010, Renée Rose Levy de Levi, or Renée Rose, filed a request for arbitration before the CIADI, alleging that the dissolution and liquidation of Banco del Nuevo Mundo by SBS was arbitrary. Renée Rose seeks compensation for U.S.$840 million. On January 19, 2011, the tribunal was constituted. Resolution of this case is pending.
On April 15, 2011, Caraveli Cotaruse Transmisora de Energía S.A.C., or Caraveli, filed a request for arbitration before the CIADI, alleging that the denial of granting an extension of the term to obtain a letter of guarantee in accordance with the terms of the concession agreement by the Energy and Mine Ministry and the Government was arbitrary. On January 13, 2012, the claimant filed a memorial on the merits and on May 5, 2012, the respondent files a counter-memorial on the merits. The resolution for this case is still pending.
On February 15, 2012, Elecnor S.A. and Isolux Corsán Concesiones S.A., filed a request for arbitration before the CIADI. The claim is related to the agreement that the claimants had entered with the Government to design, construct and operate the electric lines Mantaro-Caravelí-Montalvo and Machu Picchu-Cotaruse. The request was registered on February 25, 2012. Resolution of this case is pending.
21
On July 22, 2011, DP World Callao S.R.L., P&O Dover (Holging) Limited, and The Peninsular and Oriental Steam Navigation Company filed a request for arbitration before the CIADI, alleging that the decision of the Government not allowing them to participate in the bid of the concession Muelle Norte del Puerto del Callao was arbitrary. Also they claim that the Republic has breached the concession agreement of Muelle Sur del Puerto del Callao as a result of the improvements of the contractual conditions of the current operator of the concession Muelle Norte del Puerto del Callao, affecting the economic balance of the concession Muelle Sur del Puerto del Callao and the competition rights guaranteed by the Government. The claimants seek compensation for U.S.$.200 million. The tribunal was constituted on January 10, 2012. Resolution of this case is pending.
22
THE ECONOMY
History and Background
Between 1930 and the mid-1960s, Peru had one of the most successful economies in Latin America. During this time, Peru generally deviated from the import-substitution model adopted by other countries in the region. Peru adhered, except for brief intervening periods, to laissez-faire, non-interventionist economic policies. The Government encouraged foreign investment through tax incentives and legislation guaranteeing equal treatment of foreign and domestic investors. Aided by its main exports, consisting of fish, fish products, copper, petroleum and agricultural products, Peru’s economy grew steadily during this period.
Beginning in the mid-1960s, the Peruvian economy sustained a series of setbacks. Public sentiment began to turn resolutely against foreign investment. Pressure for change in economic policies increased as a result of:
| | • | | class and social conflicts, characterized by populist resentment against the economic elite that ruled Peru and against the presence of foreign companies in industries related to Peru’s national resources, such as petroleum and mining, and in other prominent sectors of the economy; |
| | • | | an economic slowdown brought about by a reduction in production and exports due principally to a sudden drop in fish catch and reduced mining and metal processing following the exhaustion of a number of the principal copper and other mines; and |
| | • | | the increased cost of living brought about by higher domestic food prices. |
In 1968, the military government headed by General Juan Velasco Alvarado nationalized numerous private enterprises and conducted a campaign against foreign participation in the Peruvian economy. In 1969, the Velasco administration enacted Ley de Reforma Agraria, or the Agrarian Reform Law, which confiscated large estates from wealthy owners in exchange for long-term bonds, turning the estates into cooperatives run by the former workers of the estates, and adopted high tariffs to shield local industry and manufacturing from foreign competition. During 2010, there has been an increase in terms of volumen of administrative and judicial requests against Peru in connection with the bonds issued pursuant to the Agrarian Reform Law.
Peru’s currency became overvalued, making exports less competitive, and its debt grew sharply during the 1970s. Peru experienced large current account deficits and the Velasco administration borrowed abroad to finance these deficits rather than change its policies. Many cooperative farms, operated by people with little management experience, went bankrupt and agricultural production suffered.
In 1975, General Francisco Morales-Bermúdez Cerruti implemented an economic austerity program to correct the economic disequilibrium reflected in Peru’s fiscal and current account deficits and high external debt burden. The Government implemented fiscal and monetary restraints and devalued the currency. These measures coincided with increases in world prices of Peru’s main exports. The fiscal deficit narrowed and by 1979 Peru had achieved a significant current account surplus.
In 1980, the civilian government led by Fernando Belaúnde reinstituted high spending and borrowing but was forced to adopt more restrained spending policies in later years. Alan García Pérez, who assumed the presidency in 1985, brought Peru to a deepening economic crisis. García increased spending, declared a debt moratorium and attempted to nationalize the banking system and other key industries. Private investment collapsed, the public sector deficit increased and exports dwindled. By 1990, the annual inflation rate had increased to 7,650%, net international reserves had been completely depleted and the economy had entered its third year of recession. The García administration was also beset by the terrorist activities of the Shining Path and Tupac Amaru.
In 1990, Alberto Fujimori, a university professor, won the presidential election on a campaign platform that emphasized his “outsider” status and his opposition to “traditional” politicians. President Fujimori inherited an economy beset by recession, hyperinflation and high levels of external debt. President Fujimori immediately moved to cut public spending, increase taxes, tame inflation and open domestic markets to foreign investment.
23
Within the first few years of his presidency, President Fujimori dismantled protectionist and interventionist laws and policies to create a liberal economy dominated by private sector and market forces. In order to encourage foreign investment, the Fujimori administration undertook an ambitious privatization program, strengthened and simplified Peru’s tax system, opened Peru to foreign investment and lifted exchange controls and restrictions on remittances of profits, dividends and royalties. Although the Fujimori administration successfully privatized many state entities, the privatization program waned in the later years of the administration because of adverse market conditions and Fujimori’s adoption of a more populist stance prior to the 2000 elections.
As time went on, the Fujimori administration became increasingly authoritarian, as evidenced by the dissolution of Congress in 1992, his consolidation of power in the executive branch following adoption of the 1993 Constitution and his alliance with Vladimiro Montesinos, an intelligence advisor. President Fujimori’s authoritarianism exacted a price on Peru’s political system, although it had little effect on the successes of his economic program.
On November 20, 2000, Congress removed President Fujimori from office and Valentín Paniagua assumed the presidency on a provisional basis. The Paniagua administration adopted fiscal policies to reduce spending, restore confidence, reform the tax system and stabilize the economy.
In June 2001, Alejandro Toledo Manrique was elected president based on a platform that recognized the value of an open economic system and rejected Fujimori’s legacy of political authoritarianism. President Toledo vowed to restore democracy, fiscal discipline and transparency to the Government. He pledged to increase the living standards of the poor and disadvantaged, who constitute a majority of Peru’s population, through improvements in education, health and employment opportunities. He also promised to continue the economic reforms and privatization program first advanced by the Fujimori administration.
President Toledo assumed the presidency in July 2001 against a backdrop of high unemployment and underemployment, economic recession and social need more severe than the Fujimori administration had acknowledged. Despite the economic achievements between 1990 and 2000, poverty remained a persistent problem in Peru. More than half of the population lived below the poverty line, as defined by the World Bank, adjusted to reflect differences in purchasing power. A significant number of Peruvians lived on a monthly per capita income of less than U.S.$30.
President Toledo implemented a number of proposals to stimulate Peru’s economy, including privatization and fiscal austerity programs. President Toledo’s policies spurred sustained economic growth since the fourth quarter of 2001. Despite this economic growth, the Toledo administration fell in the polls and faced ongoing social protests and unrest spurred by disappointment that President Toledo’s policies did not immediately lead to a significant reduction in the high rates of unemployment, underemployment and poverty.
On June 4, 2006, President García was elected to a five-year term after winning approximately 53% of the nationwide vote. The García administration was elected on a platform that sought to implement social and political reforms and to provide continuity to the macro-economic stability of recent years, as well as solidifying Peru’s relationships with its international partners. President García adopted policies that approximated Peru to the United States and other developed economies, seeking to consolidate the existing relationships and sign trade agreements with these countries. President García also sought to achieve economic development for all Peruvians while ensuring economic and political stability. During President Garcia’s term in office, Peru signed free trade agreements with the United States, Canada, Singapore, China and Chile, and continued with market oriented policies that spurred economic growth.
On June 5, 2011, Ollanta Humala, the leader of Gana Peru, was elected president to a five-year term after winning a run-off election against Keiko Fujimori. While the election of President Humala initially generated political and economic uncertainty, President Humala took decisive steps to demonstrate continuity with the prior administrations’ economic policies. Shortly after his inauguration, President Humala ratified Julio Velarde as president of the Central Bank of Peru and appointed Luis Miguel Castilla as minister of economy and finance, both of whom served as senior members in the prior administration and have been strong proponents of open market policies.
24
Since taking office on July 28, 2011, President Humala’s administration has continued to implement policies that promote macroeconomic stability, fiscal discipline and domestic and foreign investment. In addition, President Humala’s administration has not made any significant shift in trade policy and has not experienced any adverse changes with its major trading partners, relative to the prior administration.
In addition to strong economic growth, the President Humala’s administration is also focused on promoting a broader agenda of social inclusion by developing social programs that benefit the poorest sectors of the population. President Humala has vowed to lift the country out of extreme poverty by investing in social inclusion programs, with an emphasis on health, education and infrastructure projects.
Developments from 2007 to 2011
Introduction
From 2007 to 2011, Peru experienced a period of general economic expansion. The economy expanded by 8.9% in 2007, 9.8% in 2008, 0.9% in 2009, 8.8% in 2010 and 6.9% in 2011. Provided below is a discussion of the trends and events affecting the economic results during this period.
2007
In 2007, GDP expanded by 8.9% compared to 2006. This growth was mainly attributable to an increase in domestic demand, the result of economic stability, employment growth and increased consumer confidence. Exports grew 17.9% to U.S.$28.1 billion in 2007, compared to 37.2% in 2006. For the fourth year in a row, the current account posted a surplus equivalent to 1.4% of GDP. The surplus of the non-financial public sector increased to 3.1% of GDP.
The following were the key economic results for 2007:
| | • | | the non-financial public sector fiscal surplus as of December 31, 2007 was 3.1% of GDP, compared to 2.1% of GDP as of December 31, 2006; |
| | • | | the inflation rate was 3.9% compared to 1.1% in 2006; and |
| | • | | the net international reserves of the Central Bank as of December 31, 2007 increased to U.S.$27.7 billion, compared to U.S.$17.3 billion as of December 31, 2006. |
2008
In 2008, GDP expanded by 9.8% compared to 2007, the highest growth rate since 1997. This growth was mainly attributable to an increase in domestic demand, the result of economic stability, employment growth and increased consumer confidence. Exports grew 10.4% to U.S.$31.0 billion in 2008, compared to growth of 17.9% in 2007. The current account posted a deficit equivalent to 4.2% of GDP. The surplus of the non-financial public sector decreased to 2.1% of GDP.
The following were the key economic results for 2008:
| | • | | the surplus of the non-financial public sector as of December 31, 2008 was 2.1% of GDP, compared to 3.1% of GDP as of December 31, 2007; |
| | • | | the inflation rate was 6.7% compared to 3.9% in 2007; and |
| | • | | the net international reserves of the Central Bank as of December 31, 2008 increased to U.S.$31.2 billion, compared to U.S.$27.7 billion as of December 31, 2007. |
25
2009
In 2009, GDP expanded by 0.9% compared to 2008. The deceleration of economic growth was due primarily to weak private consumption and a decrease in private investment, which resulted in a 2.9% decline in domestic demand during 2009. Exports decreased 13.1% to U.S.$27.0 billion in 2009, compared to U.S.$31.0 billion in 2008. The current account posted a surplus equivalent to 0.2% of GDP.
The following were the key economic results for 2009:
| | • | | the current account surplus totaled U.S.$0.2 billion, or 0.2% of GDP, compared to a current account deficit of U.S.$5.3 billion, or 4.2% of GDP, in 2008; |
| | • | | the non-financial public sector registered a deficit of U.S.$2.6 billion, or 1.9% of GDP, compared to a surplus of U.S.$2.8 billion, or 2.1% of GDP, for 2008; |
| | • | | the balance of public sector external debt totaled U.S.$20.6 billion, or 16.2% of GDP, compared to U.S.$19.2 billion, or 15.1% of GDP, as of December 31, 2008; |
| | • | | foreign direct investment was U.S.$5.2 billion, compared to U.S.$6.2 billion during 2008; |
| | • | | exports decreased by 13.1%, to U.S.$27.0 billion, compared to U.S.$31.0 billion in 2008, primarily as a result of a decrease in exports of copper, hydrocarbons and agricultural and textile products; |
| | • | | the balance of public sector domestic debt totaled U.S.$14.0 billion, or 11% of GDP, compared to U.S.$11.4 billion, or 9.0% of GDP, as of December 31, 2008; |
| | • | | the inflation rate was 0.2%, compared to an inflation rate of 6.7% for 2008; and |
| | • | | the net international reserves of the Central Bank increased by 6.2%, to U.S.$33.1 billion as of December 31, 2009, compared to U.S.$31.2 billion as of December 31, 2008. |
2010
During 2010, GDP grew by 8.8%, compared to 2009. The sectors that experienced growth were agriculture and livestock, hydrocarbons, construction, utilities and other services. The expansion of 24.0% in the hydrocarbons sector was due to oil extraction, especially due to the increase in the natural gas extraction, driven by the dynamic development of the natural gas market in the country, which is shown with the greater use of this resource en the electric power market, mechanic transportation, industrial, commercial and residential consumption. The expansion in the utilities sector was due to increased production in the electric power sector/industry. Growth in the construction sector resulted in a greater local consumption of concrete and in an increase in the investment of construction works. Livestock and agriculture sectors grew driven by increased activity in the avicole and cattle sub-sectors. Finally, the commerce sector grew as a result of the increase in the commerce of motor vehicles, construction and hardware materials.
The following were the key economic results during 2010:
| | • | | public sector domestic debt totaled U.S.$16.8 billion, or 10.9% of GDP; |
| | • | | the current account registered a deficit equal to 1.5% of GDP; |
| | • | | exports increased 31.9%, from U.S.$27.0 billion to U.S.$35.6 billion, compared to a decrease of 13.1% during 2009; |
26
| | • | | the overall balance of the non-financial public sector registered a deficit of U.S.$0.9 billion, or 0.6% of GDP, compared to a deficit of U.S.$2.6 billion, or 1.9% of GDP, for 2009; |
| | • | | inflation increased by 2.1% during the period, compared to an inflation rate of 0.2% for 2009; |
| | • | | public sector external debt totaled U.S.$19.9 billion, or 12.9% of GDP; |
| | • | | the net international reserves of the Central Bank increased to U.S.$44.1 billion in 2010 compared to U.S.$31.2 billion as of December 31, 2009; and |
| | • | | foreign direct investment was U.S.$7.1 billion compared to U.S.$5.2 billion during 2009. |
2011
In 2011, GDP expanded by 6.9% compared to 2010. The deceleration of economic growth was primarily due to a moderation in the domestic demand dynamic, as a result of a decrease in public expenditures principally due to the issuance in March 2011 of Supreme Decree No. 012-2011 which sought to increase public savings in order to withstand the adverse effects of a downturn in the international economy after the 2009 crisis, and a decrease in private investment. Exports increased by 30.1%, to U.S.$46.3 billion, compared to U.S.$35.6 billion in 2010. The current account posted a deficit equivalent to 1.3% of GDP. The following were the key economic results during 2011:
| | • | | public sector domestic debt totaled U.S.$18.1 billion, or 10.2% of GDP; |
| | • | | the current account registered a deficit equal to 1.3% of GDP; |
| | • | | exports increased 30.1%, from U.S.$35.6 billion to U.S.$46.3 billion, compared to an increase of 31.9% during 2010; |
| | • | | the overall balance of the non-financial public sector registered a surplus of U.S.$3.2 billion, or 1.8% of GDP, compared to a deficit of U.S.$0.5 billion, or (0.3)% of GDP, for 2010; |
| | • | | inflation rate was 4.7%, during the period, compared to an inflation rate of 2.1% for 2010; |
| | • | | public sector external debt totaled U.S.$20.2 billion, or 11.4% of GDP; |
| | • | | the net international reserves of the Central Bank increased to U.S.$48.8 billion in 2011 compared to U.S.$44.1 billion in 2010; and |
| | • | | foreign direct investment was U.S.$7.5 billion compared to U.S.$7.1 billion during 2010. |
Developments in Argentina, Bolivia, Brazil, Colombia, Ecuador and Venezuela
On October 28, 2007, Cristina Fernández took office as president of Argentina, succeeding her husband, president Néstor Kirchner. On October 23, 2011, Cristina Fernández was reelected as president of Argentina. President Fernández is member of Frente para la Victoria, which has a leftist ideology. Her first months in office were marked by economic and political unrest, as well as high inflation rates and power outages and shortages. In March 2008, the federal government introduced a new tariff regime, which effectively sets a maximum price for crops. This sparked widespread strikes and protests by farmers, including a 21-day strike in which, among other things, roadblocks were set up throughout the country, triggering Argentina’s most significant political crisis in five years. As a consequence of the protests and the subsequent lack of support in the Senate for the tariff, the federal government abrogated the regime of sliding-scale export tariffs. In December 2008, the Argentine government transferred the approximately U.S.$29.3 billion in assets held by the country’s ten private pension fund management companies (Administradoras de Fondos de Jubilaciones y Pensiones, or AFJPs) to the government-run social
27
security agency, or ANSES. AFJPs were the largest participants in the country’s local capital market. With the nationalization of their assets, the local capital market in Argentina diminished in size and is now concentrated in the hands of the government. In addition, the government became a significant shareholder in many of the country’s private companies. The nationalization of the AFJPs has adversely affected investor confidence in Argentina. In April 2012, the Argentine government temporary intervened YPF S.A. for a period of thirty days, which was extended for an additional 30 days. On May 3, 2012, the Argentine congress passed Law No. 26,741, which established the expropriation of 51% of the share capital of YPF S.A. represented by an identical stake of Class D shares owned, directly or indirectly, by Repsol YPF S.A. and its controlled or controlling entities. The expropriated shares, which have been declared of public interest, will be assigned as follows: 51% to the federal government and 49% to the governments of the provinces that compose the National Organization of Hydrocarbon Producing States. There is no certainty about the consequences that the expropriation of YPF S.A. would have in Argentina’s economy, on the confidence of local and international investors, on the business environment in Argentina and what reaction it will cause from other countries or international organizations or economic blocs.
In Brazil, Dilma Vana Rousseff was elected president on October 31, 2010 for a four-year term and took office on January 1, 2011. Brazil has shown strong growth and low rates of inflation during the last few years, which has led to a decrease in unemployment and an improvement in the balance of trade.
Under Bolivian president Evo Morales’ oil, gas and strategic sectors nationalization plan, Bolivia has expropriated foreign energy companies, mining companies, private pension funds and telecommunications companies’ interests in Bolivia or forced renegotiation under unfavorable terms. During late 2007, 2008 and 2009, president Morales experienced strong opposition from the rich producing provinces of the west of Bolivia, which forced a referendum to vacate his presidency. Even though president Morales won by a comfortable margin, the unstable political situation and struggle with the opposition provinces has continued. President Morales is also currently involved in a legal battle to call a referendum for a new constitution. President Morales is a strong ally of president Chávez.
Rafael Correa, an ally of president Chávez, was elected president of Ecuador in November 2006. His policies have been similar to those of Bolivia and Venezuela, having expropriated or forced the renegotiation under unfavorable terms of interests of foreign companies in the oil sector. On September 28, 2008, a constitutional reform promoted by President Correa was approved, increasing his powers and giving the executive branch greater control of Ecuador’s resources.
In Colombia, president Juan Manuel Santos, who assumed office on August 7, 2010, has continued with the market-oriented policies and strong drive to defeat the guerillas promoted by his predecessor, president Alvaro Uribe. During 2009, Colombia’s army saw several successes in its war against the FARC guerilla, including the release through a military operation of prominent hostages, the death of its leader and increased rates of desertion among FARC members. Colombia has continued to tighten commercial and military ties with the United States and has signed a free trade agreement with the latter, which was approved by the U.S. Congress in October 2011.
In Venezuela, the administration of president Hugo Chávez has promoted a model of increased state participation in the economy through exchange and price controls, state-owned companies, welfare programs, worker co-management and cooperatives and social production companies through which the Venezuelan government provides financial and training support. President Chávez has expropriated foreign companies’ interests, or forced sale under unfavorable terms, in several sectors of the economy, including steel, cement, energy, oil, media and telecommunications. President Chavez’s foreign policy has included intensive regional and international diplomacy intended to influence regional economic integration and diversify commercial relationships for the region. His foreign policy has opposed to United States interests in Latin America, which has included increased ties with countries such Russia, China and Iran. So far, windfall oil revenues have allowed an increase in domestic spending programs.
Negative investor reaction to developments in any of these countries could adversely affect the market for securities issued by Latin and South American countries, cause foreign investors to withhold capital from the region and cause uncertainty about plans for further integration of the region’s economies. Any of these events could adversely and materially affect Peru.
28
The Economic Policies of the Humala Administration
On June 5, 2011, Ollanta Humala, the leader of Gana Peru, was elected president after winning a run-off election against Keiko Fujimori. While the election of President Humala initially generated political and economic uncertainty, President Humala took decisive steps to demonstrate continuity with the prior administrations’ economic policies. Shortly after his inauguration, President Humala ratified Julio Velarde as president of the Central Bank of Peru and appointed Luis Miguel Castilla as minister of economy and finance, both of whom served as senior members of the previous administration and have been strong proponents of open market policies.
Since taking office on July 28, 2011, President Humala’s administration has continued to implement policies that promote macroeconomic stability, fiscal discipline and domestic and foreign investment. Also, the Humala administration has not made a shift in trade policy and has not experienced any changes with its major trading partners, relative to the prior administration.
In addition to strong economic growth, the administration is also focused on promoting a broader agenda of social inclusion by developing social programs that benefit the poorest sectors of the population. President Humala has vowed to lift the country out of extreme poverty by investing in social inclusion programs, with an emphasis on health, education and infrastructure projects.
The following are some of the key initiatives and laws that have been implemented by President Humala’s administration:
| | • | | Prior Consultation Right of Local Indigenous Communities. On September 7, 2011, the Government passed Law No. 29785 on the Prior Consultation Right of the Indigenous Population, which is based on the International Labor Organization’s 169th Convention that was ratified by Peru in 1993. The law establishes a prior consultation procedure that the Government must carry out with local indigenous communities whose rights may be directly affected by new legislative or administrative measures, as well as national and regional plans, programs and projects. Complementing regulations under this law are pending. |
| | • | | Mining Royalty Tax. On September 28, 2011, the Government amended the royalty mining law to increase taxation on metallic and non-metallic mining activities. Effective October 1, 2011, the royalty for the exploitation of metallic and non-metallic resources will be the greater of a statutory scale of tax rates applied to a company’s operating profit and 1% of a company’s net sales. The Government seeks to use the additional resources from mining activities to improve the infrastructure in some of the poorest areas of the country. |
| | • | | Pension 65. In the fourth quarter of 2011, President Humala launched the Pension 65 program, which is designed to provide financial assistance to senior citizens over the age of 65 who do not have access to pension plan benefits. The program has been rolled out to some of the poorest regions in the country, assisting over 40,000 senior citizens in extreme poverty by providing them with S/.250 per month. The Government intends to gradually roll out this program on a national scale. |
| | • | | Other Social Programs. Other social initiatives launched by the Humala administration in 2011 include a system of mobile emergency medical units serving the poorest areas (SAMU), academic scholarships for underprivileged students (Beca 18), and the program Juntos, which provides monetary incentives to families in extreme poverty in exchange for their commitments to provide their children with medical and educational services offered by the Government. |
Gross Domestic Product and Structure of the Economy
In the five-year period ended December 31, 2011, Peru’s economy grew at an annual compound rate of 7.0% in real terms. The rate of growth was more pronounced in the period from 2007 to 2008, when GDP grew on average 9.4% in real terms, and specifically in 2008, when the rate of GDP growth was 9.8%. The economic expansion during this period has been based on solid economic fundamentals resulting from strong private
29
investment, price stability, improvement in public finances and lower external public debt. Since 2007 domestic demand (total gross investment and public and private consumption) has been the main source of growth, with a 12.3% average increase in real terms between 2007 and 2008. In 2009, Peru’s economy expanded 0.9% in real terms based on GDP growth, domestic demand decreased 2.8% despite the growth in public investment and private and government consumption. In 2010, Peru’s economy grew 8.8% in real terms, compared to 2009. In 2011, Peru’s economy grew 6.9% in real terms, compared to 2010.
In the five year period ended December 31, 2011, private consumption experienced an annual average increase of 6.3% in real terms and 6.4% in 2011. As of 2007, gross private investment grew 18.2% compared to 2006. As of 2008 gross private investment grew 42.8%. In 2009 gross private investment decreased on 15.1%, in 2010 gross private investment grew 22.1% and in 2011 gross private investment grew 11.7%
In 2007, demand was mainly driven by the rapid expansion in private consumption and private investment. Private consumption was U.S.$66.0 billion, an increase of 8.3% in real terms compared to 2006, as a consequence of continued growth in employment across major cities, higher average incomes and increased access to and better terms of credit. Decentralized growth of employment has taken place in activities such as agriculture, commerce, transport and services—the principal sources of employment outside the capital city—with a positive impact on household spending. During 2007, gross investment increased to U.S.$24.6 billion, a 25.8% increase in real terms, in the same period due to better terms of trade, increased sales and profits, and a positive evolution of business expectations, which encouraged companies to implement projects of technological renovation and plant expansion in order to respond to higher levels of demand. Private investment has been the principal factor that has increased demand during the recent economic expansion.
In 2008, private consumption increased to U.S.$81.3 billion, compared to U.S.$66.0 billion during 2007, an increase of 8.7% in real terms, as a result of greater consumer confidence, national income, access to credit and urban employment. Total gross investment increased 25.8% during 2008, compared to 2007, due to increased private investment in construction projects and increased public investment by local governments and government-owned companies.
During 2009, private consumption was U.S.$83.2 billion, a growth of 2.4% in real terms, as a result of slower increase in the national income. Private investment decreased 15.1% though a considerable number of projects were undertaken, primarily in the mining, hydrocarbons, electricity, transportation, telecommunications and manufacturing sectors. Total gross investment decreased 20.6% in 2009 despite the fact that public investment by central government, local governments and government-owned companies increased compared to 2008.
During 2010, private consumption was U.S.$95.3 billion, a growth of 6.0% in real terms, as a result of slower increase in the national income. Private investment increased 22.1% though a considerable number of projects were being conducted, primarily in the mining, hydrocarbons, electricity, transportation, telecommunications and manufacturing sectors. Total gross investment increased 36.9%, public and private investment increased 27.3% and 22.1%, respectively, in each case, compared to 2009.
In 2011, private consumption was U.S.$107.4 billion, a growth of 6.4% in real terms, as a result of an increase in national income, higher rates of employment and an increase in consumer confidence. Total gross investment increased 10.0%, public investment decreased 17.1% and private investment increase 11.7%% compared to 2010. The decrease in the growth of private investment was due to the uncertainty generated by the presidential elections held during the second half of 2011 and the social protests against mining investments.
30
The following tables set forth GDP by expenditure for the periods shown.
Gross Domestic Product by Expenditure
(in millions of U.S. dollars, at current prices)
| | | | | | | | | | | | | | | | | | | | |
| | | For the 12 months ended December 31, | |
| | | 2007(1) | | | 2008(1) | | | 2009(1) | | | 2010(1) | | | 2011(1) | |
| | | | | |
Government consumption | | | 9,682 | | | | 11,352 | | | | 13,194 | | | | 15,388 | | | | 17,149 | |
Private consumption | | | 66,038 | | | | 81,275 | | | | 83,177 | | | | 95,253 | | | | 107,444 | |
| | | | | |
Gross investment | | | | | | | | | | | | | | | | | | | | |
Public sector | | | 3,365 | | | | 5,317 | | | | 6,698 | | | | 9,131 | | | | 8,079 | |
Private sector | | | 19,511 | | | | 27,375 | | | | 22,397 | | | | 29,512 | | | | 34,613 | |
Change in inventories | | | 1,675 | | | | 1,481 | | | | (2,739 | ) | | | 458 | | | | 2,507 | |
| | | | | | | | | | | | | | | | | | | | |
Total gross investment | | | 24,552 | | | | 34,173 | | | | 26,356 | | | | 39,101 | | | | 45,199 | |
| | | | | |
Exports of goods and services | | | 31,265 | | | | 34,725 | | | | 30,608 | | | | 39,274 | | | | 50,693 | |
Imports of goods and services | | | 24,094 | | | | 34,409 | | | | 25,965 | | | | 35,080 | | | | 43,757 | |
| | | | | | | | | | | | | | | | | | | | |
Net (exports) | | | 7,171 | | | | 316 | | | | 4,643 | | | | 4,193 | | | | 6,936 | |
| | | | | |
GDP | | | 107,443 | | | | 127,115 | | | | 127,370 | | | | 153,395 | | | | 176,728 | |
Source: Central Bank.
Gross Domestic Product by Expenditure
(in millions of nuevos soles, at constant 1994 prices)
| | | | | | | | | | | | | | | | | | | | |
| | | For the 12 months ended December 31, | |
| | | 2007(1) | | | 2008(1) | | | 2009(1) | | | 2010(1) | | | 2011(1) | |
| | | | | |
Government consumption | | | 15,220 | | | | 15,536 | | | | 18,095 | | | | 19,626 | | | | 20,579 | |
Private consumption | | | 118,618 | | | | 128,961 | | | | 131,992 | | | | 139,887 | | | | 148,780 | |
| | | | | |
Gross investment | | | | | | | | | | | | | | | | | | | | |
Public sector | | | 5,829 | | | | 8,324 | | | | 10,307 | | | | 13,121 | | | | 10,879 | |
Private sector | | | 34,547 | | | | 43,483 | | | | 36,918 | | | | 45,067 | | | | 50,347 | |
Change in inventories | | | 2,610 | | | | 2,288 | | | | (4,250 | ) | | | 661 | | | | 3,482 | |
| | | | | | | | | | | | | | | | | | | | |
Total gross investment | | | 42,987 | | | | 54,094 | | | | 42,974 | | | | 58,849 | | | | 64,707 | |
| | | | | |
Exports of goods and services | | | 35,017 | | | | 37,874 | | | | 36,678 | | | | 37,152 | | | | 40,410 | |
Imports of goods and services | | | 37,432 | | | | 44,960 | | | | 36,584 | | | | 45,371 | | | | 49,801 | |
| | | | | | | | | | | | | | | | | | | | |
Net (exports) | | | (2,415 | ) | | | (7,086 | ) | | | 94 | | | | (8,219 | ) | | | (9,391 | ) |
| | | | | |
GDP | | | 174,407 | | | | 191,505 | | | | 193,155 | | | | 210,143 | | | | 224,669 | |
Source: Central Bank.
From 2007 to 2011, public savings increased due to increased tax collections. However, in 2009, public savings reached 4.6% of GDP, primarily due to the decrease in tax revenues. In 2010 and 2011, public savings reached 6.0% and 7.1% of GDP, respectively, due to an increase in current revenues. In 2009, private savings represented 16.3% of GDP, compared to 16.0% of GDP in 2008. In 2010 and 2011, private savings represented 17.7% and 17.2% of GDP, respectively.
From 2007 to 2011, domestic savings as a percentage or GDP increased from 24.2% to 24.3% of GDP, due to an increase in both private and public savings, reflecting improvement in the economic factors discussed above. In 2009, domestic savings decreased to 20.9% of GDP from 22.7% of GDP in 2008, due to an increase in public consumption. During 2010, domestic savings were 23.7% of GDP, an increase compared to the 20.9% for 2009. In 2011 domestic savings were 24.3% of GDP, an increase compared to the 23.7% recorded for 2010.
External savings, as a percentage of GDP, increased from a contraction of 1.4% in 2007 compared to 2006, to 1.3% in 2011, reflecting a decrease in the need for external savings to finance investments, due to a recovery in domestic investments and public savings.
Domestic investment as a percentage of GDP increased from 22.8% in 2007 to 25.6% in 2011, showing an increase in private and public investment (except for a 6.2% decrease in 2009; from 26.9% of GDP in 2008 to 20.7% in 2009 as a result of the decrease in private investment, which decreased to U.S.$22.4 billion, compared to 2008, which was U.S.$27.4 billion), which flowed mainly into mining projects, the Camisea gas project, the construction of new plants and the expansion of existing ones in the cement, food, electricity and hotel industries. This dynamism was the result of the natural increase of supply as domestic demand increased driven by economic growth.
31
Gross Domestic Product by Expenditure
(as a percentage of total GDP, at current prices)
| | | | | | | | | | | | | | | | | | | | |
| | | For the 12 months ended December 31, | |
| | | 2007(1) | | | 2008(1) | | | 2009(1) | | | 2010(1) | | | 2011(1) | |
| | | | | |
Government consumption | | | 9.0 | | | | 9.0 | | | | 10.3 | | | | 10.0 | | | | 9.7 | |
Private consumption | | | 61.5 | | | | 64.0 | | | | 65.4 | | | | 61.9 | | | | 60.8 | |
| | | | | |
Gross investment | | | | | | | | | | | | | | | | | | | | |
Public sector | | | 3.1 | | | | 4.2 | | | | 5.2 | | | | 5.9 | | | | 4.6 | |
Private sector | | | 18.2 | | | | 21.5 | | | | 17.7 | | | | 19.2 | | | | 19.6 | |
Change in inventories | | | 1.6 | | | | 1.1 | | | | (2.1 | ) | | | 0.3 | | | | 1.4 | |
| | | | | | | | | | | | | | | | | | | | |
Total gross investment | | | 22.8 | | | | 26.9 | | | | 20.7 | | | | 25.4 | | | | 25.6 | |
| | | | | |
Exports of goods and services | | | 29.1 | | | | 27.3 | | | | 24.0 | | | | 25.5 | | | | 28.7 | |
Imports of goods and services | | | 22.4 | | | | 27.1 | | | | 20.4 | | | | 22.8 | | | | 24.8 | |
| | | | | | | | | | | | | | | | | | | | |
Net (exports) | | | 6.7 | | | | 0.2 | | | | 3.6 | | | | 2.7 | | | | 3.9 | |
| | | | | |
GDP | | | 100.0 | | | | 100.0 | | | | 100.0 | | | | 100.0 | | | | 100 | |
Source: Central Bank.
Gross Domestic Product by Expenditure
(percentage change from previous period, at constant 1994 prices)
| | | | | | | | | | | | | | | | | | | | |
| | | For the 12 months ended December 31, | |
| | | 2007(1) | | | 2008(1) | | | 2009(1) | | | 2010(1) | | | 2011(1) | |
Government consumption | | | 4.5 | | | | 2.1 | | | | 16.5 | | | | 8.5 | | | | 4.9 | |
Private consumption | | | 8.3 | | | | 8.7 | | | | 2.4 | | | | 6.0 | | | | 6.4 | |
| | | | | |
Gross investment | | | | | | | | | | | | | | | | | | | | |
Public sector | | | 23.3 | | | | 25.9 | | | | 21.2 | | | | 27.3 | | | | (17.1 | ) |
Private sector | | | 18.2 | | | | 42.8 | | | | (15.1 | ) | | | 22.1 | | | | 11.7 | |
Change in inventories | | | 111.0 | | | | (12.4 | ) | | | (285.8 | ) | | | 115.6 | | | | 426.5 | |
Total gross investment | | | 25.8 | | | | 25.8 | | | | (20.6 | ) | | | 36.9 | | | | 10.0 | |
| | | | | | | | | | | | | | | | | | | | |
| | | | | |
Exports of goods and services | | | 6.9 | | | | 8.2 | | | | (3.2 | ) | | | 1.3 | | | | 8.8 | |
Imports of goods and services | | | 21.4 | | | | 20.1 | | | | (18.6 | ) | | | 24.0 | | | | 9.8 | |
| | | | | | | | | | | | | | | | | | | | |
Net (exports) | | | (225.4 | ) | | | (193.4 | ) | | | 1.3 | | | | (8,818.9 | ) | | | (14.3 | ) |
| | | | | |
GDP | | | 8.9 | | | | 9.8 | | | | 0.9 | | | | 8.8 | | | | 6.9 | |
Source: Central Bank.
Investment and Savings
(as a percentage of current GDP)
| | | | | | | | | | | | | | | | | | | | |
| | | For the 12 months ended December 31, | |
| | | 2007(1) | | | 2008(1) | | | 2009(1) | | | 2010(1) | | | 2011(1) | |
Domestic savings: | | | | | | | | | | | | | | | | | | | | |
Public savings | | | 6.4 | | | | 6.7 | | | | 4.6 | | | | 6.0 | | | | 7.1 | |
Private savings | | | 17.8 | | | | 16.0 | | | | 16.3 | | | | 17.7 | | | | 17.2 | |
| | | | | | | | | | | | | | | | | | | | |
Total domestic savings | | | 24.2 | | | | 22.7 | | | | 20.9 | | | | 23.7 | | | | 24.3 | |
| | | | | |
External savings | | | (1.4 | ) | | | 4.2 | | | | (0.2 | ) | | | 1.7 | | | | 1.3 | |
Total savings | | | 22.8 | | | | 26.9 | | | | 20.7 | | | | 25.4 | | | | 25.6 | |
| | | | | | | | | | | | | | | | | | | | |
Domestic investment | | | 22.8 | | | | 26.9 | | | | 20.7 | | | | 25.4 | | | | 25.6 | |
Source: Central Bank.
32
As indicated in the table “Per Capita GDP”, the standard of living of the Peruvian population continually increased from 2007 to 2011. Per capita GDP rose from U.S.$3,772 in 2007 to U.S.$5,932 in 2011 due to increased commercial activity and greater access to employment, reflected in the growth of exports, and continued increases in domestic demand. During 2009, per capita GDP decreased 0.9% due primarily to the slowdown in the economy caused by the international financial crisis. In 2010 and 2011, per capita GDP increased 19.5% and 13.5%, respectively.
Per Capita GDP(1)
(in U.S. dollars, at current prices)
| | | | | | | | | | | | | | | | | | | | |
| | | 2007(2) | | | 2008(2) | | | 2009(2) | | | 2010(2) | | | 2011(2) | |
Per capita GDP | | | 3,772.3 | | | | 4,412.7 | | | | 4,372.2 | | | | 5,225.1 | | | | 5,931.9 | |
| (1) | Without adjustment to reflect changes in purchasing power. |
Source: Central Bank.
Principal Sectors of the Economy
The principal economic activities in Peru are services (including wholesale and retail trade, transportation and tourism), manufacturing, agriculture and livestock, and mining and hydrocarbons.
Gross Domestic Product by Sector
(in millions of nuevos soles, at constant 1994 prices)
| | | | | | | | | | | | | | | | | | | | |
| | | For the 12 months ended December 31, | |
| | | 2007(1) | | | 2008(1) | | | 2009(1) | | | 2010(1) | | | 2011(1) | |
Primary production: | | | | | | | | | | | | | | | | | | | | |
Agriculture and livestock(2) | | | 13,718 | | | | 14,712 | | | | 15,050 | | | | 15,695 | | | | 16,288 | |
Fishing | | | 879 | | | | 934 | | | | 861 | | | | 719 | | | | 933 | |
Mining and hydrocarbons(3) | | | 10,196 | | | | 10,974 | | | | 11,040 | | | | 11,023 | | | | 11,000 | |
| | | | | | | | | | | | | | | | | | | | |
Total primary production | | | 24,793 | | | | 26,620 | | | | 26,950 | | | | 27, 437 | | | | 28,220 | |
| | | | | |
Secondary production: | | | | | | | | | | | | | | | | | | | | |
Manufacturing | | | 27,328 | | | | 29,804 | | | | 27,672 | | | | 31,440 | | | | 33,193 | |
Construction | | | 9,737 | | | | 11,340 | | | | 12,037 | | | | 14,135 | | | | 14,620 | |
Electricity and water | | | 3,585 | | | | 3,866 | | | | 3,912 | | | | 4,213 | | | | 4,525 | |
| | | | | | | | | | | | | | | | | | | | |
Total secondary production | | | 40,650 | | | | 45,010 | | | | 43,621 | | | | 49,788 | | | | 52,338 | |
| | | | | |
Services: | | | | | | | | | | | | | | | | | | | | |
Wholesale and retail trade | | | 25,495 | | | | 28,808 | | | | 28,693 | | | | 31,473 | | | | 34,251 | |
Other services(4) | | | 83,469 | | | | 91,067 | | | | 93,890 | | | | 101,444 | | | | 109,860 | |
| | | | | | | | | | | | | | | | | | | | |
Total services | | | 108,964 | | | | 119,875 | | | | 122,584 | | | | 132,917 | | | | 144,111 | |
| | | | | |
Total GDP | | | 174,407 | | | | 191,505 | | | | 193,155 | | | | 210,143 | | | | 224,669 | |
| (3) | Includes non-metallic mining. |
| (4) | Includes taxes on products and import duties. |
Source: Central Bank.
The following tables show the distribution of GDP in the Peruvian economy, indicating the percentage contribution to GDP and the growth rate for the periods shown for each sector, in each case compared to the previous corresponding period.
33
Gross Domestic Product by Sector
(as a percentage of GDP, at constant 1994 prices)
| | | | | | | | | | | | | | | | | | | | |
| | | For the 12 months ended December 31, | |
| | | 2007(1) | | | 2008(1) | | | 2009(1) | | | 2010(1) | | | 2011(1) | |
Primary production: | | | | | | | | | | | | | | | | | | | | |
Agriculture and livestock(2) | | | 7.9 | | | | 7.7 | | | | 7.8 | | | | 7.5 | | | | 7.2 | |
Fishing | | | 0.5 | | | | 0.5 | | | | 0.4 | | | | 0.3 | | | | 0.4 | |
Mining and hydrocarbons(3) | | | 5.8 | | | | 5.7 | | | | 5.7 | | | | 5.2 | | | | 4.9 | |
| | | | | | | | | | | | | | | | | | | | |
Total primary production | | | 14.2 | | | | 13.9 | | | | 14.0 | | | | 13.1 | | | | 12.6 | |
| | | | | |
Secondary production: | | | | | | | | | | | | | | | | | | | | |
Manufacturing | | | 15.7 | | | | 15.6 | | | | 14.3 | | | | 15.0 | | | | 14.8 | |
Construction | | | 5.6 | | | | 5.9 | | | | 6.2 | | | | 6.7 | | | | 6.5 | |
Electricity and water | | | 2.1 | | | | 2.0 | | | | 2.0 | | | | 2.0 | | | | 2.0 | |
| | | | | | | | | | | | | | | | | | | | |
Total secondary production | | | 23.3 | | | | 23.5 | | | | 22.6 | | | | 23.7 | | | | 23.3 | |
| | | | | |
Services: | | | | | | | | | | | | | | | | | | | | |
Wholesale and retail trade | | | 14.6 | | | | 15.0 | | | | 14.9 | | | | 15.0 | | | | 15.2 | |
Other services(4) | | | 47.9 | | | | 47.6 | | | | 48.6 | | | | 48.3 | | | | 48.9 | |
| | | | | | | | | | | | | | | | | | | | |
Total services | | | 62.5 | | | | 62.6 | | | | 63.5 | | | | 63.3 | | | | 64.1 | |
| | | | | |
Total GDP | | | 100.0 | | | | 100.0 | | | | 100.0 | | | | 100.0 | | | | 100.0 | |
| (3) | Includes non-metallic mining. |
| (4) | Includes taxes on products and import duties. |
Source: Central Bank.
Gross Domestic Product by Sector
(percentage change from previous period, at constant 1994 prices)
| | | | | | | | | | | | | | | | | | | | |
| | | For the 12 months ended December 31, | |
| | | 2007(1) | | | 2008(1) | | | 2009(1) | | | 2010(1) | | | 2011(1) | |
Primary production: | | | | | | | | | | | | | | | | | | | | |
Agriculture and livestock(2) | | | 3.2 | | | | 7.2 | | | | 2.3 | | | | 4.3 | | | | 3.8 | |
Fishing | | | 6.9 | | | | 6.3 | | | | (7.9 | ) | | | (16.4 | ) | | | 29.7 | |
Mining and hydrocarbons(3) | | | 2.7 | | | | 7.6 | | | | 0.6 | | | | (0.1 | ) | | | (0.2 | ) |
| | | | | | | | | | | | | | | | | | | | |
Total primary production | | | 3.2 | | | | 7.4 | | | | 1.2 | | | | 1.8 | | | | 2.9 | |
| | | | | |
Secondary production: | | | | | | | | | | | | | | | | | | | | |
Manufacturing | | | 11.1 | | | | 9.1 | | | | (7.2 | ) | | | 13.6 | | | | 5.6 | |
Construction | | | 16.6 | | | | 16.5 | | | | 6.1 | | | | 17.4 | | | | 3.4 | |
Electricity and water | | | 8.4 | | | | 7.8 | | | | 1.2 | | | | 7.7 | | | | 7.4 | |
| | | | | | | | | | | | | | | | | | | | |
Total secondary production | | | 12.1 | | | | 10.7 | | | | (3.1 | ) | | | 14.1 | | | | 5.1 | |
| | | | | |
Services: | | | | | | | | | | | | | | | | | | | | |
Wholesale and retail trade | | | 9.7 | | | | 13.0 | | | | (0.4 | ) | | | 9.7 | | | | 8.8 | |
Other services(4) | | | 9.0 | | | | 9.1 | | | | 3.1 | | | | 8.0 | | | | 8.3 | |
| | | | | | | | | | | | | | | | | | | | |
Total services | | | 9.1 | | | | 10.0 | | | | 2.3 | | | | 8.4 | | | | 8.4 | |
| | | | | |
Total GDP | | | 8.9 | | | | 9.8 | | | | 0.9 | | | | 8.8 | | | | 6.9 | |
| (3) | Includes non-metallic mining. |
| (4) | Includes taxes on products and import duties. |
Source: Central Bank.
In 2010, GDP grew 8.8%, compared to 2009, due to increased activity in the non-primary sectors, principally non-primary manufacture, construction and commerce. The 13.6% rate of grow in the manufacturing sector was due to an expansion in the production for internal consumption. The 17.4% rate of growth in the construction sector during 2010 was primarily due to an increase in private and public constructions, including the construction of the electric train and the expansion of national highways.
34
During 2011, GDP grew 6.9%, compared to 2010, principally driven by increased activity in the fishing and agriculture and in the services sector. GDP growth was reduced during 2011 compared to 2010 due to increased volatility in the economy as a result of the uncertainty generated by the presidential elections held during 2011 and fear of a downturn in the international economy that affected investment.
Primary Production
During 2010, primary production grew 1.8%, 0.6 percentage points more than during 2009, due to production related to fishing and mining sectors. In 2011, primary production grew 2.9%, 1.0 percentage points higher than in 2010, due to production related to fishing, agriculture and livestock sectors.
Primary production in Peru comprises agriculture and livestock, forestry, fishing, mining and hydrocarbon extraction. Of these, the most important activities in terms of their contribution to GDP are agriculture and livestock, which, together with forestry, accounted for 7.5% and 7.2% of GDP in 2010 and 2011, respectively. In total, the primary sector contributed 13.1% and 12.6% to GDP in 2010 and 2011, respectively.
The following table presents the production of selected primary goods for the periods shown.
Selected Primary Goods Production
(in million of nuevos soles, at constant 1994 prices)
| | | | | | | | | | | | | | | | | | | | |
| | | For the 12 months ended December 31, | |
| | | 2007(1) | | | 2008(1) | | | 2009(1) | | | 2010(1) | | | 2011(1) | |
Agriculture: | | | | | | | | | | | | | | | | | | | | |
Cotton | | | 345 | | | | 268 | | | | 154 | | | | 102 | | | | 189 | |
Rice | | | 876 | | | | 1,005 | | | | 1,076 | | | | 1,018 | | | | 942 | |
Coffee | | | 724 | | | | 877 | | | | 780 | | | | 848 | | | | 979 | |
Sugar cane | | | 559 | | | | 638 | | | | 675 | | | | 656 | | | | 671 | |
Corn | | | 771 | | | | 835 | | | | 887 | | | | 878 | | | | 841 | |
Potato | | | 1,365 | | | | 1,451 | | | | 1,519 | | | | 1,535 | | | | 1,633 | |
Wheat | | | 182 | | | | 196 | | | | 223 | | | | 222 | | | | 214 | |
Vegetables | | | 1,119 | | | | 1,183 | | | | 1,164 | | | | 1,252 | | | | 1,329 | |
Fruits | | | 1,406 | | | | 1,470 | | | | 1,481 | | | | 1,682 | | | | 1,710 | |
Tubers | | | 511 | | | | 517 | | | | 539 | | | | 558 | | | | 534 | |
Other agricultural(2) | | | 2,703 | | | | 2,893 | | | | 2,933 | | | | 3,159 | | | | 3,228 | |
| | | | | | | | | | | | | | | | | | | | |
Total crops | | | 10,561 | | | | 11,335 | | | | 11,432 | | | | 11,911 | | | | 12,270 | |
| | | | | |
Livestock: | | | | | | | | | | | | | | | | | | | | |
Poultry | | | 2,933 | | | | 3,339 | | | | 3,671 | | | | 3,883 | | | | 4,152 | |
Eggs | | | 541 | | | | 560 | | | | 564 | | | | 599 | | | | 664 | |
Milk | | | 801 | | | | 794 | | | | 838 | | | | 865 | | | | 881 | |
Lamb | | | 413 | | | | 407 | | | | 408 | | | | 413 | | | | 416 | |
Pork | | | 528 | | | | 531 | | | | 529 | | | | 530 | | | | 540 | |
Beef | | | 1,416 | | | | 1,416 | | | | 1,428 | | | | 1,491 | | | | 1,544 | |
Other(2) | | | 463 | | | | 472 | | | | 494 | | | | 503 | | | | 518 | |
| | | | | | | | | | | | | | | | | | | | |
Total Livestock | | | 7,094 | | | | 7,519 | | | | 7,933 | | | | 8,285 | | | | 8,715 | |
| | | | | |
Fishing | | | 879 | | | | 934 | | | | 861 | | | | 718 | | | | 926 | |
| (2) | Includes secondary production. |
Source: Production Ministry.
Agriculture and Livestock
The Peruvian agriculture and livestock sector is dominated by small-scale producers. The sector represented 8.9% and 9.7% of total exports in 2010 and 2011. Approximately 16.8% of Peru’s land area is devoted to arable production and permanent crops. Subsistence farming predominates and productivity is low due to drainage and salinity problems, although productivity increased during the 1990s. The agriculture and livestock sector grew less than GDP in recent years, except in 2009, where its contribution to GDP increased from 7.7% in 2008 to 7.8% in 2009, and decreased to 7.5% in 2010 and to 7.2% in 2011.
35
Peru’s main agricultural products are potatoes, corn, rice, coffee, sugar cane and vegetables, which together accounted for approximately 52.1% of agricultural production in 2011. Peru’s traditional agricultural products include cotton, sugar, coffee and rice. Agricultural production has increasingly focused on non-traditional export products destined primarily for the winter markets of Europe and the United States. The northern coast of Peru is the main area for cultivation of non-traditional export crops such as asparagus, mangos, passion fruit and oranges. Animal husbandry—sheep, poultry and cattle—is predominant in the south.
Peru’s main agricultural export products are coffee, cotton and sugar, which together accounted for approximately 97.8% of agricultural traditional exports in 2011. Other important export crops include cochineal, cocoa, carmine and marigold flour. In recent years, production of fruit, particularly mangos, grapes and avocado, for the export market has increased. Cotton, rice and sugar are produced for both the domestic and the export markets.
The following table provides the annual percentage change in the production of selected primary goods for the periods shown.
Selected Primary Goods Production
(percentage change from previous period, at constant 1994 prices)
| | | | | | | | | | | | | | | | | | | | |
| | | For the 12 months ended December 31, | |
| | | 2007(1) | | | 2008(1) | | | 2009(1) | | | 2010(1) | | | 2011(1) | |
Agriculture: | | | | | | | | | | | | | | | | | | | | |
Cotton | | | 1.0 | | | | (22.3 | ) | | | (42.7 | ) | | | (33.3 | ) | | | 84.7 | |
Rice | | | 3.0 | | | | 14.7 | | | | 7.1 | | | | (5.5 | ) | | | (7.4 | ) |
Coffee | | | (17.3 | ) | | | 21.1 | | | | (11.1 | ) | | | 8.7 | | | | 15.4 | |
Sugar cane | | | 13.6 | | | | 14.2 | | | | 5.8 | | | | (2.8 | ) | | | 2.3 | |
Corn | | | 3.7 | | | | 8.4 | | | | 6.2 | | | | (1.0 | ) | | | (4.2 | ) |
Potato | | | 4.1 | | | | 6.3 | | | | 4.7 | | | | 1.1 | | | | 6.4 | |
Wheat | | | (4.9 | ) | | | 8.0 | | | | 13.7 | | | | (0.5 | ) | | | (3.5 | ) |
Vegetables | | | 8.0 | | | | 5.6 | | | | (1.6 | ) | | | 7.6 | | | | 6.1 | |
Fruits | | | (0.2 | ) | | | 4.6 | | | | 0.7 | | | | 13.5 | | | | 1.7 | |
Tubers | | | 1.4 | | | | 1.3 | | | | 4.2 | | | | 3.5 | | | | (4.4 | ) |
Other agricultural(2) | | | 4.0 | | | | 7.0 | | | | 1.4 | | | | 7.7 | | | | 2.2 | |
| | | | | | | | | | | | | | | | | | | | |
Total crops | | | 2.0 | | | | 7.3 | | | | 0.9 | | | | 4.2 | | | | 3.0 | |
| | | | | |
Livestock: | | | | | | | | | | | | | | | | | | | | |
Poultry | | | 8.4 | | | | 13.9 | | | | 9.9 | | | | 5.8 | | | | 6.9 | |
Eggs | | | 5.0 | | | | 3.5 | | | | 0.8 | | | | 6.1 | | | | 10.9 | |
Milk | | | 6.5 | | | | (0.9 | ) | | | 5.5 | | | | 3.3 | | | | 1.8 | |
Lamb | | | (0.2 | ) | | | (1.4 | ) | | | 0.3 | | | | 1.2 | | | | 0.8 | |
Pork | | | 5.4 | | | | 0.6 | | | | (0.4 | ) | | | 0.2 | | | | 1.9 | |
Beef | | | 0.4 | | | | 0.1 | | | | 0.8 | | | | 4.4 | | | | 3.5 | |
Other | | | 4.6 | | | | 1.9 | | | | 4.8 | | | | 1.9 | | | | 2.9 | |
| | | | | | | | | | | | | | | | | | | | |
Total Livestock(2) | | | 5.3 | | | | 6.0 | | | | 5.5 | | | | 4.4 | | | | 5.2 | |
| | | | | |
Fishing | | | 6.9 | | | | 6.3 | | | | (7.9 | ) | | | (16.6 | ) | | | 29.0 | |
| (2) | Includes secondary production. |
Source: Ministry of Production and MINAG.
In 2007, the agriculture and livestock sector grew 3.2% due to moderate growth in the agricultural sector as a consequence of favorable climate conditions. The exception was the forest, where unfavorable climate affected coffee production. Livestock production also contributed to growth in this sector, favored by increases in poultry, pork and milk production.
The Government has supported an agricultural development program that eliminated the tariff on agricultural machinery, equipment and raw materials in 2007, from 12.0% in 2005. Accordingly, in December 2006 tariffs on all capital goods, including agricultural machinery, were reduced by different degrees, which resulted in a decrease in the average tariff from 10.1% to 8.3%. In October 2007, the Government announced further tariff reductions, which resulted in a 5.0% average tariff and a 2.1% effective tariff.
36
The García administration sought to improve the income of the rural population by providing more access to credit and funds for technical support and to promote reforestation and the processing of agricultural products, among other measures.
During 2008, the agriculture and livestock sector grew at a rate of 7.2%, compared to 3.2% in 2007, due primarily to increased prices and higher external demand which produced growth in production oriented to industry and export. The highest growth was observed in production of olives, coffee and asparagus for export and production of sugar cane and corn to supply the sugar and aviculture industries, respectively.
In 2009, the agriculture and livestock sector grew by 2.3%. The agriculture and livestock sector grew more than GDP in 2009, increasing its contribution to GDP from 7.7% in 2008 to 7.8% in 2009. The expansion in the agriculture and livestock sector during 2009 was the result of increased production of meat products, milk, and certain traditional agricultural products, including potatoes, rice, sugar cane, corn and grapes, each of which recorded historic volumes of production in response to increased domestic demand. The livestock industry grew more than the agricultural industry, as a result of the increased production of poultry, beef and lamb and the slight increase in the production of eggs.
In 2010, the agriculture and livestock sector grew by 4.3%, contributing 7.5% to the GDP in 2010. The expansion in the agriculture and livestock sector in 2010 was the result of increased production of traditional export products, such as coffee, olive, mango, cacao and asparagus, an increased production of agricultural products for internal consumption, including onion, tangerine, banana and lemon and an increased production in the poultry sector due to increased production of poultry, beef, lamb, pork, fresh milk and eggs.
In 2011, the agriculture and livestock sector grew by 3.8%, contributing 7.2% to GDP in 2011. The expansion in the agriculture and livestock sector during 2011 was driven primarily by an increase in the production of products such as potatoes, asparagus, palm oil, coffee and citrus.
The Humala administration policies seek to reduce the competitiveness gaps of the agricultural productive structure of Peru, contributing to decrease the poverty levels of the rural population. The policies also pursue to adapt the current agricultural structure to the new escenarios generated by local and international economic and social factors and the effects of weather changes.
The agricultural sector strategy seeks to ensure the supply of food to the population and contribute to the national economic growth of employment and foreign exchange, in order to achieve the macroeconomic stability of Peru. The role of the agriculture sector trascends the three levels of the government (national, regional and local governments), based in a sectorial plan of agricultural development that guides its intervention in the whole territory of Peru.
Fishing
Fishing is a small part of the Peruvian economy, contributing 0.4% to GDP in 2011. Fish products, however, are Peru’s second leading export after mining, accounting for 6.8% of exports in 2011, considering both traditional (fish meal and fish oil) and non-traditional exports (frozen crustaceans and mollusks, frozen fish, and preparations and canned food).
In the late 1960s, Peru was the world’s leading fishing nation. Its importance as a leading exporter of fishmeal declined during the 1970s and early 1980s due to ecological factors and over-fishing. Peru has since recovered its position as one of the world’s leading fishmeal producers and exporters.
Peru’s fish-processing industry consists primarily of the processing of anchovies into fishmeal. The industry has suffered frequently from the destruction of fish stocks caused by changes in oceanographic conditions. The Government, from time to time, imposes seasonal fishing bans based on factors such as marine wildlife conditions and fish processing capacity. Although these bans limit fishing extraction, their adverse impact on fishing production is outweighed by the increased stock of protected species.
37
During 2007, the fishing sector grew 6.9%. Activity in the fishing sector increased mainly as a result of industrial fishing of anchovy. However, unusually low temperatures were observed (anomalies included temperature drops of up to –2 °C in Ilo in the third quarter of the year), which dispersed fish away from their traditional areas, thus lowering fishing yield.
During 2008, the fishing sector grew 6.3% due to an increase in production fishing products for human consumption, primarily in species alternative to mackerel (jurel) such as bonito, white mullet (liza) and perico and industrial fishing of anchovies to produce fishmeal. Fishing activity for frozen and canned food increased due to higher catches of giant squid and anchovies, respectively. In 2008, giant squid catches reached the maximum level ever registered in Peru.
In June 2008, the fishing sector regulatory structure was changed from a global quota system to an individual fishing quotas system, in order to allow efficient investing in the sector.
In 2009, the fishing sector declined by 7.9%, mainly due to a decrease in fish catch for frozen fish products (a non-traditional export), such as scad, snails, tuna, hake, and shellfish. In addition, there was a decrease in the fish catch for canned products (a non-traditional export) during 2009. These decreases were partially offset by an increase in the fish catch for fresh consumption, which resulted from the increased availability of squid, mackerel, hake, and other species. The capture of anchovies for industrial consumption (including the production of fishmeal and fish oil, both traditional exports) decreased compared to 2008, despite a longer fishing season in 2009 (98 days compared to 47 days in 2008), due to unfavorable changes in sea surface temperature.
In 2010, the fishing sector declined by 16.6%, mainly due to a decrease in fish catch for indirect and direct human consumption. Anchovy catches for industrial consumption reached 3,321 million tons, 42.84% less than 2009. In addition, catches of fish species for direct human consumption decreased, due to less availability of fresh fish species, as well as fish catches for frozen food. However, fish catches for preparation of canned fish increased. During 2010, fishing off-season days reached 231, compared to 207 off-season days in 2009.
In 2011, the fishing sector grew 29.7%, mainly due to an increase of 110% in fish catch for industrial consumption and 17.4% for human consumption. The production of frozen and canned fish increased by 20.3% and 2.0%, respectively, in each case compared to 2010.
Mining and Hydrocarbons
The mining and hydrocarbons sector grew 2.7% in 2007, compared to growth of 1.4% in 2006, as a result of a decreased gold production. Yanacocha’s lower gold production affected the growth rate of the sector in 2007. However, Cerro Verde’s copper mine expansion reduced the effect of lower gold output in 2007. In 2008, the sector grew 7.6% mainly due to operations from the copper mines at Cerro Verde, Antamina and Cerro Corona. In 2009, the sector grew 0.6% due to increased hydrocarbons extraction resulting from the start of operations of deposits at Pagoreni block 56 and Cashiriari block 88. The financial crisis had a negative impact in the mining sector after 18 years of permanent increase. Production of zinc, iron, lead, tin and molybdenum decreased. Nonetheless, production of copper, silver, liquid hydrocarbons and natural gas reached record levels.
During 2010, the mining and hydrocarbons sector decreased 0.1% compared to 2009 despite the production of hydrocarbons that was offset by reduced production of gold, zinc and copper. In 2011, the mining and hydrocarbons sector decreased 0.20% compared to 2010, as a result of a decrease in the production of silver, zinc and lead, partially offset by an increase in the production of molybdenum, copper, iron and natural gas.
Mining. Peru is a leading producer in Latin America of gold, silver, tin, copper, lead and zinc. Although mining constitutes a small part of the country’s GDP, contributing on average 4.4% of GDP between 2007 to 2011. Mineral products are Peru’s main exports, accounting for 59.1% of total exports by value in 2011. Gold and copper accounted for 28.2% (U.S.$10.1 billion) and 29.9% (U.S.$10.7 billion) of total exports by value, respectively, during 2011. In addition, copper accounted for 39.1% of total mining exports in 2011.
38
Between 2007 and 2011, investment in the mining sub-sector totaled approximately U.S.$17.0 billion, with an average annual investment of U.S.$3.4 billion. Investments during 2007, 2008, 2009, 2010 and 2011 were U.S.$1.2 billion, U.S.$1.7 billion, U.S.$2.8 billion, U.S.$4.1 billion and U.S.$7.2 billion, respectively. The most important projects during the period from 2007 through 2011 were:
| | • | | the Antamina copper and zinc project, with investments of U.S.$40.0 million in 2007, U.S.$45.7 million in 2008, U.S.$88.7 million in 2009, U.S.$369.0 million in 2010 and U.S.$640.3 million in 2011; |
| | • | | development of the Alto Chicama gold mine with investments of U.S.$53.2 million in 2007, U.S.$25.7 million in 2008, U.S.$30.8 million in 2009, U.S.$73.0 million in 2010 and U.S.$145 million in 2011; |
| | • | | the expansion of the Cuajone and Toquepala copper projects, with investments of U.S.$275.8 million in 2007, U.S.$302.5 million in 2008, U.S.$434.8 million in 2009, U.S.$267.9 million in 2010 and U.S.$206.1 million in 2011; |
| | • | | the expansion of the Yanacocha gold project, with investments of U.S.$290.0 million in 2007, U.S.$248.3 million in 2008, U.S.$146.7 million in 2009, U.S.$302.4 million in 2010 and U.S.$1,148.5 million in 2011; and |
| | • | | the expansion of Cerro Verde copper mine, with investments of U.S.$90.9 million in 2009, U.S.$122.3 million in 2010 and U.S.$195.2 million in 2011. The project started commercial production in June 2007. |
Low growth in 2007 in the mining and hydrocarbons sector was due to a lower extraction of gold, mainly as a result of the lower output from Yanacocha that has been operating in deposits with lower mineral contents. This decrease was in part offset by higher production of zinc, due to the expansion of Cerro Verde, and hydrocarbons, due to the improved performance of the Camisea gas field.
In 2008, mining activity grew 7.3% compared to 1.7% in 2007, notwithstanding the adverse impact of lower international commodity prices and the world economic crisis. Growth in metals mining was driven by an increase in zinc, copper and gold production. During 2008, the mining sector received the highest levels of investment, led by Southern Peru Copper Corporation’s investment in the Tía María project and expansion of the Cuajone and Toquepala projects.
During 2009, mining activity decreased 1.4% compared to an increase of 7.3% in 2008. The average price of copper steadily increased from an average of U.S.$1.46 per pound in January 2009 to an average of U.S.$3.17 per pound in December 2009. Peru’s copper production increased by 0.4% during 2009 compared to 2008. The small increase in Peru’s copper production during 2009 was primarily the result of price and demand readjustments, which were a result of the global economic crisis. The recent global economic crisis resulted in a decrease in exports, a decrease in production, the temporary suspension of work at certain mining projects, and a lack of liquidity in certain industries to finance the development and exploration of new projects, all of which have negatively impacted the mining sector.
During 2010, mining activity decreased 4.9% compared to a decrease of 1.4% in 2009; also, mining activity decreased to 4.1% as a percentage of GDP in comparison to 2009, primarily due to a decrease in gold, silver and zinc extraction, partially offset by higher production of iron and molybdenum. During 2010, the mining sector received U.S.$4.0 billion in investments. The production of molybdenum increased due to higher extraction by Antamina, Southern Peru Copper and Sociedad Minera Cerro Verde and the production of iron also increased due to higher extraction by Shougang Hierro Peru S.A.A.
In 2011, mining activity decreased 3.0% compared to a decrease of 4.9% in 2010, primarily due a decrease and exhaustion of the reserves in certain mining projects, the execution of certain expansion constructions and social disruptions in certain mining regions. These factors were partially offset by the commencement of operations of new companies as such as Compañía Minera Coimolach, the Tantahuatay auriferous project and the Colibrí mining project.
39
During the last months of 2011, the northern region of Cajamarca experienced social disruptions, strikes and protests, resulting from the development of Minas Conga, a gold and copper mining project sponsored by Minera Yanacocha SRL. Minas Conga represents an investment of approximately U.S.$4.8 billion, the largest mining investment in the history of Peru. However, local communities have protested the mining development, citing concerns over water contamination and damage to the environment.
In November 2011, the local communities in the region of Cajamarca initiated strikes and protests, blocking highways and disrupting economic activity that they claimed would last until the Government declared the Minas Conga project unviable. Due to the ongoing protests, Minera Yanacocha SRL suspended operations relating to Minas Conga. On December 4, 2011, President Humala declared a state of emergency in the northern region of Cajamarca that persisted for a period of 60 days. On December 16, 2011, the Government lifted the state of emergency as local leaders suspended anti-mining protests and agreed to dialogue with the Government. Since that date, the Government has been negotiating with local authorities in the region of Cajamarca to try to arrive at a peaceful solution that seeks to address the concerns of the local population. As part of the negotiation process, the Government has ordered a review by international experts of the environmental studies in connection with the project.
In April 2012, the international experts submitted their report to Peru, in which they recommended certain amendments to the original project. President Humala announced certain changes to the original project, increasing the water reserves and creating a social fund with the contribution of Minera Yanacocha SRL to guarantee the quality and availability of water. The president of the region of Cajamarca, Gregorio Santos, continues to disagree with the development of the project.
The 2012 forecast by the Comisión Chilena del Cobre, or the Chilean Copper Commission, estimates that the average price of copper will increase to U.S.$3.85 per pound.
Hydrocarbons. The hydrocarbons sub-sector, which encompasses petroleum and natural gas production, currently constitutes a minor part of the Peruvian economy. The petroleum companies in Peru are oriented towards the exploration and development of oil fields located mainly in the Amazon jungle. A major part of Peruvian production consists of heavy crude oil that is primarily exported and light crude oil that is used in local refineries. Petroleum products for industrial and residential use are supplemented with imports. Between 2007 and 2011, petroleum production increased due to an increase in drilling of exploration wells that was triggered in part by a rise in the international prices of petroleum.
As of December 31, 2011, Peru had approximately 16 trillion cubic feet of proven reserves of natural gas, of which approximately 1.0 trillion cubic feet have been developed during the period from 2007 through 2011. In the same period, natural gas production increased approximately 324.5%, from 94.5 billion cubic feet in 2007 to 401.2 billion cubic feet in 2011. This increase was due mainly to developments of the Camisea gas field, which started production in mid-2004, and the expansion of the operations of Pluspetrol Perú Corporation.
Peru’s natural gas reserves are concentrated in the Camisea gas field, which is located approximately 300 miles east of Lima. In February 2000, the Government granted a 40-year operating concession over the Camisea gas field to the private consortium Pluspetrol-Hunt Oil-SK Corporation. Under the concession, the Government receives royalties equal to 37.2% of the profits generated from the project. In October 2000, the Government granted concessions over the distribution and transportation of Camisea’s natural gas to a private consortium led by the Argentine company Techint. The Camisea natural gas project officially went online in the first week of August 2004.
Development of the Camisea gas field contributed, directly and indirectly, an average of approximately 0.6% annually to GDP between 2007 and 2011. The Camisea project, which includes drilling, transporting, processing and selling of natural gas, contributed 95.3% of the natural gas production and 52.1% of the liquid hydrocarbon output in 2011. The Camisea project increased Peru’s production of natural gas by 57%, or 1,099 million cubic feet per day in 2011.
40
On September 7, 2004, Perupetro, Peru’s state-owned hydrocarbons investment company, signed an agreement with a consortium including the members of the Camisea consortium (Pluspetrol-Hunt Oil-SK Corporation), Tecpetrol and Sonatrach, providing for a U.S.$500 million investment in the development of Peru’s block 56 gas field, located northeast of the Camisea development in the Amazon region in central Peru. Block 56, called Pagoreni or Camisea-2, has 3.4 trillion cubic feet of proven gas reserves and 227 million barrels of natural gas liquids. Development of the Pagoreni gas field commenced in June 2005 and when fully operative, production is expected to reach 600 million cubic feet of gas per day, which will be directed to the liquid natural gas plant described below for export to North America. In October 2008, the Pagoneri gas field started production with a total investment of approximately U.S.$872 million. In 2011, Perupetro contributed 53.6% of the natural gas production and 22.9% of the liquid hydrocarbon output in 2011.
In 2003, the project to build and operate a U.S.$3.8 billion liquid natural gas, or LNG, plant, marine loading terminal and gas supply pipeline was granted to Peru LNG, a special purpose vehicle owned by Hunt Oil Company, which owns a majority stake and also is the operator, SK Energy, Repsol YPF and Marubeni. In May 2011, the project was completed. The project produces LNG, from natural gas produced at Camisea blocks 56 and 88 and is exported to Mexico. In 2011, revenues from exports increased to U.S.$1.3 billion. It is projected that revenues from exports will be over U.S.$1.4 billion a year up to 2027.
In 2008, the hydrocarbons sector grew 10.3% compared to 2007, due to high international energy prices and increased production of natural gas (27%) from the Camisea block 88 gas field, as a consequence of increased demand from thermal power plants. Production of liquid hydrocarbons grew 5.7% during 2008, primarily due to the starting of operations at Pluspetrol block 56 gas field, which as of September 2008 produced 17.2 thousand barrels per day (Kbpd). As of December 2008, production of Pluspetrol block 56 gas field reached 34.6 Kbpd.
In 2009, the production of hydrocarbons increased by 16.1%, in large part as a result of continued production at existing projects and new projects starting production, including the increased production of liquid hydrocarbons by Pluspetrol Peru Corporation from the block 56 gas field, which began operations in September 2008 in order to supply Peru LNG’s liquefaction plant in Pampa Melchorita, and the Cashiriari oil field located in block 88, which began production in July 2009. The exploitation of natural gas continues to increase. This permanent increase since 2001 is the result of the development of the natural gas market in the country which results in greater use of natural gas for electricity generation and the increase on the demand for hydrocarbons for vehicle transportation, industrial, commercial and residential consumption.
During 2010, the hydrocarbons sector grew 29.5% compared to 2009, mainly due to the increase in exploitation of natural gas and to a lesser degree to the exploitation of liquid hydrocarbons. The greater use of this resource from May 2010 has been the result of the start of operations of Peru LNG’s liquefaction plant for the processing and export.
In 2011, the hydrocarbons sector grew 18.1% compared to 2010, mainly due to an increase in the production of natural gas which increased 36.9%, partially offset by a decrease to (2.8%) in the production of liquid hydrocarbons.
Secondary Production
Manufacturing
The principal components of the manufacturing sector are:
| | • | | primary manufacturing, consisting principally of: |
| | • | | processing meat products; |
| | • | | producing fishmeal, fish oil and other fish products; |
41
| | • | | refining non-ferrous metals; and |
| | • | | refining petroleum; and |
| | • | | non-primary manufacturing, consisting principally of: |
| | • | | producing food, drinks and tobacco; |
| | • | | producing textiles, leather products and footwear; |
| | • | | producing paper products; |
| | • | | producing chemical, rubber and plastic products; |
| | • | | refining non-metallic minerals; |
| | • | | producing iron and steel; and |
| | • | | manufacturing machinery, equipment and metal products. |
The manufacturing sector grew 11.1% in 2007, and 9.1% in 2008, primarily as a result of the expansion of both internal and external demand. During 2009, the sector contracted 7.2% due to lower domestic and external demand. In 2010, the sector grew 13.6% due to the increase in the non-primary manufacturing activity. In 2011 the sector grew 5.6% due to an increase in primary manufacturing production.
Primary manufacturing. In 2007, primary manufacturing sector decreased 2.7% due to a decrease of 11.2% in production of metals, which was offset by a strong increase in sugar (13.1%) and meat products (6.4%). In 2008, the sector grew 7.6% primarily due to the recovery of the non-ferrous metals refining industry, which grew 9.4% compared to a decrease of 11.2% in 2007. In 2009, the sector grew 0.03%, primarily due to a 27.7% increase of the oil refining industry, a 4.6% growth in production of meat products and a 7.2% growth in production of sugar, partially offset by a 18.0% decrease in non-ferrous metals refining and a 17.4% decrease in production of canned and frozen food.
During 2010, the primary manufacturing sector decreased 2.3%, reflecting the reduction in the production of flour and canned fish, among others. Also, the production of non-ferrous refined metals was reduced mainly attributable to a decrease in foreign demand of gold. Additionally, the production of sugar refineries was reduced as a result of the decrease in the performance of the sugar companies in Lambayaque, Lima and Arequipa.
In 2011, the primary manufacturing sector grew 12.3% due to an increase of 108.9% in fishmeal and fish oil products and 61.1% in canned and frozen fish products, partially offset by a 4.5% decrease in the petroleum refining.
The following table provides information regarding primary manufacturing production for the periods shown.
Primary Manufacturing Production
(percentage change from previous period, at constant 1994 prices)
| | | | | | | | | | | | | | | | | | | | |
| | | For the 12 months ended December 31, | |
| | | 2007(1) | | | 2008(1) | | | 2009(1) | | | 2010(1) | | | 2011(1) | |
| | | | | |
Sugar | | | 13.1 | | | | 10.7 | | | | 7.2 | | | | (4.1 | ) | | | 3.5 | |
Meat products | | | 6.4 | | | | 9.2 | | | | 4.6 | | | | 4.8 | | | | 5.0 | |
Fishmeal and fish oil | | | 4.9 | | | | 0.5 | | | | (4.2 | ) | | | (42.1 | ) | | | 108.9 | |
Canned and frozen fish products | | | 9.0 | | | | 17.6 | | | | (17.4 | ) | | | (17.4 | ) | | | 61.1 | |
Refining of non-ferrous metals | | | (11.2 | ) | | | 9.4 | | | | (18.0 | ) | | | (6.1 | ) | | | 7.4 | |
Petroleum refining | | | 4.2 | | | | 4.1 | | | | 27.7 | | | | 14.2 | | | | (4.5 | ) |
Overall change | | | (2.7 | ) | | | 7.6 | | | | 0.0 | | | | (2.3 | ) | | | 12.3 | |
Source: INEI and Central Bank.
42
Non-primary manufacturing. In 2007, non-primary manufacturing increased 14.0%, primarily as a result of higher private consumption. Strong growth was prevalent in the period in the industrial groups related to massive consumption products, as well as those directed to the construction, mining and agro-export sectors. In 2008, non-primary manufacturing grew 8.9%, consistent with 2007 but at a slower rate than was the case in the fourth quarter of 2008 primarily due to a policy of inventory reduction adopted by a number companies in reaction to the global financial crisis. In 2009, non-primary manufacturing decreased 8.5%, when compared to 2008, mainly due to a decrease in demand for consumer goods (caused by the decrease in foreign demand), intermediate goods, and capital investments and due to the process of inventory reduction in order to meet reduced demand.
In 2010, non-primary manufacturing increased 16.9% compared to 2009, related to the greater production of consumer goods (such as clothes, furniture, textiles, paper and cardboard articles, soaps and detergents, dairy products, vegetal and animal oil, etc.), intermediate goods (such as metal, clay, plastic, chemical and glass, etc.) and capital investments (such as cars, motorcycles, etc.), mainly due to an increase in the production of textiles, rubber and plastic products, iron and steel production, machinery and equipment, metal products, non-metallic chemicals and paper products, primarily as a result of higher domestic and foreign demand.
During 2011, non-primary manufacturing increased 4.4% compared to 2010, primarily as a result of an increase in production of food and drinks, textiles, paper products, plastic products, non-metallic minerals and equipment and metal products, partially offset by a decrease in iron and steel production and other products.
The following table provides information regarding primary manufacturing production for the periods shown.
Non-Primary Manufacturing Production
(percentage change from previous period, at constant 1994 prices)
| | | | | | | | | | | | | | | | | | | | |
| | | For the 12 months ended December 31, | |
| | | 2007(1) | | | 2008(1) | | | 2009(1) | | | 2010(1) | | | 2011(1) | |
| | | | | |
Food, drinks and tobacco | | | 8.8 | | | | 8.4 | | | | 0.4 | | | | 6.8 | | | | 4.4 | |
Textiles, leather products and footwear | | | 6.8 | | | | (6.7 | ) | | | (23.0 | ) | | | 35.2 | | | | 5.0 | |
Paper products | | | 11.6 | | | | 25.1 | | | | (12.3 | ) | | | 18.2 | | | | 7.9 | |
Chemical, rubber and plastic products | | | 12.8 | | | | 7.0 | | | | (8.2 | ) | | | 11.1 | | | | 6.5 | |
Non-metallic minerals | | | 16.0 | | | | 20.5 | | | | (0.6 | ) | | | 20.4 | | | | 5.3 | |
Iron and steel production | | | 8.1 | | | | 9.9 | | | | (21.1 | ) | | | 3.3 | | | | (4.6 | ) |
Equipment and metal products | | | 21.2 | | | | 18.3 | | | | (14.4 | ) | | | 26.6 | | | | 9.1 | |
Other | | | 31.7 | | | | (1.0 | ) | | | (1.6 | ) | | | 3.0 | | | | (10.9 | ) |
Overall change | | | 14.0 | | | | 8.9 | | | | (8.5 | ) | | | 16.9 | | | | 4.4 | |
Source: INEI and Central Bank.
Construction
The construction sector grew 16.6% in 2007, 16.5% in 2008 and 6.1% in 2009. In 2009, 2010 and 2011, the sector contributed 5.6%, 5.9%, 6.2%, respectively, to GDP. The growth in construction during these years is associated with increases in private investment in the housing, mining and manufacturing sectors, as well as in public work projects such as road construction, infrastructure reconstruction and the Government sponsored programs Mivivienda and Techo Propio.
During 2010, the construction sector grew 17.4% and contributed 6.7% to GDP. The growth was mainly due to continued public and private investment in housing projects, commercial malls and offices, as well as private and public infrastructure.
In 2011, the construction sector grew 3.4% and contributed 6.5% to GDP. The growth is associated with a major dynamism in the cities of the interior where the development of infrastructure projects related to tourism, and to the commercial and industrial sector have resulted in substantial levels of growth.
43
Electricity and Water
From 2007 to 2011, the electricity and water sector contributed 2.0% on average to GDP.
Electricity. The electricity sub-sector in Peru was traditionally under control of the public sector until Peru deregulated and privatized the industry in the early 1990s. The deregulation and privatization of the electricity sub-sector included dividing it into production, distribution and transmission segments. The Government initially focused most of its deregulation and privatization efforts in energy production and distribution segments, but gave open access to Peru’s transmission grid. The Government also granted concessions of its transmission lines with the concession of the Mantaro-Socabaya transmission line in 1998 and of its Southern Power Grid in 1999. In 2001, concessions for the construction, maintenance and operation of power lines were granted to La Oroya-Paragsha-Antamina and Aguaytía-Pucallpa. Growth in the electricity sub-sector has resulted primarily from the expansion of the power grid, lower fuel prices and the introduction of more efficient centers to the system.
During 2009 and 2010, the electricity sub-sector has shown signs of reaching its maximum capacity, due to higher electricity consumption than expected, a longer than usual period of drought and having reached the maximum capacity of the natural gas pipelines. In order to avoid power outages the Government has granted incentives for electricity generation projects and has approved the increase of the gas pipelines capacity.
In 2011, the electricity sub-sector grew 8.2%, as a result of the investments such as the construction of the thermoelectric plant by Fenix Power Peru S.A. in Chilca, which is scheduled to start operations in the first quarter of 2013, with a production capacity of 520MWh and that will require a total investment of US$700 million. As a result of higher electricity consumption, Edelnor S.A.A. continued with investments for the extension and maintenance of the electricity distribution network and carried out the sub-transmition investment plan that involves an investment of US$14 million for the construction of transmission substations at Jimamarca and Zapallal.
The following table provides information regarding the development of the electricity sub-sector for the years shown.
Principal Economic Indicators for the Electricity Sector
| | | | | | | | | | | | | | | | | | | | |
| | | 2007(1) | | | 2008(1) | | | 2009(1) | | | 2010(1) | | | 2011(1) | |
Production of electricity sector (in GW/hr): | | | | | | | | | | | | | | | | | | | | |
Thermal | | | 9,030 | | | | 11,947 | | | | 11,480 | | | | 13,936 | | | | 15,142 | |
Hydroelectric | | | 19,080 | | | | 18,562 | | | | 19,371 | | | | 19,515 | | | | 21,150 | |
| | | | | | | | | | | | | | | | | | | | |
Total generation (in GW/hr) | | | 28,110 | | | | 30,508 | | | | 30,851 | | | | 33,450 | | | | 36,292 | |
| | | | | |
Losses, transmission and distribution (in GW/hr) | | | 2,434 | | | | 2,593 | | | | 2,634 | | | | 2,714 | | | | 3,026 | |
| | | | | |
Energy production (in millions of U.S.$) | | | 1,067 | | | | 976 | | | | 956 | | | | 1,005 | | | | 1,152 | |
Energy sale income (in millions of U.S.$) | | | 1,831 | | | | 2,212 | | | | 2,250 | | | | 2,476 | | | | 2,773 | |
| | | | | |
Consumption by economic sector (in GW/hr): | | | | | | | | | | | | | | | | | | | | |
Residential | | | 5,760 | | | | 6,251 | | | | 6,578 | | | | 7,038 | | | | 7,538 | |
Industrial | | | 13,650 | | | | 14,877 | | | | 14,655 | | | | 15,998 | | | | 16,996 | |
Government | | | 656 | | | | 676 | | | | 686 | | | | 712 | | | | 752 | |
Commercial | | | 4,651 | | | | 5,199 | | | | 5,244 | | | | 5,817 | | | | 6,483 | |
| | | | | | | | | | | | | | | | | | | | |
Total consumption | | | 24,717 | | | | 27,003 | | | | 27,163 | | | | 29,567 | | | | 31,769 | |
Source: OSINERGMIN.
Water. The Government is responsible for water and sanitation services in Lima while Peru’s various municipalities are responsible for providing water and sanitation services in the urban and suburban areas of their respective jurisdictions. The central and municipal governments designate special service companies, which may be private, government-owned or mixed ownership, to provide water and sanitation services. In rural areas, communal administrative commissions are in charge of providing water supply and sanitation services. The provision of sanitation water services is regulated by the Superintendencia Nacional de Servicios de Saneamiento, or National Superintendence for Sanitary Services. In 2011, the water sub-sector decreased 0.05% compared to 2010.
44
Services
Wholesale and Retail Trade
Wholesale and retail trade grew 9.7% in 2007, 13.0% in 2008, decreased 0.4% in 2009, grew 9.7% in 2010 and grew 8.8% in 2011. During the five-year period from 2007 through 2011, this sector contributed on average 14.9% a year to GDP, making it the third most important sector of the economy.
The growth between 2007 and 2008 was primarily due to increases in domestic demand caused by an improvement in the economic situation of consumers. During 2009, wholesale and retail trade decreased 0.4%, due to a decrease in automobile sales, as well as manufactured, agricultural and mining products. As a result, the contribution of this sector to GDP decreased from 15.0% by the end of 2008 to 14.9% by the end of 2009.
During 2010, wholesale and retail trade increased 9.7% due to the dynamism presented by vehicles sales, wholesales (construction materials sale) and retail sales (hardware articles and home products). In 2011, the 8.8% increase in wholesale and retail trade resulted primarily from a 7.3% increase in national income, improvements in consumer confidence and a 5.4% increase in the rate of employment, in each case, compared to 2010. The 24.5% increase in automobile sales, the 19.0% increase in supermarket sales and the 20.0% increase in retail sales, and the consumer credit increase 20.6% in real terms.
Other Services
The private sector in Peru offers a variety of services constituting the “Other Services” sector of Peru’s GDP that in aggregate is an important part of the Peruvian economy. The “Other Services” sector includes services to companies, government services, transportation and communication, healthcare and education services, tourism and financial services. In the aggregate, these services grew 9.0% in 2007, 9.1% in 2008, 3.1% in 2009, 8.0% in 2010 and 8.3% in 2011. For a description of the evolution of the financial services sub-sector between 2007 and 2011 see “The Monetary System—Financial Sector” below.
In 2010, this sector grew at a rate similar to that of GDP. In 2010, the “Other Services” sector grew 8.0% compared to 8.8% GDP growth. As a result, the “Other Services” sector accounted for 48.3% of GDP by the end of 2010, a slight decrease in comparison to that recorded in 2009.
In 2011, “Other Services” grew 8.3% compared to 6.9% GDP growth. As a result, the “Other Services” sector accounted for 48.9% of GDP by the end of 2011, a slight increase in comparison to that recorded in 2010.
Transportation and Telecommunications
The transportation and telecommunications sub-sector has grown each year since 2007 due to increased domestic demand for telephone services. In 2011, the transportation and telecommunications sub-sector grew 11.0%, due to a greater dynamism in the transportation sub-sector that grew 8.5% and the communications sub-sector that grew 17.7%. In 2010, the sector grew 6.7% due to higher levels of activity in the transportation sub-sector that grew 9.5%; partially offset by a decrease growth in the communications sub-sector of 0.2%. In the five-year period ended in 2011, a large portion of Peru’s telecommunication investment has been directed to the mobile telephone market where subscribers increased to approximately 31.8 million by 2011. From 2010 to 2011, the number of subscribers increased by approximately 2.8 million.
45
Telecommunications. The following table provides information on the evolution of the telecommunications sector.
Summary of Telecommunications Sector
| | | | | | | | | | | | | | | | | | | | |
| | | For the 12 months ended December 31, | |
| | | 2007(1) | | | 2008(1) | | | 2009(1) | | | 2010(1) | | | 2011(1) | |
| | | | | |
Fixed wire lines in service | | | 2,400,512 | | | | 2,878,106 | | | | 2,965,283 | | | | 2,949,129 | | | | 2,879,397 | |
Cellular phones | | | 8,772,479 | | | | 20,951,834 | | | | 24,702,060 | | | | 29,002,791 | | | | 31,795,590 | |
Public phones | | | 158,314 | | | | 196,659 | | | | 192,765 | | | | 200,398 | | | | 200,945 | |
Sources: America Móvil Perú S.A.C., Americatel Perú S.A., Convergia Perú S.A., Gamacom, Gilat to Home Perú S.A., Impsat Perú S.A., Infoductos y Telecomunicaciones del Perú S.A., Nextel del Perú, Perusat S.A., Rural Telecom S.A.C., Telefónica del Perú S.A.A., Telefónica Móviles S.A., Telmex Perú S.A. and Valtron E.I.R.L.
Tourism
See “Balance of Payments and Foreign Trade—Services Trade” below for information on the tourism sub-sector.
Public Administration
Based on an audit undertaken of the public sector, the total amount of public employees as of December 2011 was 1,641,361, of which 46.3% are active workers, 43.9% are pensioners and 9.9% are non personal service workers. Most public employees are placed in regional governments, economy and finance and education ministries.
Privatization and the Role of the State in the Economy
Privatizations and Concessions
In 1991, Peru initiated an ambitious privatization program beginning with the enactment of various laws for the promotion of private investment. In 1991, in order to stimulate private investment, the Executive Branch enacted Legislative Decree No. 662, Ley de Promoción de la Inversión Extranjera, or the Foreign Investment Promotion Act, which authorized the Government to enter into legal stability agreements with foreign and domestic investors that invest at least U.S.$5 million, or U.S.$10 million in the case of mining and hydrocarbon sectors, within two years of the agreement. In 1991, the Executive Branch also enacted Ley Marco para el Crecimiento de la Inversión Privada, or the Private Investment Growth Framework Act. These investment laws provide for equal treatment of both national and foreign investors; automatic authorization of foreign investments, which must then be registered with Proinversión; the protection of the property rights of foreign investors; the free repatriation of property, dividends and profits; and the elimination of restrictions on the participation of foreigners in banks and insurance companies.
Since 1991, the Government has privatized most of its assets in the finance, fishing and telecommunications sectors. The Government has also made significant progress in privatizing the mining and hydrocarbons, manufacturing, electricity and agriculture sectors. The more than 254 privatizations and 86 concessions that have been completed in Peru since 1991 have generated investments of approximately U.S.$22.2 billion.
The pace of privatizations began to slow down after 1996, when privatization proceeds reached record levels. This decline resulted in part from a shrinking supply of state-owned enterprises, President Fujimori’s retreat from unpopular privatization initiatives to gain support for his presidential bid and the political turmoil that accompanied President Fujimori’s reelection in 2000.
Upon taking office in July 2001, the Toledo administration sought to revitalize Peru’s privatization agenda by charging two special privatization committees to develop privatization programs for projects including highway networks, ports, airports and tourism, corrections facilities, mining and agricultural development. The privatization
46
program was viewed unfavorably by Peruvians, fearful they would lose their jobs with privatizations and opposed to the sale of well-known state assets to non-Peruvians. This opposition forced the Government to back down from the privatization of the Egasa and Egesur electric plants in Arequipa in 2002. In order to quell opposition, the Government sought in 2002 to reach agreements with presidents of the regional governments regarding resumption of the privatization process. The first of these agreements was reached on June 16, 2003 with the regional government of Pasco to proceed with the privatization of a 30-year concession for the Yuncan hydroelectric plant. Following negotiations with affected regional governments, the central government resumed in 2004 the privatization program.
In the letter of intent negotiated with the IMF in January 2002 to establish a stand-by credit facility for 2002 to 2004, privatizations and concessions were considered “an essential element to generate confidence among investors and to help finance fiscal deficits in 2002 and 2003.” The Government’s aim, as agreed with the IMF as part of a two-year program, was to generate proceeds of at least U.S.$700 million through the sale of concessions and of state assets. After the Government placed the privatization process on hold in 2002, the IMF agreed to adjust both the 2002 and 2003 targets for Peru’s consolidated public sector deficit to 2.3% of GDP for 2002 and 1.9% of GDP for 2003. The 2004-2006 stand-by agreement with the IMF also emphasized the promotion of private investment, including the implementation of concessions or public-private partnerships for the construction and maintenance of at least two major roads. The stand-by agreement with the IMF expired on August 16, 2006. The Government achieved all the goals and implemented all of the structural changes required by that agreement.
On January 26, 2007, the IMF approved a new Stand-By Agreement with Peru for an aggregate amount of approximately U.S.$257 million to support the economic programs of the Government for a 25-month period ending on February 26, 2009.
Upon taking office in July 2006, President Alan García announced an investment program intended to expand access to drinking water, rural electricity, roads, infrastructure for schools and hospitals, and small irrigations and canals, with the aim of creating employment in rural zones. During 2006 privatizations and concessions contributed approximately U.S.$113.4 million to the Government’s revenues.
In 2007, concessions and privatizations in Peru reached U.S.$543.8 million with U.S.$2.8 billion in projected investments. Of special importance were (i) the privatization of the Minero Michiquillay Project for an aggregate amount of U.S.$412.0 million, which was awarded to the English company Anglo American Services, and (ii) the sale of 23% of the outstanding stock of Cemento Andino for an aggregate amount of U.S.$63.8 million. In relation with concessions, during 2007 Nextel was awarded for a 20-year period the bands D and E concessions for personal communication services for an aggregate amount of U.S.$27.0 million. Similarly, América Móvil del Perú was awarded for a 20-year period the band B concession for public cellular phone services for an aggregate amount of U.S.$22.2 million.
In 2008, investments from concessions totaled U.S.$46.7 million with US$3.0 billion in projected investments. Noteworthy, Isonor Transmisión S.A.C. was granted the electric transmission lines concession over the Mantaro—Caravelí—Montalvo and Macchu Picchu—Cotaruse routes for a 30-year period for an aggregate amount of U.S.$181.0 million, and Abengoa Perú S.A. was granted the electric transmission lines concession over the Carhuamayo—Paragsha—Conococha—Huallanca—Cajamarca—Cerro Corona—Carhuaquero route for a 30-year period for an aggregate amount of U.S.$106.1 million. Likewise, a joint venture between Colombian companies Empresa Energía de Bogota and Transportadora de Gas del Interior won the bidding process for a gas distribution through pipelines contract for the Ica department for a 20-year period for a minimum investment of U.S.$60.0 million. In sanitation, Constructora OAS Ltda. was granted a concession over the Huascacocha—Lima drinking water supply project for Lima for a 20-year period and an investment of U.S.$76.9 million. Finally, the Spanish company OHL Concesiones, S.L. was granted a concession over the Pativilca—Trujillo part of Red Vial 4 highway project, for an aggregate amount of U.S.$310.9 million.
In 2009, concessions and privatizations reached U.S.$29.9 million with U.S.$1.6 billion in projected investments. Of special importance were (i) the maritime port terminal concession over the Paila port terminal, for an aggregate amount of U.S.$231.8 million, (ii) the highway concession over the Trujillo—Sullana part of the Autopista del Sol highway project, for an investment of U.S.$306.8 million, (iii) the sanitary concession over the Taboada sewage processing plant, for an aggregate amount of U.S.$268.9 million, (iv) the energy supply concessions of new hydroelectric plants for U.S.$300 million and (v) the Zapallal—Trujillo power line for U.S.$167.5 million.
47
In 2010, concessions and privatizations reached U.S.$179.5 million with U.S.$6.4 billion in projected investments. Of special importance were (i) the Majes-Sihuas II BOOT hydroelectric project for U.S.$344 million, (ii) the Chilca-Marcona-Montalvo power line for U.S.$291 million, (iii) the second group of regional airports for U.S.$215.9 million, (iv) the 800 MW cold reserve generation project for U.S.$300 million and (v) La Chira water treatment plant for U.S.$160.3 million.
In 2011, concessions and privatizations reached U.S.$42.2 million with U.S.$4.1 billion in projected investments. Of special importance were (i) investments in hydroelectric plants of U.S.$2.3 billion, (ii) the Norte Callao Terminal for U.S.$761 million, (iii) the telecommunication concession over the Banda C for a total amount of U.S.$150 million and (iv) the special transmission project for the electricity system for U.S.$208.3 million.
The promotion of private investment process for the period 2012 – 2013 includes projects for a total amount of U.S.$10.7 billion, primarily in the transport and energy sectors and in a lesser extent in the fuel and telecommunication sectors.
Role of the State in the Economy
As a result of the privatization program undertaken by the Fujimori administration during the 1990s, and continued during the Paniagua, Toledo and García administrations, the public sector played a more limited role in the Peruvian economy than it did in previous decades. The García’s administration supported the privatization and deregulation process, based on the view that sustainable economic growth is driven primarily by private investment. President Humala has demonstrated continuity with the prior administrations’ economic policies. President Humala’s administration has continued to implement policies that promote macroeconomic stability, fiscal discipline and domestic and foreign investment. Also, President Humala’s administration has not made a shift in trade policy and has not experienced any adverse changes with its major trading partners, relative to the prior administration. In addition to strong economic growth, the Humala administration is also focused on promoting a broader agenda of social inclusion by developing social programs that benefit the poorest sectors of the population. President Humala has vowed to lift the country out of extreme poverty by investing in social inclusion programs, with an emphasis on health, education and infrastructure projects.
Employment and Labor
Employment
Formal Employment
A significant portion of the Peruvian population lacks regular full-time employment. Despite periods of economic expansion in recent years, unemployment and underemployment remain one of Peru’s most entrenched problems.
The Government discontinued nationwide employment surveys after 2001. However, these statistics can be calculated using the National Household Survey.
Unemployment decreased from 7.1% in 2007 to 5.1% in 2010, due primarily to an improvement in the economy, and especially in labor intensive industries, such as agriculture, manufacturing and construction. Regarding regional statistics as of 2010, the urban unemployment rate of 7.9% in Peru compares favorably to the rate in Argentina (7.7%), Brazil (6.7%), Chile (8.2%), Colombia (12.4%), Ecuador (7.6%) and Venezuela (8.6%). Despite relatively favorable unemployment performance, underemployment remains high, and is considered the most important problem in the Peruvian labor market. However, underemployment has been reduced in the last four years from 44.3% in 2007 to 37.9% in 2010.
48
The continuously high levels of unemployment and underemployment have fueled social tensions and protests against privatizations and large industrial projects. In 2007, Peru experienced continuous incidents of labor unrest including 73 strikes with the participation of 48,096 workers; in 2008, there were 63 strikes with the participation of 34,011 workers; in 2009, there were 99 strikes with the participation of 36,114 workers; in 2010, there were 83 strikes with participation of 30,606 workers; and in 2011 there were 87 strikes with participation of 26,770 workers. The economic sectors that faced the number of strikes were in mining (35.7%), manufacturing (28.6%), construction (11.9%) and transportation and communications (9.5%).
The following table provides employment statistics in Metropolitan Lima from 2007 to 2010.
Employment and Labor in Metropolitan Lima
(in percentages)
| | | | | | | | | | | | | | | | | | | | |
| | | 2007 | | | 2008 | | | 2009 | | | 2010 | | | 2011 | |
| | | | | |
Participation rate(1) | | | 63.8 | | | | 66.7 | | | | 68.5 | | | | 67.7 | | | | N.A. | |
Underemployment rate(2) | | | 44.3 | | | | 39.3 | | | | 40.6 | | | | 37.9 | | | | N.A. | |
Unemployment rate(3) | | | 7.1 | | | | 6.2 | | | | 6.3 | | | | 5.1 | | | | N.A. | |
| (1) | Percentage of the working-age population (14 years old or older) that is in the labor force. |
| (2) | Percentage of the working-age population (14 years old or older) working part-time who would prefer to work more hours, plus the percentage of the working-age population that usually works full-time but who, in the week the employment survey was conducted, worked less than 35 hours per week as a result of economic constraints. |
| (3) | Percentage of the working-age population (14 years old or older) that, in the week the employment survey was taken, was seeking remunerated employment. |
Source: Ministry of Labor. Figures for 2005-2009 are based on the Household Survey on Labor. Both the Ministry of Labor and the National Institute of Statistics publish their data based on polls of the workforce. The Ministry of Labor undertakes its poll in the third quarter of each year while the National Institute of Statistics has an on-going poll that is updated on a consistent basis. Consequently, the results obtained by the two institutions diverge due to timing differences, even though they use the same measurement methodology.
N.A. = Not Available.
The following table provides information on employment by sector, as a percentage of total employment, in Metropolitan Lima from 2007 to 2011.
Employment in Metropolitan Lima
(percentage by economic sector)
| | | | | | | | | | | | | | | | | | | | |
| | | 2007 | | | 2008 | | | 2009 | | | 2010 | | | 2011 | |
Extractive(1) | | | 1.3 | | | | 1.4 | | | | 1.2 | | | | 1.2 | | | | N.A. | |
Manufacturing | | | 17.3 | | | | 16.8 | | | | 16.9 | | | | 18.5 | | | | N.A. | |
Construction | | | 6.0 | | | | 6.8 | | | | 6.3 | | | | 7.0 | | | | N.A. | |
Transportation and telecommunications | | | 10.3 | | | | 11.0 | | | | 10.7 | | | | 10.2 | | | | N.A. | |
Wholesale and retail trade | | | 25.4 | | | | 22.5 | | | | 23.7 | | | | 23.0 | | | | N.A. | |
Services | | | 34.8 | | | | 36.4 | | | | 35.6 | | | | 35.3 | | | | N.A. | |
Other(2) | | | 5.0 | | | | 5.0 | | | | 5.6 | | | | 4.9 | | | | N.A. | |
| | | | | | | | | | | | | | | | | | | | |
Total | | | 100.0 | | | | 100.0 | | | | 100.0 | | | | 100.0 | | | | 100.0 | |
| (1) | Includes Agriculture, livestock, fishing, forestry and mining. |
N.A. = Not Available.
Source: Ministry of Labor. Figures are based on the Household Survey on Labor.
Informal Employment
The Peruvian economy has a significant “informal sector” that provides employment to the majority of the labor force, including a significant number of women. The term “informal sector” refers to economic activities that take place outside of the formal norms for economic transactions established by the state or developed through formal business practices. It generally involves production and exchange of legal goods and services without the appropriate business permits, without the payment of taxes, without complying with labor regulations and without legal guarantees for suppliers and end users. Because of the nature of this sector, it is difficult to obtain reliable statistics measuring its contribution to the Peruvian economy.
The Ministry of Labor estimates the size of the informal sector based on ILO criteria pursuant to which workers in the informal sector are those who work in micro enterprises (either as wage earners or micro entrepreneurs), who are non-professional self-employed, or who are domestic and unpaid family workers. Based on this measurement, 55.7% of the workforce in Metropolitan Lima was employed in the informal sector during 2010 compared to 58.9% in 2007, based on data from the Ministry of Labor.
49
Consistent with recent trends in underemployment, employment in the informal sector has also shown slight reductions in the five-year period ended in 2009.
Metropolitan Lima: Distribution of formal and informal employment
(in percentages)
| | | | | | | | | | | | | | | | | | | | |
| | | 2007 | | | 2008 | | | 2009 | | | 2010 | | | 2011 | |
Formal Sector | | | | | | | | | | | | | | | | | | | | |
Public sector workers | | | 7.9 | | | | 7.8 | | | | 6.6 | | | | 7.2 | | | | N.A. | |
Private sector workers | | | 30.7 | | | | 33.0 | | | | 30.8 | | | | 34.2 | | | | N.A. | |
Small Enterprises | | | 14.0 | | | | 12.8 | | | | 13.0 | | | | 13.9 | | | | N.A. | |
Medium and large enterprises | | | 16.7 | | | | 20.2 | | | | 17.8 | | | | 20.4 | | | | N.A. | |
Professional self-employed | | | 2.5 | | | | 3.2 | | | | 2.8 | | | | 2.9 | | | | N.A. | |
| | | | | | | | | | | | | | | | | | | | |
Total | | | 41.1 | | | | 44.0 | | | | 40.2 | | | | 44.3 | | | | N.A. | |
| | | | | |
Informal Sector | | | | | | | | | | | | | | | | | | | | |
Micro enterprises | | | 20.7 | | | | 20.9 | | | | 24.3 | | | | 23.5 | | | | N.A. | |
Non-professional self-employed | | | 30.5 | | | | 26.3 | | | | 26.5 | | | | 24.4 | | | | N.A. | |
Unpaid family worker | | | 2.6 | | | | 3.3 | | | | 2.9 | | | | 2.3 | | | | N.A. | |
Other | | | 5.2 | | | | 5.4 | | | | 6.1 | | | | 5.4 | | | | N.A. | |
| | | | | | | | | | | | | | | | | | | | |
Total | | | 58.9 | | | | 56.0 | | | | 59.8 | | | | 55.7 | | | | N.A. | |
N.A. = Not Available.
Source: Ministry of Labor. Figures are based on the Household Survey on Labor.
Wages and Labor Productivity
The Ministry of Labor sets a single minimum wage for all sectors of the economy based on macroeconomic indicators such as GDP growth and the inflation rate. The minimum wage was last adjusted in August 2011 and is currently S/.675 per month, equivalent to approximately U.S.$252.34 per month at the average exchange rate in 2011.
Peru does not currently compile statistics on labor productivity.
Poverty and Income Distribution
Peru classifies households with monthly per capita income of less than U.S.$96.37 as being below the poverty line. According to the most recent data, using this standard, the percentage of the population living below the poverty line decreased from approximately 42.4% in 2007 to approximately 30.8% in 2010. A significant number of Peruvians have a monthly per capita income of less than U.S.$30. However, the degree of extreme poverty, that is, the percentage of households whose per-capita expenditure does not allow them to buy a basic food basket, defined by INEI, has decreased in recent years. The extreme poverty rate decreased from 11.2% in 2007 to 7.6% in 2010.
Income distribution data shows that the poorest 40% of the population earned 13.6% of the national income in 2010, compared to 11.7% in 2007, while the share of the national income earned by the wealthiest 10% decreased from 38.3% in 2007 to 34.7% in 2010. The following table provides information regarding income distribution for the years shown.
Metropolitan Lima: Evolution of Income Distribution
(in percentages)
| | | | | | | | | | | | |
Income group | | 2004 | | | 2007 | | | 2010 | |
Lowest 40% | | | 12.0 | | | | 11.7 | | | | 13.6 | |
Next 20% | | | 13.1 | | | | 13.0 | | | | 14.1 | |
Next 20% | | | 20.7 | | | | 20.7 | | | | 21.6 | |
Highest 20% | | | 54.2 | | | | 54.6 | | | | 50.7 | |
Of which the highest 10% | | | 37.9 | | | | 38.3 | | | | 34.7 | |
Source: INEI—Encuesta Nacional de Hogares 2004-2010.
Values adjusted in accordance with the projections of the population derived from the Census of the Population 2007.
50
High poverty rates negatively affect social and political stability, causing social unrest, road blocks and strikes. The García Administration implemented policies designed to raise the standard of living of the Peruvian population and remedying poverty is among the most important goals of the Humala administration. The García administration sought to achieve these goals through sustainable economic growth and by improving the efficiency and quality of social spending programs with a goal to reduce poverty below 30% of the total population and to reduce the rate of malnutrition below 24%. The Humala administration has made public statements that it intends to continue and expand these measures and adopt other policies to reduce the incidence of poverty.
Poverty in Peru has been attributed to unemployment and underemployment and the increasing disparity in income between skilled, educated workers and unskilled and relatively less educated workers. The educational system has suffered from a lack of resources and inadequate teacher training. For this reason, the most recent budgets have consistently increased universal education spending. The 2009 budget increased it by 1.6%, compared to the 2008 budget, the 2010 budget has increased it by 16.4%, compared to the 2009 budget, the 2011 budget has increased it by 8.7%, compared to the 2010 budget and the 2012 budget has increased it by 26.0%, compared to the 2011 budget. The Humala administration’s plan to improve education includes the allocation of the budget to focus on rural education.
One of the aspects of the Government’s anti-poverty plan was the establishment of a social program known as A Trabajar Urbano (Let’s Work—Urban), currently called Construyendo Perú (Building Peru). Construyendo Perú is an urban program that places unemployed workers in public sector jobs in the development and maintenance of infrastructure for up to six months. The program also invests in job training and technical assistance to small businesses and in the improvement of the municipal governments’ capacities and public sector agencies to get effective actions in formulation, coordination and monitoring of social initiatives. Additionally, the program has an anti-cyclical component in the development of its projects. As of December 31, 2011, the Construyendo Perú program had generated 380,441 temporary jobs in urban areas at a cost of S/.721.2 million, or approximately U.S.$267.4 million.
The García Administration’s social policies sought to adopt programs and projects for the development of the productivity of the Peruvian population (by strengthening nutrition, health and education), the promotion of employment and generation of new economic opportunities for the lower income classes (through social and productive investment programs intended to create permanent employment conditions), and the creation of a social protection network for the low-income population (such as temporary employment and medical and food assistance). As part of these programs, the Government continued with programs such as Juntos (Together), which is designed to make direct payments to poor households where families are required to send their children to school and to receive immunizations, Agua Para Todos (Water for Everyone), which is designed to deliver potable water and sewage systems to areas lacking these services, and the Fund for Equality, recently created as a result of the Government’s austerity policies. During 2011, the development of the social policies continued and the public expenditures in social programs increased.
Among the key sociopolitical proposals that have been announced by the Humala administration to address poverty, are the following:
| | • | | Double the number of homes in the Juntos program that is targeted at families suffering under extreme poverty and single mothers in dire economic need. As of December 31, 2011, the Juntos program has executed U.S.$227.7 million. |
| | • | | Develop the Cuna Más (One More Crib) targeted for the first child in homes that are located in districts that experience the highest incidence of poverty. During the first months of 2012, 600 new units were inaugurated in different locations of Peru. |
| | • | | Zero Malnutrition with breakfast and lunch served in all public schools, and strengthening of a preventive health plan for all students. |
| | • | | The Pension 65 plan to provide seniors 65 years of age and older and who do not have access to any pension plan, a focused S/.250 per month with financing to be provided by the National Treasury. As of December 31, 2011, the Government had executed S/.24 million of the budgeted funds. This program will not impact any funds affiliated to or managed by the AFPs. |
| | • | | Focus on supporting one-room and multi-grade schools located in rural regions of the country. |
51
In October 2011, the government created the Development and Social Inclusion Ministry, which pursues to improve the life quality of the population, promoting the exercise of rights, access to opportunities and development of capacities. The new Ministry will have authority to address matters as social development, eradication of poverty and promotion of social equity and inclusion, and also social protection of the population at risk. The new Ministry is in charged of the following social programs: Juntos, FONCODES or Fondo de Cooperación para el Desarrollo Social (Cooperation Fund for Social Development), PRONAA or Programa Nacional de Asistencia Alimentaria (National Program of Nutrition Assistance), GRATITUD or Programa Nacional de Asistencia Solidaria (National Program of Solidarity Assistance), WAWA WASI or Programa Nacional Wawa Wasi (National Program Wawa Wasi), Pension 65 and Cuna Más.
Environment
The most serious environmental problems confronting Peru are:
| | • | | scarcity and quality of the water supply; |
| | • | | inadequate waste management in urban centers. |
The Government seeks to address these environmental problems through greater supervision, regulation and community and private sector awareness and involvement. To better address these problems the Ministry of the Environment was created in May 2008. Its objectives are the design, implementation, execution and supervision of the environmental policy at a national level and for each relevant sector. The Ministry of the Environment is currently being implemented and will merge with the National Council for the Environment in the short term. Its budget for 2012 is S/.222.2 million, or approximately U.S.$83.1 million.
The Government requests environmental impact studies before authorizing any public or private construction project. Each regulatory agency within each sector of the economy issues regulations to protect the environment and imposes its own sanctions for the violation of those rules. The Ministry of Energy and Mines has designed an effective environmental program that is viewed as a model for other governmental agencies. The Ministry’s Programa para Ahorro de Energía, or Energy Conservation Program, actively promotes energy savings and fuel-efficient energy alternatives. The Ministry also developed and implemented an environmental curriculum for public schools that emphasizes conservation. Once established and in operation the Ministry of the Environment will assume some of the abovementioned powers.
52
BALANCE OF PAYMENTS AND FOREIGN TRADE
Balance of Payments
The balance of payments accounts are used to record the value of the transactions carried out between a country’s residents and the rest of the world. The balance of payments is composed of:
| | • | | the current account, which comprises: |
| | • | | net exports of goods and services; |
| | • | | net financial and investment income; and |
| | • | | the capital account, which is the difference between financial capital inflows and financial capital outflows. |
The following table provides information, based on period-end exchange rates, regarding Peru’s balance of payments for the periods shown.
Balance of Payments
(in millions of U.S. dollars, at current prices)
| | | | | | | | | | | | | | | | | | | | |
| | | 2007 | | | 2008 | | | 2009 | | | 2010 | | | 2011 | |
Current account: | | | | | | | | | | | | | | | | | | | | |
Trade balance: | | | | | | | | | | | | | | | | | | | | |
Exports (FOB)(1) | | | 28,094 | | | | 31,018 | | | | 26,962 | | | | 35,565 | | | | 46,268 | |
Imports (FOB)(1) | | | (19,591 | ) | | | (28,449 | ) | | | (21,011 | ) | | | (28,815 | ) | | | (36,967 | ) |
| | | | | | | | | | | | | | | | | | | | |
Trade balance | | | 8,503 | | | | 2,569 | | | | 5,951 | | | | 6,750 | | | | 9,302 | |
Services, net | | | (1,192 | ) | | | (2,056 | ) | | | (1,144 | ) | | | (2,345 | ) | | | (2,132 | ) |
Of which: | | | | | | | | | | | | | | | | | | | | |
Net income from tourism(2) | | | 755 | | | | 870 | | | | 926 | | | | 740 | | | | 1008 | |
Net income from transportation(3) | | | (1,198 | ) | | | (1,741 | ) | | | (979 | ) | | | (1,599 | ) | | | (1,521 | ) |
Financial and investment income, net(4) | | | (8,359 | ) | | | (8,774 | ) | | | (7,484 | ) | | | (10,055 | ) | | | (12,636 | ) |
Current transfers, net | | | 2,508 | | | | 2,943 | | | | 2,887 | | | | 3,026 | | | | 3,200 | |
Of which: | | | | | | | | | | | | | | | | | | | | |
Workers’ remittances | | | 2,131 | | | | 2,444 | | | | 2,409 | | | | 2,534 | | | | 2,697 | |
| | | | | | | | | | | | | | | | | | | | |
Current account balance | | | 1,460 | | | | (5,318 | ) | | | 211 | | | | (2,625 | ) | | | (2,267 | ) |
Capital account: | | | | | | | | | | | | | | | | | | | | |
Foreign direct investment | | | 5,425 | | | | 6,188 | | | | 5,178 | | | | 7,113 | | | | 7,548 | |
Portfolio investment | | | 70 | | | | 85 | | | | 47 | | | | 87 | | | | 147 | |
Other medium and long-term capital(5) | | | 840 | | | | 1,833 | | | | (1,512 | ) | | | 5,129 | | | | 2,131 | |
Of which: | | | | | | | | | | | | | | | | | | | | |
Disbursements to the public sector | | | 3,384 | | | | 1,166 | | | | 3,229 | | | | 4,261 | | | | 990 | |
Other capital, including short-term capital | | | 2,064 | | | | 568 | | | | (2,214 | ) | | | 536 | | | | (1,463 | ) |
| | | | | | | | | | | | | | | | | | | | |
Capital account balance | | | 8,400 | | | | 8,674 | | | | 1,499 | | | | 12,865 | | | | 8,363 | |
Errors and omissions(6) | | | (272 | ) | | | (244 | ) | | | (702 | ) | | | 933 | | | | (1,402 | ) |
| | | | | | | | | | | | | | | | | | | | |
Balance of payments | | | 9,588 | | | | 3,112 | | | | 1,007 | | | | 11,173 | | | | 4,694 | �� |
Financing: | | | | | | | | | | | | | | | | | | | | |
Change in gross Central Bank reserves(7) | | | (9,654 | ) | | | (3,169 | ) | | | (1,043 | ) | | | (11,192 | ) | | | (4,724 | ) |
Exceptional financing, net | | | 67 | | | | 57 | | | | 36 | | | | 19 | | | | 30 | |
| | | | | | | | | | | | | | | | | | | | |
Total financing | | | (9,588 | ) | | | (3,112 | ) | | | (1,007 | ) | | | (11,173 | ) | | | (4,694 | ) |
Memorandum item: | | | | | | | | | | | | | | | | | | | | |
Current account balance (deficit) (as a % of GDP) | | | 1.4 | | | | (4.2 | ) | | | 0.2 | | | | (1.7 | ) | | | (1.3 | ) |
| (1) | Based on customs declarations, records of temporary admissions, free-trade zone imports, grants and other adjustments. |
| (2) | Based on a survey of tourists. Income from tourism represents the total expenditure by a tourist multiplied by the total number of tourists. |
| (3) | Includes freight services, passenger transportation and port expenses of ships and airplanes. |
| (4) | Includes interest payments. |
| (5) | Includes debt amortization payments. |
| (6) | Represents errors and omissions from double-entry accounting resulting from incomplete or overlapping coverage, different prices and incomplete times of recording and conversion practices. |
| (7) | Refers to changes in reserve used to finance balance of payments and corresponds to net international reserves excluding the use of IMF resources. |
Source: Central Bank.
53
Current Account
One of the most important aspects of the current account is the trade balance. The four primary factors that impact the trade balance are the following:
| | • | | The relative rate of economic growth of a country compared to that of its trading partners. Generally, if a country’s economy grows faster than that of its trading partners, its relative level of consumption of goods and services will tend to rise and its level of imports will tend to increase more rapidly than its level of exports. |
| | • | | The relative level of domestic prices against foreign prices, as reflected by the real exchange rate. Generally, if a country’s domestic prices rise relative to those of its trading partners, there is a tendency for the country’s exports to decrease and for its level of imports to increase. |
| | • | | Changes in production costs, technology and worker skills. More efficient production will tend to lower production costs, which in turn will tend to lower prices. As prices fall, there is a tendency for the country’s exports to increase. |
| | • | | Changes in consumer tastes, which may affect the demand for a country’s goods and services abroad and the demand for foreign products in the domestic market. |
In 2007, Peru’s current account decreased to a surplus of U.S.$1.4 billion, or 1.4% of GDP, largely due to a lower trade surplus which was U.S.$8.5 billion in 2007 compared to U.S.$9.0 billion in 2006. In 2008, Peru’s current account decreased to a deficit of U.S.$5.3 billion, or 4.2% of GDP, largely due to a lower trade surplus, which was U.S.$2.6 billion in 2008 compared to U.S.$8.5 billion in 2007. In 2009, Peru’s current account registered a surplus of U.S.$0.2 billion, largely due to a higher trade surplus, which was U.S.$6.0 billion in 2009 compared to U.S.$2.6 billion in 2008. In 2010, Peru’s current account registered a deficit of U.S.$2.6 billion, or 1.7% of GDP, primarily due to higher demand for products and services in response to an increase in economic activity, despite a higher trade surplus and increased remittances from abroad. In 2011, Peru’s current account registered a deficit of U.S.$2.3 billion, or 1.3% of GDP, primarily due to an increase in the level of exports which increased 8.5% in volume terms and 20% in price terms compared to 2010.
Services Trade
Peru’s services trade consists primarily of tourism, telecommunications, freight services and financial services. Of these, the most important is tourism. Tourism is also the most important individual source of foreign currency earnings. The commerce, restaurant, hotel, construction and real estate services sub-sectors depend significantly on tourism.
54
From 2007 to 2011, net income from tourism increased from U.S.$0.8 billion to U.S.$1.1 billion, respectively.
Tourism Statistics
| | | | | | | | | | | | | | | | | | | | |
| | | For the 12 months ended and as of December 31, | |
| | | 2007 | | | 2008 | | | 2009 | | | 2010 | | | 2011 | |
Foreign non-resident arrivals(1) | | | 1,916,400 | | | | 2,057,620 | | | | 2,139,961 | | | | 2,299,187 | | | | 2,517,856 | |
Average length of stay (number of nights)(2) | | | 12.0 | | | | 12.0 | | | | 12.0 | | | | 9.0 | | | | N.A. | |
| | | | | |
Hotel activity: | | | | | | | | | | | | | | | | | | | | |
Number of rooms available | | | 166,048 | | | | 176,755 | | | | 187,221 | | | | 195,729 | | | | 204,723 | |
Occupancy rate by total number of rooms available (in %) | | | 26.0 | | | | 27.5 | | | | 26.8 | | | | 27.7 | | | | 29.9 | |
Aggregate value of hotels and restaurants (as a % of GDP) | | | 3.7 | | | | 3.8 | | | | 3.8 | | | | 3.8. | | | | 3.9 | |
| | | | | |
Income from tourism(3) (in millions of U.S.$) | | | 2,007 | | | | 2,396 | | | | 2,440 | | | | 2,475 | | | | 2,912 | |
Expenses from tourism (in millions of U.S.$)(3) | | | (1,243 | ) | | | (1,432 | ) | | | (1,403 | ) | | | (1,640 | ) | | | 1,764 | |
| | | | | | | | | | | | | | | | | | | | |
Balance (income less expenses, in millions of U.S.$) | | | 764 | | | | 964 | | | | 1,037 | | | | 835 | | | | 1,148 | |
| (1) | Include foreign nonresident and Peruvian nonresident. Annual preliminary 2007 to 2011. |
| (2) | Calculated from the survey of arriving foreign non-resident. |
| (3) | Preliminary data from Central Bank of Peru, it includes trips and transportation. |
N.A. = Not Available.
Sources: BCRP, DIGEMIN, INEI, MINCETUR.
Trade Balance
In 2007, the trade surplus decreased to U.S.$8.5 billion, a 5.4% decrease from 2006, primarily attributable to a higher increase in imports of capital assets and construction materials. In 2008, the trade surplus decreased to U.S.$2.6 billion, a 69.8% decrease from 2007, primarily attributable to increased imports of capital assets. In 2009, Peru registered a trade balance surplus of U.S.$6.0 billion, an increase from the U.S.$2.6 billion registered in 2008, mainly due to a decrease in imports, which helped offset a decrease in exports. In 2010, the trade surplus increased to U.S.$6.8 billion, a 13.4% increase from 2009. During 2011, the trade surplus increased to U.S.$9.3 billion, a 37.8% increase from 2010. Total exports increased from U.S.$28.1 billion in 2007 to U.S.$46.3 billion in 2011, reflecting a compound annual growth rate of 14.2% for the five-year period ended December 31, 2011. Total imports increased from U.S.$19.6 billion in 2007 to U.S.$37.0 billion in 2011, with a compound annual growth rate of 20.0% for the five-year period ended December 31, 2011.
In 2007, the trade balance decreased 5.4% due to increased imports (32%), primarily as a result of an increase in purchases of raw materials for industrial use, than exports (18%). The increase in exports was driven primarily by higher commodities prices and higher export volumes of gold, lead, and coffee, as well as important growth in non-traditional exports. In 2008, lower mineral prices and a reduction of external demand resulted in a decrease in exports while imports of capital assets increased. In 2009, lower mineral prices and a reduction of external demand resulted in a decrease in exports. Also, imports decreased 26.1% in comparison to 2008 as a result of weak domestic demand and the decrease in private investment. During 2010, imports increased primarily due to a reduction in imports of raw materials, intermediate products and capital assets (U.S.$28.8 billion in 2010 compared to U.S.$21.0 billion in 2009). The increase in imports together with the increase in private consumption and investment was reflected in the greater acquisition of consumer goods as well as the increase in capital expenditures for industrial purposes. In 2011, exports increased 30.1% in comparison to 2010, primarily due to an increase in the prices of raw materials. Imports increased 28.3% compared to 2010, due to an increase in the acquisition of capital assets and consumer goods, which is consistent with an economy in expansion.
Peru maintains close commercial ties with the United States, its principal trading partner. The United States granted Peru temporary benefits under ATPDEA, which contributed particularly to the expansion of textile, agriculture and livestock exports. In 2007, the United States was the destination for 19.7% of Peru’s total exports
55
and the source of 17.8% of Peru’s total imports. In 2008, 19.3% of Peru’s total exports were bound for the United States, while 18.8% of Peru’s total imports originated in the United States. In October 2008, the United States extended the ATPDEA, as it applies to Peru, for one year, thereby extending Peru’s benefits under ATPDEA until December 31, 2010. The ATPDEA was extended on December 31, 2010 for a period of six weeks that expired on February 12, 2011. Although a majority of Peruvian exporters no longer required the benefits of the ATPDEA given the approval of free trade agreement with the United States (US FTA), which became effective on February 2009, an important group of textile manufacturers and assembly plants benefited from the ATPDEA’s preferential tariff provisions that required lower composition of imported content in exported products. However, the US FTA will allow imports of assembled products and textiles into the North American market, as provided in the agreement. In 2009, approximately 17.6% of Peru’s total exports were bound for the United States, while 19.7% of Peru’s total imports originated from ports in the United States. In 2010, approximately 17% of Peru’s total exports were bound for the United States, while 19.3% of Peru’s total imports originated in the United States. During 2011, approximately 13.4% of Peru’s total exports were bound for the United States, while 19.3% of Peru’s total imports originated in the United States.
In April 2006, Peru signed a free trade agreement with the United States, the Trade Promotion Agreement or TPA. The TPA was approved by the Peruvian Congress in June 2006 and by the U.S. Congress and Senate in November and December 2007, respectively. The TPA with the United States entered into effect in January 2009. In compliance with obligations set by the TPA, the Government enacted more than a hundred legislative decrees in 2008. On February 1, 2009, the Peru Trade Promotion Agreement, entered into force.
As part of regulatory reforms undertaken by the Government in relation to the TPA, President Alan García issued two decrees in 2009 which opened significant parts of the Amazon jungle to private investment. The decrees would allow companies to request permits for petroleum, biofuel, forestry and hydroelectric projects in the Amazon jungle. These decrees resulted in protests and roadblocks by indigenous groups. Subsequently, Peru’s Congress overturned the two decrees, easing tensions with the indigenous groups.
In November 2008, Peru and Japan signed a treaty designed to promote investment in Peru. In March 2009, a free trade agreement between Chile and Peru, or the Economic Association Agreement, entered into force. The Economic Association Agreement was originally signed in 2006. In April 2009, Peru signed a free trade agreement with the Republic of China. In October 2009, Peru and Japan completed seven rounds of negotiations for the Japan-Peru Economic Partnership.
In January 2009, free trade agreements with Canada and Singapore became effective. We expect to start bilateral commercial negotiations with Australia, Central America, Russia, India, South Africa, Moroco and New Zealand in the future. We currently have commercial agreements in force with the Andean Community of Nations (CAN), Chile, Southern Common Market (MERCOSUR), México and Cuba, and we expect to ratify a free trade agreement with Thailand.
In January 2010, Peru and Japan completed the fifth round of negotiations for the Japan-Peru Economic Partnership. In March 2010, the free trade agreement between Peru and the Republic of China became effective. In July 2010, Peru and the European Free Trade Association, or EFTA, entered into a free trade agreement. In 2011, Peru signed a free trade agreement with South Korea, Mexico, Panama, Costa Rica, Japan and Guatemala, and completed the eighth round of negotiations with Thailand.
President Humala’s administration has not made a shift in trade policies and has not experienced any adverse changes with its major trading partners, relative to Garcia’s administration. President Humala’s administration seeks to align Peru with other countries, reduce the barriers and simplify the procedures that regulate the flow of productive factors, in order to improve the assignment of scare resources and as a result enhance the life quality of the population.
Peru classifies its non-free trade zone exports as traditional and non-traditional exports. Traditional exports consist of goods that historically have constituted a greater share of Peru’s exports and include mostly raw materials. Non-traditional exports include goods that historically have not been exported in significant quantities and traditional export goods that have been transformed through manufacturing or other processing.
56
In 2010 and 2011, Peru’s exports consisted primarily of exports of:
| | • | | traditional mineral exports, such as gold, silver, copper, zinc and lead, valued at U.S.$ 21.7 billion during 2010, representing 61.1% of total exports in 2010, and valued at U.S.$27.4 billion in 2011, representing 59.1% of total exports; |
| | • | | petroleum and derivative products valued at U.S.$3.1 billion during 2010, representing 8.7% of the total exports in 2010, and valued at U.S.$4.7 billion in 2011, representing 10.2% of total exports; |
| | • | | traditional fishing exports, such as fishmeal and fish oil, valued at U.S.$1.9 billion during 2010, representing 5.3% of total exports for 2010, and valued at U.S.$2.1 billion during 2011, representing 4.5% of total exports; |
| | • | | non-traditional textile exports, such as textile fibers and cloth, valued at U.S.$1.6 billion during 2010, representing 4.4% of total exports for 2010, and valued at U.S.$2.0 billion during 2011, representing 4.3% of total exports; and |
| | • | | non-traditional agriculture and livestock exports valued at U.S.$2.2 billion during 2010, representing 6.2% of total exports for 2010, and valued at U.S.$2.8 billion during 2011, representing 6.1% of total exports. |
The following tables provide further information on exports for the periods shown.
Exports
(in millions of U.S. dollars, at current prices)
| | | | | | | | | | | | | | | | | | | | |
| | | For the 12 months ended December 31, | |
| | | 2007 | | | 2008 | | | 2009 | | | 2010 | | | 2011 | |
Traditional: | | | | | | | | | | | | | | | | | | | | |
Fishing | | | 1,460 | | | | 1,797 | | | | 1,683 | | | | 1,884 | | | | 2,099 | |
Agricultural | | | 460 | | | | 686 | | | | 636 | | | | 975 | | | | 1,672 | |
Mineral | | | 17,439 | | | | 18,101 | | | | 16,382 | | | | 21,723 | | | | 27,361 | |
Petroleum and derivatives | | | 2,306 | | | | 2,681 | | | | 1,921 | | | | 3,088 | | | | 4,704 | |
| | | | | | | | | | | | | | | | | | | | |
Total traditional | | | 21,666 | | | | 23,266 | | | | 20,622 | | | | 27,669 | | | | 35,837 | |
| | | | | |
Non-traditional: | | | | | | | | | | | | | | | | | | | | |
Agriculture and livestock | | | 1,512 | | | | 1,913 | | | | 1,825 | | | | 2,190 | | | | 2,830 | |
Fishing | | | 500 | | | | 622 | | | | 518 | | | | 642 | | | | 1,047 | |
Textiles | | | 1,736 | | | | 2,026 | | | | 1,495 | | | | 1,558 | | | | 1,986 | |
Timbers and papers, and manufactures | | | 362 | | | | 428 | | | | 335 | | | | 355 | | | | 398 | |
Chemical | | | 805 | | | | 1,041 | | | | 837 | | | | 1,223 | | | | 1,645 | |
Non-metallic minerals | | | 165 | | | | 176 | | | | 148 | | | | 251 | | | | 487 | |
Basic metal industries and jewelry | | | 906 | | | | 909 | | | | 569 | | | | 918 | | | | 1,128 | |
Fabricated metal products and machinery | | | 220 | | | | 328 | | | | 366 | | | | 394 | | | | 464 | |
Other products(1) | | | 107 | | | | 121 | | | | 93 | | | | 110 | | | | 145 | |
| | | | | | | | | | | | | | | | | | | | |
Total non-traditional | | | 6,313 | | | | 7,562 | | | | 6,186 | | | | 7,641 | | | | 10,130 | |
| | | | | |
Other products(2) | | | 114 | | | | 190 | | | | 154 | | | | 254 | | | | 301 | |
| | | | | | | | | | | | | | | | | | | | |
Total exports | | | 28,094 | | | | 31,018 | | | | 26,962 | | | | 35,565 | | | | 46,268 | |
| (1) | Includes leather and handcrafts. |
| (2) | Includes the sale of fuel and food to foreign vessels and the repair of foreign vessels. |
Source: Central Bank.
57
Exports
(as a percentage of total exports, at current prices)
| | | | | | | | | | | | | | | | | | | | |
| | | For the 12 months ended December 31, | |
| | | 2007 | | | 2008 | | | 2009 | | | 2010 | | | 2011 | |
Traditional: | | | | | | | | | | | | | | | | | | | | |
Fishing | | | 5.2 | | | | 5.8 | | | | 6.2 | | | | 5.3 | | | | 4.5 | |
Agricultural | | | 1.6 | | | | 2.2 | | | | 2.4 | | | | 2.7 | | | | 3.6 | |
Mineral | | | 62.1 | | | | 58.4 | | | | 60.8 | | | | 61.1 | | | | 59.1 | |
Petroleum and derivatives | | | 8.2 | | | | 8.6 | | | | 7.1 | | | | 8.7 | | | | 10.2 | |
Total traditional | | | 77.1 | | | | 75.0 | | | | 76.5 | | | | 77.8 | | | | 77.5 | |
Non-traditional: | | | | | | | | | | | | | | | | | | | | |
Agriculture and livestock | | | 5.4 | | | | 6.2 | | | | 6.8 | | | | 6.2 | | | | 6.1 | |
Fishing | | | 1.8 | | | | 2.0 | | | | 1.9 | | | | 1.8 | | | | 2.3 | |
Textiles | | | 6.2 | | | | 6.5 | | | | 5.5 | | | | 4.4 | | | | 4.3 | |
Timbers and papers, and manufactures | | | 1.3 | | | | 1.4 | | | | 1.2 | | | | 1.0 | | | | 0.9 | |
Chemical | | | 2.9 | | | | 3.4 | | | | 3.1 | | | | 3.4 | | | | 3.6 | |
Non-metallic minerals | | | 0.6 | | | | 0.6 | | | | 0.5 | | | | 0.7 | | | | 1.1 | |
Basic metal industries and jewelry | | | 3.2 | | | | 2.9 | | | | 2.1 | | | | 2.6 | | | | 2.4 | |
Fabricated metal products and machinery | | | 0.8 | | | | 1.1 | | | | 1.4 | | | | 1.1 | | | | 1.0 | |
Other products(1) | | | 0.4 | | | | 0.4 | | | | 0.3 | | | | 0.3 | | | | 0.3 | |
| | | | | | | | | | | | | | | | | | | | |
Total non-traditional | | | 22.5 | | | | 24.4 | | | | 22.9 | | | | 21.5 | | | | 21.9 | |
| | | | | |
Other: | | | | | | | | | | | | | | | | | | | | |
Other products(2) | | | 0.4 | | | | 0.6 | | | | 0.6 | | | | 0.7 | | | | 0.7 | |
| | | | | | | | | | | | | | | | | | | | |
Total exports | | | 100.0 | | | | 100.0 | | | | 100.0 | | | | 100.0 | | | | 100.0 | |
| (2) | Includes leather and handcrafts. |
| (3) | Includes the sale of fuel and food to foreign vessels and the repair of foreign vessels. |
Source: Central Bank.
In 2010 and 2011, Peru’s imports consisted primarily of imports of:
| | • | | intermediate goods, such as fuels and raw materials for agricultural and industrial production, valued at U.S.$14.0 billion, representing 48.7% of total imports for 2010, and valued at U.S.$18.3 billion, representing 49.4% of total imports; |
| | • | | capital goods, such as transportation and building equipment, valued at U.S.$9.1 billion, representing 31.5% of total imports for 2010, and valued at U.S.$11.7 billion, representing 31.6% of total imports for 2011; and |
| | • | | consumer goods valued at U.S.$5.5 billion, representing 19.0% of total imports for 2010, and valued at U.S.$6.7 billion, representing 18.1% of total imports for 2011. |
58
The following tables provide further information regarding imports for the periods shown.
Imports
(in millions of US dollars, at current prices)
| | | | | | | | | | | | | | | | | | | | |
| | | For the 12 months ended December 31, | |
| | | 2007 | | | 2008 | | | 2009 | | | 2010 | | | 2011 | |
Consumer goods: | | | | | | | | | | | | | | | | | | | | |
Durable goods | | | 1,438 | | | | 2,192 | | | | 1,825 | | | | 2,680 | | | | 3,226 | |
Non-durable goods | | | 1,751 | | | | 2,328 | | | | 2,137 | | | | 2,809 | | | | 3,465 | |
| | | | | | | | | | | | | | | | | | | | |
Total consumer goods | | | 3,189 | | | | 4,520 | | | | 3,962 | | | | 5,489 | | | | 6,692 | |
Intermediate goods: | | | | | | | | | | | | | | | | | | | | |
Petroleum products, lubricants | | | 3,631 | | | | 5,225 | | | | 2,929 | | | | 4,063 | | | | 5,737 | |
Raw materials for agriculture | | | 588 | | | | 874 | | | | 773 | | | | 868 | | | | 1,091 | |
Raw materials for manufacturing | | | 6,209 | | | | 8,458 | | | | 6,374 | | | | 9,093 | | | | 11,428 | |
| | | | | | | | | | | | | | | | | | | | |
Total intermediate goods | | | 10,429 | | | | 14,556 | | | | 10,076 | | | | 14,023 | | | | 18,255 | |
Capital goods: | | | | | | | | | | | | | | | | | | | | |
Construction materials | | | 590 | | | | 1,305 | | | | 854 | | | | 1,087 | | | | 1,447 | |
For agriculture | | | 50 | | | | 90 | | | | 72 | | | | 80 | | | | 110 | |
For manufacturing | | | 3,958 | | | | 5,765 | | | | 4,498 | | | | 5,539 | | | | 7,296 | |
Transportation equipment | | | 1,256 | | | | 2,073 | | | | 1,426 | | | | 2,369 | | | | 2,813 | |
| | | | | | | | | | | | | | | | | | | | |
Total capital goods | | | 5,854 | | | | 9,233 | | | | 6,850 | | | | 9,074 | | | | 11,665 | |
| | | | | |
Other(1) | | | 119 | | | | 140 | | | | 122 | | | | 229 | | | | 355 | |
| | | | | | | | | | | | | | | | | | | | |
Total imports | | | 19,591 | | | | 28,449 | | | | 21,011 | | | | 28,815 | | | | 36,967 | |
Memorandum items: | | | | | | | | | | | | | | | | | | | | |
Temporal admission imports(2) | | | 322 | | | | 361 | | | | 196 | | | | 420 | | | | 698 | |
Imports into free trade zone(3) | | | 108 | | | | 113 | | | | 110 | | | | 131 | | | | 136 | |
| (1) | Includes the donation of goods, the purchase of fuels and Peruvian foodstuffs and the repair of capital goods in the exterior such as other goods not falling into any one of the classifications used. |
| (2) | Imports that must be processed and exported within a definite period of time and are not subject to tariffs. |
| (3) | Imports through the Special Zone of Tacna, which is primarily dedicated to the assembly of motor vehicles. Peru has five free trade zones, but only the Tacna zone is economically active. |
Source: Central Bank.
Imports
(as a percentage of total imports, at current prices)
| | | | | | | | | | | | | | | | | | | | |
| | | For the 12 months ended December 31, | |
| | | 2007 | | | 2008 | | | 2009 | | | 2010 | | | 2011 | |
Consumer goods: | | | | | | | | | | | | | | | | | | | | |
Durable goods | | | 7.3 | | | | 7.7 | | | | 8.7 | | | | 9.3 | | | | 8.7 | |
Non-durable goods | | | 8.9 | | | | 8.2 | | | | 10.2 | | | | 9.7 | | | | 9.4 | |
| | | | | | | | | | | | | | | | | | | | |
Total consumer goods | | | 16.3 | | | | 15.9 | | | | 18.9 | | | | 19.0 | | | | 18.1 | |
Intermediate goods: | | | | | | | | | | | | | | | | | | | | |
Petroleum products, lubricants | | | 18.5 | | | | 18.4 | | | | 13.9 | | | | 14.1 | | | | 15.5 | |
Raw materials for agriculture | | | 3.0 | | | | 3.1 | | | | 3.7 | | | | 3.0 | | | | 3.0 | |
Raw materials for manufacturing | | | 31.7 | | | | 29.7 | | | | 30.3 | | | | 31.6 | | | | 30.9 | |
| | | | | | | | | | | | | | | | | | | | |
Total intermediate goods | | | 53.2 | | | | 51.2 | | | | 48.0 | | | | 48.7 | | | | 49.4 | |
Capital goods: | | | | | | | | | | | | | | | | | | | | |
Construction materials | | | 3.0 | | | | 4.6 | | | | 4.1 | | | | 3.8 | | | | 3.9 | |
For agriculture | | | 0.3 | | | | 0.3 | | | | 0.3 | | | | 0.3 | | | | 0.3 | |
For manufacturing | | | 20.2 | | | | 20.3 | | | | 21.4 | | | | 19.2 | | | | 19.7 | |
Transportation equipment | | | 6.4 | | | | 7.3 | | | | 6.8 | | | | 8.2 | | | | 7.6 | |
| | | | | | | | | | | | | | | | | | | | |
Total capital goods | | | 29.9 | | | | 32.5 | | | | 32.6 | | | | 31.5 | | | | 31.6 | |
| | | | | |
Other(1): | | | 0.6 | | | | 0.5 | | | | 0.6 | | | | 0.8 | | | | 1.0 | |
| | | | | | | | | | | | | | | | | | | | |
Total imports | | | 100.0 | | | | 100.0 | | | | 100.0 | | | | 100.0 | | | | 100.0 | |
Memorandum items: | | | | | | | | | | | | | | | | | | | | |
Temporal admission imports(2) | | | 1.6 | | | | 1.3 | | | | 0.9 | | | | 1.5 | | | | 1.9 | |
Imports into free trade zone(3) | | | 0.5 | | | | 0.4 | | | | 0.5 | | | | 0.5 | | | | 0.4 | |
| (1) | Includes the donation of goods, the purchase of fuels and Peruvian foodstuffs and the repair of capital goods in the exterior such as other goods not falling into any one of the classifications used. |
| (2) | Imports that must be processed and exported within a definite period of time and are not subject to tariffs. |
| (3) | Imports through the Special Zone of Tacna, which is primarily dedicated to the assembly of motor vehicles. Peru has five free trade zones but only the Tacna zone is economically active. |
Source: Central Bank.
59
Capital Account
The capital account reflects foreign direct investment and monetary flows into and out of a nation’s financial markets.
In 2007, the capital account surplus grew 2,311.5% to U.S.$8.4 billion compared to 2006. This increase was due to a larger flow of capital to the private sector, mainly associated with an increase in foreign direct investment. In 2008, the capital account surplus increased 3.3% to U.S.$8.7 billion. This increase was due to greater foreign direct investment and to the fact that disbursements of debt were greater than redemptions of debt. In 2009, the capital account surplus decreased 82.7% to U.S.$1.5 billion. This decrease was primarily due to an outflow of capital resulting from increased volatility related to the global financial crisis. During 2010, the capital account balance increased 758.2% to a surplus of U.S.$12.9 billion. This increase was primarily due to greater foreign direct investment, an inflow of capital and greater disbursements than redemptions of debt. In 2011, the capital account balance decreased 35.0% to a surplus U.S.$8.4 billion. This decrease was primarily due to an outflow of short-term capital and lower disbursements of debt in comparison to 2010.
Geographic Distribution of Exports
(as a percentage of total exports, at current prices)
| | | | | | | | | | | | | | | | | | | | |
| | | For the 12 months ended December 31, | |
| | | 2007 | | | 2008 | | | 2009 | | | 2010 | | | 2011 | |
| | | | | |
United States | | | 19.7 | | | | 19.3 | | | | 17.6 | | | | 17.0 | | | | 13.4 | |
Canada | | | 6.6 | | | | 6.3 | | | | 8.6 | | | | 9.4 | | | | 9.1 | |
Mexico | | | 1.0 | | | | 1.0 | | | | 0.9 | | | | 0.8 | | | | 0.9 | |
| | | | | | | | | | | | | | | | | | | | |
Total North America | | | 27.3 | | | | 26.6 | | | | 27.1 | | | | 27.2 | | | | 23.4 | |
| | | | | |
Brazil | | | 3.4 | | | | 2.8 | | | | 1.9 | | | | 2.7 | | | | 3.0 | |
Colombia | | | 2.2 | | | | 2.3 | | | | 2.4 | | | | 2.2 | | | | 2.4 | |
Chile | | | 6.1 | | | | 5.7 | | | | 2.8 | | | | 3.9 | | | | 4.6 | |
Venezuela | | | 2.8 | | | | 3.5 | | | | 2.3 | | | | 1.4 | | | | 1.5 | |
Other | | | 5.2 | | | | 5.4 | | | | 5.5 | | | | 5.7 | | | | 5.1 | |
Total Latin America and the Caribbean | | | 19.7 | | | | 19.7 | | | | 14.9 | | | | 16.0 | | | | 16.6 | |
| | | | | |
United Kingdom | | | 0.8 | | | | 1.3 | | | | 0.9 | | | | 0.8 | | | | 0.8 | |
Switzerland | | | 8.4 | | | | 11.1 | | | | 14.8 | | | | 10.9 | | | | 11.5 | |
Germany | | | 3.4 | | | | 3.3 | | | | 3.9 | | | | 4.3 | | | | 3.9 | |
Spain | | | 3.5 | | | | 3.3 | | | | 2.8 | | | | 3.4 | | | | 3.2 | |
Other | | | 10.4 | | | | 10.2 | | | | 8.6 | | | | 10.2 | | | | 11.1 | |
| | | | | | | | | | | | | | | | | | | | |
Total Europe | | | 26.5 | | | | 29.1 | | | | 31.0 | | | | 29.6 | | | | 30.6 | |
| | | | | |
Japan | | | 7.8 | | | | 5.8 | | | | 5.1 | | | | 5.1 | | | | 5.3 | |
China | | | 10.9 | | | | 11.8 | | | | 15.3 | | | | 15.4 | | | | 15.4 | |
Other | | | 6.5 | | | | 6.1 | | | | 5.6 | | | | 5.4 | | | | 7.5 | |
Total Asia | | | 25.3 | | | | 23.8 | | | | 26.0 | | | | 25.9 | | | | 28.2 | |
| | | | | |
Africa and others | | | 1.2 | | | | 0.9 | | | | 1.0 | | | | 1.3 | | | | 1.2 | |
| | | | | | | | | | | | | | | | | | | | |
| | | | | |
Total exports | | | 100.0 | | | | 100.0 | | | | 100.0 | | | | 100.0 | | | | 100.0 | |
Source: Central Bank.
60
Geographic Distribution of Imports
(as a percentage of total imports, at current prices)
| | | | | | | | | | | | | | | | | | | | |
| | | For the 12 months ended December 31, | |
| | | 2007 | | | 2008 | | | 2009 | | | 2010 | | | 2011 | |
| | | | | |
United States | | | 17.8 | | | | 18.8 | | | | 19.7 | | | | 19.3 | | | | 19.3 | |
Canada | | | 1.6 | | | | 1.4 | | | | 1.8 | | | | 1.7 | | | | 1.5 | |
Mexico | | | 4.2 | | | | 4.1 | | | | 3.4 | | | | 3.8 | | | | 3.9 | |
| | | | | | | | | | | | | | | | | | | | |
Total North America | | | 23.6 | | | | 24.3 | | | | 25.0 | | | | 24.8 | | | | 24.7 | |
| | | | | |
Brazil | | | 9.1 | | | | 8.1 | | | | 7.6 | | | | 7.3 | | | | 6.4 | |
Colombia | | | 4.8 | | | | 4.3 | | | | 4.3 | | | | 4.5 | | | | 3.9 | |
Chile | | | 4.4 | | | | 4.1 | | | | 4.7 | | | | 3.9 | | | | 3.8 | |
Venezuela | | | 1.1 | | | | 1.1 | | | | 1.1 | | | | 0.3 | | | | 0.5 | |
Other | | | 15.6 | | | | 14.7 | | | | 12.7 | | | | 12.7 | | | | 14.0 | |
| | | | | | | | | | | | | | | | | | | | |
Total Latin America and the Caribbean | | | 34.9 | | | | 32.4 | | | | 30.5 | | | | 28.6 | | | | 28.6 | |
| | | | | |
United Kingdom | | | 0.7 | | | | 0.6 | | | | 0.7 | | | | 0.7 | | | | 0.7 | |
Switzerland | | | 0.4 | | | | 0.4 | | | | 0.6 | | | | 0.4 | | | | 0.4 | |
Germany | | | 3.4 | | | | 2.9 | | | | 3.3 | | | | 3.0 | | | | 3.0 | |
Spain | | | 1.4 | | | | 1.4 | | | | 1.4 | | | | 1.3 | | | | 1.5 | |
Other | | | 7.1 | | | | 8.1 | | | | 6.7 | | | | 6.3 | | | | 7.1 | |
| | | | | | | | | | | | | | | | | | | | |
Total Europe | | | 13.0 | | | | 13.4 | | | | 12.7 | | | | 11.8 | | | | 12.6 | |
| | | | | |
Japan | | | 3.7 | | | | 4.1 | | | | 4.1 | | | | 4.5 | | | | 3.3 | |
China | | | 12.0 | | | | 13.5 | | | | 15.0 | | | | 16.7 | | | | 16.4 | |
Other | �� | | 8.0 | | | | 8.6 | | | | 8.7 | | | | 9.7 | | | | 10.6 | |
| | | | | | | | | | | | | | | | | | | | |
Total Asia | | | 23.6 | | | | 26.1 | | | | 27.9 | | | | 30.9 | | | | 30.3 | |
| | | | | |
Africa and others | | | 4.8 | | | | 3.8 | | | | 3.9 | | | | 3.9 | | | | 3.8 | |
| | | | | | | | | | | | | | | | | | | | |
| | | | | |
Total imports | | | 100.0 | | | | 100.0 | | | | 100.0 | | | | 100.0 | | | | 100.0 | |
Source: Central Bank.
Foreign Direct Investment
Peru has an open investment regime and a legal framework that generally promotes and protects foreign investment. The basis of this open investment regime was established in 1991 through the Foreign Investment Promotion Law and the Private Investment Growth Framework Law, as amended. This framework allows both foreign and domestic investors to enter into legal stability agreements with the Government. For a description of these measures, see “The Economy—Privatization and Role of the State in the Economy” above.
Peru attracted more than U.S.$33.0 billion in foreign direct investment between 2007 and 2011. Of this amount, U.S.$22.8 billion were for reinvestments, U.S.$7.1 billion for capital contributions and U.S.$3.1 billion net loans by foreign parent companies to their Peruvian subsidiaries. In 2007, foreign direct investment increased to U.S.$5.5 billion compared to U.S.$3.5 billion in 2006, due to reinvestment of earnings, capital contributions and privatizations in the mining and hydrocarbons sectors. In 2008, foreign direct investment increased to U.S.$6.9 billion, due to an increase of capital contributions. In 2009, foreign direct investment decreased to U.S.$5.6 billion, primarily due to a reduction in capital contributions and net loans by foreign parent companies to their Peruvian subsidiaries, which was partially offset by a higher level of reinvestment of earnings. During 2010, foreign direct investment increased to U.S.$7.3 billion compared to U.S.$5.6 billion in 2009, primarily due to an increase in reinvestment of earnings. In 2011, foreign direct investment increased to U.S.$7.7 billion, primarily due to an increase in net loans by foreign parent companies to their Peruvian subsidiaries.
Between 2007 and 2011, foreign direct investment grew 44.6%. This is primarily due to large scale reinvestments in mining companies, as a result of the earnings from the sustained price surge increase in metals. The industrial fishing and financial sectors have had important movements of capital. In the industrial sector, SAB Miller acquired Unión de Cervecerías Peruanas Backus y Johnston. In the fishing sector, Carmela acquired Pesquera Exalmar, and China Fishery Group acquired Pesquera Alexandra. In January 2008, Cencosud, a retailer with operations in Chile, Argentina and Brazil, acquired GSW S.A., owner of the largest food retailer in Peru, for approximately U.S.$500 million. Other important investments for an aggregate amount of U.S.$1.0 billion have been made during 2008 by Endesa of Spain, HSBC, Deutsche Bank, Pan Pacific Copper SN Power, DP World,
61
among others, in energy, finance, mining and transportation projects. The principal investors that made capital investments through share purchases or capital contributions during 2008-2009 are Cencosud (Chile), Endesa (Spain), Gold Fields Corona (United Kingdom), SN Power (Singapur), Compania Minera Latino-Americana Limitada—CMLA (Chile), Perenco (France), Gerdau (Brazil), Anglo American PLC (United Kingdom), Invercable S.A. (Chile), Asa Iberoamérica (Spain). Capital contributions reached U.S.$772.6 million, and the mining and financial sector were the ones with highest investment. In these sectors, companies like Mlski Mayo, Sider Peru, Michiquillay, Holding Continental, DP World Callao, Makro Supermayorista, Calida, Nextel, Falabella, Abengoa, Minera Quechua, HSBC and Pure Biofuels received capital contributions of more than U.S.$15 million, or 94% of all contributions received during 2009. In 2011, the principal investors were Peru Copper Syndicate Ltd. (United Kingdom), Dia Bras Exploration Inc. (Canada), Edyce S.A. (Chile), Capricorn Forest Funds Kls (Denmark), Inkia Holdings (Kallpa) Limited (United Kingdom), APM Terminals B.V. (Netherlands), Sandy S.A. (Switzerland), Bretton S.A. (Switzerland), Pan Pacific Cooper Co. Ltd (Japan), Odebretcht Participacoes e Investimentos S.A. (Brasil), Callao Port Holding NV (Netherland) and Ferrovias Sociedad Anónima Concesionaria (Argentina).
In the financial sector, the last years have seen increased activity by foreign investors. Favorable macroeconomic conditions have attracted new participants, such as HSBC Holdings PLC, Scotiabank (expanding in Peru through its acquisition of several banking institutions, including Banco del Trabajo in July 2008 and Profuturo AFP in June 2008), Banco Santander, S.A., Banco Azteca and Deutsche Bank AG. In addition, Financiera CMR S.A. and Financiera Cordillera, two major Peruvian non-deposit lending institutions controlled by retailers S.A.C.I. Falabella and Ripley Corp S.A. were converted into banks in June 2007 and January 2008, respectively, under the names of Banco Falabella Peru S.A. and Banco Ripley. In August 2010, the SBS authorized the operations of Leasing Peru, a subsidiary of the Bancolombia group (Colombia). In January 2011, Industrial and Comercial Bank of China (ICBC) requested authorization to open a branch, ICBC Peru Bank. Banco Latinoamericano de Comercio Exterior S.A. (Bladex) (Panama), Banco Itau (Brasil) and Bank of Tokyo—Mitsubishi UIF Ltd (Japan), are expected to enter the Peruvian financial sector with representative offices.
During 2007, Peru completed 12 privatizations and concession grants for U.S.$543.8 million, with U.S.$2.8 billion in projected investments. During 2008, Peru completed 15 privatizations and concession grants for U.S.$46.7 million, with U.S.$3.0 billion in projected investments. During 2009, Peru completed 13 privatizations and concessions for U.S.$29.9 million, with U.S.$1.6 billion in projected investments. During 2010, Peru completed 21 privatizations and concession grants for U.S.$179.5 million which generated U.S.$6.4 billion in projected investments. In 2011, Peru completed 15 privatizations and concession grants for U.S.$42.2 million which generated U.S.$4.1 billion in projected investments. For a description of these transactions see “Privatizations and Concessions” above.
For the 2012-2013 period and based on Peru’s privatization and concession initiatives, the Government has announced a portfolio of 26 projects for U.S.$10 billion to promote private investments. The projects include initiatives in ports, airports, highways, railways, energy, tourism, capital markets, mining, culture, agribusiness, telecommunications and sanitation.
The main recipients of foreign direct investment in 2011 have been the mining (24. 5%), finance (18.4%), communications (17.2%), industry (13.9%) and energy (13.1%) sectors.
Portfolio Investment
Flows of portfolio capital into and out of Peru fluctuated between 2007 and 2011.
| | • | | In 2007, Peru experienced portfolio capital inflows of U.S.$70 million, primarily due to the purchase of sovereign bonds by non-residents. |
| | • | | In 2008, Peru experienced portfolio capital inflows of U.S.$85 million, primarily due to an increase in investments by non-residents in local Peruvian securities. |
| | • | | In 2009, Peru experienced portfolio capital inflows of U.S.$47 million, primarily due to the purchase of local Peruvian securities by non-resident investors. |
62
| | • | | In 2010, Peru experienced portfolio capital inflows of U.S.$87 million, primarily due to the sale of local Peruvian securities by non-resident investors. |
| | • | | In 2011, Peru experience portfolio capital inflows of U.S.$147 million, primarily due to the purchase of local Peruvian securities by non-resident investors. |
The following table provides information, by sector, on the stock of foreign direct investments registered with Proinversión as of the dates indicated, which does not include loans or reinvestments. The stock of foreign direct investment refers to the level of foreign funds directly invested in the Peruvian economy as of the dates indicated and does not reflect investment flows.
Registered Stock of Foreign Direct Investment by Sector
(in millions of U.S. dollars at current prices)
| | | | | | | | | | | | | | | | | | | | |
| | | As of December 31, | |
| | | 2007(1) | | | 2008(1) | | | 2009(1) | | | 2010(1) | | | 2011(1) | |
| | | | | |
Agriculture | | | 44.40 | | | | 45.23 | | | | 45.23 | | | | 45.23 | | | | 45.23 | |
Commerce | | | 710.40 | | | | 725.68 | | | | 755.83 | | | | 786.70 | | | | 786.80 | |
Telecommunications | | | 3,751.15 | | | | 3,651.87 | | | | 3,699.65 | | | | 3,788.64 | | | | 3,788.64 | |
Construction | | | 161.88 | | | | 202.70 | | | | 222.94 | | | | 294.88 | | | | 294.88 | |
Energy | | | 1,672.99 | | | | 2,246.11 | | | | 2,619.89 | | | | 2,885.19 | | | | 2,893.92 | |
Finance | | | 2,564.85 | | | | 3,114.53 | | | | 3,235.47 | | | | 3,391.99 | | | | 3,556.10 | |
Industry | | | 2,803.09 | | | | 2,905.41 | | | | 3,046.84 | | | | 3,063.06 | | | | 3,064.60 | |
Mining | | | 2,747.72 | | | | 3,203.96 | | | | 4,120.03 | | | | 5,022.14 | | | | 5,384.05 | |
Fishing | | | 163.00 | | | | 163.00 | | | | 163.00 | | | | 163.01 | | | | 163.01 | |
Petroleum | | | 208.22 | | | | 361.68 | | | | 362.68 | | | | 559.13 | | | | 559.13 | |
Services | | | 420.73 | | | | 444.86 | | | | 526.92 | | | | 535.95 | | | | 541.45 | |
Forestry | | | 1.24 | | | | 1.24 | | | | 1.24 | | | | 1.24 | | | | 1.24 | |
Transportation | | | 248.45 | | | | 288.46 | | | | 308.46 | | | | 316.90 | | | | 331.94 | |
Tourism | | | 63.54 | | | | 63.80 | | | | 72.29 | | | | 76.55 | | | | 76.55 | |
Housing | | | 25.72 | | | | 526.95 | | | | 528.40 | | | | 529.90 | | | | 531.97 | |
| | | | | | | | | | | | | | | | | | | | |
Total | | | 15,587.38 | | | | 17,945.50 | | | | 19,708.87 | | | | 21,460.53 | | | | 22,019.52 | |
Source: Proinversión.
63
The following table provides information on the stock of foreign direct investment by country of origin in dollars, and as a percentage of total foreign direct investment, as registered with Proinversión or its predecessor agency, as of the dates shown.
Registered Stock of Foreign Direct Investment by Country of Origin
(in millions of U.S. dollars, at current prices)(1)
| | | | | | | | | | | | | | | | | | | | |
| | | As of December 31, | |
| | | 2007 | | | 2008 | | | 2009 | | | 2010 | | | 2011 | |
| | | | | |
Argentina | | | 29.77 | | | | 29.77 | | | | 29.77 | | | | 30.77 | | | | 33.01 | |
Australia | | | 6.92 | | | | 6.92 | | | | 6.92 | | | | 6.92 | | | | 6.92 | |
Austria | | | 5.90 | | | | 5.90 | | | | 5.90 | | | | 5.90 | | | | 5.90 | |
Bahamas | | | 198.53 | | | | 155.53 | | | | 155.53 | | | | 183.11 | | | | 183.11 | |
Belgium | | | 79.28 | | | | 79.28 | | | | 79.28 | | | | 79.28 | | | | 79.28 | |
Bolivia | | | 4.69 | | | | 4.75 | | | | 4.75 | | | | 4.75 | | | | 4.75 | |
Brazil | | | 337.42 | | | | 342.17 | | | | 493.23 | | | | 1,016.38 | | | | 1,021.88 | |
Canada | | | 274.59 | | | | 683.96 | | | | 683.96 | | | | 705.17 | | | | 845.17 | |
Chile | | | 471.99 | | | | 1,122.82 | | | | 1,315.42 | | | | 1,335.33 | | | | 1,347.97 | |
China | | | 147.27 | | | | 147.27 | | | | 147.30 | | | | 147.30 | | | | 147.81 | |
Colombia | | | 734.91 | | | | 741.58 | | | | 781.59 | | | | 1,048.65 | | | | 1,048.65 | |
Denmark | | | 0.72 | | | | 0.72 | | | | 0.72 | | | | 0.72 | | | | 10.14 | |
Ecuador | | | 62.26 | | | | 74.54 | | | | 78.93 | | | | 87.86 | | | | 87.86 | |
France | | | 52.98 | | | | 200.99 | | | | 207.95 | | | | 207.95 | | | | 207.95 | |
Germany | | | 109.39 | | | | 173.27 | | | | 173.27 | | | | 173.27 | | | | 173.27 | |
Italy | | | 119.50 | | | | 119.50 | | | | 119.51 | | | | 119.51 | | | | 119.51 | |
Japan | | | 116.79 | | | | 168.39 | | | | 187.39 | | | | 227.39 | | | | 233.79 | |
Korea | | | 44.82 | | | | 40.68 | | | | 40.68 | | | | 40.70 | | | | 40.70 | |
Liechtenstein | | | 19.33 | | | | 19.33 | | | | 19.33 | | | | 19.33 | | | | 19.33 | |
Luxembourg | | | 101.29 | | | | 98.28 | | | | 97.47 | | | | 272.42 | | | | 272.42 | |
Mexico | | | 447.67 | | | | 454.76 | | | | 464.76 | | | | 464.76 | | | | 464.76 | |
Netherlands | | | 1,179.68 | | | | 1,181.33 | | | | 1,349.94 | | | | 1,520.00 | | | | 1,532.80 | |
New Zealand | | | 6.85 | | | | 6.85 | | | | 6.85 | | | | 6.85 | | | | 6.85 | |
Panama | | | 887.70 | | | | 930.07 | | | | 932.00 | | | | 934.28 | | | | 924.02 | |
Portugal | | | 37.29 | | | | 37.29 | | | | 38.61 | | | | 38.61 | | | | 38.61 | |
Singapore | | | 123.50 | | | | 123.50 | | | | 365.50 | | | | 365.50 | | | | 365.50 | |
Spain | | | 3,734.02 | | | | 4,198.28 | | | | 4,303.29 | | | | 4,456.37 | | | | 4,458.54 | |
Sweden | | | 53.98 | | | | 64.18 | | | | 64.18 | | | | 66.56 | | | | 66.56 | |
Switzerland | | | 319.06 | | | | 335.34 | | | | 376387 | | | | 422.43 | | | | 436.62 | |
United Kingdom(2) | | | 3,029.42 | | | | 3,552.07 | | | | 3,894.09 | | | | 4,087.43 | | | | 4,450.82 | |
United States | | | 2,654.06 | | | | 2,655.39 | | | | 3,066.13 | | | | 3,166.38 | | | | 3,166.38 | |
Uruguay | | | 138.91 | | | | 133.26 | | | | 160.20 | | | | 160.20 | | | | 160.20 | |
Venezuela | | | 7.96 | | | | 7.96 | | | | 7.96 | | | | 7.96 | | | | 7.96 | |
Other | | | 48.93 | | | | 49.55 | | | | 49.60 | | | | 50.50 | | | | 50.50 | |
| | | | | | | | | | | | | | | | | | | | |
Total | | | 15,587.38 | | | | 17,945.50 | | | | 19,708.87 | | | | 21,460.53 | | | | 22,019.52 | |
| (1) | Updated as of December 2011. |
| (2) | Includes United Kingdom overseas territories. |
Source: Proinversión.
64
Registered Stock of Foreign Direct Investment by Country of Origin
(as a percentage of total direct investment, at current prices)(1)
| | | | | | | | | | | | | | | | | | | | |
| | | As of December 31, | |
| | | 2007 | | | 2008 | | | 2009 | | | 2010 | | | 2011(1) | |
| | | | | |
Argentina | | | 0.19 | | | | 0.17 | | | | 0.15 | | | | 0.14 | | | | 0.15 | |
Australia | | | 0.04 | | | | 0.04 | | | | 0.04 | | | | 0.03 | | | | 0.03 | |
Austria | | | 0.04 | | | | 0.03 | | | | 0.03 | | | | 0.03 | | | | 0.03 | |
Bahamas | | | 1.27 | | | | 0.87 | | | | 0.79 | | | | 0.85 | | | | 0.83 | |
Belgium | | | 0.51 | | | | 0.44 | | | | 0.40 | | | | 0.37 | | | | 0.36 | |
Bolivia | | | 0.03 | | | | 0.03 | | | | 0.02 | | | | 0.02 | | | | 0.02 | |
Brazil | | | 2.16 | | | | 1.91 | | | | 2.50 | | | | 4.74 | | | | 4.64 | |
Canada | | | 1.76 | | | | 3.81 | | | | 3.47 | | | | 3.29 | | | | 3.84 | |
Chile | | | 3.03 | | | | 6.26 | | | | 6.67 | | | | 6.22 | | | | 6.12 | |
China | | | 0.94 | | | | 0.82 | | | | 0.75 | | | | 0.69 | | | | 0.67 | |
Colombia | | | 4.71 | | | | 4.13 | | | | 3.97 | | | | 4.89 | | | | 4.76 | |
Denmark | | | 0.00 | | | | 0.00 | | | | 0.00 | | | | 0.00 | | | | 0.05 | |
Ecuador | | | 0.40 | | | | 0.42 | | | | 0.40 | | | | 0.41 | | | | 0.40 | |
France | | | 0.34 | | | | 1.12 | | | | 1.06 | | | | 0.97 | | | | 0.94 | |
Germany | | | 0.70 | | | | 0.97 | | | | 0.88 | | | | 0.81 | | | | 0.79 | |
Italy | | | 0.77 | | | | 0.67 | | | | 0.61 | | | | 0.56 | | | | 0.54 | |
Japan | | | 0.75 | | | | 0.94 | | | | 0.95 | | | | 1.06 | | | | 1.06 | |
Korea | | | 0.29 | | | | 0.23 | | | | 0.21 | | | | 0.19 | | | | 0.18 | |
Liechtenstein | | | 0.12 | | | | 0.11 | | | | 0.10 | | | | 0.09 | | | | 0.09 | |
Luxembourg | | | 0.65 | | | | 0.55 | | | | 0.49 | | | | 1.27 | | | | 1.24 | |
Mexico | | | 2.87 | | | | 2.53 | | | | 2.36 | | | | 2.17 | | | | 2.11 | |
Netherlands | | | 7.57 | | | | 6.58 | | | | 6.85 | | | | 7.08 | | | | 6.96 | |
New Zealand | | | 0.04 | | | | 0.04 | | | | 0.03 | | | | 0.03 | | | | 0.03 | |
Panama | | | 5.69 | | | | 5.18 | | | | 4.73 | | | | 4.35 | | | | 4.20 | |
Portugal | | | 0.24 | | | | 0.21 | | | | 0.20 | | | | 0.18 | | | | 0.18 | |
Singapore | | | 0.79 | | | | 0.69 | | | | 1.85 | | | | 1.70 | | | | 1.66 | |
Spain | | | 23.96 | | | | 23.39 | | | | 21.83 | | | | 20.77 | | | | 20.25 | |
Sweden | | | 0.35 | | | | 0.36 | | | | 0.33 | | | | 0.31 | | | | 0.30 | |
Switzerland | | | 2.05 | | | | 1.87 | | | | 1.91 | | | | 1.97 | | | | 1.98 | |
United Kingdom(2) | | | 19.44 | | | | 19.79 | | | | 19.76 | | | | 19.05 | | | | 20.21 | |
United States | | | 17.03 | | | | 14.80 | | | | 15.56 | | | | 14.75 | | | | 14.38 | |
Uruguay | | | 0.89 | | | | 0.74 | | | | 0.81 | | | | 0.75 | | | | 0.73 | |
Venezuela | | | 0.05 | | | | 0.04 | | | | 0.04 | | | | 0.04 | | | | 0.04 | |
Other | | | 0.31 | | | | 0.28 | | | | 0.25 | | | | 0.24 | | | | 0.23 | |
| | | | | | | | | | | | | | | | | | | | |
Total | | | 100.00 | | | | 100.00 | | | | 100.00 | | | | 100.00 | | | | 100.00 | |
| (1) | Updated as of December 2011. |
| (2) | Includes United Kingdom overseas territories. |
Source: Proinversión.
The principal sources of direct investment in Peru by country of origin in 2011 were Spain, the United States and the United Kingdom. Together they represent 54.84% of total foreign direct investment in 2011, compared to 54.57% in 2010.
65
THE MONETARY SYSTEM
Central Bank
Established in 1922, the Central Bank serves as Peru’s monetary authority. The Central Bank exists and operates under Chapter V of the 1993 Constitution and the Ley Orgánica del Banco Central de Reserva del Perú, or the Central Bank’s charter, enacted that same year. The 1993 Constitution and the Central Bank’s charter establish that the goal of the Central Bank is to maintain price stability. Congress vested the Central Bank with the authority to regulate Peru’s monetary base, manage Peru’s international reserves and gather and publish data on Peru’s finances. The Central Bank is also the sole issuer of nuevo Sol.
The Central Bank is headed by a board of directors composed of seven members who each serve five-year terms that are coterminous with the Peruvian President’s term. Congress appoints three of the Central Bank’s directors, and the Executive Branch appoints four, including the president of the Central Bank’s board. Appointment of the president of the Central Bank’s board is subject to ratification by Congress. The Central Bank’s charter requires directors of the Central Bank to have extensive experience in and knowledge of economics and finance. The responsibility of the Central Bank’s board is to formulate a monetary program consistent with the Central Bank’s mandate to maintain price stability.
The Central Bank’s daily operations are under the supervision of its General Manager and the Money and Foreign Exchange Committee. This committee meets daily to make decisions regarding monetary operations, such as the amount of U.S. dollars to be purchased in the foreign exchange market, whether to auction Central Bank certificates of deposit and the interest rate that the Central Bank will charge on short-term credits, which is generally known as the discount rate.
Reform of the Central Bank and of Peru’s monetary policy has been a centerpiece of the economic program Peru began in the early 1990s. These reforms were based on the following two key elements that were promulgated under the 1993 Constitution and the Central Bank’s charter:
| | • | | the Central Bank’s principal purpose is to maintain price stability by preserving the value of the currency; and |
| | • | | the Central Bank possesses full autonomy. |
These reforms were implemented to address the high rates of inflation that Peru, along with other South American countries, experienced during the 1980s and early 1990s. The premise underlying these reforms was that the Central Bank could contribute most effectively to economic prosperity by focusing its activities on achieving price stability. Prior to these reforms, the Central Bank operated under a much broader mandate that made it directly responsible for fueling growth and for establishing credit and exchange rate conditions. Pursuit of these broader and occasionally incompatible objectives resulted in erratic policy choices that exacerbated adverse economic conditions and contributed to the hyperinflation experienced in the late 1980s and early 1990s.
The Central Bank was granted autonomy based on the belief that, to operate effectively, the Central Bank must be immune from political pressures. In the past, the Central Bank had often been required to pursue ill-advised policies, such as printing currency in order to finance public spending, as a result of government intervention. Since the reforms were implemented, technical rather than political management of Peru’s monetary policy has built confidence in the Government’s ability to formulate and implement a sound and stable monetary policy.
The 1993 Constitution and the Central Bank’s charter guarantee the autonomy of the Central Bank by prohibiting it from:
| | • | | providing financing to the public sector, except indirectly through limited purchases of treasury bonds; |
| | • | | issuing guarantee certificates, surety bonds or any other kind of guarantees, using any other form of indirect financing, or providing insurance of any kind; |
66
| | • | | imposing sector or regional ratios on the composition of the loan portfolios of financial institutions; and |
| | • | | establishing multiple currency exchange regimes. |
The reform of the Central Bank’s role has been instrumental in the sharp decline in inflation experienced during the 1990s. Between 1994 and 2000, the Central Bank met or slightly exceeded its annual inflation targets. Since 2001, the Central Bank has maintained a restrictive monetary policy that produced a marked deceleration in the growth rate of the CPI, which was 3.9% in 2007, 6.7% in 2008, 0.2% in 2009, 2.1% in 2010 and 4.7% in 2011. This relatively stable rate of inflation has fostered confidence in the stability of the Peruvian currency.
Monetary Policy
The Central Bank’s primary goal is to maintain a stable monetary environment. To conduct monetary policy, the Central Bank has established a target inflation rate and has announced this target rate in order to shape market expectations. The Central Bank’s target annual inflation rate for 2012 is 2%, with a tolerance of one percentage point below (1%) and above (3%).
Decisions on monetary policy are translated into changes in an operational target chosen by the Central Bank. Since 2001, the Central Bank has gradually changed its monetary policy from a monetary base growth control scheme to an interbank interest rate control scheme. As a result, the volatility of the interbank interest rate has diminished continuously. The reduction in the volatility of the interbank interest rate has significantly reinforced the influence of this rate over the other banks’ interest rates. Even during 2001 and 2002, while monetary policy targeted the amount of demand deposits held by commercial banks at the Central Bank, it announced the reference interbank interest rate range. The upper limit of the reference interbank interest rate range is the interest rate for direct repos and the rediscount rate and the lower limit correspond to the interest rate for overnight deposits by commercial banks at the Central Bank.
Under the Central Bank’s charter, interest rates float freely in the Peruvian economy and are determined by market conditions. Only in exceptional circumstances may the Central Bank establish minimum and maximum interest rates. Since January 2003, the Central Bank has released its monetary policy decisions regarding the Central Bank’s interest rates for discount window operations and deposit facilities with commercial banks. These interest rates are intended to establish a reference rate for the interbank market.
The following table provides information on interest rates applicable to commercial bank loans as of the dates shown.
Interest Rates on Commercial Bank Loans
(annual percentage rates)
| | | | | | | | | | | | | | | | | | | | |
| | | As of December 31, | |
| | | 2007 | | | 2008 | | | 2009 | | | 2010 | | | 2011 | |
Domestic currency: | | | | | | | | | | | | | | | | | | | | |
Interbank | | | 5.0 | | | | 6.5 | | | | 1.2 | | | | 3.0 | | | | 4.2 | |
Prime(1) | | | 5.6 | | | | 7.5 | | | | 1.7 | | | | 3.6 | | | | 5.4 | |
Average loan rate | | | 22.3 | | | | 23.0 | | | | 19.9 | | | | 18.7 | | | | 18.9 | |
| | | | | |
Foreign currency: | | | | | | | | | | | | | | | | | | | | |
Interbank | | | 5.9 | | | | 1.0 | | | | 0.2 | | | | 1.1 | | | | 0.3 | |
Prime(1) | | | 6.4 | | | | 5.2 | | | | 1.2 | | | | 2.1 | | | | 2.4 | |
Average loan rate | | | 10.5 | | | | 10.5 | | | | 8.6 | | | | 8.5 | | | | 7.8 | |
| (1) | Considers only the prime rate on loans to the corporate sector. |
Source: Central Bank.
67
The increase in interest rates on domestic currency loans since June 30, 2003 was a result of the restructuring of domestic currency loans in favor of the loans with the highest interest rates. At the end of 2007, the average interest rate on domestic currency loans and foreign currency loans was 22.3% and 10.5%, respectively. As of December 31, 2008, the average interest rate on domestic currency loans and foreign currency loans was 23.0% and 10.5%, respectively. As of December 31, 2009, the average interest rate on domestic currency loans and foreign currency loans was 19.9% and 8.6%, respectively. As of December 31, 2010, the average interest rate on domestic currency loans decreased to 18.7%, while the rate on foreign currency loans decreased to 8.5%. As of December 31, 2011, the average interest rate on domestic currency loans increased to 18.9%, while the rate on foreign currency loans decreased to 7.8%.
The following table provides information on interest rates applicable to deposits as of the dates shown.
Interest Rates on Deposits Paid by Commercial Bank
(annual percentage rates)
| | | | | | | | | | | | | | | | | | | | |
| | | As of December 31, | |
| | | 2007 | | | 2008 | | | 2009 | | | 2010 | | | 2011 | |
Domestic currency: | | | | | | | | | | | | | | | | | | | | |
Saving deposits | | | 1.5 | | | | 1.4 | | | | 0.7 | | | | 0.5 | | | | 0.6 | |
Time deposits(1) | | | 5.3 | | | | 6.4 | | | | 1.8 | | | | 2.9 | | | | 4.1 | |
Average deposits rate(2) | | | 3.3 | | | | 3.8 | | | | 1.6 | | | | 1.8 | | | | 2.5 | |
| | | | | |
Foreign currency: | | | | | | | | | | | | | | | | | | | | |
Saving deposits | | | 0.8 | | | | 0.8 | | | | 0.4 | | | | 0.3 | | | | 0.3 | |
Time deposits(1) | | | 3.8 | | | | 4.0 | | | | 1.1 | | | | 1.2 | | | | 1.0 | |
Average deposits rate(2) | | | 2.5 | | | | 1.9 | | | | 0.9 | | | | 0.8 | | | | 0.7 | |
| (1) | Time deposits for 31 to 179 days. |
| (2) | The average of the TIPMN rate published daily by SBS. The TIPMN is the average deposit rate in domestic currency expressed in annual effective terms. |
Source: Central Bank.
In 2007, the average interest rate on domestic currency deposits and foreign currency deposits was 3.3% and 2.5%, respectively. As of December 31, 2008, the average interest rate on domestic currency deposits and foreign currency deposits was 3.8% and 1.9%, respectively. As of December 31, 2009, the average interest rate on domestic currency deposits and foreign currency deposits was 1.6% and 0.9%, respectively. As of December 31, 2010, the average interest rate on domestic currency deposits and foreign currency deposits was 1.8% and 0.8%, respectively. As of December 31, 2011, the average interest rate on domestic currency deposits and foreign currency deposits was 2.5% and 0.7%, respectively.
The Central Bank employs several tools to implement its monetary operations. These tools fall into the following three major categories:
| | • | | open market operations, which include: |
| | • | | auctions to financial institutions of Central Bank certificates of deposit (CDBCRP) and indexed certificates of deposit (CDR) (indexed to the exchange rate); |
| | • | | temporary purchases of Central Bank certificates of deposits and of treasury bonds; and |
| | • | | purchases and sales of foreign currencies in the interbank market; |
| | • | | discount-window transactions, which include: |
| | • | | monetary regulation loans, generally known as rediscounts, which consist of short-term loans made directly by the Central Bank to financial institutions to cover their short-term liquidity needs; |
68
| | • | | overnight foreign currency swaps that allow the Central Bank to provide financial institutions with short-term liquidity; and |
| | • | | remunerated overnight deposits in the Central Bank, in both domestic and foreign currencies, which allow the Central Bank to remove excess liquidity from the banking system; |
| | • | | minimum reserve requirements. |
As of December 2011, the minimum reserve requirement for local and foreign currency deposits was 9%. Foreign currency deposits were subject to a 55% marginal rate (local currency deposits were subject to a 25% marginal rate). On average, 14% of local currency deposits and 38% of total foreign currency deposits were kept as reserves. Financial institutions may satisfy the minimum reserve requirements with funds that they hold in vaults or that they have on deposit in their accounts at the Central Bank. Financial institution also must maintain at least 3% of local and foreign currency deposited in the Central Bank.
The Central Bank relies primarily on open market operations to regulate the liquidity of the banking system and promotes the perception of the Central Bank as a lender of last resort by imposing above-market rates and commissions on discount-window transactions.
The significant volatility of short term capital flows has been a destabilizing factor in Peru’s monetary system since 1998 when large capital outflows occurred following the Russian financial crisis. Between 1999 and 2004, short-term capital fluctuated between a high of U.S.$230 million of inflows in 2004 to U.S.$1.5 billion of outflows in 1999. Short-term capital outflow was U.S.$2.1 billion during 2009, U.S.$258 million during 2010 and U.S.$1.3 billion during 2011. However, the short-term capital inflow was U.S.$2.1 billion during 2007, U.S.$562 million during 2008. To confront the volatility of short-term capital flows, the Central Bank generally requires high foreign currency reserve requirements that discourage significant capital outflows and promote holdings of local currency. Since January 2008, the issuance of BCRP certificates of deposit with restricted negotiation in order to avoid speculation against the dollar in the local market, began. This type of certificate can only be purchased by domestic financial institutions in primary placements.
Despite the positive impact that it may have on reducing cross-border transaction costs and preserving purchasing power, the high level of dollarization of the financial system has also increased the vulnerability of the economy (currency risk and liquidity risk). Dollarization generally refers the degree to which the U.S. dollar has displaced the nuevo Sol in the economy. Dollarization began during the 1980s as inflation rates started to rise. As inflation reached triple-digit rates between 1983 and 1985, foreign currency-denominated assets were increasingly used to store value. By 1990, when the annual inflation rate had reached 7,650%, 47% of total deposits in the domestic financial system, and 76% of total deposits held by Peruvians domestically and abroad, were denominated in U.S. dollars. Since the 1990s, the Peruvian economy has remained highly dollarized, but in the past few years the ratio of dollarization has followed a diminishing trend.
As of December 31, 2011, U.S. dollar-denominated deposits equaled 40.71% of total deposits in the financial system (at the end of 2010, they represented 41.45%, compared to 48.35% at the end of 2009). At the same time, U.S. dollar-denominated credits in the private sector decreased to 44.71% of total credits in the financial system (45.43% at the end of 2010 and 46.50% at December 31, 2009). The continued demand for nuevo Sol in the vast majority of transactions that take place in the Peruvian economy has preserved the nuevo Sol as the main channel through which the Central Bank can affect aggregate demand and thus control inflation. The Central Bank expects that as it continues to meet its inflation targets, confidence in the value of the local currency will grow, gradually restoring the nuevo sol as the principal means of savings.
69
The following table provides the bank credit to the private sector for the periods shown.
Bank Credit to the Private Sector
(as percentage of total credit)
| | | | | | | | | | | | | | | | |
| | | Private Commercial Banks | | | Public Sector Banks | |
| | | S/. | | | Foreign Currency | | | S/. | | | Foreign Currency | |
| | | | |
2007 | | | 36.6 | | | | 59.1 | | | | 3.6 | | | | 0.7 | |
2008 | | | 42.0 | | | | 54.9 | | | | 2.6 | | | | 0.6 | |
2009 | | | 46.5 | | | | 50.2 | | | | 2.8 | | | | 0.5 | |
2010 | | | 48.4 | | | | 48.2 | | | | 3.0 | | | | 0.5 | |
2011 | | | 48.1 | | | | 49.0 | | | | 2.6 | | | | 0.4 | |
Source: Central Bank.
The Banking Law and the charter of the SBS, as defined below, provide that financial companies may freely establish interest rates and the commissions they charge on loans, deposits and other services they provide.
Supervision of the Financial System
Established in 1931, the Superintendencia de Banca, Seguros y Administradoras Privadas de Fondos de Pensiones, or Banking, Insurance and AFP Superintendency, or the SBS, is responsible for regulating and supervising the financial, insurance and private pension systems in Peru. Since 1979, the SBS has had institutional autonomy from the Ministry of Economy and Finance. In 1981, the first Ley Orgánica de la Superintendencia de Banca y Seguros, or Banking and Insurance Superintendency Charter and Banking and Insurance Law, was adopted, which outlined in greater detail the powers and functions of the SBS. The role of the SBS was expanded in 2000 when it was given jurisdiction over the private pension system. In September 2007, the Financial Intelligence Unit, a specialized unit in charge of preventing money laundering and the financing of terrorism, was incorporated to the SBS.
The overarching goal of the SBS is to protect the interests of customers, depositors and beneficiaries of the financial, insurance and private pension systems, by ensuring the solvency and integrity of the companies that operate in these sectors. The SBS has pursued this goal from a free-market perspective, stepping away from the interventionist model that characterized the financial industry until the early 1990s. Accordingly, the SBS has sought to create incentives for financial institutions to manage adequately their levels of risk, while imposing minimum standards to ensure that the integrity and solvency of the industry are not jeopardized.
Under current banking law, and the regulatory norms and guidelines adopted by the SBS, financial institutions are subject to the following three basic kinds of regulations:
| | • | | Market-entry requirements designed to ensure that the regulated entities have minimal capital levels to conduct their business and are otherwise reliable financial agents. In particular, the Banking Law requires that commercial banks have a minimum capital base of S/.24.9 million, or approximately U.S.$9.2 million, for the fourth quarter of 2011 (readjusted quarterly based on the wholesale price index), and be managed by competent teams composed of persons of high integrity, aptitude and expertise in their particular fields. |
| | • | | Prudential standards designed to ensure that the quality of the financial system’s loan portfolio meets minimum levels. These prudential standards include the following requirements: |
| | • | | Strict limits on credit concentration. Financial institutions may not lend an amount equal to or greater than 10% of their capital to any single person or entity. This limit may be raised to 30% depending on the kind of guarantee or security offered. Additionally, financial institutions may not lend more than 5% of their capital to any single person or entity residing abroad. This limit may be raised to 10% depending on the kind of guarantee or security offered. The 1996 Banking Law also prescribes special limits for particular kinds of credits, such as loans to affiliates and other foreign and domestic financial institutions. |
70
| | • | | Capital adequacy ratios. The regulatory capital may be no less that 10% of risk-weighted assets of financial institutions (calculated for three major components of risk that a bank faces: credit risk, market risk and operational risk) which is stricter than the Basel Accord guidelines. |
| | • | | Loan-loss reserve requirements. These requirements, which are strictly enforced, range from a minimum 1.1% reserve for loans with normal risk levels when the cyclical rule is activated, to a maximum 100% reserve for loans classified as a loss. |
| | • | | Disclosure requirements designed to regulators, economic agents in other sectors of the economy and the public, with sufficient information to evaluate the activities of financial institutions. The principal requirements include the following: |
| | • | | Banks must register their shares on the Bolsa de Valores de Lima, or Lima Stock Exchange, or BVL, and thereby become subject to the disclosure guidelines established by the Superintendencia de Mercado de Valores, or Peruvian Securities Superintendency (formerly the Comisión Nacional Supervisora de Empresas y Valores). |
| | • | | Banks must publish their quarterly financial statements in major newspapers. |
| | • | | Banks must have two credit rating agencies assess their overall risk, which are published in a major newspapers semiannually. |
With respect to loan-loss reserve requirements, current risk classifications of loans to corporate, large and medium enterprises take into consideration primarily a cash flow analysis of the borrower, how long payments are overdue and the classification of the borrower by other financial entities. The borrower’s cash flow is based on the level of solvency, economic trends in its line of business and the quality of the borrower’s management and control systems. In the case of consumer, small and micro enterprises and mortgage loans, the risk classification is only based on the number of days payments are overdue. Additionally, guarantees or collateral may affect the specific level of reserves that must be maintained with respect to a particular loan.
71
The following table provides the risk-classification scheme mandated by the SBS.
| | |
Risk Category | | Criteria |
| |
Normal: | | |
Corporate, large and medium enterprises loans | | 0 days past due, high solvency, growing economic sector and adequate management and control systems. |
Small and micro enterprises loans | | Up to 8 days past due |
Consumer loans | | Up to 8 days past due. |
Mortgage loans | | Up to 30 days past due. |
| |
Potential problems: | | |
Corporate, large and medium enterprises loans | | Up to 60 days past due, based on cash flow analysis the company is able to fulfill all of its financial obligations, exhibits moderate solvency and adequate management and control systems, but is part of a temporarily destabilized economic sector. |
Small and micro enterprises loans | | 9 to 30 days past due. |
Consumer loans | | 9 to 30 days past due. |
Mortgage loans | | 31 to 90 days past due. |
| |
Deficient: | | |
Corporate, large and medium enterprises loans | | 60 to 120 days past due, moderate to low solvency, unclear tendency in economic sector and inadequate management and control systems. |
Small and micro enterprises loans | | 31 to 60 days past due. |
Consumer loans | | 31 to 60 days past due. |
Mortgage loans | | 91 to 120 days past due. |
| |
Doubtful: | | |
Corporate, large and medium enterprises loans | | 121 to 365 days past due, low solvency, falling revenues in economic sector and inadequate management and control systems. |
Small and micro enterprises loans | | 61 to 120 days past due. |
Consumer loans | | 61 to 120 days past due. |
Mortgage loans | | 121 to 365 days past due. |
| |
Loss: | | |
Corporate, large and medium enterprises loans | | More than 365 days past due, debtor insolvent, structural problems in economic sector and inadequate management and control systems. |
Small and micro enterprises loans | | More than 120 days past due. |
Consumer loans | | More than 120 days past due. |
Mortgage loans | | More than 365 days past due. |
Source: SBS.
72
The following table presents the minimum required loan-loss reserves by risk category.
Required Loan-Loss Reserves by Risk Category and Type of Loan
(as a percentage of total portfolio as of December 31, 2011)
| | | | | | | | |
| | | Loan-loss reserves for Normal Loans |
Type of Loan | | Rate | | Procyclical component(1) |
Corporate and large enterprises loans | | 0.70 | | 0.4 or 0.45(2) |
Medium enterprises loans | | 1.00 | | 0.30 |
Small and micro enterprises loans | | 1.00 | | 0.50 |
Consumer loans | | 1.00 | | 1 or 1.5(3) |
Mortgage loans | | 0.70 | | 0.40 |
| | | | | | | | | | | | |
| | | Loan-loss reserves for Loans other than Normal Loans(4) | |
| | | With liquid guarantee | | | With other guarantee | | Without guarantee | |
Potential problems | | | 1.25 | | | 2.50 | | | 5.00 | |
Deficient | | | 6.25 | | | 12.50 | | | 25.00 | |
Doubtful | | | 15.00 | | | 30.00 | | | 60.00 | |
Loss | | | 30.00 | | | 60.00 | | | 100.00 | |
| (1) | The procyclical component has a direct relationship to fluctuations in GDP. The procyclical rule activates when GDP has a significant and constant growth and deactivates when it does not. |
| (2) | For corporate procyclical rate is 0.4% and for loans to large enterprises procyclical rate is 0.45%. |
| (3) | For non-revolving consumption loans the rate is 1%; and for revolving loans the rate is 1.5%. |
| (4) | The required loan-loss reserves for loans guaranteed with highly liquid guarantees is 1%. |
Source: SBS.
The following tables provide information regarding loans of the financial system by risk category and type of institution and loans issued by commercial banks by risk category and type of loan.
Risk Classification of Loan Portfolio of the Financial System by Type of Institution
(as a percentage of total loans, as of December 31, 2011)
| | | | | | | | | | | | | | | | | | | | | | | | | | | | |
| | | | | | | | | Savings and loans
associations | | | Small-
business
development
banks | | | Financial
leasing
companies | | | Total | |
Risk category | | Commercial
banks | | | Finance
Companies | | | Municipal | | | Rural | | | | |
| | | | | | | |
Normal | | | 94.62 | | | | 89.65 | | | | 88.72 | | | | 89.26 | | | | 90.59 | | | | 96.84 | | | | 93.96 | |
Potential problems | | | 2.43 | | | | 3.63 | | | | 3.64 | | | | 3.79 | | | | 2.80 | | | | 2.22 | | | | 2.57 | |
Deficient | | | 0.91 | | | | 2.05 | | | | 1.58 | | | | 1.75 | | | | 1.23 | | | | 0.33 | | | | 1.01 | |
Doubtful | | | 1.04 | | | | 2.41 | | | | 1.90 | | | | 1.83 | | | | 1.44 | | | | 0.20 | | | | 1.16 | |
Loss | | | 1.00 | | | | 2.27 | | | | 4.16 | | | | 3.37 | | | | 3.94 | | | | 0.41 | | | | 1.30 | |
| | | | | | | | | | | | | | | | | | | | | | | | | | | | |
Total | | | 100.00 | | | | 100.00 | | | | 100.00 | | | | 100.00 | | | | 100.00 | | | | 100.00 | | | | 100.00 | |
Source: SBS.
Risk Classification of Loan Portfolio of Commercial Banks
(as a percentage of total loans, as of December 31, 2011)
| | | | | | | | | | | | | | | | | | | | | | | | | | | | |
Risk category | | Corporate
Loans | | | Large
enterprises
loans | | | Medium
enterprises
loans | | | Small
enterprises
loans | | | Micro
enterprises
loans | | | Consumer
loans | | | Mortgage
loans | |
| | | | | | | |
Normal | | | 99.09 | | | | 96.10 | | | | 93.46 | | | | 89.70 | | | | 94.24 | | | | 88.85 | | | | 95.61 | |
Potential problems | | | 0.89 | | | | 3.27 | | | | 3.03 | | | | 3.44 | | | | 2.26 | | | | 3.34 | | | | 1.59 | |
Deficient | | | 0.01 | | | | 0.39 | | | | 1.17 | | | | 1.66 | | | | 1.00 | | | | 2.28 | | | | 0.87 | |
Doubtful | | | 0.01 | | | | 0.15 | | | | 0.93 | | | | 1.95 | | | | 1.29 | | | | 3.55 | | | | 0.87 | |
Loss | | | 0.00 | | | | 0.10 | | | | 1.42 | | | | 3.25 | | | | 1.20 | | | | 1.98 | | | | 1.06 | |
| | | | | | | | | | | | | | | | | | | | | | | | | | | | |
Total | | | 100.00 | | | | 100.00 | | | | 100.00 | | | | 100.00 | | | | 100.00 | | | | 100.00 | | | | 100.00 | |
Source: SBS.
73
The following table provides the status of loans in the financial system.
Status of Loans in the Financial System
(as a percentage of total loans, as of December 31, 2011)
| | | | | | | | | | | | | | | | | | | | |
Type of institution | | Current loans | | | Refinanced and
restructured
loans | | | Loans past
due | | | Loans
subject to
judicial
process | |
| | Short-term | | | Long-term | | | | |
| | | | | |
Commercial banks | | | 36.6 | | | | 61.0 | | | | 1.0 | | | | 0.9 | | | | 0.6 | |
Financial companies | | | 33.8 | | | | 61.8 | | | | 1.0 | | | | 3.0 | | | | 0.5 | |
Savings and loans associations: | | | | | | | | | | | | | | | | | | | | |
Municipal | | | 29.7 | | | | 63.5 | | | | 1.9 | | | | 2.3 | | | | 2.7 | |
Rural | | | 32.3 | | | | 61.6 | | | | 1.8 | | | | 2.4 | | | | 1.9 | |
Small-business development banks | | | 26.9 | | | | 67.2 | | | | 0.8 | | | | 3.1 | | | | 1.9 | |
Financial leasing companies | | | 18.1 | | | | 81.2 | | | | 0.0 | | | | 0.3 | | | | 0.3 | |
| | | | | | | | | | | | | | | | | | | | |
Total | | | 35.8 | | | | 61.3 | | | | 1.1 | | | | 1.1 | | | | 0.7 | |
Source: SBS.
The SBS performs its supervisory role in the following two principal manners:
| | • | | Supervision of regulated entities through on-site and off-site inspections. The SBS systematically reviews and analyzes the information that financial institutions are required to disseminate through the media and the Peruvian Securities Superintendency. Off-site inspections look to information disclosed by the supervised companies to ensure that the companies comply with applicable regulations, to review the management of the supervised financial institutions, and to identify risk factors that might indicate potential future problems. The SBS also conducts on-site inspections at least once a year. During such visits the SBS may conduct either a general evaluation of the financial institution or a review of specific issues. |
| | • | | Assessments made by third parties. The SBS regularly reviews the analyses of regulated entities conducted by auditors, foreign and domestic credit-rating agencies and other foreign and domestic supervisory agencies. These reviews allow the SBS to gain a broader perspective of the activities and performance of the Peruvian financial sector and to identify areas of concern. |
In 1991, Peru introduced the Fondo de Seguros de Depósitos, or Deposit Insurance Fund, which, as of December 31, 2011, insures deposits in the financial system up to S/.91,621.0, or approximately U.S.$33,971.4 (readjusted quarterly based on the wholesale price index), per person, for each financial institution member of the Deposit Insurance Fund. The introduction of the Deposit Insurance Fund eased some of the burdens created by several closures of deficient banks that resulted from the banking reforms undertaken by Peru.
Financial Sector
Prior to 1990, Peru’s regulation of the financial system was characterized by interventionist measures that limited and directed the activities of banks, restricted foreign competition and prevented profit remittances and credit payments abroad. This regulatory environment undermined competition in the financial services industry and limited the supply of medium- and long-term credit.
As part of its economic program, the Fujimori administration undertook to overhaul Peru’s financial system. Its first measures included liberalizing interest rates and eliminating exchange rate controls. In 1996, Congress passed Ley General del Sistema Financiero y del Sistema de Seguros y Orgánica de la Superintendencia de Banca y Seguros, or the Banking Law, which:
| | • | | adopted a policy of nondiscrimination among foreign and national banks, and state and private banks; |
| | • | | opened the financial market to foreign banks and insurance companies; |
74
| | • | | liberalized market-entry barriers for domestic banks; and |
| | • | | tightened prudential standards and disclosure requirements. |
As of December 31, 2011, the Peruvian financial system was composed of 82 financial institutions, including:
| | • | | 15 full service commercial banks; |
| | • | | 13 municipal and 11 rural savings and loan associations; |
| | • | | 10 small-business development non-bank institutions; |
| | • | | 2 financial leasing companies; |
| | • | | 14 insurance companies: |
| | • | | 4 private pension fund managers; and |
| | • | | 4 state-owned entities (not including the Central Bank), Banco de la Nación, the Corporación Financiera de Desarrollo, or COFIDE, Banco Agropecuario and Fondo MiVivienda. |
Of the 15 full service commercial banks in operation, 13 were partly foreign-owned and in 10 of these, foreign owners held a majority equity stake. As of December 31, 2011, other institutions supervised by the SBS included two mortgage management companies, eight money transfer companies, four general deposit warehouses, one trust company, one surety and bonding house and two cash transportation, custody and management companies.
Established in 1966, Banco de la Nación is a state-owned bank that offers a variety of services to the public sector, including regional governments and local governments. These services include:
| | • | | collecting taxes on behalf of various governmental agencies; |
| | • | | making payments and transfers on behalf of the Government; |
| | • | | serving as paying and centralized collection agent for Peru’s internal indebtedness and its medium- and long-term external indebtedness; and |
| | • | | providing banking and foreign exchange services for the Government’s foreign trade transactions. |
Established in 1971, COFIDE is a state-owned development bank that specializes in providing credit to the financial sector. Through these credits, COFIDE is expected to promote private sector credit for the various sectors of the economy.
Established in 2001, Banco Agropecuario is a state-owned bank that provides credit services to the agriculture, cattle-ranch and aquaculture sectors, and to the activities of transformation and commercialization of products of the farming and aquaculture sectors.
Established in 2006, Fondo MiVivienda is a state-owned enterprise that provides financing to financial intermediaries, such as full service commercial banks, with the objective to promote the development of housing projects and to facilitate access to mortgage loans.
75
During 2006, 2007 and 2008, the Peruvian financial system experienced several important events. In May 2006, Scotiabank Perú S.A. was created as a result of the merger of Banco Sudamericano and Banco Wiese Sudameris. In October 2006, October 2007, January 2008 and June 2008, HSBC Bank Perú S.A., Santander Perú S.A., Banco Azteca del Perú S.A. and Deutsche Bank (Perú) S.A., respectively, were authorized to start operations as full service commercial banks in Peru. In addition, two finance companies related to retailers were authorized to start operating as full service banks in June 2007 and January 2008.
In 2009 and 2010, three small business development banks were authorized to start operating as finance companies. Also in 2010 two new finance companies began operations. In 2011 the number of microfinance institutions increased as a result of the creation of a new municipal saving association in October 2011.
The following table presents the percentage of loans and deposits corresponding to each category of financial institution as of December 31, 2011.
Loans and Deposits
(as a percentage of total loans and total deposits)
| | | | | | | | | | | | | | | | |
Type of Institution | | As of December 31, 2011 | |
| | | Loans | | | Deposits | |
| | | S/. | | | U.S.$ | | | S/. | | | U.S.$ | |
Rural savings and loans | | | 2.1 | | | | 0.2 | | | | 1.9 | | | | 0.3 | |
Municipal savings and loans | | | 10.4 | | | | 1.5 | | | | 8.4 | | | | 2.2 | |
Financial leasing companies | | | — | | | | 0.5 | | | | — | | | | — | |
Non-deposit lending institutions | | | 7.0 | | | | 1.1 | | | | 2.7 | | | | 0.3 | |
Commercial banks | | | 73.3 | | | | 96.3 | | | | 71.0 | | | | 92.8 | |
Small business development banks | | | 1.2 | | | | 0.1 | | | | — | | | | — | |
State-owned banks(1) | | | 6.0 | | | | 0.4 | | | | 16.1 | | | | 4.3 | |
| | | | | | | | | | | | | | | | |
Total | | | 100.0 | | | | 100.0 | | | | 100.0 | | | | 100.0 | |
| (1) | Does not include second floor loans |
Source: SBS.
The following table presents the number of financial institutions and the percentage interest in total assets of the financial system held by each category of financial institution as of the dates shown.
Number of Financial Institutions
and Share of Total Assets of the Financial System
| | | | | | | | | | | | | | | | | | | | | | | | | | | | |
Type of Institution | | Number of Institutions
as of December 31, | | | Share of Total Assets (%)
as of December 31, | |
| | | 2007 | | | 2008 | | | 2009 | | | 2010 | | | 2011 | | | 2010 | | | 2011 | |
| | | | | | | |
Rural savings and loans | | | 12 | | | | 10 | | | | 10 | | | | 10 | | | | 11 | | | | 1.0 | | | | 1.1 | |
Municipal savings and loans | | | 13 | | | | 13 | | | | 13 | | | | 13 | | | | 13 | | | | 4.7 | | | | 5.0 | |
Financial leasing companies | | | 5 | | | | 5 | | | | 4 | | | | 2 | | | | 2 | | | | 0.1 | | | | 0.2 | |
Finance companies | | | 3 | | | | 3 | | | | 6 | | | | 10 | | | | 10 | | | | 2.6 | | | | 3.1 | |
Commercial banks | | | 13 | | | | 16 | | | | 15 | | | | 15 | | | | 15 | | | | 78.1 | | | | 77.5 | |
Small business development banks | | | 14 | | | | 13 | | | | 11 | | | | 10 | | | | 10 | | | | 0.5 | | | | 0.5 | |
State-owned entities | | | 4 | | | | 4 | | | | 4 | | | | 4 | | | | 4 | | | | 12.9 | | | | 12.7 | |
| | | | | | | | | | | | | | | | | | | | | | | | | | | | |
Total | | | 64 | | | | 64 | | | | 63 | | | | 64 | | | | 65 | | | | 100.0 | | | | 100.0 | |
Source: SBS.
In 2007, total assets of the Peruvian financial system increased by 37.8%, due primarily to continued economic growth and stability. In 2008, total assets of the Peruvian financial system increased by 28.3% due to a slight economic growth, even when the country was affected by the financial crisis. In 2009, total assets of the Peruvian financial system increased by 8.8% due to a decrease in economic growth. During 2010, total assets of the Peruvian financial system increased by 28.3%, compared to 2009, due primarily to economic growth. In 2011, total assets of the Peruvian financial system increased by 13.2%, compared to 2010, due primarily to continued economic growth and stability.
76
The following table provides the total gross assets of the Peruvian financial system as of the dates shown.
Total Gross Assets of the Peruvian Financial System and the Commercial Banks
(in millions of U.S. dollars and percentage change from previous year)
| | | | | | | | | | | | | | | | |
| | | Financial system(1) | | | Commercial banks | |
| | | U.S.$ | | | Growth rate (%) | | | U.S.$ | | | Growth rate (%) | |
As of December 31, | | | | | | | | | | | | | | | | |
2007 | | | 39,756 | | | | 37.8 | | | | 36,164 | | | | 40.0 | |
2008 | | | 51,007 | | | | 28.3 | | | | 47,036 | | | | 30.1 | |
2009 | | | 55,517 | | | | 8.8 | | | | 49,904 | | | | 6.1 | |
2010 | | | 71,251 | | | | 28.3 | | | | 63,951 | | | | 28.1 | |
2011 | | | 80,682 | | | | 13.2 | | | | 71,608 | | | | 12.0 | |
| (1) | Does not include state-owned banks. |
Source: SBS.
The financial system is the primary source of private sector financing. As of December 31, 2007 and 2008, the manufacturing sector accounted for the largest share of total loans, with 20.4% and 18.3%, respectively. The wholesale and retail sector was second in total share of loans with 15.8% as of December 31, 2007 and 17.1% as of December 31, 2008. As of December 31, 2009, the sectors that accounted for the largest share of borrowings were the manufacturing with 16.4% of total loans and wholesale and retail with 16.0% of total loans. As of December 31, 2010, the manufacturing sector and the wholesale and retail sector were again the sector with the largest share of loans, with 16.3% and 16.5%, respectively. As of December 31, 2011 the above trend continued with the manufacturing sector and the wholesale and retail sector having the largest share of loans, with 15.0% and 17.0%, respectively.
The following tables provide information regarding the allocation of loans to each sector of the economy as of the dates shown.
Loans of the Financial System by Sector(1)
(in millions of U.S. dollars, at current prices)
| | | | | | | | | | | | | | | | | | | | |
| | | As of December 31, | |
Sector | | 2007 | | | 2008 | | | 2009 | | | 2010 | | | 2011 | |
| | | | | |
Agriculture and livestock | | | 620 | | | | 925 | | | | 1,132 | | | | 1,349 | | | | 1,687 | |
Fishing | | | 454 | | | | 418 | | | | 479 | | | | 496 | | | | 589 | |
Mining | | | 995 | | | | 1,416 | | | | 1,343 | | | | 1,490 | | | | 1,821 | |
Manufacturing | | | 5,037 | | | | 5,865 | | | | 5,958 | | | | 7,292 | | | | 8,370 | |
Electricity, gas and water | | | 795 | | | | 1,057 | | | | 1,377 | | | | 1,632 | | | | 1,976 | |
Construction | | | 482 | | | | 674 | | | | 642 | | | | 823 | | | | 1,094 | |
Wholesale and retail trade | | | 3,918 | | | | 5,489 | | | | 5,832 | | | | 7,420 | | | | 9,340 | |
Hotels and restaurants | | | 297 | | | | 400 | | | | 561 | | | | 658 | | | | 892 | |
Transportation, warehousing and telecommunications | | | 1,247 | | | | 2,005 | | | | 2,244 | | | | 3,050 | | | | 3,161 | |
Financial intermediation | | | 759 | | | | 728 | | | | 1,106 | | | | 1,142 | | | | 1,397 | |
Real estate | | | 1,299 | | | | 1,712 | | | | 1,866 | | | | 3,332 | | | | 3,807 | |
Public administration and defense | | | 108 | | | | 102 | | | | 125 | | | | 107 | | | | 97 | |
Education | | | 171 | | | | 244 | | | | 316 | | | | 383 | | | | 449 | |
Health and social services | | | 86 | | | | 99 | | | | 121 | | | | 173 | | | | 222 | |
Other(2) | | | 8,466 | | | | 10,988 | | | | 13,274 | | | | 15,521 | | | | 20,056 | |
| | | | | | | | | | | | | | | | | | | | |
Total loans | | | 24,734 | | | | 32,112 | | | | 36,376 | | | | 44,869 | | | | 54,960 | |
| (1) | Does not include state-owned banks and financial leasing companies. |
| (2) | Includes consumer loans and mortgage loans. |
Source: SBS.
77
Loans of the Financial System by Sector(1)
(as a percentage of total loans)
| | | | | | | | | | | | | | | | | | | | |
| | | As of December 31, | |
Sector | | 2007 | | | 2008 | | | 2009 | | | 2010 | | | 2011 | |
| | | | | |
Agriculture and livestock | | | 2.5 | | | | 2.9 | | | | 3.1 | | | | 3.0 | | | | 3.1 | |
Fishing | | | 1.8 | | | | 1.3 | | | | 1.3 | | | | 1.1 | | | | 1.1 | |
Mining | | | 4.0 | | | | 4.4 | | | | 3.7 | | | | 3.3 | | | | 3.3 | |
Manufacturing | | | 20.4 | | | | 18.3 | | | | 16.4 | | | | 16.3 | | | | 15.2 | |
Electricity, gas and water | | | 3.2 | | | | 3.3 | | | | 3.8 | | | | 3.6 | | | | 3.6 | |
Construction | | | 1.9 | | | | 2.1 | | | | 1.8 | | | | 1.8 | | | | 2.0 | |
Wholesale and retail trade | | | 15.8 | | | | 17.1 | | | | 16.0 | | | | 16.5 | | | | 17.0 | |
Hotels and restaurants | | | 1.2 | | | | 1.2 | | | | 1.5 | | | | 1.5 | | | | 1.6 | |
Transportation, warehousing and telecommunications | | | 5.0 | | | | 6.2 | | | | 6.2 | | | | 6.8 | | | | 5.8 | |
Financial intermediation | | | 3.1 | | | | 2.3 | | | | 3.0 | | | | 2.5 | | | | 2.5 | |
Real estate | | | 5.3 | | | | 5.3 | | | | 5.1 | | | | 7.4 | | | | 6.9 | |
Public administration and defense | | | 0.4 | | | | 0.3 | | | | 0.3 | | | | 0.2 | | | | 0.2 | |
Education | | | 0.7 | | | | 0.8 | | | | 0.9 | | | | 0.9 | | | | 0.8 | |
Health and social services | | | 0.3 | | | | 0.3 | | | | 0.3 | | | | 0.4 | | | | 0.4 | |
Other(2) | | | 34.2 | | | | 34.2 | | | | 36.5 | | | | 34.6 | | | | 36.5 | |
| | | | | | | | | | | | | | | | | | | | |
Total loans | | | 100.0 | | | | 100.0 | | | | 100.0 | | | | 100.0 | | | | 100.0 | |
| (1) | Does not include state-owned banks or financial leasing companies. |
| (2) | Includes consumer loans and mortgage loans. |
Source: SBS.
Liquidity and Credit Aggregates
The most significant money supply measures in Peru are M1, M2 and M3, which consist generally of the following:
| | • | | M1 consists of currency in circulation plus demand and savings deposits in domestic currency held in private sector banks, that are easily convertible into cash; |
| | • | | M2 consists of M1 plus time deposits in domestic currency held in private banks and mortgage certificates and other certificates, in domestic currency, issued by private banks; and |
| | • | | M3, or “broad money,” consists of M2 plus foreign currency in circulation. |
During the five-year period ended December 31, 2011, Peru’s monetary base grew 242%, from U.S.$5.9 billion as of December 31, 2007 to U.S.$14.8 billion as of December 31, 2011. For the five-year period ended December 31, 2011, M1 grew at a compound annual rate of 24.3%, M2 at a compound annual rate of 27.7% and M3 at a compound annual rate of 21.4%.
The following table shows changes in selected monetary indicators as of the stated dates.
Selected Monetary Indicators
(percentage change from previous year)(1)
| | | | | | | | | | | | | | | | | | | | |
| | | As of December 31, | |
| | | 2007 | | | 2008 | | | 2009 | | | 2010 | | | 2011 | |
| | | | | |
M1 | | | 29.7 | | | | 30.7 | | | | 8.5 | | | | 28.0 | | | | 19.1 | |
M2 | | | 31.5 | | | | 42.4 | | | | 8.7 | | | | 26.0 | | | | 21.6 | |
M3 | | | 18.6 | | | | 25.5 | | | | 14.5 | | | | 13.3 | | | | 19.1 | |
| (1) | Average indicators of the period. |
Source: Central Bank.
78
The following table presents the composition of the monetary base and international reserves as of the dates shown.
Monetary Base and Central Bank’s International Reserves
(in millions of U.S. dollars, at current prices)
| | | | | | | | | | | | | | | | | | | | |
| | | As of December 31, | |
| | | 2007 | | | 2008 | | | 2009 | | | 2010 | | | 2011 | |
| | | | | |
Currency in circulation and cash in vaults at banks | | | 5,860 | | | | 6,805 | | | | 7,974 | | | | 10,862 | | | | 12,984 | |
Commercial bank deposits at the Central Bank | | | 66 | | | | 301 | | | | 174 | | | | 1,312 | | | | 1,819 | |
Monetary base | | | 5,926 | | | | 7,105 | | | | 8,148 | | | | 12,174 | | | | 14,803 | |
Gross international reserves | | | 27,720 | | | | 31,233 | | | | 33,175 | | | | 44,150 | | | | 48,859 | |
Deposits in foreign accounts | | | 9,5678 | | | | 2,656 | | | | 5,795 | | | | 10,777 | | | | 11,263 | |
Securities | | | 16,834 | | | | 27,178 | | | | 24,750 | | | | 30,392 | | | | 34,190 | |
Gold | | | 928 | | | | 983 | | | | 1,218 | | | | 1,565 | | | | 1,722 | |
Other | | | 390 | | | | 415 | | | | 1,412 | | | | 1,417 | | | | 1,683 | |
Net international reserves | | | 27,689 | | | | 31,196 | | | | 33,135 | | | | 44,105 | | | | 48,816 | |
Source: Central Bank.
As of December 31, 2010, the ratio of gross international reserves at the Central Bank to the monetary base was approximately 3.6 to 1, and as of December 31, 2011, this ratio was 3.3 to 1. As of December 31, 2011, total credit aggregates were equal to U.S.$34.9 billion and total deposits were equal to U.S.$47.0 billion. For the five-year period ended December 31, 2011, private-sector credit increased at a compound annual growth rate of 23.7%, to U.S.$54.4 billion at the end of such period. For the same period total deposits increased at a compound annual growth rate of 21.8%, to U.S.$47.0 billion at the end of such period. For the five-year period ended December 31, 2011, foreign currency-denominated deposits increased at a compound annual growth rate of 14.6%, to U.S.$21.6 billion at the end of such period. During the same period local currency denominated deposits had a compound annual growth rate of 30.8%, totaling U.S.$25.4 billion at December 31, 2011.
As of December 31, 2011, Peru’s monetary base was U.S.$14.8 billion. From December 31, 2010 to December 31, 2011, both gross and net international reserves increased 10.7%, to U.S.$48.9 billion and U.S.$48.8 billion, respectively, at the end of such period.
The following tables present liquidity and credit aggregates, and changes in selected monetary indicators as of the dates shown.
Liquidity and Credit
(in millions of U.S. dollars, at current prices)
| | | | | | | | | | | | | | | | | | | | |
| | | As of December 31, | |
| | | 2007 | | | 2008 | | | 2009 | | | 2010 | | | 2011 | |
Monetary aggregates | | | | | | | | | | | | | | | | | | | | |
Currency in circulation | | | 4,952 | | | | 5,521 | | | | 6,658 | | | | 8,587 | | | | 9,834 | |
M1 | | | 8,251 | | | | 9,189 | | | | 11,435 | | | | 15,154 | | | | 17,518 | |
M2 | | | 15,002 | | | | 18,071 | | | | 22,589 | | | | 30,310 | | | | 35,669 | |
M3 | | | 28,070 | | | | 33,507 | | | | 39,040 | | | | 48,699 | | | | 56,761 | |
| | | | | |
Credit by sector(1) | | | | | | | | | | | | | | | | | | | | |
Public sector (Net)(2) | | | (10,419 | ) | | | (12,493 | ) | | | (13,128 | ) | | | (15,081 | ) | | | (19,501 | ) |
Private sector | | | 25,642 | | | | 32,502 | | | | 36,959 | | | | 44,299 | | | | 54,369 | |
| | | | | | | | | | | | | | | | | | | | |
Total credit aggregates | | | 15,222 | | | | 20,009 | | | | 23,831 | | | | 29,218 | | | | 34,869 | |
| | | | | |
Deposits | | | | | | | | | | | | | | | | | | | | |
Local currency(3) | | | 9,851 | | | | 12,322 | | | | 15,674 | | | | 21,464 | | | | 25,365 | |
Foreign currency(4) | | | 12,982 | | | | 15,306 | | | | 16,322 | | | | 18,340 | | | | 21,615 | |
| | | | | | | | | | | | | | | | | | | | |
Total deposits | | | 22,833 | | | | 27,628 | | | | 31,996 | | | | 39,804 | | | | 46,980 | |
| (1) | Includes securities offerings and cash advances from checking accounts of depository corporations. |
| (2) | Net claims on public sector of depository corporations. |
| (3) | Includes sight deposits, saving deposits, time deposits and other certificates in domestic currency of depository corporations. |
| (4) | Includes demand deposits, savings deposits and time deposits in foreign currency of depository corporations. |
Source: Central Bank.
79
Inflation
The economic and monetary program that the Government implemented during the early 1990s resulted in a sharp decline in inflation. Peru experienced hyperinflation during the late 1980s and 1990s, but by 1999 inflation had declined to a rate of 3.5% per year. During the five-year period ended December 31, 2011, inflation has been relatively stable at rates of 3.9% in 2007, 6.7% in 2008, 0.2% in 2009, 2.1% in 2010 and 4.7% in 2011.
In 2007, the inflation rate increased to 3.9%, despite increases in the price of food and international prices of wheat and oil. In 2008, the inflation rate increased to 6.7%, due to increased international prices of food products such as corn, wheat and soy resulting from increased demand from emerging countries. In 2009, the inflation rate decreased to 0.2%, due to the reversion of supply shocks on food prices, appreciation of the nuevo sol versus the U.S. dollar and the contraction of domestic demand, which caused the reduction of prices for goods and services. During 2010, the rate of inflation increased to 2.1%, compared to 0.2% for 2009, mainly due to increased in prices for some types of food and fuel. In 2011, the rate of inflation increased to 4.7%, compared to 2.1% for 2010, mainly due to internal and external economic conditions that affected the prices of food and fuel.
The following table shows changes in the CPI for the periods shown.
Consumer Price Index
(percentage change)
| | | | | | | | |
| | | End of period(1) | | | Average(2) | |
| | |
2007 | | | 3.9 | | | | 1.8 | |
2008 | | | 6.7 | | | | 5.8 | |
2009 | | | 0.2 | | | | 2.9 | |
2010 | | | 2.1 | | | | 1.5 | |
2011 | | | 4.7 | | | | 3.4 | |
| (1) | Accumulated during the 12-month period. |
Foreign Exchange and International Reserves
Foreign Exchange
Prior to 1991, Peru exercised control over the foreign exchange markets by imposing multiple exchange rates and placing restrictions on the possession and use of foreign currencies. In 1991, the Fujimori administration eliminated all foreign exchange controls and the exchange rates were unified. Currently, foreign exchange rates are determined by market conditions, with regular operations by the Central Bank in the foreign exchange market in order to reduce volatility in the value of the nuevo Sol against the U.S. dollar.
The following table shows the nuevo sol/U.S. dollar exchange rates for the periods shown.
| | | | | | | | |
| | | Exchange Rates(1)
(S/. per U.S.$) | |
| | | End of period(2) | | | Average | |
| | |
2007 | | | 3.00 | | | | 3.13 | |
2008 | | | 3.14 | | | | 2.92 | |
2009 | | | 2.89 | | | | 3.01 | |
2010 | | | 2.81 | | | | 2.83 | |
2011 | | | 2.70 | | | | 2.75 | |
| (1) | Formal rates offered by banks. |
| (2) | As of the last day of the year. |
80
International Reserves
Under Article 72 of the Central Bank’s charter, the international reserves administered by the Central Bank may consist of:
| | • | | gold and silver reserves; |
| | • | | foreign currencies and notes generally accepted as a means of payment in the international markets; |
| | • | | negotiable bank acceptances with terms of less than 90 days from the date of acquisition by the Central Bank; |
| | • | | Special Drawing Rights, or SDRs, or any other gold substitute included in the Articles of Agreement of the IMF, corresponding to Peru; |
| | • | | reciprocal credit agreements between the Central Bank and similar entities; |
| | • | | contributions in gold, foreign currencies and SDRs to international monetary organizations; and |
| | • | | in the discretion of the Central Bank’s board: |
| | • | | foreign currency deposits of less than 90 days; |
| | • | | certificates of deposits of less than 90 days issued by banks; and |
| | • | | highly-liquid investment-grade securities issued by international organizations or public foreign entities. |
During the 1990s, the Central Bank maintained a policy of accumulating international reserves. International reserves help Peru to maintain economic and financial stability by ensuring the availability of foreign currency in extraordinary situations. These situations can include sudden, significant withdrawals of foreign currency deposits from the banking system and sharp downturns in exports and economic activity.
The policy of the Central Bank to manage its international reserves generally emphasizes capital preservation and liquidity. Nevertheless, once the international reserves have reached certain threshold levels, the policy of the Central Bank is to balance capital preservation with adequate returns on reserves.
In order to guide the optimal investment distribution of its reserves, the Central Bank uses a model benchmark portfolio that reflects the risk-return combination chosen by the Central Bank’s board to accomplish the general principals of capital preservation, liquidity and return. This portfolio is designed in light of actual market conditions to ensure that it provides feasible goals and shuns speculative assumptions. The Central Bank adjusts the value of its investment portfolio daily on the basis of market prices.
The Central Bank considers and actively manages the following four kinds of risks in investing its international reserves:
| | • | | Liquidity risk. The Central Bank manages liquidity risk by distributing its investments among three kinds of assets, following the guidelines of its benchmark portfolio: |
| | • | | highly-liquid, short-term assets to cover unexpected contingencies; |
| | • | | liquid assets with maturities not exceeding one year, which include bank time deposits with maturities not exceeding three months and staggered maturity dates, and highly-liquid fixed-income securities; and |
81
| | • | | assets with maturities exceeding one year, generally consisting of bonds that offer a relatively higher return because of the longer maturity. To ensure an adequate level of liquidity, these bonds must have been issued in minimum amounts as prescribed by the Central Bank. |
| | • | | Credit risk. To minimize risks that may arise because of the insolvency of the creditor, the Central Bank does not invest in debt or equity issued by private entities and diversifies its investments among: |
| | • | | deposits in foreign banks that are rated in the three highest categories of Standard & Poor’s (a division of the McGraw-Hill Companies), Moody’s Investor Service and Fitch Ratings; and |
| | • | | fixed-income securities or securities guaranteed by international organizations, foreign governments or their agencies, which are rated in the three highest categories by Standard & Poor’s, Moody’s Investor Service and Fitch Ratings. |
| | • | | Foreign exchange risk. Fluctuations in the foreign exchange markets can pose a significant risk to the level of reserves at the Central Bank because the Central Bank accounts for its reserves in U.S. dollars and because of the significant U.S. dollar-denominated liabilities of the Peruvian banking system. Moreover, the majority of Peru’s foreign trade and capital flows are also denominated in U.S. dollars, which can also exert significant pressure on the Central Bank’s international reserves. To safeguard its international reserves from fluctuations in the foreign exchange markets, the Central Bank invests primarily in U.S. dollar-denominated assets. |
| | • | | Market risk. To mitigate market risk, the Central Bank tries to match the average maturity of its assets to that of its liabilities. The average duration, or length of time required to receive the present value of future payments, of the Central Bank’s portfolio does not exceed one year, which protects it significantly from market fluctuations. Additionally, the Central Bank imposes limits on the maximum term of its portfolio securities. |
The Central Bank’s net international reserves increased from U.S.$27.7 billion in 2007 to U.S.$48.8 billion in 2011:
| | • | | In 2007, net international reserves increased 60.3% from 2006 to U.S.$27.7 billion. This increase was mainly attributable to over-the-counter purchases of foreign currency and deposits of commercial banks. |
| | • | | In 2008, net international reserves increased 12.7% from 2007 to U.S.$31.2 billion. This increase was mainly attributable to over-the-counter purchases of foreign currency, deposits of commercial banks at the Central Bank and the performance of the investment portfolio. |
| | • | | In 2009, net international reserves increased 6.2% from 2008 to U.S.$33.1 billion. This increase was mainly attributable to growth of the Central Bank’s net international position and in deposits by the public sector. |
| | • | | In 2010, net international reserves increased 33.1% from 2009 to U.S.$44.1 billion. This increase was mainly attributable to growth of the Central Bank’s net international position and in deposits by the public sector. |
| | • | | In 2011, net international reserves increased 10.7% from 2010 to U.S.$48.8 billion. This increase was mainly attributable to an increase in deposits in US dollars by the public sector, deposits by commercial banks at the Central Bank, performance of the investment portfolios and purchases of foreign currency. |
From 2007 to 2011, the total gross reserves of the Peruvian banking system (in months of total imports) fluctuated between 17.5% in 2007 and 16.5% in 2011.
82
The following table sets the composition of the international reserves of Peru’s banking system.
Net International Reserves of the Banking System
(in millions of U.S. dollars, at period end, at current prices)
| | | | | | | | | | | | | | | | | | | | |
| | | As of December 31, | |
| | | 2007 | | | 2008 | | | 2009 | | | 2010 | | | 2011 | |
Central Bank | | | | | | | | | | | | | | | | | | | | |
Assets | | | 27,720 | | | | 31,233 | | | | 33,175 | | | | 44,150 | | | | 48,859 | |
Liabilities | | | 31 | | | | 37 | | | | 40 | | | | 45 | | | | 43 | |
| | | | | | | | | | | | | | | | | | | | |
Total (assets less liabilities) | | | 27,689 | | | | 31,196 | | | | 33,135 | | | | 44,105 | | | | 48,816 | |
| | | | | |
Banco de la Nacion and Development banks | | | | | | | | | | | | | | | | | | | | |
Assets | | | 74 | | | | 31 | | | | 61 | | | | 72 | | | | 76 | |
Liabilities | | | — | | | | — | | | | — | | | | — | | | | — | |
| | | | | | | | | | | | | | | | | | | | |
Total (assets less liabilities) | | | 74 | | | | 31 | | | | 61 | | | | 72 | | | | 76 | |
| | | | | |
Private banks | | | | | | | | | | | | | | | | | | | | |
Assets | | | 822 | | | | 1,641 | | | | 1,373 | | | | 1,613 | | | | 1,753 | |
Liabilities | | | 2,238 | | | | 1,692 | | | | 1,419 | | | | 1,099 | | | | 1,692 | |
| | | | | | | | | | | | | | | | | | | | |
Total (assets less liabilities) | | | (1,416 | ) | | | (51 | ) | | | (46 | ) | | | 514 | | | | 61 | |
| | | | | |
Net international reserves | | | 26,347 | | | | 31,176 | | | | 33,150 | | | | 44,691 | | | | 48,953 | |
| | | | | |
Memorandum items: | | | | | | | | | | | | | | | | | | | | |
Gross reserves of the Central Bank | | | 27,720 | | | | 31,233 | | | | 33,175 | | | | 44,150 | | | | 48,859 | |
Gross reserves of the banking system | | | 28,616 | | | | 32,904 | | | | 34,609 | | | | 45,836 | | | | 50,688 | |
Gross reserves of the Central Bank (in months of total imports) | | | 17.0 | | | | 13.2 | | | | 18.9 | | | | 18.4 | | | | 15.9 | |
Gross reserves of the banking system (in months of total imports) | | | 17.5 | | | | 13.9 | | | | 19.8 | | | | 19.1 | | | | 16.5 | |
Source: Central Bank.
Securities Markets
The securities markets in Peru are regulated by the Peruvian Securities Superintendency that has as its primary purpose to protect investors and promote the efficient operations of securities markets. In particular, the Peruvian Securities Superintendency’s functions include:
| | • | | supervising the activities and management of the various market participants, including the BVL, brokerage firms, issuing companies, mutual and other investment fund and credit-rating agencies, and |
| | • | | promoting market transparency through disclosure requirements. |
Peru’s capital markets underwent significant changes during the 1990s as a result of various reform initiatives undertaken by the Government. These reforms began in 1991 with passage of the Ley del Mercado de Valores, or the Securities Market Law of 1991, which implemented a comprehensive set of measures that liberalized and modernized the operations of the Peruvian capital markets. These measures included:
| | • | | requirements for securities exchange and broker dealers, such as the introduction of a special fund these entities must provide in order to guarantee the proper execution of trades; |
| | • | | market transparency and disclosure requirements, particularly through the creation of the Registro Público de Valores e Intermediaríos, or Public Registry of Securities and Broker Dealers, a public record of all the participants in the Peruvian capital markets, including issuers, broker-dealers and credit-rating agencies; |
83
| | • | | a regulatory framework for new institutions that were authorized to operate in the Peruvian capital markets and which would play an increasingly important role (these new institutions included mutual funds and credit-rating agencies); and |
| | • | | requirements for the operation of primary and secondary markets, including guidelines for the settlement of securities transactions, dealer commissions, dispute resolution and asset securitization. |
In 1996, a new Ley del Mercado de Valores, or Securities Market Law of 1996, was introduced. This Law preserved the basic market structure adopted under the Securities Market Law of 1991, but introduced changes to streamline the operations of the Peruvian capital markets, making them more compatible with international standards. These changes included:
| | • | | vesting with the BVL self-regulatory authority; |
| | • | | creating CAVALI ICLV S.A., a private securities clearing and depositary agency independent of the BVL; |
| | • | | liberalizing the brokerage business by introducing less stringent minimum capital requirements and broadening the range of transactions in which brokerage firms may participate; and |
| | • | | restricting insider trading. |
To stimulate the growth of Peru’s capital markets, the Government also encouraged greater participation in the markets through economic incentives. In 1993, Peru adopted tax exemptions for both capital earnings generated through stock exchange trading and interest income obtained from any kind of bond. These tax exemptions, which expired in 2011, have played a pivotal role in funneling funds toward Peruvian capital markets.
Another significant factor in the development of the Peruvian capital markets was the introduction in 1993 of private pension funds, which have become important for institutional investors. Administradoras Privadas de Fondos de Pensiones, private pension fund managers, or AFPs, were created under Decree Law No. 25,897, or the Private Pension System Law of 1992. These AFPs were introduced not only to improve Peru’s social security system, but also to channel funds towards development of the capital markets. For a description of Peru’s private pension system see “Public Sector Finance—Social Security” below.
From 2007 to 2011, membership in these funds increased at an average annual rate of approximately 4.9%. As of December 31 2011, there were four AFPs with twelve funds in operation, with approximately 4.9 million members and approximately U.S.$30.4 billion in assets under management. These funds invest in equity securities, representing approximately 35.0% of their portfolios, fixed-income securities, representing approximately 39.9% of their portfolios, and bank time-deposits, representing approximately 5.2% of their portfolios.
Mutual funds entered the market as a result of the Securities Market Law of 1991, which established a regulatory framework for their operations. As of December 31, 2011, there were six mutual fund companies in operation that administered 56 mutual funds and managed approximately U.S.$5.1 billion in assets for approximately 262,816 investors. Of these mutual funds, 29 invest primarily in debt securities, representing approximately 86.6% of their portfolios, 20 invest primarily in mixed-income securities, representing approximately 9.72% of their portfolios, and seven primarily in variable-income securities, representing approximately 3.68% of their portfolios.
The Peruvian capital markets grew significantly during the 1990s as a result of the reforms implemented by the Government during that period. Despite this growth, the Peruvian capital markets remain relatively small and illiquid. Accordingly, most businesses, particularly small-and medium-size businesses, raise capital through the local banking system. Large businesses also benefit from limited access to foreign credit.
Founded in 1971, the BVL is the only securities exchange operating in Peru. The BVL was privatized as part of the capital market reforms implemented by the Government in 1991 and operates as an entity with regulatory
84
and enforcement power under the supervision of the Peruvian Securities Superintendency. Cash operations with equity securities accounted for approximately 80.1% of the total traded volume in the BVL for 2011, while fixed income securities accounted for 8.1% of such amount.
In 2011, 233 companies had their equity securities listed on the BVL, of which 24 were foreign companies. This number does not include companies which only have bond listings on the BVL. Market capitalization of domestic companies has increased from U.S.$108.2 billion in 2007, to U.S.$120.7 billion in 2011. Likewise, the annual traded amount has decreased from U.S.$12.4 billion during 2007 to U.S.$7.8 billion during 2011, at a compound annual growth rate of 10.9%.
Peru’s Capital Markets
Transaction Volume and Market Capitalization(1)
(in millions of U.S. dollars, at current prices)
| | | | | | | | | | | | | | | | | | | | |
| | | As of December 31, | |
| | | 2007 | | | 2008 | | | 2009 | | | 2010 | | | 2011 | |
Equities: | | | | | | | | | | | | | | | | | | | | |
Stocks | | | 9,112.1 | | | | 4,892.1 | | | | 3,799.5 | | | | 4,252.4 | | | | 5,891.3 | |
Other | | | 193.0 | | | | 213.3 | | | | 208.7 | | | | 781.1 | | | | 345.6 | |
| | | | | | | | | | | | | | | | | | | | |
Total | | | 9,305.0 | | | | 5,105.3 | | | | 4,008.2 | | | | 5,033.5 | | | | 6,236.9 | |
| | | | | |
Fixed Income Securities: | | | | | | | | | | | | | | | | | | | | |
Auctions | | | — | | | | — | | | | — | | | | — | | | | — | |
Continued Trading | | | 257.6 | | | | 40.7 | | | | 314.8 | | | | 197.0 | | | | 96.1 | |
Bonds-money market | | | 823.0 | | | | 1,346.9 | | | | 719.6 | | | | 438.2 | | | | 536.1 | |
Mortgage bills | | | — | | | | — | | | | — | | | | — | | | | — | |
Certificate of deposit | | | 5.9 | | | | 32.7 | | | | 7.2 | | | | — | | | | — | |
Other | | | 14.1 | | | | 25.2 | | | | 3.2 | | | | — | | | | — | |
| | | | | | | | | | | | | | | | | | | | |
Total | | | 1,100.7 | | | | 1,445.5 | | | | 1,044.8 | | | | 635.2 | | | | 632.2 | |
| | | | | |
Report Transactions | | | | | | | | | | | | | | | | | | | | |
Equities | | | 1,953.2 | | | | 1,304.4 | | | | 617.8 | | | | 962.0 | | | | 913.1 | |
Debt instruments | | | 24.9 | | | | 19.2 | | | | 6.6 | | | | 6.7 | | | | 6.7 | |
| | | | | | | | | | | | | | | | | | | | |
Total | | | 1,978.1 | | | | 1,323.6 | | | | 624.4 | | | | 968.7 | | | | 919.8 | |
| | | | | |
Securities Lending | | | — | | | | — | | | | — | | | | — | | | | — | |
| | | | | |
Non-massive issued instruments | | | — | | | | — | | | | — | | | | — | | | | — | |
| | | | | | | | | | | | | | | | | | | | |
| | | | | |
Total Transaction Volume | | | 12,383.8 | | | | 7,874.4 | | | | 5,677.4 | | | | 6,637.4 | | | | 7,788.8 | |
| | | | | |
Market capitalization | | | 108,219.7 | | | | 57,231.4 | | | | 107,325.3 | | | | 160,867.4 | | | | 121,596.2 | |
Source: Peruvian Securities Superintendency and BVL.
85
PUBLIC SECTOR FINANCES
Non-Financial Public Sector
Peru’s non-financial public sector consists of:
| | • | | the Government’s various decentralized administrative and regulatory agencies, such as: |
| | • | | the National Superintendency for Tax Administration, or SUNAT; |
| | • | | non-financial state-owned enterprises, such as Petroperu; and Empresa de Electricidad del Perú S.A., or Electroperu. |
The non-financial public sector has registered an increasing overall balance from 2007 through 2011, from a surplus of U.S.$3.0 billion in 2007, or 2.9% of GDP, to a surplus of U.S.$3.2 billion in 2011, or 1.8% of GDP. For a description of the Government’s fiscal accounts see “—Central Government” below.
The Fiscal Restraint Act was approved in December 1999 to foster fiscal stability by establishing specific guidelines concerning non-financial public sector deficits, government spending growth and growth in public sector debt. In May 2003, Congress amended the Fiscal Restraint Act by changing its name to Ley de Responsabilidad y Transparencia Fiscal, or the Fiscal Responsibility and Transparency Act, and adapting the law to the recently-established regional governments. The Fiscal Responsibility and Transparency Act targeted a non-financial public sector deficit of 2.0% of GDP for 2003, 1.5% of GDP for 2004 and 1.0% in 2005. It also limited any increase of non-financial expenses for 2003 to 3.0% in real terms. In July 2003, however, Congress suspended enforcement of the limit on non-financial expenses for 2003 due to additional expenses generated by the decision to grant wage increases for teachers and healthcare workers following labor strikes earlier in the year.
In 2007, the non-financial public sector registered a surplus of U.S.$3.0 billion, or 2.9% of GDP. This surplus is mainly explained by higher tax revenue (associated with the greater collection of income tax and value-added tax), partially offset by a reduction in tariffs in December 2006, and by the relatively lower increase of non-financial expenditures.
In 2008, the non-financial public sector registered a surplus of U.S.$3.2 billion, or 2.4% of GDP, mainly attributable to increased tax revenue, resulting from higher collection of income tax and value-added tax.
In 2009, the non-financial public sector deficit was U.S.$1.9 billion, or 1.3% of GDP, compared to a U.S.$3.2 billion surplus, or 2.4% of GDP, for 2008. This deficit in 2009 was mainly a result of lower tax revenue, related to reduced collections of income tax and value-added tax and a higher than expected increase in capital expenditures, mainly for infrastructure.
In 2010, the non-financial public sector deficit was U.S.$0.5 billion, or 0.3% of GDP, compared to a U.S.$1.9 billion deficit, or 1.3% of GDP, for 2009. This lower deficit in 2010 is mainly explained by higher tax revenue, related to greater collections of income tax and value-added tax.
In 2011, the non-financial public sector surplus was U.S.$3.2 billion, or 1.8% of GDP. This surplus in 2011 is mainly attributable to increased current revenues, resulting from higher collection of income tax.
86
The following tables provide information on the non-financial public sector accounts for the periods shown.
Consolidated Accounts of the Non-Financial Public Sector (NFPS)
(in millions of U.S. dollars, at current prices)
| | | | | | | | | | | | | | | | | | | | |
| | | For the 12 months ended December 31, | |
| | | 2007(1) | | | 2008(1) | | | 2009(1) | | | 2010(1) | | | 2011 | |
Primary balance | | | | | | | | | | | | | | | | | | | | |
Central government | | | 3,377 | | | | 4,523 | | | | (432 | ) | | | 1,739 | | | | 3,456 | |
Decentralized agencies | | | 270 | | | | 295 | | | | 331 | | | | 314 | | | | 660 | |
Local governments | | | 1,087 | | | | 320 | | | | (360 | ) | | | (550 | ) | | | 1,029 | |
State-owned enterprises | | | 194 | | | | 39 | | | | 259 | | | | (206 | ) | | | 88 | |
| | | | | | | | | | | | | | | | | | | | |
Primary NFPS | | | 4,928 | | | | 5,178 | | | | (202 | ) | | | 1,297 | | | | 5,233 | |
| | | | | |
Interest payments | | | | | | | | | | | | | | | | | | | | |
External debt | | | 1,372 | | | | 1,143 | | | | 1,034 | | | | 1,036 | | | | 1,024 | |
Domestic debt | | | 547 | | | | 871 | | | | 625 | | | | 763 | | | | 1,051 | |
| | | | | | | | | | | | | | | | | | | | |
Total interest payments | | | 1,920 | | | | 2,013 | | | | 1,659 | | | | 1,799 | | | | 2,075 | |
| | | | | | | | | | | | | | | | | | | | |
| | | | | |
Overall NFPS | | | 3,009 | | | | 3,164 | | | | (1,861 | ) | | | (502 | ) | | | 3,158 | |
| | | | | | | | | | | | | | | | | | | | |
| | | | | |
Financing: | | | | | | | | | | | | | | | | | | | | |
External | | | (2,085 | ) | | | (1,205 | ) | | | 1,317 | | | | (728 | ) | | | 274 | |
Domestic | | | (1,066 | ) | | | (2,011 | ) | | | 510 | | | | 1,082 | | | | (3,480 | ) |
Privatization | | | 143 | | | | 51 | | | | 34 | | | | 148 | | | | 49 | |
| | | | | | | | | | | | | | | | | | | | |
Total financing | | | (3,009 | ) | | | (3,164 | ) | | | 1,861 | | | | 502 | | | | (3,158 | ) |
Source: Central Bank.
Consolidated Accounts of the Non-Financial Public Sector (NFPS)
(as a percentage of GDP, at current prices)
| | | | | | | | | | | | | | | | | | | | |
| | | For the 12 months ended December 31, | |
| | | 2007(1) | | | 2008(1) | | | 2009(1) | | | 2010(1) | | | 2011 | |
Primary balance: | | | | | | | | | | | | | | | | | | | | |
Central government | | | 3.2 | | | | 3.5 | | | | (0.2 | ) | | | 1.1 | | | | 2.0 | |
Decentralized agencies | | | 0.3 | | | | 0.2 | | | | 0.3 | | | | 0.2 | | | | 0.4 | |
Local governments | | | 1.0 | | | | 0.2 | | | | (0.3 | ) | | | (0.4 | ) | | | 0.6 | |
State-owned enterprises | | | 0.2 | | | | 0.0 | | | | 0.2 | | | | (0.1 | ) | | | 0.1 | |
| | | | | | | | | | | | | | | | | | | | |
Primary NFPS | | | 4.7 | | | | 4.0 | | | | 0.0 | | | | 0.9 | | | | 3.0 | |
| | | | | |
Interest payments | | | | | | | | | | | | | | | | | | | | |
External debt | | | 1.3 | | | | 0.9 | | | | 0.8 | | | | 0.7 | | | | 0.6 | |
Domestic debt | | | 0.5 | | | | 0.7 | | | | 0.5 | | | | 0.5 | | | | 0.6 | |
| | | | | | | | | | | | | | | | | | | | |
Total interest payments | | | 1.8 | | | | 1.6 | | | | 1.3 | | | | 1.2 | | | | 1.2 | |
| | | | | |
Overall NFPS | | | 2.9 | | | | 2.4 | | | | (1.3 | ) | | | (0.3 | ) | | | 1.8 | |
| | | | | |
Financing: | | | | | | | | | | | | | | | | | | | | |
External | | | (1.9 | ) | | | (0.9 | ) | | | 1.1 | | | | (0.5 | ) | | | 0.2 | |
Domestic | | | (1.1 | ) | | | (1.5 | ) | | | 0.2 | | | | 0.7 | | | | (2.0 | ) |
Privatization | | | 0.1 | | | | 0.0 | | | | 0.0 | | | | 0.1 | | | | 0.0 | |
| | | | | | | | | | | | | | | | | | | | |
Total financing | | | (2.9 | ) | | | (2.4 | ) | | | 1.3 | | | | 0.3 | | | | (1.8 | ) |
Source: Central Bank.
87
Central Government
Peru’s central government comprises the executive branch, including its ministries and other centralized agencies. Prior to January 1, 2003, the central government also included Peru’s 24 regional councils, whose representatives were appointed by the President and public universities. As of January 1, 2003, the regional councils were replaced by 25 regional governments headed by elected officials. See “The Republic of Peru—History, Government and Political Parties—Government—Regional Governments”.
The Government derives its revenues primarily from:
| | • | | non-tax revenues, such as fees, interest income and royalties from mining and hydrocarbon production; and |
| | • | | dividends from state-owned companies. |
Between 2007 and 2011, total Government revenues fluctuated from a low U.S.$19.5 billion, or 18.2% of GDP, in 2007, to a high of U.S.$32.1 billion, or 18.2% of GDP, in 2011. During this period, tax revenues fluctuated from a low U.S.$16.7 billion in 2007, or 15.6% of GDP, to a high U.S.$27.4 billion, or 15.5% of GDP, in 2011. Compared to the levels registered in 2010, in 2011 total Government revenues increased 20.4%, tax revenues increased 20.3%, and non-tax revenue increased 26.5% (to U.S.$4.6 billion, or 2.6% of GDP, as of December 31, 2011).
Government expenditures consist primarily of:
| | • | | wages of public sector employees; |
| | • | | transfers to public sector entities; |
| | • | | interest payments on debt; |
| | • | | public investments in infrastructure; and |
Between 2007 and 2011, total Government expenditures, excluding interest payments on the Government’s debt, fluctuated between a low of U.S.$16.2 billion, or 15.0% of GDP, in 2007, to a high of U.S.$28.7 billion, or 16.2% of GDP, in 2011. In 2011, total Government expenditures, excluding interest payments on the Government’s debt, increased 15.0% compared to those recorded in 2010.
Between 2007 and 2008, the Government registered increasing overall fiscal balances that ranged from a surplus of U.S.$1.6 billion, or 1.6% of GDP, in 2007, to a high surplus of U.S.$2.8 billion, or 2.1% of GDP, in 2008. Between 2008 to 2010, the Government registered decreasing overall fiscal balances that ranged from a surplus of U.S.$2.8 billion, or 2.1% of GDP, in 2008, to a deficit of U.S.$2.0 billion, or 1.5% of GDP in 2009 and to a surplus of U.S.$ 0.05 billion, or 0.1% of GDP in 2010. This was primarily due to (i) a decrease in tax collection that totaled U.S.$20.4 billion, or 16.0% of GDP, which represented a decrease of 13.4% in nominal terms with respect to 2008 and (ii) an increase in tax collection that totaled U.S.$26.7 billion, or 17.4% of GDP, which represented an increase of 31.5% in nominal terms with respect to 2009. In 2011, the Government registered an overall fiscal surplus of U.S.$1.6 billion, or 0.9% of GDP, primarily due to an increase in tax collection that totaled U.S.$32.1 billion, or 18.2% of GDP, which represented an increase of 20.4% in nominal terms with respect to 2010.
In 2007, the Government registered a primary surplus of U.S.$3.4 billion, or 3.2% of GDP, a 10.8% increase over the primary surplus registered in 2006. In 2008, the Government registered a primary surplus of
88
U.S.$4.5 billion, or 3.5% of GDP, a 33.9% increase over the primary surplus registered in 2007. In 2009, the Government’s primary deficit was U.S.$432 million, or 0.2% of GDP, representing a reduction of 109.8% when compared to that registered during 2008. In 2010, the Government’s primary surplus was U.S.$1.7 billion, or 1.1% of GDP, representing an increase of 502.4% when compared to the amount registered during 2009. In 2011, the Government’s primary surplus was U.S.$3.5 billion, or 2.0% of GDP, representing an increase of 98.7%% when compared to the amount registered during 2010, due to an increase in income tax revenues of 33.9%, an increase of 16.9% in value-added tax revenues and an increase in non-tax revenues.
The following tables provide information regarding government accounts for the periods shown.
Central Government Accounts
(in millions of U.S. dollars, at current prices)
| | | | | | | | | | | | | | | | | | | | |
| | | For the 12 months ended December 31, | |
| | | 2007(1) | | | 2008 | | | 2009 | | | 2010(1) | | | 2011(1) | |
Fiscal revenue: | | | | | | | | | | | | | | | | | | | | |
Current revenue: | | | | | | | | | | | | | | | | | | | | |
Tax revenue: | | | | | | | | | | | | | | | | | | | | |
Income Tax | | | 7,296 | | | | 8,301 | | | | 6,749 | | | | 9,121 | | | | 12,209 | |
Capital gains tax | | | — | | | | — | | | | — | | | | — | | | | — | |
Taxes on goods and services: | | | 9,459 | | | | 11,984 | | | | 11,202 | | | | 14,229 | | | | 16,412 | |
General Sales Tax | | | 8,086 | | | | 10,802 | | | | 9,817 | | | | 12,577 | | | | 14,696 | |
Excise taxes | | | 1,373 | | | | 1,182 | | | | 1,385 | | | | 1,652 | | | | 1,715 | |
Import tariffs | | | 701 | | | | 652 | | | | 495 | | | | 638 | | | | 502 | |
Other taxes | | | (724 | ) | | | (957 | ) | | | (968 | ) | | | (1,197 | ) | | | (1,696 | ) |
| | | | | | | | | | | | | | | | | | | | |
Total tax revenue | | | 16,732 | | | | 19,980 | | | | 17,479 | | | | 22,792 | | | | 27,427 | |
| | | | | |
Non-tax revenue(2) | | | 2,676 | | | | 3,340 | | | | 2,753 | | | | 3,637 | | | | 4,601 | |
| | | | | | | | | | | | | | | | | | | | |
Total current revenue | | | 19,409 | | | | 23,320 | | | | 20,231 | | | | 26,429 | | | | 32,028 | |
| | | | | |
Capital revenue | | | 123 | | | | 135 | | | | 149 | | | | 263 | | | | 105 | |
| | | | | | | | | | | | | | | | | | | | |
Total fiscal revenue | | | 19,532 | | | | 23,455 | | | | 20,380 | | | | 26,692 | | | | 32,133 | |
| | | | | |
Expenditures: | | | | | | | | | | | | | | | | | | | | |
Current non financial expenditures: | | | | | | | | | | | | | | | | | | | | |
Wages and salaries | | | 4,167 | | | | 4,741 | | | | 5,049 | | | | 5,600 | | | | 6,416 | |
Good and services | | | 3,256 | | | | 3,611 | | | | 4,473 | | | | 5,501 | | | | 6,208 | |
Current transfers | | | 6,385 | | | | 7,502 | | | | 6,391 | | | | 7,105 | | | | 8,586 | |
| | | | | | | | | | | | | | | | | | | | |
Total current non financial expenditures | | | 13,808 | | | | 15,934 | | | | 15,913 | | | | 18,207 | | | | 21,210 | |
| | | | | |
Capital expenditures: | | | | | | | | | | | | | | | | | | | | |
Fixed investment | | | 1,919 | | | | 2,351 | | | | 3,341 | | | | 4,767 | | | | 5,072 | |
Other | | | 427 | | | | 647 | | | | 1,558 | | | | 1,979 | | | | 2,395 | |
Of which: | | | | | | | | | | | | | | | | | | | | |
Capital transfers | | | 409 | | | | 589 | | | | 1,069 | | | | 1,336 | | | | 1,973 | |
Total capital expenditures | | | 2,347 | | | | 2,997 | | | | 4,900 | | | | 6,746 | | | | 7,467 | |
| | | | | | | | | | | | | | | | | | | | |
Total expenditures | | | 16,155 | | | | 18,932 | | | | 20,812 | | | | 24,953 | | | | 28,677 | |
| | | | | |
Fiscal balance: | | | | | | | | | | | | | | | | | | | | |
Primary fiscal balance | | | 3,377 | | | | 4,523 | | | | (432 | ) | | | 1,739 | | | | 3,456 | |
Interest | | | 1,765 | | | | 1,754 | | | | 1,614 | | | | 1,686 | | | | 1,891 | |
| | | | | | | | | | | | | | | | | | | | |
Overall fiscal balance | | | 1,611 | | | | 2,769 | | | | (2,046 | ) | | | 53 | | | | 1,563 | |
| | | | | |
Financing: | | | | | | | | | | | | | | | | | | | | |
Foreign financing | | | (2,229 | ) | | | (1,441 | ) | | | 1,353 | | | | (1,074 | ) | | | 214 | |
Domestic financing | | | 475 | | | | (1,380 | ) | | | 662 | | | | 872 | | | | (1,827 | ) |
Privatization | | | 143 | | | | 51 | | | | 34 | | | | 148 | | | | 49 | |
| | | | | | | | | | | | | | | | | | | | |
Total financing | | | (1,611 | ) | | | (2,769 | ) | | | 2,046 | | | | (53 | ) | | | (1,563 | ) |
| (2) | Includes transfers from state-owned enterprises and royalties from petroleum companies. |
Source: Central Bank.
89
Central Government Accounts
(as a percentage of GDP, at current prices)
| | | | | | | | | | | | | | | | | | | | |
| | | For the 12 months ended December 31, | |
| | | 2007(1) | | | 2008(1) | | | 2009(1) | | | 2010(1) | | | 2011(1) | |
Fiscal revenue: | | | | | | | | | | | | | | | | | | | | |
Current revenue: | | | | | | | | | | | | | | | | | | | | |
Tax revenue: | | | | | | | | | | | | | | | | | | | | |
Income Tax | | | 6.8 | | | | 6.5 | | | | 5.3 | | | | 5.9 | | | | 6.9 | |
Capital gains tax | | | — | | | | — | | | | 0.0 | | | | 0.0 | | | | 0.0 | |
Taxes on goods and services: | | | 8.8 | | | | 9.4 | | | | 8.8 | | | | 9.3 | | | | 9.3 | |
General Sales Tax | | | 7.5 | | | | 8.5 | | | | 7.7 | | | | 8.2 | | | | 8.3 | |
Excise taxes | | | 1.3 | | | | 0.9 | | | | 1.1 | | | | 1.1 | | | | 1.0 | |
Import tariffs | | | 0.7 | | | | 0.5 | | | | 0.4 | | | | 0.4 | | | | 0.3 | |
Other taxes | | | (0.7 | ) | | | (0.8 | ) | | | (0.8 | ) | | | (0.8 | ) | | | (1.0 | ) |
| | | | | | | | | | | | | | | | | | | | |
Total tax revenue | | | 15.6 | | | | 15.7 | | | | 13.7 | | | | 14.8 | | | | 15.5 | |
| | | | | |
Non-tax revenue(2) | | | 2.5 | | | | 2.6 | | | | 2.2 | | | | 2.4 | | | | 2.6 | |
| | | | | | | | | | | | | | | | | | | | |
Total current revenue | | | 18.1 | | | | 18.3 | | | | 15.9 | | | | 17.2 | | | | 18.1 | |
| | | | | |
Capital revenue | | | 0.1 | | | | 0.1 | | | | 0.1 | | | | 0.2 | | | | 0.1 | |
| | | | | | | | | | | | | | | | | | | | |
Total fiscal revenue | | | 18.2 | | | | 18.4 | | | | 16.0 | | | | 17.4 | | | | 18.2 | |
| | | | | |
Expenditures: | | | | | | | | | | | | | | | | | | | | |
Current non financial expenditures: | | | | | | | | | | | | | | | | | | | | |
Wages and salaries | | | 3.9 | | | | 3.7 | | | | 4.0 | | | | 3.6 | | | | 3.6 | |
Good and services | | | 3.0 | | | | 2.9 | | | | 3.5 | | | | 3.6 | | | | 3.5 | |
Current transfers | | | 6.0 | | | | 5.9 | | | | 5.0 | | | | 4.6 | | | | 4.9 | |
| | | | | | | | | | | | | | | | | | | | |
Total current non financial expenditures | | | 12.8 | | | | 12.5 | | | | 12.4 | | | | 11.8 | | | | 12.0 | |
| | | | | |
Capital expenditures: | | | | | | | | | | | | | | | | | | | | |
Fixed investment | | | 1.8 | | | | 1.9 | | | | 2.6 | | | | 3.1 | | | | 2.9 | |
Other | | | 0.4 | | | | 0.5 | | | | 1.2 | | | | 1.3 | | | | 1.4 | |
Of which: | | | | | | | | | | | | | | | | | | | | |
Capital transfers | | | 0.4 | | | | 0.5 | | | | 0.8 | | | | 0.9 | | | | 1.1 | |
Total capital expenditures | | | 2.2 | | | | 2.4 | | | | 3.8 | | | | 4.4 | | | | 4.2 | |
| | | | | | | | | | | | | | | | | | | | |
Total expenditures | | | 15.0 | | | | 14.9 | | | | 16.2 | | | | 16.2 | | | | 16.2 | |
| | | | | |
Fiscal balance: | | | | | | | | | | | | | | | | | | | | |
Primary fiscal balance | | | 3.2 | | | | 3.5 | | | | (0.2 | ) | | | 1.1 | | | | 2.0 | |
Interest | | | 1.6 | | | | 1.4 | | | | 1.3 | | | | 1.1 | | | | 1.1 | |
| | | | | | | | | | | | | | | | | | | | |
Overall fiscal balance | | | 1.6 | | | | 2.1 | | | | (1.5 | ) | | | 0.1 | | | | 0.9 | |
| | | | | |
Financing: | | | | | | | | | | | | | | | | | | | | |
Foreign financing | | | (2.0 | ) | | | (1.1 | ) | | | 1.1 | | | | (0.7 | ) | | | 0.1 | |
Domestic financing | | | 0.3 | | | | (1.1 | ) | | | 0.4 | | | | 0.6 | | | | (1.1 | ) |
Privatization | | | 0.1 | | | | 0.0 | | | | 0.0 | | | | 0.1 | | | | 0.0 | |
| | | | | | | | | | | | | | | | | | | | |
Total financing | | | (1.6 | ) | | | (2.1 | ) | | | 1.5 | | | | (0.1 | ) | | | (0.9 | ) |
| (2) | Includes transfers from state-owned enterprises and royalties from petroleum companies. |
Source: Central Bank.
One of the García administration’s highest priorities was maintaining fiscal discipline while reorienting public spending towards important social objectives. To achieve fiscal balance, the García administration proposed to follow the provisions set forth under the Fiscal Responsibility and Transparency Act. Some of the most important provisions are the macroeconomic fiscal rules, which limit fiscal deficit, growth in consumption expenditure and public debt.
President Humala’s administration has continued to implement policies that promote macroeconomic stability and fiscal discipline. Among the goals of the President Humala’s administration are to increase fiscal balance surplus, create a counter cyclical fiscal position, decrease external debt and increase tax revenues.
90
Tax Regime
All government taxes in Peru are collected by the Superintendencia Nacional de Administración Tributaria, or SUNAT. SUNAT’s budget is determined primarily through a percentage-based funding mechanism that provides the agency with 1.6% of its domestic tax collections and with 1.5% of import tariffs.
The following table presents the composition of Peru’s tax revenues for the periods shown.
Tax Revenue of Peru (Central Government)
(as a percentage of total tax revenue)
| | | | | | | | | | | | | | | | | | | | |
| | | For the 12 months ended December 31, | |
| | | 2007(1) | | | 2008(1) | | | 2009(1) | | | 2010(1) | | | 2011(1) | |
Income Tax | | | | | | | | | | | | | | | | | | | | |
Individual | | | 8.6 | | | | 9.2 | | | | 10.7 | | | | 9.8 | | | | 10.5 | |
Corporate | | | 27.5 | | | | 28.0 | | | | 23.3 | | | | 25.5 | | | | 28.4 | |
Clearing | | | 7.6 | | | | 4.2 | | | | 4.7 | | | | 4.8 | | | | 5.6 | |
| | | | | | | | | | | | | | | | | | | | |
Total | | | 43.6 | | | | 41.4 | | | | 38.7 | | | | 40.0 | | | | 44.5 | |
| | | | | |
Taxes on goods and services | | | | | | | | | | | | | | | | | | | | |
Value Added Tax | | | 48.3 | | | | 54.2 | | | | 56.2 | | | | 55.2 | | | | 53.6 | |
Excise Tax | | | | | | | | | | | | | | | | | | | | |
Fuel tax | | | 4.6 | | | | 2.5 | | | | 4.3 | | | | 3.7 | | | | 3.0 | |
Other | | | 3.6 | | | | 3.4 | | | | 3.6 | | | | 3.5 | | | | 3.3 | |
| | | | | | | | | | | | | | | | | | | | |
Total Excise Tax | | | 8.2 | | | | 5.9 | | | | 7.9 | | | | 7.2 | | | | 6.3 | |
| | | | | | | | | | | | | | | | | | | | |
| | | | | |
Total taxes on goods and services | | | 56.5 | | | | 60.1 | | | | 64.0 | | | | 62.4 | | | | 59.8 | |
| | | | | |
Import tariffs | | | 4.2 | | | | 3.3 | | | | 2.8 | | | | 2.8 | | | | 1.8 | |
Other taxes | | | 7.4 | | | | 7.5 | | | | 8.4 | | | | 7.1 | | | | 6.7 | |
Tax refund | | | (11.6 | ) | | | (12.3 | ) | | | (14.0 | ) | | | (12.3 | ) | | | (12.9 | ) |
| | | | | | | | | | | | | | | | | | | | |
Total | | | 100.0 | | | | 100.0 | | | | 100.0 | | | | 100.0 | | | | 100.0 | |
| (1) | Reflects adjustments to reconcile estimated income tax withheld with actual income tax liabilities. |
Source: Central Bank.
Income Taxes
The current income tax law is structured over the basis of five income categories. First and Second category income comprise income from capital gains, Fourth and Fifth category income comprise income from labor, and Third category income is related to corporate income.
Income from capital gains is subject to a rate of 6.25% applied over the net income. In order to attain the net income, a fixed deduction of 20% from the gross income is allowed. First category income is the one received by individuals from the lease of movable and fixed property located within Peru; Second category income is the result of capital gains.
Employment income (which may result from employed or self- employed work) is subject to the following tax rates for 2012:
| | | | |
Personal Annual Income (in UIT(1)) | | 2012
(%) | |
Between 0 - 27 | | | 15 | |
Between 27 - 54 | | | 21 | |
Greater than 54 | | | 30 | |
| (1) | UIT is an annual reference index used for tax purposes. For 2012 the UIT is equivalent to S/.3,650, or approximately U.S.$1,375.2. |
Source: Ministry of Economy and Finance.
Despite the fact that dividends are capital gains, they are taxed separately at a rate of 4.1%. Peru treats capital gains as ordinary income for tax purposes.
91
The income tax rate for enterprises legally regarded as located in Peru is 30%, which applies to net worldwide income. Companies also pay the Temporary Net Asset Tax (ITAN) which is applied at a rate of 0.4% on assets exceeding S/.1.0 million, or approximately U.S.$370,782.35.
Some forms of income were exempted from the corporate income tax until December 31, 2011:
| | • | | income of religious and nonprofit institutions; |
| | • | | interest payments payable on development loans granted by international organizations or foreign governments; |
| | • | | interest payments collected or paid by savings and loans cooperatives. |
Furthermore, there are other specific exemptions that apply to certain industries and regions.
Capital Gains Tax
Peru treats all capital gains as ordinary income for tax purposes. In the past, an important proportion of capital incomes were exempt from the tax base.
As of 2012, the following sources of income will not be exempt:
| | • | | capital gains from the transfer of equities, shares, corporate bonds and other securities; |
| | • | | interest generated from securities such as corporate bonds, certificates of deposits and mortgage loans; |
| | • | | yields from participations in mutual funds and investment funds; |
| | • | | interest received by corporations from deposits in the financial system; and |
| | • | | yields from voluntary contributions to pension funds. |
Nevertheless, some exemptions remain effective. For instance, interest by individuals from their deposits in the financial system and yields from mandatory contributions to pension fund administrators. Also, interest and capital gains from instruments issued by the Treasury and funds on deposit pursuant to the Central Bank’s monetary regulation (Overnight Deposits and Certificates of Deposits) remain exempt from taxation.
Value-Added Tax
Effective as of March 1, 2011, Peru imposed an 18.0% value-added tax called the Impuesto General a las Ventas, or IGV, that is applicable to:
| | • | | the sale or import of movable personal property within Peru; |
| | • | | the rendering or use of services in Peru; |
| | • | | construction agreements; and |
| | • | | the first transfer of real estate by a builder. |
Each party in the chain of production generally collects the IGV tax from its customer and pays SUNAT the difference between the tax paid to its suppliers and the tax collected from its customers. For imports of goods, the taxable base is the cost, insurance and freight price plus customs duties, surcharges and excise tax paid on those goods.
92
Some products and services are currently exempt from payment of the IGV, such as fishmeal, various agricultural products, including potatoes, tomatoes, beans, coffee, tea, cocoa and wheat, urban public and cargo transport, financial services, live entertainment and some medicines for cancer, HIV/AIDS and diabetes treatment. Peru also applies a special exemption for purchases made as part of the development of natural resources.
The IGV does not apply to the export of goods or services or construction contracts performed abroad. Exporters are reimbursed any portion of the IGV they pay on the purchase of goods and services they export and can apply those refunds as credits to offset the IGV or income tax liabilities.
A 2% tax known as the Impuesto de Promoción Municipal, or Municipal Development Tax, is also imposed, which is included in the IGV.
Excise Tax
Peru applies an excise tax on selected goods and on gambling activities. The following table shows the tax rates applicable to selected goods as of December 31, 2011.
| | | | |
Product | | Rate (%) | |
Soda | | | 17.0 | |
Gambling | | | 10.0 | |
New cars | | | 10.0 | |
Used cars | | | 30.0 | |
Wines, vermouths, ciders, whiskey, rum, gin | | | 20.0 | |
Cigarettes | | | S/. 0.07 per unit | |
Horse races | | | 2.0 | |
Beer | | | 27.8 | |
Source: Ministry of Economy and Finance.
In the case of Pisco, an alcoholic beverage, the applicable tax is S/.1.50, or approximately U.S.$0.56, per liter.
Peru also imposes an excise tax on fossil fuel products. The tax is levied on the volume sold or imported, expressed in units of measurement established by the Ministry of Economy and Finance. The following table shows the tax rates currently applicable to selected fuel products.
| | | | |
Fuel | | S/. per gallon(1) | |
Gasoline: | | | | |
less than 84 octane | | | 1.17 | |
from 84 - 89 octane | | | 1.07 | |
from 90 - 94 octane | | | 1.46 | |
from 95 - 97 octane | | | 1.69 | |
greater than 97 octane | | | 1.87 | |
Kerosene | | | 1.93 | |
Gas oil | | | 1.06 | |
Diesel B2 | | | 1.04 | |
Residual 6 | | | 0.39 | |
| (1) | As of December 31, 2010. |
Source: Ministry of Economy and Finance.
Financial Transactions Tax
On March 1, 2004, a financial services transaction tax, or ITF, became effective. The ITF is a levy applicable to almost all banking transactions, including transfers and foreign exchange transactions, as well as certain non-banking transactions such as transfers made by fund transfer companies. Although the ITF was initially set at 0.15%, the Government proposed in early March 2004 to decrease the rate. On March 25, 2004, Congress approved the Government’s proposal, effective March 27, 2004, to set the rate at 0.10% through the end of 2004, decreasing to 0.08% during 2005. In late 2006 the Government established a schedule to decrease the rate to 0.07% during 2008, 0.06% during 2009 and 0.05% in 2010. On February 20, 2011, Congress approved, effective April 1, 2011, to decrease the rate to 0.005%, which is the current applicable ITF rate on financial transactions.
93
Royalty Fee
In September 2011, the Mining Royalty Law, Law No. 28,258, was amended to increase the tax payable on metallic and non-metallic mineral resources. Effective October 1, 2011, the royalty for the exploitation of metallic and non-metallic resources is payable on a quarterly basis in an amount equal to the greater of (i) an amount determined in accordance with the statutory scale of tax rates based on a company’s operating profit margin and applied to the company’s operating profit, as adjusted by certain non-deductible expenses, and (ii) 1% of a company’s net sales, in each case during the applicable quarter. The royalty rate applied to the company’s operating profit is based on its operating profit margin and the rate ranges from 1% to 12%.
In addition, there is a royalty fee on hydrocarbons which is calculated according to the value of the hydrocarbon produced and is established on each exploration and production contract.
Special Mining Tax
In September 2011, Congress passed Law No. 29,789 that institutes a special mining tax on the operating profits of mining companies that results from the sale of metallic mining products, self-consumption or unauthorized withdrawals of such products. The special mining tax rate ranges from 2% to 8.40%, depending on the subject company’s quarterly operating profit margin.
Tax Amnesty
There have been no tax amnesties in the five-year period ended December 31, 2011. However, in December 2009, Congress passed Law No. 29,482 in order to exempt from income tax those economic activities performed between 2,500 and 3,200 meters above sea level. The exemption will last 10 years and it excludes mining activities and those activities performed in capital cities.
International tax treaties
Peru has entered into tax treaties in order to avoid double taxation with Chile, Canada, Brazil, the Andean Community (Ecuador, Colombia and Bolivia) and Spain.
The 2012 Budget
Pursuant to the Constitution and the Ley General del Sistema Nacional de Presupuesto, or General Law of the National Budget System, published on December 8, 2004, and effective as of January 1, 2005, the Ministry of Economy and Finance, acting through the Dirección General de Presupuesto Público, or Public Budget Administration Office, is responsible for preparing Peru’s annual budget.
The annual budget is prepared on the basis of:
| | • | | proposals submitted by the various public entities; |
| | • | | matching revenue estimates with goals and priorities established for each entity; and |
| | • | | coordinating balances for previous fiscal years and estimates for future fiscal years. |
The Public Budget Administration Office submits its proposed budget to the Council of Ministers for approval. If the Council of Ministers approves the proposed budget, it is submitted by the President to Congress by August 30 of each year. Upon congressional approval, the proposed budget becomes the Annual Law of the Public Sector Budget. Under the Constitution, if by November 30 of any year, Congress has not submitted to the executive branch an official document commenting on or approving the budget, the budgetary proposal submitted by the President is automatically adopted as the Annual Law of the Public Sector Budget.
94
The 2012 budget was approved by Congress on December 8, 2011, under Law No. 29,812.
The following table summarizes the principal assumptions on which the 2012 budget was based.
Principal Budgetary Assumptions for 2012
| | | | |
Projected real GDP growth | | | 6.0 | % |
Projected (cumulative) inflation | | | 2.0 | % |
Projected average exchange rate | | | S/.2.75 per dollar | |
Source: Ministry of Economy and Finance.
Based on these assumptions, the 2012 budget proposal projects the following:
| | • | | fiscal revenues of S/.95.5 billion, or approximately U.S.$34.7 billion; |
| | • | | non-financial public expenditures of S/.86.5 billion, or approximately U.S.$31.5 billion; and |
| | • | | an overall non-financial public sector surplus of U.S.$4.9 billion, or 1.0% of projected GDP. |
The following tables set forth Peru’s revenues and expenditures of the 2012 budget by principal categories:
| | | | | | | | | | | | | | | | |
| | | National
Government | | | Regional
Governments | | | Local
Governments | | | Total | |
| | | (in millions of nuevos soles) | |
| | | | |
Current expenses | | | 41,131.3 | | | | 11,272.5 | | | | 8,302.3 | | | | 60,706.1 | |
Capital Investments | | | 15,110.6 | | | | 3,513.7 | | | | 7,211.4 | | | | 25,835.7 | |
Debt Services | | | 8,731.0 | | | | 3.1 | | | | 258.7 | | | | 8,992.8 | |
| | | | | | | | | | | | | | | | |
Total expenditures | | | 64,972.9 | | | | 14,789.3 | | | | 15,772.5 | | | | 95,534.6 | |
The following table sets forth the assumed sources of revenue for purposes of the 2012 budget:
| | | | |
Financial Sources | | Amount | |
| | | (in million of nuevos soles) | |
| |
Tax revenue | | | 61,676.0 | |
Administrative and governmental fees | | | 8,969.2 | |
Third-party credit sources | | | 7,193.0 | |
Donations and transfers | | | 547.5 | |
Other (1) | | | 17,148.9 | |
| | | | |
Total | | | 95,534.6 | |
| (1) | Includes revenue from mining rights, concession fees, and related items. |
Social Security
Peru has a two-tier pension system. The public pension system is a pay-as-you-go system by which current social security contributions are used to pay benefits currently provided by the Government. This system requires that the Government contribute to finance pension payments. In 1992, the Government created the private pension system, through the licensing of AFPs, as an alternative to the public pension system.
95
The public pension system has two components:
| | • | | the general pay-as-you-go-system, which applies to the general population and is administered by the Oficina de Normalización Previsional, or Office of Pension Regularization; and |
| | • | | the special public sector regimes for the military, police, teachers, various judges and magistrates, other special segments of the population and other public servants. |
The public sector has two pension reserve funds funded by privatization receipts:
| | • | | the Fondo Consolidado de Reservas Previsionales, or Consolidated Reserve Fund, an autonomous fund with resources earmarked to meet public pension obligations falling due over the medium and long term; and |
| | • | | the Fondo Nacional de Ahorro Público, or National Public Savings Fund, the objective of which is to provide supplemental pensions to all low-income pensioners in the public pension system. |
As of December 31, 2011, there were four AFPs in the private pension system. New entrants to the labor market are automatically enrolled in an AFP unless they elect to enroll in the public pension system within 10 days of employment. Workers may leave the public pension system for an AFP at any time, but once they leave they cannot re-enroll in the public pension system, except as described below. To compensate individuals who switch to the AFPs for pension rights they had accumulated while participating in the public pension system, the Government has authorized the issuance of recognition bonds. Recognition bonds are transferable, zero-coupon bonds indexed to the CPI and redeemable at retirement.
To provide an incentive for individuals to join AFPs and to discourage participation in the public pension system, the Government increased the public pension system contribution rate from 3.0% to 11.0% at 1995 and 13% at 1997. In 2002, Congress approved an increase of the minimum monthly pension in the public pension system from S/.300 to S/.415, or approximately from U.S.$106.8 to U.S.$147.7. As of December 31, 2011, the private pension system contribution rate was 13.3%. Workers are eligible to receive benefits at age 65.
In November 2004, Congress enacted a constitutional reform to unify the administration of public pensions, reduce the financial deficits of the pension funds and improve its distributions to different economic classes. The indexed pension scheme that allowed certain retired government employees to receive a life pension equal to the salary of a worker currently serving in the retiree’s former post or one equivalent to it was eliminated and pension caps were established.
In March 2007, Congress enacted a law to reform the affiliation and return to the public pension system process, with the aim that people that left the public pension system for an AFP, or chose an AFP from the start, and would as a consequence receive a lower pension, were allowed to return or transfer to the public pension system. Accordingly, this law regulates the conditions under which a person may choose to return or transfer to the public pension system and provides mechanisms for making that an informed decision. The estimated cost of the this reform for Peru was approximately U.S.$2.1 billion in actuarial present value. This amount was calculated for 410,000 people and considered greater social security costs to the public pension system due to people that return or transfer to it from the private pension system, the payment of additional pensions and the financial costs of advancing recognition bonds under the exceptional regime of early retirement. As of December 31, 2011, 84,146 people have returned to the public pension system.
Among the policies relating to Peru’s pension system that President Humala has proposed was the creation of Pension 65 that requires payment of S/.250 per month to seniors of 65 years of age and older who did not previously have a pension plan in place to be funded with financing from the National Treasury. As of December 31, 2011, the Government had executed S/.24 million of the budgeted funds. This plan is not financed nor affects any funds currently under management of the AFPs.
96
PUBLIC SECTOR DEBT
Peru’s total public sector debt consists of foreign currency-denominated debt and nuevo sol-denominated debt. Peru’s total public external debt consists of loans from foreign creditors to the Government, the Central Bank and public sector entities.
External Debt
As of December 31, 2011, almost all of Peru’s public sector external debt consisted of foreign currency denominated debt. Taking account of swap agreements, 9.8% of public external debt was denominated in nuevos soles as of December 31, 2011. As of December 31, 2011, public external debt totaled U.S.$20.2 billion, or 11.4% of GDP, compared to U.S.$19.9 billion, or 12.9% of GDP, as of December 31, 2010.
The following tables provide further information on public sector external debt as of the dates shown.
Public Sector External Debt
(in millions of U.S. dollars, except for percentages)
| | | | | | | | | | | | | | | | | | | | |
| | | As of December 31, | |
| | | 2007 | | | 2008 | | | 2009 | | | 2010 | | | 2011 | |
Official reserves liabilities | | | — | | | | — | | | | — | | | | — | | | | — | |
| | | | | |
Official non-reserves liabilities: | | | | | | | | | | | | | | | | | | | | |
Public sector | | | 20,081 | | | | 19,237 | | | | 20,600 | | | | 19,905 | | | | 20,204 | |
| | | | | | | | | | | | | | | | | | | | |
Total official non-reserves liabilities | | | 20,081 | | | | 19,237 | | | | 20,600 | | | | 19,905 | | | | 20,204 | |
| | | | | | | | | | | | | | | | | | | | |
| | | | | |
Total official liabilities | | | 20,081 | | | | 19,237 | | | | 20,600 | | | | 19,905 | | | | 20,204 | |
| | | | | |
Total public sector external debt as % of GDP(1) | | | 18.7 | | | | 15.1 | | | | 16.2 | | | | 12.9 | | | | 11.4 | |
Total public sector external debt as % of total exports(1) | | | 71.5 | | | | 62.0 | | | | 76.4 | | | | 56.0. | | | | 43.7 | |
| (1) | Peru does not include IMF credit use in reports of total public sector external debt. Debt ratios are calculated on the basis of the Peru’s total official non-reserve liabilities. |
Source: Central Bank.
Public Sector External Debt, Net of Reserves
(in millions of U.S. dollars, at current prices)
| | | | | | | | | | | | | | | | | | | | |
| | | As of December 31, | |
| | | 2007 | �� | | 2008 | | | 2009 | | | 2010 | | | 2011 | |
| | | | | |
Public sector external debt(1) | | | 20,081 | | | | 19,237 | | | | 20,600 | | | | 19,905 | | | | 20,204 | |
Gross international reserves of the Central Bank | | | (27,720 | ) | | | (31,233 | ) | | | (33,175 | ) | | | (44,150 | ) | | | (48,859 | ) |
| | | | | | | | | | | | | | | | | | | | |
Public sector external debt, net of reserves | | | (7,639 | ) | | | (11,996 | ) | | | (12,575 | ) | | | (24,245 | ) | | | (28,655 | ) |
| (1) | Peru does not include IMF credit use in reports of total public sector external debt. |
Source: Central Bank.
97
Peru’s credit ratings are as follows:
| | • | | Fitch: long-term issuer default rating of BBB (Outlook Stable); |
| | • | | Standard & Poor’s: long-term foreign currency credit rating of BBB (Outlook Positive); and |
| | • | | Moody’s: long-term foreign currency bonds rating of Baa3 (Outlook Stable). |
A Fitch “BBB” rating indicates that expectations of default are currently low. The capacity for payment of financial commitments is considered adequate but adverse business and economic conditions are more likely to impair this capacity. This is the second notch in investment grade category. A Fitch outlook indicates the direction in which a rating is likely to move over a one to two-year period. Outlooks may be “Positive,” “Stable” or “Negative.” A Positive or Negative outlook does not imply a rating change is inevitable. Similarly, a rating for which outlook is “Stable” could be upgraded or downgraded before an outlook moves to Positive or Negative if circumstances warrant such an action. On November 11, 2011, Fitch upgraded Peru’s long term foreign currency debt rating from “BBB-” to “BBB” with an outlook of Stable.
A Standard & Poor’s “BBB” rating indicates that an obligor exhibits adequate protection parameters. However, adverse economic conditions or changing circumstances are more likely to lead to a weakened capacity of the obligor to meet its financial commitment on the obligation. Securities rated in this category are investment grade. A Standard & Poor’s rating outlook assesses the potential direction of a long-term credit rating over the intermediate to longer term. In determining a rating outlook, consideration is given to any changes in the economic and/or fundamental business conditions. A Standard & Poor’s outlook of “positive” means that a rating may be raised; however, an outlook is not necessarily a precursor of a rating change. On August 30, 2011, Standard & Poor’s upgraded Peru’s long-term foreign currency debt rating from “BBB-” to “BBB” with an outlook of Stable.
For Moody’s, obligations rated “Baa3” are judged to be subject to moderate credit risk. They are considered medium-grade and as such may possess certain speculative characteristics. Moody’s appends numerical modifiers 1, 2 and 3 to each generic rating classification. This is the lowest investment grade category. Securities rated in this category are investment grade. The modifier 1 indicates a high-range ranking in the Baa generic rating classification. Moody’s rating outlook is an opinion regarding the likely direction of a rating over the medium term. Where assigned, rating outlooks fall into the following four categories: Positive, Negative, Stable and Developing (contingent upon an event). On December 16, 2009, Moody’s upgraded Peru’s the foreign currency rating from “Ba1” to “Baa3” with an outlook of Stable.
Ratings are not a recommendation to purchase, hold or sell securities and may be changed, suspended or withdrawn at any time. Peru’s current ratings and the rating outlooks currently assigned to Peru are dependent upon economic conditions and other factors affecting credit risk that are outside the control of Peru. Each rating should be evaluated independently of the others. Detailed explanations of the ratings may be obtained from the rating agencies. The information above was obtained from information available on the websites of the rating agencies.
During the period from 2007 to 2011, multilateral debt represented, on average, 39.8% of Peru’s public sector external debt. Peru’s principal multilateral creditors are the World Bank, representing, on average, 13.9% of outstanding multilateral debt each year from 2007 to 2011, and the IADB, representing, on average, 18.5% of outstanding multilateral debt each year from 2007 to 2011. Loans from the World Bank have funded projects relating to irrigation, agriculture, poverty reduction, education, health reform and transportation. Loans from the IADB have funded projects relating to poverty reduction, education, financial-sector reform and state modernization.
98
The following table provides information on capital flows from multilateral lenders for the periods shown.
Capital Flows from Multilateral Lenders
(in millions of U.S. dollars)
| | | | | | | | | | | | | | | | | | | | |
| | | As of December 31, | |
| | | 2007 | | | 2008 | | | 2009 | | | 2010 | | | 2011 | |
World Bank: | | | | | | | | | | | | | | | | | | | | |
Disbursements minus principal amortizations | | | 15.3 | | | | 63.4 | | | | 134.4 | | | | 118.9 | | | | (232.7 | ) |
Disbursements minus principal, interests and commissions | | | (134.8 | ) | | | (72.4 | ) | | | 27.7 | | | | 56.8 | | | | (293.6 | ) |
| | | | | |
IADB: | | | | | | | | | | | | | | | | | | | | |
Disbursements minus principal amortizations | | | 160.6 | | | | 93.5 | | | | 74.3 | | | | (762.7 | ) | | | (46.8 | ) |
Disbursements minus principal, interests and commissions | | | (30.0 | ) | | | (78.5 | ) | | | (77.9 | ) | | | (908.1 | ) | | | (166.0 | ) |
Source: Ministry of Economy (Dirección Nacional del Endeudamiento Público, or Office of Public Debt).
In 2007, Peru entered into an agreement with the CAF to finance the Social and Infrastructure Investment Against Poverty Program for a total amount of U.S.$400 million. Additionally, two loan agreements for a total amount of U.S.$250 million were entered into with IBRD to finance the Decentralized Rural Transportation Program and the Fiscal Management and Economic Growth Programmatic Loan. As well, Peru entered into two loans with the IADB for a total amount of U.S.$300 million to finance the Program for the Improvement of the National Road Network and the Water Resources Reform Program.
In December 2007 and February 2008, Peru prepaid U.S.$261.6 million and U.S.$166.7 million, respectively, of its outstanding debt with the CAF with proceeds provided by the Treasury. The main benefits of this prepayment were that it lowered the refinancing risk, reduced the financial cost of the outstanding debt with the CAF and restructured debt payments during 2008 through 2016.
During 2008, Peru entered into two loan agreements with the International Bank for Reconstruction and Development, or IBRD, in an aggregate amount of U.S.$170 million to finance the Support Program for Productive Rural Alliances in the Highlands of Peru and the Program for Social Reforms, and a separate U.S.$100 million loan agreement with IADB to finance the Program to Reform Sewage Treatment I. Also in 2008, the IADB approved loans totaling approximately U.S.$280 million to finance various programs, including the Program for the Improvement of the Quality of Management and Public Expense III, Water for Everyone Program, Program to Reform Sewage Treatment III and Development of Agrarian Health and Safety of Agrarian Food Products Program.
In December 2008, Peru entered into a ¥6.66 billion (U.S.$69.4 million) loan agreement with the Japan International Cooperation Agency, or JICA, to fund the Iquitos Sewage Improvement and Expansion Project.
In December 2008, Peru entered into a U.S.$150 million credit agreement with CAF, to finance the Social Investment and Infrastructure Against Poverty Program.
In January 2009, IBRD approved a U.S.$70 million loan to finance the Fiscal Management and Economic Growth II Programmatic Loan. In addition, KFW, or KfW Bankengruppe, approved a €30 million loan to fund the Fiscal Management and Economic Growth II Programmatic Loan and the Program to Reform Sewage Treatment II. IBRD approved two contingent deferred drawdown operation financing programs totaling US$630 million, which can be drawn upon the occurrence of a natural disaster.
In January 2009, Peru entered into a U.S.$300 million credit agreement with CAF, to fund the remaining public work of sections 2, 3 and 4 of the Peru-Brazil inter-oceanic highway, not included in the concessions previously awarded.
99
In March 2009, Peru approved three loan agreements with JICA, in an aggregate amount of ¥9.9 billion, to fund energy and sewage improvement programs.
In October 2009, Peru entered into a U.S.$150 million loan agreement with IADB to finance a program to develop a sustainable energy grid. Finally, in December 2009, Peru entered into a U.S.$150 million fiscal management and economic growth programmatic loan with IBRD.
In December 2009, Kreditanstalt für Wiederaufbau, or KfW, approved a U.S.$50 million loan to fund the program entitled Water and Sewerage Systems Optimization: Sectorization, Network Rehabilitation and Land Registry Update—Area of Influence Huachipa Plant—Drainage Area Comas—Chillón—Lima. In December 2009, Peru entered into the Second Programmatic Environmental Development Policy Loan totaling U.S.$50 million with the International Bank for Reconstruction and Development. In the same month, Peru also entered into a loan agreement with the Inter-American Development Bank totaling U.S.$50 million to finance the Program of Social Sector Reform I; a loan agreement with International Bank for Reconstruction and Development, totaling U.S.$150 million to “Préstamo Programático Gestión Fiscal y Crecimiento Económico III”; and a loan agreement with Inter-American Development Bank totaling U.S.$20 million to “Programa de Reformas del Sector Saneamiento III”. In March 2010, Peru entered into a loan agreement with the Japan International Cooperation Agency, or JICA, in an aggregate amount of ¥9.3 billion (or approximately U.S.$103 million) to fund the Lima Marginal Areas Sanitary Improvement Project.
In March 2010, Peru entered into a loan agreement with the Andean Development Corporation, or CFA, in an aggregate amount of U.S.$300 million to fund the Lima and Callao Electric Mass Transportation System Project. In May 2010, Peru entered into a loan agreement with the CFA, in an aggregate amount of U.S.$300 million to refinance contingent liabilities of Peru.
In June 2010, Peru authorized the entering into loan agreements with the CFA, the Inter-American Development Bank, KfW and the International Fund for Agricultural Development, in an aggregate amount of approximately U.S.$96 million to fund improvement projects.
In August 2010, Peru authorized two loan agreements with IADB and the World Bank, in an aggregate amount of U.S.$125 million.
In September 2010, Peru authorized a loan agreement with the World Bank, for an amount of U.S.$100 million.
In October 2010, Peru authorized two loan agreements with IADB, for an amount of U.S.$25 million each.
In November 2010, Peru authorized ten loan agreements with IADB, the World Bank, CFA and KFW in an aggregate amount of U.S.$566 million.
In November 2010, Peru issued U.S.$1,000,000,000 5.625% US Dollar-Denominated Global Bonds Due 2050, used by Peru to, without limitation, financial investments and the refinancing, repurchasing or retiring its domestic and external indebtedness.
In December 2010, Peru authorized seven loan agreements with the World Bank, CFA and KFW, in an aggregate amount of U.S.$251 million.
On July 5, 2011, Peru entered into a loan agreement with the International Bank for Reconstruction and Development, or IBRD, in an aggregate amount of U.S.$50.0 million to fund the Program for Rural Electrification Development. In July 5, 2011, Peru also entered into a loan agreement with the IBRD, in an aggregate amount of U.S.$25 million, to fund the availability of nutritional products prioritized by the Strategic Nutritional Program.
On June 22, 2011, Peru entered into a loan agreement with the Interamerican Development Bank, or IADB, in an aggregate amount of U.S.$25 million, to fund the Program for Agricultural Competiveness Development.
100
On July 6, 2011, Peru entered into a loan agreement with the Andean Development Corporation, or CAF, in an aggregate amount of approximately U.S.$300 million, to fund the Lima and Callao Electric Mass Transportation System.
On July 22, 2011, Peru entered into a loan agreement with the IBRD, in an aggregate amount of U.S.$54.5 million, to fund the optimization of the Water Supply and Sanitary Systems.
On September 23, 2011, Peru entered into a loan agreement with the IADB, in an aggregate amount of U.S.$25 million, to fund the Program for the Development of the new Sustainable Energetic Matrix.
On September 23, 2011, Peru entered into a loan agreement with the IADB, in an aggregate amount of U.S.$25 million, to fund the Program to Improve the Government’s Response to Natural Disasters.
On December 27, 2011, Peru entered into a loan agreement with the IBRD, in an aggregate amount of U.S.$25 million, to fund the Program for the Support of the Climate Change II.
On December 27, 2011, Peru entered into a loan agreement with the IBRD, in an aggregate amount of U.S.$25 million, to fund the Program for the Second Generation of Reforms to the Sanitation Sector.
As of December 31, 2010, outstanding public sector external debt amounted to approximately U.S.$19.9 billion equivalent to 12.9% of GDP, a decrease of U.S.$0.7 billion compared to debt outstanding at December 31, 2009. This decrease resulted primarily from the net effect of new disbursements minus amortizations, which totaled U.S.$1.1 billion for the period.
During year ended December 31, 2010, disbursements included U.S.$0.7 billion for infrastructure projects and U.S.$0.6 billion for freely available payments (i.e., funds available for debt service) and U.S.$0.9 billion for year 2011 prefinancing and U.S.$1.3 billion Exchange Bond and U.S.$0.3 billion CAF Liability Management Agreement.
As of December 31, 2011, outstanding public sector external debt amounted to approximately U.S.$20.2 billion equivalent to 11.4% of GDP, an increase of U.S.$0.3 billion compared to debt outstanding at December 31, 2010. This increase resulted primarily from the net effect of new disbursements minus amortizations, which amounted to U.S.$150.8 million.
During year ended December 31, 2011, disbursements included U.S.$678.7 million for projects and U.S.$311.1 million for freely available payments.
101
The following tables summarize public sector external debt by creditor for the periods indicated.
Public Sector External Debt by Creditor(1)
(in millions of U.S. dollars, at current prices)
| | | | | | | | | | | | | | | | | | | | |
| | | As of December 31, | |
| | | 2007 | | | 2008 | | | 2009 | | | 2010 | | | 2011 | |
Official creditors: | | | | | | | | | | | | | | | | | | | | |
Multilateral debt: | | | | | | | | | | | | | | | | | | | | |
IADB | | | 3,870 | | | | 3,995 | | | | 4,073 | | | | 3,315 | | | | 3,277 | |
World Bank | | | 2,649 | | | | 2,712 | | | | 2,846 | | | | 2,965 | | | | 2,732 | |
IFAD(2) | | | 32 | | | | 32 | | | | 33 | | | | 31 | | | | 30 | |
IMF | | | — | | | | — | | | | 0 | | | | — | | | | — | |
OPEC(3) | | | 7 | | | | 6 | | | | 5 | | | | 4 | | | | 2 | |
CAF | | | — | | | | — | | | | — | | | | — | | | | 1,849 | |
Other | | | 1,294 | | | | 1,182 | | | | 1,354 | | | | 1,495 | | | | 22 | |
| | | | | | | | | | | | | | | | | | | | |
Total multilateral debt | | | 7,851 | | | | 7,926 | | | | 8,311 | | | �� | 7,810 | | | | 7,913 | |
| | | | | |
Bilateral debt: | | | | | | | | | | | | | | | | | | | | |
Paris Club | | | 3,883 | | | | 4,170 | | | | 3,133 | | | | 2,548 | | | | 2,648 | |
United States | | | — | | | | — | | | | — | | | | — | | | | — | |
Latin America | | | 20 | | | | 15 | | | | 11 | | | | 9 | | | | 7 | |
East Europe countries and China | | | 5 | | | | 3 | | | | 2 | | | | 10 | | | | 10 | |
Japan | | | — | | | | — | | | | — | | | | — | | | | — | |
Other countries | | | — | | | | — | | | | — | | | | — | | | | — | |
| | | | | | | | | | | | | | | | | | | | |
Total bilateral debt | | | 3,908 | | | | 4,189 | | | | 3,146 | | | | 2,567 | | | | 2,665 | |
| | | | | |
Total official debt | | | 11,759 | | | | 12,115 | | | | 11,457 | | | | 10,377 | | | | 10,579 | |
| | | | | |
Private creditors: | | | | | | | | | | | | | | | | | | | | |
Banking | | | 1 | | | | 186 | | | | 186 | | | | 181 | | | | 296 | |
Suppliers | | | 60 | | | | 56 | | | | 51 | | | | 40 | | | | 30 | |
| | | | | | | | | | | | | | | | | | | | |
Total private sector debt | | | 61 | | | | 242 | | | | 237 | | | | 220 | | | | 326 | |
| | | | | |
Bonds: | | | | | | | | | | | | | | | | | | | | |
Brady + Global Bonds | | | 8,262 | | | | 6,880 | | | | 8,906 | | | | 9,308 | | | | 9,299 | |
| | | | | | | | | | | | | | | | | | | | |
Total bonds | | | 8,262 | | | | 6,880 | | | | 8,906 | | | | 9,308 | | | | 9,299 | |
| | | | | | | | | | | | | | | | | | | | |
Total public sector external debt | | | 20,081 | | | | 19,237 | | | | 20,600 | | | | 19,905 | | | | 20,204 | |
| (1) | Medium- and long-term debt, excluding IMF financing. |
| (2) | Refers to the International Fund for Agricultural Development. |
| (3) | Refers to the Organization of Petroleum Exporting Countries. |
Source: Ministry of Economy (Office of Public Credit).
102
Public Sector External Debt by Creditor(1)
(as a percentage of total public sector external debt)
| | | | | | | | | | | | | | | | | | | | |
| | | As of December 31, | |
| | | 2007 | | | 2008 | | | 2009 | | | 2010 | | | 2011 | |
Official creditors: | | | | | | | | | | | | | | | | | | | | |
Multilateral debt: | | | | | | | | | | | | | | | | | | | | |
IADB | | | 19.3 | | | | 20.8 | | | | 19.8 | | | | 16.7 | | | | 16.2 | |
World Bank | | | 13.2 | | | | 14.1 | | | | 13.8 | | | | 14.9 | | | | 13.5 | |
IFAD(2) | | | 0.2 | | | | 0.2 | | | | 0.2 | | | | 0.2 | | | | 0.1 | |
IMF | | | — | | | | — | | | | — | | | | — | | | | — | |
OPEC(3) | | | — | | | | — | | | | — | | | | — | | | | — | |
CAF | | | — | | | | — | | | | — | | | | — | | | | 9.2 | |
Other | | | 6.4 | | | | 6.1 | | | | 6.6 | | | | 7.5 | | | | 0.1 | |
| | | | | | | | | | | | | | | | | | | | |
Total multilateral debt | | | 39.1 | | | | 41.2 | | | | 40.3 | | | | 39.2 | | | | 39.2 | |
| | | | | |
Bilateral debt: | | | | | | | | | | | | | | | | | | | | |
Paris Club | | | 19.3 | | | | 21.7 | | | | 15.2 | | | | 12.8 | | | | 13.1 | |
United States | | | — | | | | — | | | | — | | | | — | | | | — | |
Latin America | | | 0.1 | | | | 0.1 | | | | 0.1 | | | | — | | | | — | |
| | | | | |
East Europe countries and China | | | — | | | | — | | | | — | | | | 0.1 | | | | — | |
Japan | | | — | | | | — | | | | — | | | | — | | | | — | |
Other countries | | | — | | | | — | | | | — | | | | — | | | | — | |
Total bilateral debt | | | 19.5 | | | | 21.8 | | | | 15.3 | | | | 12.9 | | | | 13.2 | |
| | | | | | | | | | | | | | | | | | | | |
Total official debt | | | 58.6 | | | | 63.0 | | | | 55.6 | | | | 52.1 | | | | 52.4 | |
| | | | | |
Private creditors: | | | | | | | | | | | | | | | | | | | | |
Banking | | | — | | | | 1.0 | | | | 0.9 | | | | 0.9 | | | | 1.5 | |
Suppliers | | | 0.3 | | | | 0.3 | | | | 0.2 | | | | 0.2 | | | | 0.1 | |
| | | | | | | | | | | | | | | | | | | | |
Total private sector debt | | | 0.3 | | | | 1.3 | | | | 1.1 | | | | 1.1 | | | | 1.6 | |
| | | | | |
Bonds: | | | | | | | | | | | | | | | | | | | | |
Brady + Global Bonds | | | 41.1 | | | | 35.8 | | | | 43.2 | | | | 46.8 | | | | 46.0 | |
| | | | | | | | | | | | | | | | | | | | |
Total bonds | | | 41.1 | | | | 35.8 | | | | 43.2 | | | | 46.8 | | | | 46.0 | |
| | | | | | | | | | | | | | | | | | | | |
Total public sector external debt | | | 100.0 | | | | 100.0 | | | | 100.0 | | | | 100.0 | | | | 100.0 | |
| (1) | Medium- and long-term debt, excluding IMF financing. |
| (2) | Refers to the International Fund for Agricultural Development. |
| (3) | Refers to the Organization of Petroleum Exporting Countries. |
Source: Ministry of Economy (Office of Public Credit).
Public Sector External Debt Structure by Maturity Term
(in millions of U.S. dollars and as a percentage of total public sector external debt)(1)
| | | | | | | | | | | | | | | | | | | | |
| | | As of December 31, | |
| | | 2007 | | | 2008 | | | 2009 | | | 2010 | | | 2011 | |
| | | | | |
Short-term debt | | | 921 | | | | 736 | | | | 124 | | | | 45 | | | | 43 | |
Medium- and long-term debt | | | 20,081 | | | | 19,237 | | | | 20,600 | | | | 19,905 | | | | 20,204 | |
| | | | | | | | | | | | | | | | | | | | |
Total | | | 21,002 | | | | 19,973 | | | | 20,724 | | | | 19,950 | | | | 20,247 | |
Short-term debt (as a % of total public sector external debt) | | | 4.4 | | | | 3.7 | | | | 0.6 | | | | 0.2 | | | | 0.2 | |
Medium- and long-term debt (as a % of total public sector external debt) | | | 95.6 | | | | 96.3 | | | | 99.4 | | | | 99.8 | | | | 99.8 | |
| (1) | Includes Central Bank debt. |
Source: Central Bank.
103
The following table provides public sector external debt by currency as of December 31, 2011.
Summary of Public Sector External Debt by Currency(1)(2)
(in millions of U.S. dollars, except for percentages)
| | | | | | | | |
| | | As of December 31, 2011 | |
Currency | | U.S.$ | | | % | |
| | |
U.S. Dollar | | | 16,918 | | | | 83.7 | |
Japanese yen | | | 2,062 | | | | 10.2 | |
Special Drawing Rights (SDR) | | | — | | | | — | |
Single currency pool (SCP)(3) | | | — | | | | — | |
English pound | | | — | | | | — | |
Canadian dollar | | | 0.024 | | | | — | |
Special Drawing Rights (SDR) | | | 29.952 | | | | 0.1 | |
Euro | | | 930 | | | | 4.6 | |
Swiss franc | | | 0.074 | | | | — | |
Nuevo sol(4) | | | 264 | | | | 1.3 | |
| | | | | | | | |
Total | | | 20,204 | | | | 100.0 | |
| (1) | Exchange rate as of December 31, 2011. |
| (2) | Includes outstanding Cofide U.S.$116.0 million non-republic guarantee loans. |
| (3) | World Bank unit of account, based on a basket of national currencies. |
| (4) | IADB loans converted to nuevos soles. |
Source: Ministry of Economy (Dirección General de Crédito Público (Office of Public Credit)).
During the period from 2007 to 2011, total public sector external debt service decreased, as a percentage of total fiscal revenue, from 35.2% in 2007 to 5.8% in 2011, including the Paris Club II prepayments, the Japeco prepayment, the Brady Bonds and Global 2012 Tender and Exchange, the Brady Bonds Redemption, the Global Bonds Tender and Exchange and prepayments to IABB, CAF and Japan. Public sector external debt service measured as a percentage of total exports of goods and services decreased from 20.9% in 2007 to 3.6% in 2011. As a percentage of GDP, public sector external debt service decreased from 6.4% in 2007 to 1.1% in 2011. The amortization in 2007 includes Paris Club II and Japeco prepayments, the Brady Bonds and Global 2012 Tender and Exchange. The amortization amount shown for 2008 includes the redemption of Brady Bonds and the prepayment of outstanding debt with CAF and Japeco. The amortization amount shown for 2009 includes total prepayment to Paris Club creditors, including those that were not included in the 2007 prepayment. The amortization amount shown for 2010 includes the tender offer and exchange of the global bonds, and prepayments to IABB, CAF and Japan. The amortization amount shown for 2011 includes current payments to Paris Club creditors, IABB, BIRF, CAF and FIDA.
The following table provides information regarding Peru’s public sector external debt service as of the dates shown.
Public Sector External Debt Service(1)
(in millions of U.S. dollars, except for percentages)
| | | | | | | | | | | | | | | | | | | | |
| | | As of December 31, | |
| | | 2007 | | | 2008 | | | 2009 | | | 2010 | | | 2011 | |
| | | | | |
Interest payments | | | 1,411 | | | | 1,156 | | | | 1,078 | | | | 1,093 | | | | 1,036 | |
Amortization | | | 5,466 | | | | 2,580 | | | | 1,847 | | | | 4,916 | | | | 839 | |
| | | | | | | | | | | | | | | | | | | | |
Total public sector external debt service | | | 6,877 | | | | 3,736 | | | | 2,924 | | | | 6,009 | | | | 1,875 | |
| | | | | |
As % of total exports(2) | | | 20.9 | | | | 10.2 | | | | 9.1 | | | | 14.8 | | | | 3.6 | |
As % of total exports and workers’ remittances | | | 19.7 | | | | 9.6 | | | | 8.5 | | | | 15.8 | | | | 3.8 | |
As % of GDP | | | 6.4 | | | | 2.9 | | | | 2.3 | | | | 3.9 | | | | 1.1 | |
As % of total fiscal revenue | | | 35.2 | | | | 15.9 | | | | 14.3 | | | | 22.5 | | | | 5.8 | |
| (1) | Medium and long-term debt service; excludes Central Bank debt and excludes extraordinary financing and refinancing. |
| (2) | Includes exports of goods and services and investment income. |
Source: Central Bank.
In 2007, interest payments on public sector external debt were U.S.$1.4 billion, or 1.3% of GDP, compared to U.S.$1.3 billion or 1.4% of GDP, in 2006. In 2007, Peru paid U.S.$229.3 million in interest to Paris Club creditors, U.S.$479.3 million to multilateral creditors, U.S.$85.1 million to holders of Brady Bonds, U.S.$613.0 million to holders of sovereign bonds, and U.S.$4.3 million to other creditors.
104
In 2008, interest payments on public sector external debt were U.S.$1.1 billion, or 0.9% of GDP. In 2008, Peru paid U.S.$145.8 million in interest to Paris Club creditors, U.S.$404.5 million to multilateral creditors, U.S.$28.9 million to holders of Brady Bonds, U.S.$569.5 million to holders of sovereign bonds and U.S.$8.7 million to other creditors.
In 2009, interest payments on public sector external debt were U.S.$1.1 billion, or 0.8% of GDP. In 2009, Peru paid U.S.$124.7 million in interest to Paris Club creditors, U.S.$311.8 million to multilateral creditors, U.S.$1.7 million to holders of Brady Bonds, U.S.$631.5 million to holders of sovereign bonds, and U.S.$8.3 million to other creditors.
In 2010, interest payments on public sector external debt were U.S.$1.1 billion, or 3.9% of GDP. In 2010, Peru paid U.S.$79.3 million in interest to Paris Club creditors, U.S.$250.4 million to multilateral creditors, U.S.$1.7 million to holders of Brady Bonds, U.S.$743.0 million to holders of sovereign bonds, and U.S.$18.9 million to other creditors.
In 2011, interest payments on public sector external debt were U.S.$1,0 billion, or 0.6% of GDP. In 2011, Peru paid U.S.$214.1 million in interest to international organizations, U.S.$63.3 million in interest to Paris Club creditors, U.S.$704.2 million in interest to holders of sovereign bonds, U.S.$1.7 million to holders of Brady Bonds, and U.S.$52.6 million to other creditors.
105
The following table provides estimated medium- and long-term public sector external debt service through 2016.
Estimated Public Sector Debt Service by Debtor(1)(2)
2012 - 2016
(in millions of U.S. dollars)
| | | | | | | | | | | | | | | | | | | | | | | | | | | | | | | | | | | | | | | | | | | | | | | | | | | | | | | | | | | | |
| | | | | | | | | | | | For the 12 months ended December 31, | |
| | | 2012 | | | 2013 | | | 2014 | | | 2015 | | | 2016 | |
| | | Principal | | | Interest | | | Total | | | Principal | | | Interest | | | Total | | | Principal | | | Interest | | | Total | | | Principal | | | Interest | | | Total | | | Principal | | | Interest | | | Total | |
| | | | | | | | | | | | | | | |
Non-financial public sector: | | | 1,159 | | | | 966 | | | | 2,124 | | | | 931 | | | | 946 | | | | 1,878 | | | | 1,203 | | | | 940 | | | | 2,143 | | | | 1,057 | | | | 882 | | | | 1,939 | | | | 1,415 | | | | 816 | | | | 2,231 | |
Central government | | | 1,108 | | | | 950 | | | | 2,058 | | | | 874 | | | | 931 | | | | 1,805 | | | | 1,140 | | | | 925 | | | | 2,065 | | | | 1,009 | | | | 868 | | | | 1,877 | | | | 1,366 | | | | 802 | | | | 2,168 | |
Public enterprises | | | 51 | | | | 15 | | | | 67 | | | | 58 | | | | 15 | | | | 73 | | | | 63 | | | | 15 | | | | 78 | | | | 48 | | | | 14 | | | | 62 | | | | 50 | | | | 14 | | | | 63 | |
Financial public sector | | | 39 | | | | 14 | | | | 53 | | | | 254 | | | | 11 | | | | 265 | | | | 40 | | | | 9 | | | | 49 | | | | 36 | | | | 8 | | | | 44 | | | | 35 | | | | 7 | | | | 42 | |
| | | | | | | | | | | | | | | | | | | | | | | | | | | | | | | | | | | | | | | | | | | | | | | | | | | | | | | | | | | | |
Total public sector | | | 1,198 | | | | 979 | | | | 2,177 | | | | 1,185 | | | | 957 | | | | 2,142 | | | | 1,243 | | | | 948 | | | | 2,192 | | | | 1,093 | | | | 890 | | | | 1,983 | | | | 1,450 | | | | 823 | | | | 2,273 | |
| (1) | Disbursements Preliminary estimates, as of December 31, 2011. |
| (2) | Includes Loans to COFIDE not guaranteed by Peru. |
Source: Ministry of Economy (Office of Public Credit).
106
Peru issued public sector external bonds in connection with the Brady restructuring. As of December 31, 2011 approximately U.S.$53.7 million principal amount remained outstanding on the Brady Bonds. For a description of the Brady restructuring, see “Debt Management and Restructuring” below.
Domestic Debt
The following table provides total public sector domestic debt, excluding intra-governmental debt, as of the dates shown.
Total Public Sector Domestic Debt
(in millions of U.S. dollars, at current prices)
| | | | | | | | | | | | | | | | | | | | |
| | | As of December 31, | |
| | | 2007 | | | 2008 | | | 2009 | | | 2010 | | | 2011 | |
| | | | | |
Long-term debt: | | | | | | | | | | | | | | | | | | | | |
Banco de la Nación | | | 19.1 | | | | 39.0 | | | | 197.9 | | | | 374.2 | | | | 635.0 | |
Treasury bonds | | | 10,382.4 | | | | 10,053.9 | | | | 11,291.7 | | | | 13,801.5 | | | | 14,532.0 | |
Other | | | 78.0 | | | | 76.6 | | | | 79.1 | | | | 35.5 | | | | 19.4 | |
| | | | | | | | | | | | | | | | | | | | |
Total long-term debt | | | 10,479.6 | | | | 10,169.5 | | | | 11,568.7 | | | | 14,211.1 | | | | 15,186.3 | |
| | | | | |
Short-term debt | | | 1,349.0 | | | | 1,227.0 | | | | 2,307.0 | | | | 1,902.0 | | | | 2,915.0 | |
| | | | | | | | | | | | | | | | | | | | |
Total | | | 11,828.3 | | | | 11,396.7 | | | | 13,876.0 | | | | 16,113.2 | | | | 18,101.2 | |
| | | | | |
Total public sector domestic debt, as % of GDP | | | 11.0 | | | | 9.0 | | | | 10.9 | | | | 10.5 | | | | 10.2 | |
Source: Central Bank.
The following table provides a list of Peru’s outstanding domestic public sector bonds as of the dates shown.
Public Sector Domestic Bonds(1)
(in millions of U.S. dollars, at current prices)
| | | | | | | | |
| | | Principal Amount
Outstanding
as of December 31, 2010 | | | Principal Amount
Outstanding
as of December 31, 2011 | |
| | |
Central Bank Capitalization bonds | | | — | | | | — | |
Financial system support bonds | | | 122 | | | | 122 | |
Debt exchange bonds | | | 694 | | | | 701 | |
Pension recognition bonds | | | 2,835 | | | | 2,864 | |
Sovereign bonds | | | 10,150 | | | | 10,845 | |
Other bonds | | | 35 | | | | 19 | |
| | | | | | | | |
Total | | | 13,836 | | | | 14,551 | |
| (1) | Excludes intra-government debt issued in the form of bonds. |
Source: Central Bank.
In March 2001, the Government established a public auction system for bonds issued in nuevos soles. This system has increased the availability of investment instruments in the domestic capital markets and reduced Peru’s exposure to currency exchange risk. In 2003, Peru launched the Market Makers’ Program to create a domestic market for Peru’s nuevo sol-denominated public sector debt. Since 2003, Peru has issued its public sector, nuevo sol-denominated debt through this program. The Market Makers’ Program has also helped increase the depth and liquidity of the domestic market for public sector debt.
Pursuant to the Market Maker’s Program, Peru issued nuevo sol-denominated bonds for an equivalent of U.S.$719.2 million in 2007, U.S.$439.3 million in 2008, U.S.$466.5 million in 2009, U.S.$402.7 million in 2010 and U.S.$419.3 million in 2011.
107
Debt Management and Restructuring
The regional debt crisis, which started in 1982, resulted in a growing unwillingness of foreign commercial banks to lend to Peru. At the same time, a sharp decrease in the export prices of mining products and the 1982-1983 El Niño phenomenon led to a deterioration in Peru’s balance of payments and fiscal accounts, which made it difficult for Peru to service its debt. Faced with an unsustainable debt burden, the Government suspended payment on its external commercial bank debt in 1984. By the end of 1984, Peru had failed to make scheduled payments of U.S.$1.0 billion in principal and interest on its commercial bank debt.
In 1985, the first García administration declared that service of the public sector external debt would not exceed 10% of total exports. In 1986, the IMF declared Peru ineligible for additional funds, and, in 1987, the World Bank suspended loan disbursements to Peru. Despite a decline in new loans, Peru’s total public sector debt increased from U.S.$10.9 billion to U.S.$18.9 billion from 1985 to 1990, as unpaid interest continued to accrue.
In 1991, the Fujimori administration began a series of negotiations that led to a normalization of relations with multilateral creditors. In September 1991, Peru paid all amounts in arrears owed to the IADB. In March 1993, Peru paid a total of U.S.$1.8 billion in arrears owed to the IMF and the World Bank. Since 1993, the IMF has approved the following credit facilities:
| | • | | in 1993, the IMF approved a U.S.$1.5 billion Extended Fund Facility for the period from 1993 to 1995; |
| | • | | in 1996, the IMF approved a U.S.$358 million Extended Fund Facility for the period from 1996 to 1998; |
| | • | | in 1999, the IMF approved a U.S.$512 million Extended Fund Facility for the period from 1999 to 2000; |
| | • | | in 2002, the IMF approved a U.S.$316 million stand-by credit facility for the period from 2002 to 2004; |
| | • | | in 2004, the IMF approved a U.S.$423 million stand-by credit facility for the period from 2004 to mid-2006; and |
| | • | | in 2007, the IMF approved a U.S.$257 million stand-by credit facility for the period from 2007 to February 2009. |
Except for the 2007 stand-by credit facility on which Peru does not intend to draw and the 2002 and 2004 stand-by credit facilities on which Peru did not draw, these credit facilities were primarily intended to help Peru overcome its fiscal deficits.
The Fujimori administration also negotiated substantial reductions in Peru’s short-term external debt with its principal bilateral creditors. During the 1990s, Peru conducted the following three rounds of negotiations with the Paris Club:
| | • | | in September 1991, Peru rescheduled U.S.$4.7 billion of its Paris Club debt maturing between October 1991 and December 1992; |
| | • | | in May 1993, Peru rescheduled an additional U.S.$1.9 billion of its Paris Club debt maturing between March 1993 and March 1996; and |
| | • | | in July 1996, Peru rescheduled an additional U.S.$6.8 billion of its Paris Club debt maturing between April 1996 and December 1998. |
108
As a result of this restructuring, Peru obtained the following extensions with respect to credits maturing in the relevant period:
| | • | | a 20-year extension for concessionary credits, with a ten-year grace period; and |
| | • | | a 14-year extension for commercial credits, representing the majority of Peru’s Paris Club debt, with a seven-year grace period. |
Additionally, as a result of the 1996 restructuring, Peru obtained the following reductions in its debt:
| | • | | a reduction in debt payments from U.S.$970 million per year to approximately U.S.$530 million per year for indebtedness maturing between April 1996 and December 1998; and |
| | • | | a reduction in debt payments from U.S.$1.2 billion per year to approximately U.S.$1.0 billion per year for indebtedness maturing between 1999 and 2006. |
In 1997, Peru renegotiated its debt with international commercial banks under the Brady restructuring. The Brady restructuring reduced Peru’s international commercial bank debt from U.S.$10.6 billion to U.S.$4.9 billion, U.S.$2.4 billion of which were Past-Due Interest Bonds, U.S.$1.7 billion were Front-Loaded Interest Reduction Bonds, U.S.$572 million were Floating Rate, or Discount, Bonds and U.S.$183 million were Fixed Rate, or Par, Bonds. The Past-Due Interest Bonds and Front-Loaded Interest Reduction Bonds each have a 20-year term. The Discount Bonds and the Par Bonds each have a 30-year term and are collateralized by zero-coupon U.S. Treasury bonds.
Since the restructuring, Peru has not defaulted on the payment of any amounts in respect of its public external debt obligations.
In February 2002, Peru launched its first international bond offering in 74 years. Peru issued U.S.$500 million principal amount of global bonds. At the same time, Peru retired U.S.$1.2 billion principal amount of its outstanding Brady Bonds in exchange for a further U.S.$923 million principal amount of global bonds. The exchange lowered Peru’s debt by U.S.$111 million and released U.S.$50 million in collateral backing the Brady Bonds. After issuing the global bonds and taking into account amortization of the Past-Due Interest Bonds in March 2002, the current amounts outstanding are U.S.$1.1 billion of Past-Due Interest Bonds, U.S.$1.2 billion of Front-Loaded Interest Reduction Bonds, U.S.$198 million of Discount Bonds and U.S.$64 million of Par Bonds.
Since the February 2002 international bond offering, Peru has issued the following additional series of bonds in the international markets:
| | • | | In December 2002, Peru issued U.S.$500 million principal amount of its 9.125% debt securities due 2008. |
| | • | | In February 2003, Peru issued U.S.$500 million principal amount of its 9.875% debt securities due 2015. |
| | • | | In March 2003, Peru issued U.S.$250 million principal amount of its 9.875% debt securities due 2015. This offering was a reopening of the February 2003 offering. |
| | • | | On November 21, 2003, Peru issued U.S.$500 million of its 8.750% debt securities due 2033. |
| | • | | On May 3, 2004, Peru issued U.S.$500 million of its 8.375% debt securities due 2016. |
| | • | | On October 7, 2004, Peru issued €650 million of its 7.50% debt securities due 2014. |
109
| | • | | In January 2005, Peru issued U.S.$400 million principal amount of its 8.75% debt securities due 2033. This offering was a reopening of the November 2003 offering. |
| | • | | On July 19, 2005, Peru issued an aggregate principal amount of U.S.$750 million of its 7.35% debt securities due 2025. The proceeds of this transaction were used to prepay Paris Club creditors. |
| | • | | In December 2005, Peru issued U.S.$500 million principal amount of its 7.35% debt securities maturing in 2025. This offering was a reopening of the July 2005 offering. The proceeds of this transaction were used to prepay the Japan Peru Oil Co. loans. |
| | • | | In January 2007, Peru made an invitation to holders of its 9.125% U.S. Dollar-Denominated Global Bonds due 2012, or the 2012 Bonds, to submit offers to exchange their bonds for 8.375% U.S. Dollar-Denominated Global Bonds due 2016 or 8.75% U.S. Dollar-Denominated Global Bonds due 2033, or tender their bonds for cash. In addition, Peru made an invitation to holders of its Past-Due Interest Bonds due March 2017, Front-Loaded Interest Reduction Bonds due March 2017, Floating Rate Bonds due 2027 and the Fixed Rate Bonds due 2027, or collectively the Brady Bonds, to submit offers to exchange their bonds for U.S. Dollar-Denominated Global Bonds due 2037 or tender their bonds for cash. The exchange and tender offers by holders of 2012 Bonds and Brady Bonds were settled in March with approximately U.S.$2.3 billion tendered bonds and U.S.$2.2 issued bonds. This transaction reduced amount of outstanding debt, freed collateral from the Brady Bonds and restructured payments for approximately U.S.$1.1 billion in year 2012. |
| | • | | In March 2009, Peru issued U.S.$1.0 billion principal amount of its 7.125% debt securities maturing in 2019. The proceeds of this transaction were used to prefinance a portion of the general financial requirements of Peru for the year 2010. |
| | • | | In July 2009, Peru issued U.S.$1.0 billion principal amount of its 7.35% debt securities maturing in 2025. This offering was a reopening of the July 2005 offering. The proceeds of this transaction were used to prepay Paris Club lenders that did not participate in the 2007 prepayment transaction. |
| | • | | In April 2010, Peru made an invitation to holders of its 9.125% U.S. Dollar-Denominated Global Bonds due 2012 (the “2012 Bonds”), 7.500% EUR-Denominated Global Bonds due 2014 (the “2014 Bonds”), 9.875% U.S. Dollar-Denominated Global Bonds due 2015 (the “2015 Bonds”), and 8.375% U.S. Dollar-Denominated Global Bonds due 2016 (the “2016 Bonds” and, together with the 2012 Bonds, the 2014 Bonds and the 2015 Bonds, the “Eligible Bonds”) to submit one or more offers to exchange any and all Eligible Bonds for 8.75% U.S. Dollar-Denominated Global Bonds due 2033 (the “2033 Bonds”) and/or tender Eligible Bonds for cash. The exchange and tender offers by holders of Eligible Bonds were settled in April, 2010 with approximately U.S.$1.4 billion tendered bonds and U.S.$1.3 issued bonds. This transaction will reduce the amount of outstanding debt for approximately U.S.$1.8 billion between 2012 and 2016. |
| | • | | In November 2010, Peru issued a U.S.$1,000,000,000 5.625% U.S. dollar-denominated global bonds due 2050 to (i) reimburse to Peru’s Public Treasury (Tesoro Público) approximately U.S.$63 million in connection with the financing of the exchange and tender offer of certain global bonds that Peru consummated in April 2010, and (ii) prefinance a portion of the general financial requirements for the year 2011. |
| | • | | In February 2012, Peru issued a U.S.$500,000,000 5.625% U.S. dollar-denominated global bonds due 2050 and S./1,614,918,000 aggregate principal amount of 6.95% Nuevo Sol-Denominated Bonos Soberanos due 2031. The use of proceed of both issuance was to support the balance of payments. |
Peru has used the proceeds from these international bond offerings to repay existing debt, to increase international reserves, and for the general purposes of the Government, including financial investment and the refinancing, repurchasing and retiring of domestic and external indebtedness.
110
On May 23, 2007, the Paris Club creditors and Peru signed a multilateral agreement in which the Paris Club accepted Peru’s proposal to prepay, at par and by voluntary participation of each creditor, up to U.S.$2.5 billion (after payment of the June 30, 2007 and August 15, 2007 installments) of the commercial debt, to be paid up to 2015. The multilateral agreement set out the basic terms of the prepayment operation and established the framework under which Peru would engage in bilateral prepayment agreements with participating creditors. Under this multilateral agreement the Government will prepay each participating creditor the capital requested for prepayment at par on October 1, 2007, and the interest accruing on the capital requested for prepayment up to October 1, 2007 under each rescheduling agreement. On July 2, 2007, Peru announced the individual Paris Club creditor countries that had accepted the prepayment offer.
In October 2007, the prepayment described above was finalized for a total aggregate amount of U.S.$1.7 billion, representing approximately 32% of the total outstanding principal amount of Peru’s Paris Club debt. As a result of the prepayment, Peru reduced its Paris Club commercial debt amortization payments by approximately U.S.$33 million for 2007, U.S.$100 million for each of 2008 and 2009, and U.S.$260 million for each year from 2010 through 2015. Funding for the prepayment came from the proceeds of a 30-year sovereign bond issuance in local currency for S/.4,750 million (approximately U.S.$1,503 million), and approximately U.S.$290 million in proceeds from the Treasury.
Peru believes that other likely benefits of the Paris Club prepayment will be increased financial flexibility and reduced refinancing risk by replacing debt currently held by Paris Club creditors with debt held by investors in the capital markets. Also, the prepayment of its Paris Club commercial debt is expected to reduce foreign exchange exposure, since Peru expects to mainly use debt denominated in its own currency to prepay a portion of its outstanding Paris Club commercial debt.
In March 2008, Peru exercised its redemption right over the Brady Bonds, redeeming Brady Bonds for an amount equal to approximately U.S.$816 million. In December 2008, Peru prepaid outstanding debt with CAF for an aggregate amount of U.S.$150 million.
As of December 31, 2010, Peru’s total outstanding debt with the Paris Club amounted to U.S.$2.5 billion, representing approximately 12.8% of Peru’s total public external debt. As of December 31, 2011, Peru’s total outstanding debt with the Paris Club amounted to U.S.$2.6 billion, representing approximately 13.1% of Peru’s total external debt. Peru’s Paris Club creditors are governmental institutions located in 15 countries. A significant portion of Peru’s Paris Club debt has been subject to rescheduling agreements under the umbrella of the Paris Club.
Debt Record
Since the Brady restructuring in 1997, Peru has, except as described below, timely serviced its external debt without default.
Upon completion of the Brady restructuring, Peru ceased paying principal and interest to lenders who did not participate in the restructuring. These lenders included Elliot Associates, L.P., a private investment firm that acquired U.S.$20 million in debt issued by Peru. Elliot Associates obtained a U.S.$55.7 million judgment against Peru for non-payment of interest and an attachment of Peru’s funds held at Chase Manhattan Bank of New York that Peru had allocated for interest payments on its Brady Bonds. As a result of the attachment, on September 7, 2000, Peru failed to make a required interest payment of U.S.$80 million on the Brady Bonds, even though it had deposited the requisite amount in its account at Chase.
On September 26, 2000, Elliot Associates obtained an injunction against the Euroclear System clearing agency that prevented it from receiving or distributing funds provided by Peru to pay interest on the Brady Bonds. The Elliot Associates litigation was settled following the issuance of the injunction against the Euroclear System, and Peru made interest payments on the Brady Bonds on October 4, 2000, within the applicable 30-day grace period. Peru has made all its debt payments to Elliot Associates in accordance with the terms of the settlement.
Other creditors also failed to participate in the Brady restructuring for reasons that included failure to provide the required documentation and failure to identify the actual holder of the debt to be exchanged. Since the
111
Brady restructuring, Peru has been in default on payments to these creditors. As of December 31, 2011, there were no further scheduled amortizations or interest payments on these debts. None of these creditors has submitted claims against Peru for overdue amounts.
As of the date of this prospectus, Peru is unaware of any other claims filed against it, in Peru or abroad, for overdue debt payments and Peru is not involved in any disputes with its internal or external creditors
112
DESCRIPTION OF THE SECURITIES
This prospectus provides a general description of the debt securities, warrants and units that Peru may offer. Each time Peru offers securities, Peru will provide a prospectus supplement that will contain specific information about the terms of that offering. A prospectus supplement may also add, update or change information contained in this prospectus. If the information in this prospectus differs from that in any prospectus supplement, you should rely on the updated information in the prospectus supplement.
Debt Securities
Peru will issue the debt securities under a fiscal agency agreement, dated as of February 6, 2003, as amended by Amendment No. 1, dated November 21, 2003, and Amendment No. 2, dated October 14, 2004, to the fiscal agency agreement, between Peru and JPMorgan Chase Bank, as fiscal agent, principal paying agent and registrar, or another fiscal agency agreement in a substantially similar form. The fiscal agency agreement, as amended by Amendment No. 1 and Amendment No. 2, and it may be further amended from time to time, is referred to herein as the fiscal agency agreement. Peru has filed the fiscal agency agreement with the SEC and at the office of the fiscal agent in New York. You should read the fiscal agency agreement, the form of debt securities attached at the end of the fiscal agency agreement and the applicable prospectus supplement before making your decision whether to invest in the debt securities.
In this description of the debt securities, you will see some capitalized terms. These terms have particular legal meanings, which you can find under “—Defined Terms” below.
Overview
The prospectus supplement relating to any series of debt securities offered will include specific terms relating to that series of debt securities. Those terms will include some or all of the following:
| | • | | any limit on the aggregate principal amount; |
| | • | | if that series of debt securities will bear interest, the interest rate, which may be fixed or floating, the date from which interest will accrue, and the interest payment dates and the record dates for these interest payment dates; |
| | • | | a description of any index Peru will use to determine the amount of principal, premium or interest payments; |
| | • | | the places where and the manner in which principal, interest and other payments will be made; |
| | • | | the form of debt security, and, in the case of global securities, the depositary; |
| | • | | if that series of debt securities will be guaranteed, the guarantor and whether the guarantee will be partial or full; |
| | • | | any mandatory or optional sinking fund provisions; |
| | • | | any provisions that will allow Peru to redeem that series of debt securities at its option; |
113
| | • | | any provisions that entitle the holders to early repayment at their option; |
| | • | | the currency in which that series of debt securities is denominated and in which Peru will make payments; |
| | • | | if other than the law of the State of New York, the law of the governing jurisdiction; |
| | • | | the authorized denominations; |
| | • | | any additional agreements of Peru and any additional events that give holders of that series of debt securities the right to accelerate the maturity of the debt securities; |
| | • | | any terms upon which holders of that series of debt securities may exchange or convert the debt securities; |
| | • | | whether that series of debt securities will be listed and, if listed, the stock exchanges on which it will be listed; and |
| | • | | any other terms of that series of debt securities. |
Peru may issue debt securities in exchange for other debt securities or that are convertible into new debt securities. The specific terms of the exchange or conversion of any debt security and the debt security for which it will be exchangeable or into which it will be converted will be described in the prospectus supplement relating to that exchangeable or convertible debt security.
Peru may issue debt securities at a discount below their stated principal amount, bearing no interest or interest at a rate that, at the time of issuance, is below market rates. Peru may also issue floating-rate debt securities that are exchangeable for fixed-rate debt securities. Peru will describe the applicable U.S. federal income tax consequences in the prospectus supplements for these offerings.
Peru is not required to issue all of its debt securities under the fiscal agency agreement and this prospectus, but instead may issue debt securities other than those described in this prospectus under other fiscal agency agreements and documentation. That documentation may contain terms different from those included in the fiscal agency agreement and described in this prospectus.
Status
The debt securities will be direct, general, unconditional, unsubordinated and unsecured obligations of Peru. Peru has pledged its full faith and credit to make all payments on the debt securities when due. The debt securities will rank equally, without any preference among themselves, with all of Peru’s other existing and future unsecured and unsubordinated External Indebtedness.
Form and Denomination
Unless otherwise provided in the prospectus supplement for an offering, Peru will issue debt securities:
| | • | | denominated in U.S. dollars; |
| | • | | in fully registered book-entry form; |
| | • | | in denominations of U.S.$1,000 and integral multiples of U.S.$1,000. |
114
Debt securities in book-entry form will be represented by one or more global securities registered in the name of a nominee of The Depository Trust Company, or DTC. Beneficial ownership interests in a global security will only be recorded on, and transferred through, the records maintained by DTC and its participants, including the depositaries for Euroclear Bank S.A./N.V., as operator of the Euroclear System, or Euroclear, and Clearstream Banking société anonyme, or Clearstream, Luxembourg.
Payments
Unless otherwise provided in the prospectus supplement for an offering, Peru will pay principal and interest payable on any maturity date in U.S. dollars in immediately available funds to the person in whose name each debt security is registered on its maturity date, upon presentation and surrender of the debt security at the corporate trust office of the fiscal agent or, subject to applicable laws and regulations, at the office of any paying agent. Peru will pay interest on each debt security, other than interest payable on any maturity date, to the person in whose name the debt security is registered at the close of business on the record date for the relevant interest payment date.
Because each debt security will be represented by one or more global notes and beneficial interests in the debt securities may not be exchanged for debt securities in physically-certificated form, except in limited circumstances, Peru will make payments of principal and interest on each debt security by directing the fiscal agent to make a wire transfer of U.S. dollars to DTC or its nominee as the registered owner of the debt securities, which will receive the funds for distribution to the beneficial owners. Upon receipt of any payment of principal of or interest on any debt securities, DTC will credit the appropriate DTC participants’ accounts with payments in amounts proportionate to their respective beneficial interests in the principal amount of the debt securities as shown on the records of DTC. Payments by DTC participants to owners of beneficial interests in debt securities held through those DTC participants will be the responsibility of those DTC participants. A beneficial owner should contact the institution through which it intends to hold its beneficial interest in debt securities to determine how payments of principal of or interest on those debt securities will be credited to its accounts.
Peru, the fiscal agent and any paying agent will have no responsibility or liability for any aspect of the records relating to, or payments made on account of, beneficial ownership interests in the debt securities or for maintaining, supervising or reviewing any records relating to the beneficial ownership interests.
If Peru does not pay interest by wire transfer for any reason, it will, subject to applicable laws and regulations, mail, or direct the fiscal agent to mail, a check to the holder of the affected debt security on or before the due date for the payment at the address that appears on the security register maintained by the fiscal agent on the applicable record date.
The record date with respect to any interest payment date will be the 15th day prior to that interest payment date, whether or not that record date is also a business day.
Any payment of principal or interest required to be made on a payment date that is not a business day may be made on the next business day with the same force and effect as if made on that payment date, and no interest will accrue with respect to the payment for the period from and after that payment date.
The fiscal agent will hold in trust, for the benefit of the beneficial owners of the debt securities, any funds transferred by Peru to the fiscal agent pending the application of those funds to pay principal and interest on the debt securities. If any funds that Peru transfers to the fiscal agent to make payments on the debt securities is unclaimed at the end of two years after the applicable payment was due and payable, the fiscal agent will return those funds to Peru and the relevant holders of the debt securities may look only to Peru for any payment to which the holders are entitled.
Paying Agents; Transfer Agents; Registrar
With respect to any series of debt securities, Peru may appoint paying agents, transfer agents and registrars that will be listed at the back of the applicable prospectus supplement. Peru may at any time appoint additional or replacement paying agents, transfer agents and registrars. Peru will, however, maintain a paying agent and a registrar in The City of New York until the debt securities are paid.
115
In addition, so long as required by the rules of the Luxembourg Stock Exchange, Peru will maintain a paying agent and a transfer agent in Luxembourg with respect to any series of debt securities listed on the Luxembourg Stock Exchange. Peru will promptly provide notice of the termination, appointment or change in the office of any paying agent, transfer agent or registrar acting in connection with a series of the debt securities.
Redemption, Repurchase and Early Repayment
Unless otherwise provided in the prospectus supplement for an offering, the debt securities will not be redeemable before maturity at the option of Peru or repayable before maturity at the option of the holder. Nevertheless, Peru may at any time purchase any of the debt securities at any price in the open market or otherwise. Peru may hold or resell any debt securities it purchases or it may surrender them to the fiscal agent for cancellation. Any debt securities Peru purchases may not be re-issued or resold except in compliance with the Securities Act of 1933, as amended, and other applicable laws.
Replacement, Exchange and Transfer of Debt Securities
Beneficial interests in any global security representing debt securities may be exchanged for physical debt securities only in the circumstances described under “Book Entry; Delivery and Form” below. If Peru issues physical debt securities, holders may present their debt securities for exchange with debt securities of a different authorized denomination, together with a written request for an exchange, at the office of the fiscal agent in The City of New York, or at the office of any paying agent. In addition, holders may transfer their physical debt securities in whole or in part by surrendering them, together with an executed instrument of transfer, at any of those offices. Peru will not charge holders for the costs and expenses for the exchange, transfer or registration of transfer of the debt securities. Peru may, however, charge holders for applicable stamp duty, tax or other governmental charges.
If a physical debt security becomes mutilated, defaced, destroyed, lost or stolen, Peru may issue, and the fiscal agent will authenticate and deliver, a substitute debt security in replacement. In each case, the affected holder will be required to furnish to Peru, the fiscal agent and any other parties Peru specifies an indemnity under which the affected holder agrees to pay Peru, the fiscal agent and the other specified parties for any losses they may suffer relating to the debt security that was mutilated, defaced, destroyed, lost or stolen. Peru and the fiscal agent may also require that the affected holder present other documents and proof. The affected holder will be required to pay all expenses and reasonable charges for the replacement of the mutilated, defaced, destroyed, lost or stolen debt security.
Additional Amounts
Peru will pay all principal and interest on the debt securities without withholding or deduction for or on account of any present or future taxes, duties, assessments or governmental charges of whatever nature imposed by Peru or by any political subdivision of or taxing authority in Peru. If Peru is required by law to make any such withholding or deduction, it will pay such additional amounts as may be necessary to ensure that the net amounts receivable by the holders of the affected debt securities after such withholding or deduction shall equal the amount that would have been receivable in respect of such debt securities in the absence of such withholding or deduction.
Peru will not, however, pay any additional amounts if a holder is subject to withholding or deduction due to one of the following reasons:
| | • | | that holder has some connection with Peru other than merely holding the debt security or receiving principal or interest on any debt security; |
| | • | | that holder has not complied with any reasonable certification, identification or other reporting requirement concerning the nationality, residence, identity or connection with Peru, or any political subdivision of or taxing authority in Peru, of the holder of the debt security or any interest in or rights |
116
| | in respect of the debt security, if compliance is required by Peru, or any political subdivision of or taxing authority in Peru, under applicable law or any international treaty in effect, as a precondition to exemption from or reduction in the deduction or withholding; or |
| | • | | the holder has not presented its debt security for payment within 30 days after Peru first made a principal or interest payment available on that debt security. |
Defined Terms
The following definitions are used in the debt securities:
| | • | | “External Indebtedness” means obligations of, or guaranteed, whether by contract, statute or otherwise, by Peru for borrowed money or represented by bonds, debentures, notes or similar instruments denominated or payable, or which, at the option of the holder, may be payable in a currency other than the currency of Peru or by reference to a currency other than the currency of Peru, other than any such obligations originally issued or incurred within Peru. |
| | • | | “Public External Indebtedness” means any External Indebtedness that (a) is in the form of, or represented by, bonds, notes or other securities that are, or were intended at the time of issuance to be, quoted, listed or traded on any securities exchange or other securities market, including, without limitation, securities for resale under Rule 144A under the Securities Act, or any successor law or regulation of similar effect, and (b) has an original maturity of more than one year or is combined with a commitment so that the original maturity of one year or less may be extended at the option of Peru to a period in excess of one year. |
| | • | | “Project Financing” means any financing of all or part of the costs of the acquisition, construction or development of any project if the person or persons providing that financing expressly agree to limit their recourse to the project financed and the revenues derived from that project as the principal source of repayment for the funds advanced. |
| | • | | “Security Interest” means any security interest, including, without limitation, any lien, pledge, mortgage, deed of trust or charge, or any encumbrance or preferential arrangement that has the practical effect of constituting a security interest. |
Negative Pledge
While any of the debt securities are outstanding, Peru will not create or allow any Security Interest to be placed on or any part of its present or future revenues or assets to secure Public External Indebtedness, unless Peru creates or allows a Security Interest on the same terms for its obligations under the debt securities. Peru may, however, create or allow:
| | • | | Security Interests created prior to February 7, 2002; |
| | • | | Security Interests securing Public External Indebtedness incurred in connection with a Project Financing, provided that the Security Interest is solely in assets or revenues of the project for which the Project Financing was incurred; |
| | • | | Security Interests securing Public External Indebtedness Peru incurred or assumed to finance or refinance the acquisition of the assets in which those Security Interests have been created or allowed and any Security Interests existing on those assets at the time of their acquisition; |
| | • | | Security Interests securing Public External Indebtedness arising in the ordinary course to finance export, import or other trade transactions, and in which Public External Indebtedness matures, after giving effect to all renewals and refinancing thereof, not more than one year after the date on which that Public External Indebtedness was originally incurred; |
117
| | • | | Security Interests securing Public External Indebtedness that, together with all other Public External Indebtedness secured by Security Interests, excluding Public External Indebtedness secured by other permitted Security Interests, does not exceed U.S.$25,000,000 aggregate principal amount, or its equivalent in other currencies; |
| | • | | Security Interests arising by operation of a currently existing law in connection with Public External Indebtedness, including, without limitation, any right of set-off with respect to demand or time deposits maintained with financial institutions and bankers’ liens with respect to property held by financial institutions, in each case deposited with or delivered to those financial institutions in the ordinary course of the depositor’s activities; |
| | • | | Security Interests created in connection with the transactions contemplated by Peru’s financing plan dated June 5, 1996, and its implementing documentation, including Security Interests to secure obligations under the collateralized bonds issued under that financing plan (the Par Bonds, Discount Bonds and Front-Loaded Interest Reduction Bonds) and any Security Interest securing obligations of Peru outstanding as of June 5, 1996, to the extent required to be equally and ratably secured with any such bonds; |
| | • | | Security Interests issued upon surrender or cancellation of the Par Bonds, Discount Bonds or Front-Loaded Interest Reduction Bonds, or the principal amount of any Public External Indebtedness outstanding as of June 5, 1996, in each case, to the extent that Security Interest is created to secure Public External Indebtedness on a basis comparable to the Par Bonds, Discount Bonds and Front-Loaded Interest Reduction Bonds; |
| | • | | Security Interests on shares of, or other assets of, any present or former Peruvian public sector entity created or granted by Peru in connection with, or in anticipation of, the privatization of that entity; and |
| | • | | any renewal or extension of any of the Security Interests stated above. |
Collective Action Clauses
Any series of debt securities issued under this prospectus will contain provisions regarding acceleration and voting on amendments, modifications and waivers that differ from the provisions governing the series of debt securities issued by Peru in the past. The provisions described in this prospectus will govern any series of debt securities Peru will issue under this prospectus. These provisions are commonly referred to as “collective action clauses.” Under these provisions, Peru may amend certain key terms of the debt securities of a series, including the maturity date, amounts payable and other payment terms, with the consent of fewer than all the holders of debt securities of the relevant series. These collective action clauses are described below.
Default; Acceleration of Maturity
Unless otherwise specified in the prospectus supplement for an offering, each of the following events is an event of default under any series of debt securities:
(1) Non-Payment:
| | • | | Peru fails to pay for 30 days principal on that series of debt securities when due; or |
| | • | | Peru fails to pay for 30 days interest on that series of debt securities when due; or |
(2) Breach of Other Obligations: Peru fails to perform any other obligation under that series of debt securities and that failure is incapable of remedy or is unremedied within 60 days after the fiscal agent has given written notice to Peru; or
118
(3) Cross Default: Peru fails to make any payment when due in respect of:
| | • | | External Indebtedness outstanding as of February 21, 2002; and |
| | • | | Public External Indebtedness; |
in an aggregate principal amount in excess of U.S.$25,000,000, or its equivalent in any other currency, and that failure continues beyond the applicable grace period; or
(4) Cross Acceleration: an acceleration of the maturity of:
| | • | | External Indebtedness outstanding as of February 21, 2002; and |
| | • | | Public External Indebtedness; |
in an aggregate principal amount in excess of U.S.$25,000,000, or its equivalent in any other currency; or
(5) Moratorium: Peru declares a general suspension of payments or a moratorium on payment of all or a portion of its External Indebtedness; or
(6) Validity:
| | • | | Peru contests the validity of, or its obligations under, that series of debt securities or, to the extent adversely affecting that series of debt securities, the fiscal agency agreement; or |
| | • | | Peru denies any of its obligations under that series of debt securities or, to the extent adversely affecting that series of debt securities, the fiscal agency agreement; or |
| | • | | any constitutional provision, treaty, law, regulation, decree, or other official pronouncement of Peru, or any final decision by any court in Peru having jurisdiction, renders it unlawful for Peru to pay any amount due on that series of debt securities or to perform any of its obligations under that series of debt securities or, to the extent adversely affecting that series of debt securities, the fiscal agency agreement; or |
(7) Judgments: any writ, execution, attachment or similar process is levied against all or any substantial part of Peru’s assets in connection with any judgment for the payment of money exceeding U.S.$25,000,000, or its equivalent in any other currency, and Peru fails to satisfy or discharge that judgment, or adequately bond, contest in good faith or receive a stay or execution or continuance in respect of that judgment, within a period of 120 days; or
(8) Membership in the IMF: Peru fails to maintain its membership in, and its eligibility to use the general resources of, the IMF.
If any of the events of default described above occurs and is continuing, the holders of at least 25% of the aggregate principal amount of all debt securities of that series outstanding (as defined below) may, by written notice given to Peru, with a copy to the fiscal agent, declare all the debt securities of that series to be immediately due and payable. Upon any declaration of acceleration, the principal, interest and all other amounts payable on that series of debt securities will become immediately due and payable on the date that the written notice is received at the offices of the fiscal agent, unless Peru has remedied the event or events of default prior to receiving the notice.
The holders of more than 50% of the aggregate principal amount of the outstanding debt securities of any series may waive any existing defaults, and rescind or annul a declaration of acceleration on behalf of all holders of debt securities of that series if:
| | • | | following the declaration that the debt securities of that series are immediately due and payable, Peru deposits with the fiscal agent a sum sufficient to pay all overdue installments of principal, interest and other amounts in respect of the debt securities of that series, as well as the reasonable fees and compensation of the fiscal agent; and |
| | • | | all other events of default have been remedied. |
119
Fiscal Agent
The fiscal agency agreement establishes:
| | • | | the obligations of the fiscal agent; |
| | • | | the right to indemnification of the fiscal agent; |
| | • | | the liability and responsibility, including limitations on liability and responsibility, for actions that the fiscal agent takes; and |
| | • | | that the fiscal agent may enter into business transactions with Peru as freely as if it were not the fiscal agent. |
Peru may replace the fiscal agent at any time, subject to the appointment of a replacement fiscal agent. In addition, Peru may appoint different fiscal agents for different series of debt securities. The fiscal agent is not a trustee for the holders of debt securities and does not have the same responsibilities to act for the holders as would a trustee. Peru may maintain deposit accounts and conduct other banking and financial transactions with the fiscal agent.
Amendments and Waivers
Peru and the fiscal agent may, with the consent of the holders of at least 66 2/3% in aggregate principal amount of the then outstanding debt securities of any series, modify and amend the provisions of that series of debt securities or the fiscal agency agreement.
However, the holders of not less than 75% of the aggregate principal amount of the outstanding debt securities of any series, voting at a meeting or by written consent, must consent to any amendment, modification, change or waiver with respect to the debt securities of the relevant series that would:
| | • | | change the due dates for the payment of principal of or any installment of interest on that series of debt securities; |
| | • | | reduce any amounts payable on that series of debt securities; |
| | • | | reduce the amount of principal payable upon acceleration of the maturity of that series of debt securities; |
| | • | | change the payment currency or places of payment for that series of debt securities; |
| | • | | permit early redemption of that series of debt securities or, if early redemption is already permitted, set a redemption date earlier than the date previously specified or reduce the redemption price; |
| | • | | reduce the percentage of holders of that series of debt securities whose vote or consent is needed to amend, supplement or modify the fiscal agency agreement (as it relates to that series of debt securities) or the terms and conditions of that series of debt securities or to take any other action with respect to that series of debt securities or change the definition of “outstanding” with respect to that series of debt securities; |
120
| | • | | change Peru’s obligation to pay any additional amounts; |
| | • | | change the governing law provision of that series of debt securities; |
| | • | | change the courts to the jurisdiction of which Peru has submitted Peru’s obligation to appoint and maintain an agent for service of process with an office in New York, or Peru’s waiver of immunity, in respect of actions or proceedings brought by any holder based upon that series of debt securities, as described in this prospectus; |
| | • | | in connection with an exchange offer for the debt securities of that series, amend any event of default under the debt securities of that series; or |
| | • | | change the status of the debt securities of a series, as described under “—Status” above. |
We refer to the above subjects as “reserved matters.” A change to a reserved matter, including the payment terms of the debt securities of a series, can be made without your consent, as long as a supermajority of the holders of that series (that is, the holders of at least 75% of the aggregate principal amount of the outstanding debt securities of that series) agrees to the change.
No consent of the holders of debt securities is or will be required for any modification or amendment requested by Peru or by the fiscal agent or with the consent of Peru to:
| | • | | add to Peru’s covenants for the benefit of the holders of any series of debt securities; |
| | • | | surrender any right or power of Peru in respect of any series of debt securities or the fiscal agency agreement; |
| | • | | provide security or collateral for any series of debt securities; |
| | • | | cure any ambiguity in any provision, or correct any defective provision, of any series of debt securities; or |
| | • | | change the terms and conditions of any series of debt securities or the fiscal agency agreement in any manner that Peru and the fiscal agent deem to be necessary or desirable if that change does not, and will not, adversely affect the rights or interests of any holder. |
For purposes of determining whether the required percentage of holders of any series of debt securities has approved any amendment, modification or change to, or waiver of, the debt securities of that series or the fiscal agency agreement, or whether the required percentage of holders has delivered a notice of acceleration of the debt securities of that series, debt securities of that series owned, directly or indirectly, by Peru or any public sector instrumentality of Peru will be disregarded and deemed not to be outstanding, except that in determining whether the fiscal agent shall be protected in relying upon any amendment, modification, change or waiver, or any notice from holders, only debt securities of that series that the fiscal agent knows to be so owned shall be so disregarded. As used in this paragraph, “public sector instrumentality” means the Central Bank, any department, ministry or agency of the government of Peru or any corporation, trust, financial institution or other entity owned or controlled by the government of Peru or any of the foregoing, and “control” means the power, directly or indirectly, through the ownership of the voting securities or other ownership interests or otherwise, to direct the management of or elect or appoint a majority of the board of directors or other persons performing similar functions in lieu of, or in addition to, the board of directors or a corporation, trust, financial institution or other entity.
Peru may at any time ask for written consents from or call a meeting of the holders of any series of debt securities to obtain their approval of the modification of, amendment to, or waiver of, any provision of that series of debt securities. This meeting will be held at the time and place determined by Peru and specified in a notice of the meeting provided to the affected holders. This notice must be given at least 30 days and not more than 60 days prior to the meeting.
121
If at any time the holders of at least 10% in principal amount for any then outstanding debt securities of any series request the fiscal agent to call a meeting of the holders of that series of debt securities for any purpose, by written request setting forth in reasonable detail the action proposed to be taken at the meeting, the fiscal agent will call the meeting for that purpose. This meeting will be held at the time and place determined by the fiscal agent, after consultation with Peru, and specified in a notice of the meeting provided to the affected security holders. This notice must be given at least 30 days and not more than 60 days prior to the meeting.
Holders who hold a majority in principal amount of the then outstanding debt securities of that series will constitute a quorum at a securityholders’ meeting. In the absence of a quorum, a meeting may be adjourned for a period of at least 20 days. At the reconvening of a meeting adjourned for lack of quorum, holders of 25% in principal amount of the then outstanding debt securities of that series shall constitute a quorum. Notice of the reconvening of any meeting may be given only once, but must be given at least ten days and not more than 15 days prior to the meeting.
At any meeting when there is a quorum present, holders of at least 66 2/3% in principal amount of a series of debt securities represented and voting at the meeting may approve the modification or amendment of, or a waiver of compliance for, any provision of that series of debt securities, except for the reserved matters, which require the consent of not less than 75% of the aggregate principal amount of the outstanding debt securities of any series. Modifications, amendments or waivers made at any such meeting will be binding on all current and future holders of any debt securities of that series.
Notices
Notices will be mailed to holders at their registered addresses and will be deemed to have been given on the date of mailing. All notices to holders will be published, if and so long as the debt securities are listed on the Luxembourg Stock Exchange, and the rules of the Luxembourg Stock Exchange so require, in a daily newspaper of general circulation in Luxembourg. If publication is not practicable, notice will be validly given if made in accordance with the rules of the Luxembourg Stock Exchange.
Further Issues
Without the consent of the holders of the debt securities, Peru may issue additional debt securities with the same terms and conditions as an outstanding series of debt securities, except for the issue date, issue price and amount of first interest payment, and Peru may consolidate the additional debt securities to form a single series with an outstanding series of debt securities.
Warrants
If Peru issues warrants, it will describe their specific terms in a prospectus supplement, and Peru will file a warrant agreement or amendment to the fiscal agency agreement and form of warrant with the SEC. The following description summarizes some of the general terms that apply to warrants. You should read the applicable prospectus supplement, warrant agreement and form of warrant before making your investment decision.
Peru may issue warrants or other similar securities, either separately or together with any debt securities, that would entitle the holder to purchase debt securities or obligate Peru to repurchase or exchange debt securities. If Peru issues any warrants, each issue of warrants will be issued under a warrant agreement between Peru and a bank or trust company, which may be the fiscal agent, as warrant agent. The warrant agent will act solely as the agent of Peru in connection with the warrants of an issue and will not assume any obligation or relationship of agency for or with the holders or beneficial owners of warrants. The applicable prospectus supplement will include some or all of the following terms relating to an issue of warrants or other similar securities:
| | • | | the initial offering price; |
| | • | | the currency required to purchase the warrants; |
122
| | • | | the title and terms of the debt securities or other consideration that the holders will receive on exercise of their warrants; |
| | • | | the principal amount of debt securities or amount of other consideration that the holders will receive on exercise of their warrants; |
| | • | | the principal amount and kind of debt securities that the holders may obligate Peru to purchase or exchange if the holders exercise their warrants and the purchase price of those debt securities; |
| | • | | the exercise price or ratio; |
| | • | | the procedures of, and conditions to, exercise of the warrants and the dates on which the holders can exercise their warrants; |
| | • | | whether and under what conditions Peru may cancel the warrants; |
| | • | | the title and terms of any debt securities issued with the warrants, and the amount of debt securities issued with each warrant; |
| | • | | the date, if any, on and after which the warrants and any debt securities issued with the warrants will trade separately; |
| | • | | the form of the warrants (global or certificated and registered or bearer), whether they will be exchangeable for another form and, if registered, where they may be transferred and exchanged; |
| | • | | the identity of the warrant agent; |
| | • | | any special U.S. federal income tax considerations; and |
| | • | | any other terms of the warrants. |
The warrants will be direct, unconditional and unsecured obligations of Peru and will not constitute indebtedness of Peru.
Units
Peru may issue units comprised of one or more of the other securities described in this prospectus in any combination. Each unit will be issued so that the holder of the unit is also the holder of each security included in the unit. Thus, the holder of a unit will have the rights and obligations of a holder of each security comprising that unit. The unit agreement under which a unit is issued may provide that the securities included in the unit may not be held or transferred separately, at any time or at any time before a specified date.
The prospectus supplement relating to a particular issue of units will describe:
| | • | | the designation and terms of the units and of the securities comprising the units, including whether and under what circumstances those securities may be held or transferred separately; |
| | • | | any provisions for the issuance, payment, settlement, transfer or exchange of the units or of the securities comprising the units; and |
| | • | | whether the units will be issued in fully registered or global form. |
123
The preceding description does not, and any description of units in the applicable prospectus supplement will not, purport to be complete and they are subject to and are qualified in their entirety by reference to the unit agreement and, if applicable, collateral arrangements and depositary arrangements relating to those units.
Jurisdiction, Consent to Service and Enforceability
Peru is a foreign sovereign state. Consequently, it may be difficult for you to obtain or realize judgments of the courts of the United States or elsewhere against Peru. Furthermore, it may be difficult for you to enforce, in the United States or elsewhere, the judgments of United States or foreign courts against Peru.
In connection with any legal action against Peru or its properties, assets or revenues arising out of or relating to the fiscal agency agreement or any debt securities or warrants, to which we refer in this prospectus as a “related proceeding,” Peru will:
| | • | | submit to the exclusive jurisdiction of any New York State or U.S. federal court sitting in New York City, and any appellate court thereof; |
| | • | | agree that all claims in respect of any related proceeding may be heard and determined in such New York State or U.S. federal court; |
| | • | | agree that any judgment obtained in such New York State or U.S. federal court arising out of a related proceeding may be enforced or executed in any other court of competent jurisdiction; |
| | • | | agree that any judgment obtained in any such other court as a result of such enforcement or execution may be enforced or executed in any such other court of competent jurisdiction by means of a suit on the judgment or in any other manner provided by law; |
| | • | | consent to and waive, to the fullest extent permitted by law, any objection that it may have to the laying of venue of any related proceeding brought in such New York State or U.S. federal court or to the laying of venue of any legal action brought solely for the purpose of enforcing or executing a related judgment in such New York State or U.S. federal court or any other courts; |
| | • | | waive, to the fullest extent permitted by law, the defense of an inconvenient forum to the maintenance of a related proceeding or any such legal action in any such court; and |
| | • | | appoint CT Corporation System, presently located at 111 Eighth Avenue, 13th Floor, New York, New York, as its process agent and maintain at all times an agent with offices in New York to act as its process agent. |
In order to enforce or execute any judgment ordering any payment by Peru, Peruvian courts will require that payment to be included in the corresponding annual budget laws.
The process agent will receive on behalf of Peru and its property service of all writs, process and summonses in any related proceeding or any suit, action or proceeding to enforce or execute any related judgment brought against it in any New York State or U.S. federal courts sitting in New York City. Failure of the process agent to give any notice to Peru of any such service of process shall not impair or affect the validity of that service or of any judgment based thereon. Nothing in the fiscal agency agreement shall in any way be deemed to limit the ability to serve any such writs, process or summonses in any other manner permitted by applicable law.
To the extent that Peru or any of its revenues, assets or properties may be entitled to any sovereign or other immunity under any law, Peru will not claim and will waive that immunity to the fullest extent permitted by the laws of such jurisdiction. This waiver covers Peru’s sovereign immunity and immunity from prejudgment attachment, post-judgment attachment and attachment in aid, but does not extend to the attachment of revenues, assets and property of Peru located in Peru, unless permitted under Peruvian law. Additionally, under Peruvian law, Peru’s waiver of immunity will not extend to property that is:
| | • | | used by a diplomatic or consular mission of Peru; |
124
| | • | | of a military character and under the control of a military authority or defense agency of Peru; |
| | • | | shares of Peruvian public sector entities or shares of Peruvian private sector entities owned or controlled by Peru or by a Peruvian public sector entity, or revenues collected from the sale of those shares, to the extent those shares or revenues are exempt by Peruvian law from attachment or execution; or |
| | • | | funds deposited in Peru’s accounts held in the Peruvian financial system. |
Peru, however, reserves the right to plead sovereign immunity under the U.S. Foreign Sovereign Immunities Act of 1976 with respect to actions brought against it under U.S. federal securities laws or any state securities law. Without an effective waiver of immunity by Peru with respect to those actions, it would be impossible to obtain a U.S. judgment in such an action against Peru unless a court were to determine that Peru is not entitled under the Foreign Sovereign Immunities Act of 1976 to sovereign immunity with respect to that action. In addition, even if a U.S. judgment could be obtained in action under the Foreign Sovereign Immunities Act of 1976, it may not be possible to enforce in Peru a judgment based on that U.S. judgment.
Generally, Peru will also consent for the purposes of the State Immunity Act of 1978 of the United Kingdom to the giving of any relief or the issue of any process.
Governing Law
The fiscal agency agreement and, unless otherwise provided in the prospectus supplement for an offering, any warrant agreement, as well as any debt securities, warrants or units, will be governed by and must be interpreted in accordance with the laws of the State of New York, except that all matters governing authorization and execution by Peru will be governed by the laws of Peru.
Book-Entry; Delivery and Form
Unless otherwise provided in the prospectus supplement for an offering, the certificates representing the debt securities will be issued in the form of one or more global notes, to which we refer in this prospectus as “global notes.” Each global note will be deposited with or on behalf of DTC and registered in the name of DTC or its nominee. Except as described below, a global note may be transferred in whole and not in part and only to DTC or its other nominees.
Ownership of beneficial interests in the global notes will be limited to “participants” who have accounts with DTC or persons who hold interests through participants. Ownership of beneficial interests in the global notes will be shown on, and the transfer of that ownership will be effected only through, records maintained by DTC or its nominee with respect to interests of participants and the records of participants with respect to interests of persons other than participants.
Peru understands that DTC is:
| | • | | a limited purpose trust company organized under the laws of the State of New York; |
| | • | | a “banking organization” within the meaning of the New York Banking Law; |
| | • | | a member of the Federal Reserve System; |
| | • | | a “clearing corporation” within the meaning of the Uniform Commercial Code; and |
| | • | | a “clearing agency” registered under the provisions of Section 17A of the Exchange Act of 1934, as amended. |
125
DTC was created to hold securities for its participants and facilitate the clearance and settlement of securities transactions between participants through electronic book-entry changes in accounts of its participants, thereby eliminating the need for the physical movement of certificates. Indirect access to the DTC system is available to “indirect participants,” such as banks, brokers, dealers and trust companies and other organizations, that clear through or maintain, either directly or indirectly, a custodial relationship with a participant.
So long as DTC or its nominee is the registered owner or holder of the global notes, DTC or its nominee, as the case may be, will be considered the sole owner or holder of the debt securities represented by the global notes for all purposes under the fiscal agency agreement and the debt securities. No beneficial owner of an interest in any global note may transfer that interest except in accordance with DTC’s applicable procedures, in addition to those provided for under the fiscal agency agreement and, if applicable, those of Euroclear and Clearstream, Luxembourg.
Payments of the principal of, and interest on, the global notes will be made to DTC or its nominee, as the case may be, as the registered owner of the global notes. Peru, the fiscal agent and any paying agent will not have any responsibility or liability for any aspect of the records relating to or payments made on account of beneficial ownership interests in the global notes or for maintaining, supervising or reviewing any records relating to those beneficial ownership interests.
Peru expects that DTC or its nominee, upon receipt of any payment of principal or interest in respect of the global notes, will credit participants’ accounts with payments in amounts proportionate to their respective beneficial interests in the principal amount of the global notes as shown on the records of DTC or its nominee. Peru also expects that payments by participants to owners of beneficial interests in the global notes held through those participants will be governed by standing instructions and customary practices, as is now the case with securities held for the accounts of customers registered in the names of nominees for those customers. These payments will be the responsibility of those participants.
Peru expects that DTC will take any action permitted to be taken by a holder of any debt security, including the presentation of that debt security for exchange, only at the direction of one or more participants to whose account the DTC interests in the global note is credited and only in respect of that portion of the aggregate principal amount of that debt security for which that participant has or those participants have given such direction. If, however, there is an event of default under any series of debt securities, DTC will exchange the applicable global notes for registered certificated notes, which it will distribute to its participants.
Peru will issue debt securities in definitive form in exchange for global notes only if:
| | • | | Peru notifies the depositary that it will no longer be the depositary for the global notes, the depositary notifies Peru that it is unwilling, unable or no longer qualified to continue as depositary or is eligible to act as depositary, and, if the depositary is located in the United States, Peru does not appoint a successor depositary within 90 days; |
| | • | | the depositary is located outside the United States and such depositary closes for a continuous period of 14 days (other than by reason of holidays, statutory or otherwise) or announces an intention permanently to cease business or does in fact do so; or |
| | • | | Peru determines not to have any of the debt securities represented by a global note. |
Transfers between participants in DTC will be effected in the ordinary way in accordance with DTC’s rules and will be settled in same-day funds. Transfers between participants in Euroclear and Clearstream, Luxembourg will be effected in the ordinary way in accordance with their respective rules and operating procedures.
Subject to compliance, if any, with the transfer restrictions applicable to the debt securities, cross-market transfers between participants in DTC, on the one hand, and Euroclear or Clearstream, Luxembourg accountholders,
126
on the other hand, will be effected through DTC in accordance with DTC’s rules on behalf of Euroclear or Clearstream, Luxembourg, as the case may be, by its respective depositary. Any cross-market transactions will require delivery of instructions to Euroclear or Clearstream, Luxembourg, as the case may be, by the counterparty in that system in accordance with the rules and procedures and within the established deadlines (Brussels time) of that system. Euroclear or Clearstream Luxembourg, as the case may be, will, if the transaction meets its respective settlement requirements, deliver instructions to its respective depositary to effect final settlement on its behalf by delivering or receiving interests in the global notes to DTC, and making or receiving payments in accordance with normal procedures for same-day fund settlement applicable to DTC. Euroclear accountholders and Clearstream, Luxembourg participants may not deliver instructions directly to the depositaries for Euroclear or Clearstream, Luxembourg.
Because of time zone differences, the securities account of a Euroclear or Clearstream, Luxembourg accountholder purchasing an interest in any global note from a participant in DTC will be credited, and any such crediting will be reported to the relevant Euroclear or Clearstream, Luxembourg accountholder, during the securities settlement processing day, which must be a business day for Euroclear and Clearstream, Luxembourg immediately following the settlement date of DTC. Cash received in Euroclear or Clearstream, Luxembourg as a result of sales of interests in any global note by or through a Euroclear or Clearstream, Luxembourg accountholder to a participant in DTC will be received with value on the settlement date of DTC but will be available in the relevant Euroclear or Clearstream, Luxembourg cash account only as of the business day for Euroclear or Clearstream, Luxembourg following DTC’s settlement date.
Although DTC, Euroclear and Clearstream, Luxembourg are expected to follow the foregoing procedures in order to facilitate transfers of interests in the global notes among the participants of DTC, Euroclear and Clearstream, Luxembourg, they are under no obligation to perform or continue to perform those procedures, and those procedures may be discontinued at any time. Peru and the fiscal agent will not have any responsibility for the performance by DTC, Euroclear or Clearstream, Luxembourg, or their respective participants or indirect participants, of their respective obligations under the rules and procedures governing their operations.
127
TAXATION
Peru Taxation
The following is a general summary of the material consequences under Peruvian tax law, as currently in effect, of an investment by a “foreign holder” in debt securities issued by Peru. For this purpose, “foreign holder” means either: (i) an individual who is neither a resident nor domiciled in Peru or (ii) a legal entity that is not incorporated under the laws of Peru, unless the debt securities are assigned to a branch, agent, representative or permanent establishment of an entity in Peru. For purposes of Peruvian taxation, an individual holder is deemed a resident of Peru if he or she has remained in Peru for more than 183 days within any 12-month period.
Peruvian income tax law establishes that a foreign holder is subject to income tax only on income from Peruvian sources. For this purpose, income from a Peruvian source means: (i) earnings from capital, interest, commissions, bonuses and other additional sums to the agreed interest for loans, credits or other financial operations, when capital is located or economically used in Peru, or when the payer is domiciled in Peru; (ii) earnings obtained by the sale, redemption or recovery of bonds, when the issuing entity is organized or established in Peru; and (iii) interest from debentures, when the issuing entity is organized in Peru, regardless of the location of the issuance or the security for such debentures. A foreign holder of debt securities generally will not be liable for estate, gift, inheritance or similar taxes with respect to such debt securities.
Under Peruvian income tax law, as of January 1, 2010, interest and capital gains from debt securities issued by the Republic of Peru either (i) under Supreme Decree 007-2002-EF; or (ii) under the Market Makers Program or under any substitute mechanism that may replace it; or (iii) in the international market from 2002 onwards will not be subject to any withholding tax or income tax.
According to the paragraph above, under Peruvian income tax law, interest and capital gains from the bonds will not be subject to any withholding tax or income tax.
United States Federal Income Tax Considerations For United States Persons
The following is a summary of certain United States federal income tax consequences of the purchase, ownership and disposition of debt securities as of the date hereof. Except where noted, this summary deals only with debt securities that are held as capital assets by a U.S. holder.
A “U.S. holder” means a beneficial owner of a debt security that is for United States federal income tax purposes any of the following:
| | • | | individual citizen or resident of the United States; |
| | • | | a corporation (or any other entity treated as a corporation for United States federal income tax purposes) created or organized in or under the laws of the United States, any state thereof or the District of Columbia; |
| | • | | an estate the income of which is subject to United States federal income taxation regardless of its source; or |
| | • | | a trust if it (1) is subject to the primary supervision of a court within the United States and one or more United States persons have the authority to control all substantial decisions of the trust or (2) has a valid election in effect under applicable United States Treasury regulations to be treated as a United States person. |
This summary is based upon provisions of the Internal Revenue Code of 1986, as amended (the “Code”), and regulations, rulings and judicial decisions as of the date hereof. Those authorities may be changed, perhaps retroactively, so as to result in United States federal income tax consequences different from those summarized below. This summary does not address all aspects of United States federal income taxes and does not deal with
128
foreign, state, or local or other tax considerations that may be relevant to U.S. holders in light of their personal circumstances. In addition, it does not represent a detailed description of the United States federal income tax consequences applicable to you if you are subject to special treatment under the United States federal income tax laws. For example, this summary does not address:
| | • | | tax consequences to holders who may be subject to special tax treatment, such as dealers in securities or currencies, traders in securities that elect to use the mark-to-market method of accounting for their securities, financial institutions, regulated investment companies, real estate investment trusts, partnerships or other pass-through entities for United States federal income tax purposes, tax-exempt entities or insurance companies; |
| | • | | tax consequences to persons holding the debt securities as part of a hedging, integrated, constructive sale or conversion transaction or a straddle; |
| | • | | tax consequences to holders of the debt securities whose “functional currency” is not the United States dollar; |
| | • | | alternative minimum tax consequences, if any; or |
| | • | | any state, local or foreign tax consequences. |
If a partnership holds our debt securities, the tax treatment of a partner will generally depend upon the status of the partner and the activities of the partnership. If you are a partner of a partnership holding our debt securities, you should consult your tax advisors.
If you are considering the purchase of debt securities, you should consult your own tax advisors concerning the particular United States federal income tax consequences to you of the ownership of the debt securities, as well as the consequences to you arising under the laws of any other taxing jurisdiction.
The discussion below assumes that all debt securities issued will be classified for United States federal income tax purposes as our indebtedness and you should note that in the event of an alternative characterization, the tax consequences would differ from those discussed below. The specific terms of an offering of debt securities may raise United States federal income tax considerations in addition to those described below. For example, this discussion does not describe the tax treatment of convertible debt securities or debt securities denominated in or determined by reference to a currency other than the U.S. dollar. A description of any such considerations, or certain United States federal income tax considerations related to the offering of warrants or units, will be provided in the applicable prospectus supplement.
Payments of Interest
Except as set forth below, interest on a debt security will generally be taxable to you as ordinary income at the time it is paid or accrued in accordance with your method of accounting for tax purposes. In addition to interest on the debt securities (which includes any Peruvian tax withheld from the interest payments you receive), you will be required to include in income any additional amounts paid in respect of such Peruvian tax withheld. You may be entitled to deduct or credit this tax, subject to certain limitations (including that the election to deduct or credit foreign taxes applies to all of your foreign taxes for a particular tax year). Interest income (including any additional amounts) on a debt security generally will be considered foreign source income and, for purposes of the United States foreign tax credit, generally will be considered passive category income. You will generally be denied a foreign tax credit for foreign taxes imposed with respect to the debt securities where you do not meet a minimum holding period requirement during which you are not protected from risk of loss. The rules governing the foreign tax credit are complex. You are urged to consult your tax advisors regarding the availability of the foreign tax credit under your particular circumstances.
129
Original Issue Discount
If you own debt securities issued with original issue discount (“OID”), you will be subject to special tax accounting rules, as described in greater detail below. In that case, you should be aware that you generally must include OID in gross income in advance of the receipt of cash attributable to that income. However, you generally will not be required to include separately in income cash payments received on the debt securities, even if denominated as interest, to the extent those payments do not constitute “qualified stated interest,” as defined below. Notice will be given in the applicable prospectus supplement when we determine that a particular debt security will be issued with OID (an “original issue discount debt security”).
A debt security with an “issue price” that is less than the stated redemption price at maturity (the sum of all payments to be made on the debt security other than “qualified stated interest”) generally will be issued with OID if that difference is at least 0.25% of the stated redemption price at maturity multiplied by the number of complete years to maturity. The “issue price” of each debt security in a particular offering will be the first price at which a substantial amount of that particular offering is sold to the public. The term “qualified stated interest” means stated interest that is unconditionally payable in cash or in property, other than debt instruments of the issuer, and meets all of the following conditions:
| | • | | it is payable at least once per year; |
| | • | | it is payable over the entire term of the debt security; and |
| | • | | it is payable at a single fixed rate or, subject to certain conditions, a rate based on one or more interest indices. |
We will give you notice in the applicable prospectus supplement when we determine that a particular debt instrument will bear interest that is not qualified stated interest.
If you own a debt instrument issued with de minimis OID, which is discount that is not OID because it is less than 0.25% of the stated redemption price at maturity multiplied by the number of complete years to maturity, you generally must include the de minimis OID in income at the time principal payments on the debt securities are made in proportion to the amount paid. Any amount of de minimis OID that you have included in income will be treated as capital gain.
Certain of the debt securities may contain provisions permitting them to be redeemed prior to their stated maturity at our option and/or at your option. Original issue discount debt securities containing those features may be subject to rules that differ from the general rules discussed herein. If you are considering the purchase of original issue discount debt securities with those features, you should carefully examine the applicable prospectus supplement and should consult your own tax advisors with respect to those features since the tax consequences to you with respect to OID will depend, in part, on the particular terms and features of the debt securities.
If you own original issue discount debt securities with a maturity upon issuance of more than one year, you generally must include OID in income in advance of the receipt of some or all of the related cash payments using the “constant yield method” described in the following paragraphs.
The amount of OID that you must include in income if you are the initial U.S. holder of an original issue discount debt security is the sum of the “daily portions” of OID with respect to the debt security for each day during the taxable year or portion of the taxable year in which you held that debt security (“accrued OID”). The daily portion is determined by allocating to each day in any “accrual period” a pro rata portion of the OID allocable to that accrual period. The “accrual period” for an original issue discount debt security may be of any length and may vary in length over the term of the debt security, provided that each accrual period is no longer than one year and each scheduled payment of principal or interest occurs on the first day or the final day of an accrual period. The amount of OID allocable to any accrual period other than the final accrual period is an amount equal to the excess, if any, of:
| | • | | the debt security’s “adjusted issue price” at the beginning of the accrual period multiplied by its yield to maturity, determined on the basis of compounding at the close of each accrual period and properly adjusted for the length of the accrual period, over |
| | • | | the aggregate of all qualified stated interest allocable to the accrual period. |
130
OID allocable to a final accrual period is the difference between the amount payable at maturity, other than a payment of qualified stated interest, and the adjusted issue price at the beginning of the final accrual period. Special rules will apply for calculating OID for an initial short accrual period. The “adjusted issue price” of a debt security at the beginning of any accrual period is equal to its issue price increased by the accrued OID for each prior accrual period, determined without regard to the amortization of any acquisition or bond premium, as described below, and reduced by any payments previously made on the debt security (other than qualified stated interest). Under these rules, you will have to include in income increasingly greater amounts of OID in successive accrual periods. We are required to provide information returns stating the amount of OID accrued on debt securities held of record by persons other than exempt holders.
Floating rate debt securities are subject to special OID rules. In the case of an original issue discount debt security that is a floating rate debt security, both the “yield to maturity” and “qualified stated interest” will be determined solely for purposes of calculating the accrual of OID as though the debt security will bear interest in all periods at a fixed rate generally equal to the rate that would be applicable to interest payments on the debt security on its date of issue or, in the case of certain floating rate debt securities, the rate that reflects the yield to maturity that is reasonably expected for the debt security. Additional rules may apply if either:
| | • | | the interest on a floating rate debt security is based on more than one interest index; or |
| | • | | the principal amount of the debt security is indexed in any manner. |
The discussion above generally does not address debt securities providing for contingent payments. You should carefully examine the applicable prospectus supplement regarding the United States federal income tax consequences of the holding and disposition of any debt securities providing for contingent payments.
You may elect to treat all interest on any debt security as OID and calculate the amount includible in gross income under the constant yield method described above. For purposes of this election, interest includes stated interest, acquisition discount, OID, de minimis OID, market discount, de minimis market discount and unstated interest, as adjusted by any amortizable bond premium or acquisition premium. You should consult with your own tax advisors about this election.
Short-Term Debt Securities
In the case of debt securities having a term of one year or less, all payments, including all stated interest, will be included in the stated redemption price at maturity and will not be qualified stated interest. As a result, you will generally be taxed on the discount instead of stated interest. The discount will be equal to the excess of the stated redemption price at maturity over the issue price of a short-term debt security, unless you elect to compute this discount using tax basis instead of issue price. In general, individuals and certain other cash method U.S. holders of short-term debt securities are not required to include accrued discount in their income currently unless they elect to do so, but may be required to include stated interest in income as the income is received. U.S. holders that report income for United States federal income tax purposes on the accrual method and certain other U.S. holders are required to accrue discount on short-term debt securities (as ordinary income) on a straight-line basis, unless an election is made to accrue the discount according to a constant yield method based on daily compounding. If you are not required, and do not elect, to include discount in income currently, any gain you realize on the sale, exchange or retirement of a short-term debt security will generally be ordinary income to you to the extent of the discount accrued by you through the date of sale, exchange or retirement. In addition, if you do not elect to currently include accrued discount in income you may be required to defer deductions for a portion of your interest expense with respect to any indebtedness attributable to the short-term debt securities.
131
Market Discount
If you purchase a debt security for an amount that is less than its stated redemption price at maturity (or, in the case of an original issue discount debt security, its adjusted issue price), the amount of the difference will be treated as “market discount” for United States federal income tax purposes, unless that difference is less than a specified de minimis amount. Under the market discount rules, you will be required to treat any principal payment on, or any gain on the sale, exchange, retirement or other disposition of, a debt security as ordinary income to the extent of the market discount that you have not previously included in income and are treated as having accrued on the debt security at the time of the payment or disposition.
In addition, you may be required to defer, until the maturity of the debt security or its earlier disposition in a taxable transaction, the deduction of all or a portion of the interest expense on any indebtedness attributable to the debt security. You may elect, on a security-by-security basis, to deduct the deferred interest expense in a tax year prior to the year of disposition. You should consult your own tax advisors before making this election.
Any market discount will be considered to accrue ratably during the period from the date of acquisition to the maturity date of the debt security, unless you elect to accrue on a constant interest method. You may elect to include market discount in income currently as it accrues, on either a ratable or constant interest method, in which case the rule described above regarding deferral of interest deductions will not apply.
Acquisition Premium, Amortizable Bond Premium
If you purchase an original issue discount debt security for an amount that is greater than its adjusted issue price but equal to or less than the sum of all amounts payable on the debt security after the purchase date other than payments of qualified stated interest, you will be considered to have purchased that debt security at an “acquisition premium.” Under the acquisition premium rules, the amount of OID that you must include in gross income with respect to the debt security for any taxable year will be reduced by the portion of the acquisition premium properly allocable to that year.
If you purchase a debt security (including an original issue discount debt security) for an amount in excess of the sum of all amounts payable on the debt security after the purchase date other than qualified stated interest, you will be considered to have purchased the debt security at a “premium” and, if it is an original issue discount debt security, you will not be required to include any OID in income. You generally may elect to amortize the premium over the remaining term of the debt security on a constant yield method as an offset to interest when includible in income under your regular accounting method. If you do not elect to amortize bond premium, that premium will decrease the gain or increase the loss you would otherwise recognize on disposition of the debt security.
Sale, Exchange and Retirement of Debt Securities
Your tax basis in a debt security will, in general, be your cost for that debt security, increased by OID, market discount or any discount with respect to a short-term debt security that you previously included in income, and reduced by any amortized premium and any cash payments on the debt security other than qualified stated interest. Upon the sale, exchange, retirement or other disposition of a debt security, you will recognize gain or loss equal to the difference between the amount you realize upon the sale, exchange, retirement or other disposition (less an amount equal to any accrued but unpaid qualified stated interest, which will be taxable as interest income to the extent not previously included in income) and the adjusted tax basis of the debt security. Except as described above with respect to certain short-term debt securities or with respect to market discount, and with respect to contingent payment debt instruments, which this summary generally does not discuss, such gain or loss will be capital gain or loss. Gain or loss realized by you on the sale, exchange, retirement or other disposition of a debt security will generally be treated as United States source gain or loss. Capital gains of individuals derived in respect of capital assets held for more than one year are eligible for reduced rates of taxation. The deductibility of capital losses is subject to limitations.
132
Backup Withholding and Information Reporting
In general, information reporting requirements will apply to certain payments of principal, interest (including OID) and premium paid on debt securities and to the proceeds of sale of a debt security paid to you (unless you are an exempt recipient). Additionally, if you fail to provide your taxpayer identification number, or in the case of interest payments, fail either to report in full dividend and interest income or to make certain certifications, you may be subject to backup withholding.
Any amounts withheld under the backup withholding rules will be allowed as a refund or a credit against your United States federal income tax liability provided the required information is furnished to the Internal Revenue Service.
133
PLAN OF DISTRIBUTION
Overview
Peru may sell the securities in any of three ways:
| | • | | through underwriters or dealers; |
| | • | | directly to one or more purchasers; or |
Each prospectus supplement for an offering will describe the following:
| | • | | the names of any underwriters or agents; |
| | • | | the purchase price of the securities; |
| | • | | the net proceeds to Peru from the sale of the securities; |
| | • | | any underwriting discounts and other items constituting underwriters’ compensation; |
| | • | | any agents’ commissions and other items constituting agents’ compensation; |
| | • | | any initial public offering price of the securities; |
| | • | | any discounts or concessions allowed or reallowed or paid to dealers; and |
| | • | | any securities exchanges on which those securities may be listed. |
If Peru uses underwriters or dealers in a sale, they will acquire the securities for their own accounts and may resell them in one or more transactions, including negotiated transactions, at a fixed public offering price or at varying prices determined at the time of sale. Peru may offer the securities to the public either through underwriting syndicates represented by managing underwriters or directly through underwriters. The obligations of the underwriters to purchase a particular offering of securities may be subject to conditions. The underwriters may change the initial public offering price or any concessions allowed or reallowed or paid to dealers.
In compliance with guidelines of the National Association of Securities Dealers, Inc., the maximum commission or discount to be received by any NASD member or independent broker dealer may not exceed 8% of the aggregate amount of the securities offered by this prospectus and any applicable prospectus supplement; however, it is anticipated that the maximum commission or discount to be received in any particular offering of securities will be significantly less than this amount.
Peru may also sell the securities directly to the public or through agents. Unless otherwise specified in the applicable prospectus supplement, any agent will act on a reasonable best efforts basis for the period of its appointment.
Peru may authorize agents, underwriters or dealers to solicit offers by some institutions to purchase a particular offering of securities at the public offering price using delayed delivery contracts. These contracts provide for payment and delivery on a specified date in the future. The applicable prospectus supplement will describe the commission payable for solicitation and the terms and conditions of these contracts.
Peru may offer the securities to holders of other securities issued or guaranteed by Peru in payment for Peru’s purchase or exchange of the other securities, including as part of a reprofiling of Peru’s public debt. Peru may
134
conduct such an offer either (a) through a publicly announced tender or exchange offer for the other securities or (b) through privately negotiated transactions. This kind of offer may be in addition to sales of the same securities using the methods described above.
Peru may agree to indemnify any agents and underwriters against some liabilities, including liabilities under the Securities Act. The agents and underwriters may also be entitled to contribution from Peru for payments they may make relating to these liabilities. Agents and underwriters may engage in transactions with or perform services for Peru in the ordinary course of business.
Non-U.S. Offerings
Peru will generally not register under the Securities Act the securities that it will offer and sell outside the United States. Thus, subject to some exceptions, Peru cannot offer, sell or deliver these securities within the United States or to U.S. persons. When Peru offers or sells securities outside the United States, each underwriter, dealer or agent will acknowledge that the securities:
| | • | | have not been and will not be registered under the Securities Act; and |
| | • | | may not be offered or sold within the United States except under an exemption from, or in a transaction not subject to, the registration requirements of the Securities Act. |
Each underwriter, dealer or agent will agree that:
| | • | | it has not offered or sold or solicited offers to purchase, and will not offer or sell or solicit offers to purchase, any of these unregistered securities within the United States, except under Rule 903 of Regulation S under the Securities Act; and |
| | • | | neither it nor its affiliates nor any persons acting on it or their behalf have engaged or will engage in any directed selling efforts regarding these securities. |
135
OFFICIAL STATEMENTS
Information in this prospectus whose source is identified as a publication of Peru or one of its agencies or instrumentalities relies on the authority of that publication as a public official document of Peru. All other information in this prospectus, other than that included in “Plan of Distribution” above, is included as a public official statement made on the authority of Peru.
VALIDITY OF THE SECURITIES
The following persons, whose addresses will appear on the inside back cover of the applicable prospectus supplement, will provide opinions regarding the validity of the securities:
| | • | | Simpson Thacher & Bartlett LLP, special New York counsel to Peru, and |
| | • | | General Counsel of the Ministry of Economy and Finance or such other Peruvian counsel to Peru named in the applicable prospectus supplement. |
As to all matters of Peruvian law, Simpson Thacher & Bartlett LLP may rely on the opinion of Peruvian counsel to Peru named in the applicable prospectus supplement. As to all matters of United States law, Peruvian counsel to Peru named in the applicable prospectus supplement may rely on the opinion of Simpson Thacher & Bartlett LLP.
| | • | | For the underwriters, if any: |
| | • | | United States counsel to the underwriters named in the applicable prospectus supplement, and |
| | • | | Peruvian counsel to the underwriters named the applicable prospectus supplement. |
As to all matters of Peruvian law, United States counsel to the underwriters may rely on the opinion of Peruvian counsel to the underwriters named in the applicable prospectus supplement. As to all matters of United States law, Peruvian counsel to the underwriters named in the applicable prospectus supplement may rely on the opinion of the United States counsel to the underwriters.
AUTHORIZED REPRESENTATIVE
The authorized representative of Peru in the United States is Fortunato Quesada Seminario of the Consulate General of Peru, whose address is 241 East 49th Street, New York, New York 10017.
WHERE YOU CAN FIND MORE INFORMATION
Peru has filed with the SEC under the Securities Act a registration statement, of which this prospectus forms a part, covering the securities. This prospectus does not contain all of the information included in the registration statement. Any statement made in this prospectus concerning the contents of any contract, agreement or other document is not necessarily complete. If Peru has filed any contract, agreement or other document as an exhibit to the registration statement, you should read the exhibit for a more complete understanding of the document or matter involved. Each statement regarding a contract, agreement or other document is qualified in its entirety by reference to the actual document.
You may read and copy the registration statement, including its various exhibits, and any reports, statements or other information that Peru has filed, at the SEC’s public reference room located at 100 F Street, N.E., Washington, D.C. 20549-1004. You can obtain copies of these documents, upon payment of a duplicating fee, by writing the SEC. Please call the SEC at 1-800-SEC-0330 for further information. Peru’s SEC filings are also available to the public from the SEC’s website at http://www.sec.gov.
136
ANNEX A
REPUBLIC OF PERU: GLOBAL PUBLIC SECTOR EXTERNAL DEBT
TABLES AND OTHER SUPPLEMENTAL INFORMATION
as of December 31, 2011 (1)
(in thousands of U.S. dollars, at current prices)
| | | | | | | | | | | | | | | | | | | | |
Type of Lender | | Country | | Lender | | Currency | | Type of Interest Rate | | Spread (%) | | | Interest Rate (%) | | Outstanding
Amount as of
December 31, 2011
(in thousands of US) | | | Period to
Maturity |
Paris Club | | Germany | | KFW | | EURO | | Fixed | | | 0.00 | | | 2.00 | | | 10,538 | | | 4 Y |
Paris Club | | Germany | | KFW | | EURO | | Fixed | | | 0.00 | | | 3.00 | | | 4,967 | | | 4 Y |
Paris Club | | Germany | | KFW | | EURO | | Fixed | | | 0.00 | | | 2.00 | | | 1,325 | | | 2 Y |
Paris Club | | Germany | | KFW | | EURO | | Fixed | | | 0.00 | | | 2.00 | | | 1,325 | | | 4 Y |
Paris Club | | Germany | | KFW | | EURO | | Fixed | | | 0.00 | | | 2.00 | | | 2,054 | | | 4 Y |
Paris Club | | Germany | | KFW | | EURO | | Fixed | | | 0.00 | | | 3.00 | | | 596 | | | 4 Y |
Paris Club | | Germany | | KFW | | EURO | | Fixed | | | 0.00 | | | 2.00 | | | 398 | | | 4 Y |
Paris Club | | Germany | | KFW | | EURO | | Fixed | | | 0.00 | | | 2.00 | | | 2,485 | | | 5 Y |
Paris Club | | Germany | | KFW | | EURO | | Fixed | | | 0.00 | | | 3.00 | | | 2,104 | | | 1 Y |
Paris Club | | Germany | | KFW | | EURO | | Fixed | | | 0.00 | | | 2.00 | | | 1,202 | | | 8 Y |
Paris Club | | Germany | | KFW | | EURO | | Fixed | | | 0.00 | | | 0.75 | | | 4,866 | | | 22 Y |
Paris Club | | Germany | | KFW | | EURO | | Fixed | | | 0.00 | | | 2.00 | | | 9,573 | | | 12 Y |
Paris Club | | Germany | | KFW | | EURO | | Fixed | | | 0.00 | | | 3.00 | | | 6,334 | | | 12 Y |
Paris Club | | Germany | | KFW | | EURO | | Fixed | | | 0.00 | | | 3.00 | | | 8,414 | | | 3 Y |
Paris Club | | Germany | | KFW | | EURO | | Fixed | | | 0.00 | | | 0.75 | | | 4,976 | | | 23 Y |
Paris Club | | Germany | | KFW | | EURO | | Fixed | | | 0.00 | | | 3.00 | | | 3,939 | | | 13 Y |
Paris Club | | Germany | | KFW | | EURO | | Fixed | | | 0.00 | | | 3.00 | | | 14,713 | | | 13 Y |
Paris Club | | Germany | | KFW | | EURO | | Fixed | | | 0.00 | | | 0.75 | | | 2,653 | | | 24 Y |
Paris Club | | Germany | | KFW | | EURO | | Fixed | | | 0.00 | | | 0.75 | | | 21,729 | | | 25 Y |
Paris Club | | Germany | | KFW | | EURO | | Fixed | | | 0.00 | | | 2.00 | | | 20,851 | | | 15 Y |
Paris Club | | Germany | | KFW | | EURO | | Fixed | | | 0.00 | | | 0.75 | | | 5,725 | | | 26 Y |
Paris Club | | Germany | | KFW | | EURO | | Fixed | | | 0.00 | | | 2.00 | | | 1,702 | | | 18 Y |
Paris Club | | Germany | | KFW | | EURO | | Fixed | | | 0.00 | | | 3.10 | | | 2,532 | | | 6 Y |
A-1
| | | | | | | | | | | | | | | | | | | | |
Type of Lender | | Country | | Lender | | Currency | | Type of Interest Rate | | Spread (%) | | | Interest Rate (%) | | Outstanding
Amount as of
December 31, 2011
(in thousands of US) | | | Period to
Maturity |
Paris Club | | Germany | | KFW | | EURO | | Fixed | | | 0.00 | | | 0.75 | | | 5,759 | | | 27 Y |
Paris Club | | Germany | | KFW | | EURO | | Fixed | | | 0.00 | | | 2.00 | | | 2,668 | | | 17 Y |
Paris Club | | Germany | | KFW | | EURO | | Fixed | | | 0.00 | | | 0.75 | | | 8,517 | | | 27 Y |
Paris Club | | Germany | | KFW | | EURO | | Fixed | | | 0.00 | | | 2.00 | | | 7,630 | | | 17 Y |
Paris Club | | Germany | | KFW | | EURO | | Fixed | | | 0.00 | | | 2.00 | | | 8,177 | | | 17 Y |
Paris Club | | Germany | | KFW | | EURO | | Fixed | | | 0.00 | | | 2.00 | | | 11,264 | | | 17 Y |
Paris Club | | Germany | | KFW | | EURO | | Fixed | | | 0.00 | | | 2.00 | | | 3,781 | | | 18 Y |
Paris Club | | Germany | | KFW | | EURO | | Fixed | | | 0.00 | | | 2.00 | | | 8,860 | | | 18 Y |
Paris Club | | Germany | | KFW | | EURO | | Fixed | | | 0.00 | | | 0.75 | | | 10,980 | | | 28 Y |
Paris Club | | Germany | | KFW | | EURO | | Fixed | | | 0.00 | | | 2.00 | | | 5,963 | | | 18 Y |
Paris Club | | Germany | | KFW | | EURO | | Fixed | | | 0.00 | | | 2.00 | | | 4,937 | | | 19 Y |
Paris Club | | Germany | | KFW | | EURO | | Fixed | | | 0.00 | | | 2.00 | | | 1,391 | | | 21 Y |
Paris Club | | Germany | | KFW | | EURO | | Fixed | | | 0.00 | | | 2.00 | | | 5,876 | | | 21 Y |
Paris Club | | Germany | | KFW | | EURO | | Fixed | | | 0.00 | | | 2.00 | | | 6,626 | | | 23 Y |
Paris Club | | Germany | | KFW | | EURO | | Fixed | | | 0.00 | | | 3.00 | | | 1,802 | | | 23 Y |
Paris Club | | Germany | | KFW | | EURO | | Fixed | | | 0.00 | | | 2.00 | | | 2,343 | | | 23 Y |
Paris Club | | Germany | | KFW | | U.S.$ | | Fixed | | | 0.00 | | | 5.20 | | | 13,065 | | | 6 Y |
Paris Club | | Germany | | KFW | | EURO | | Fixed | | | 0.00 | | | 2.00 | | | 3,770 | | | 25 Y |
Paris Club | | Germany | | KFW | | U.S.$ | | Fixed | | | 0.00 | | | 5.25 | | | 15,313 | | | 7 Y |
Paris Club | | Germany | | KFW | | EURO | | Fixed | | | 0.00 | | | 3.00 | | | 848 | | | 25 Y |
Paris Club | | Germany | | KFW | | EURO | | Fixed | | | 0.00 | | | 2.00 | | | 331 | | | 25 Y |
Paris Club | | Germany | | KFW | | EURO | | Fixed | | | 0.00 | | | 2.00 | | | 2,574 | | | 26 Y |
Paris Club | | Germany | | KFW | | EURO | | Fixed | | | 0.00 | | | 3.64 | | | 50,540 | | | 11 Y |
Paris Club | | Germany | | KFW | | EURO | | Fixed | | | 0.00 | | | 3.38 | | | 19,439 | | | 12 Y |
Paris Club | | Germany | | KFW | | EURO | | Fixed | | | 0.00 | | | 3.77 | | | 19,439 | | | 10 Y |
Paris Club | | Germany | | KFW | | U.S.$ | | Fixed | | | 0.00 | | | 5.46 | | | 50,000 | | | 14 Y |
Paris Club | | Germany | | KFW | | EURO | | Fixed | | | 0.00 | | | 3.29 | | | 58,316 | | | 17 Y |
Paris Club | | Germany | | KFW | | EURO | | Fixed | | | 0.00 | | | 3.00 | | | 25,918 | | | 18 Y |
Paris Club | | Germany | | KFW | | EURO | | Fixed | | | 0.00 | | | 3.00 | | | 45,357 | | | 19 Y |
A-2
| | | | | | | | | | | | | | | | | | | | |
Type of Lender | | Country | | Lender | | Currency | | Type of Interest Rate | | Spread (%) | | | Interest Rate (%) | | Outstanding
Amount as of
December 31, 2011
(in thousands of US) | | | Period to
Maturity |
Paris Club | | Germany | | KFW | | EURO | | Fixed | | | 0.00 | | | 3.00 | | | 27,214 | | | 19 Y |
Paris Club | | Belgium | | Government of the Kingdom of Belgium | | EURO | | Fixed | | | 2.00 | | | 0.00 | | | 106 | | | 1 Y |
Paris Club | | Belgium | | Government of the Kingdom of Belgium | | EURO | | Fixed | | | 2.00 | | | 0.00 | | | 55 | | | 1 Y |
Paris Club | | Belgium | | Government of the Kingdom of Belgium | | EURO | | 0.00% | | | 0.00 | | | 0.00 | | | 980 | | | 3 Y |
Paris Club | | Belgium | | Government of the Kingdom of Belgium | | EURO | | 0.00% | | | 0.00 | | | 0.00 | | | 1,887 | | | 6 Y |
Paris Club | | Belgium | | Government of the Kingdom of Belgium | | EURO | | 0.00% | | | 0.00 | | | 0.00 | | | 1,520 | | | 7 Y |
Paris Club | | Spain | | Instituto de Crédito Oficial de España (ICO) | | U.S.$ | | Fixed | | | 0.00 | | | 2.65 | | | 7,585 | | | 2 Y |
Paris Club | | United States | | Agency for International Development | | U.S.$ | | Fixed | | | 0.00 | | | 3.00 | | | 366 | | | 2 Y |
Paris Club | | United States | | Agency for International Development | | U.S.$ | | Fixed | | | 0.00 | | | 3.00 | | | 373 | | | 2 Y |
Paris Club | | United States | | Paine Webber | | U.S.$ | | 26-week U.S. Treasury bond rate | | | 0.35 | | | Variable | | | 1,926 | | | 3 Y |
Paris Club | | United States | | PL 480 | | U.S.$ | | Fixed | | | 0.00 | | | 4.00 | | | 929 | | | 1 Y |
Paris Club | | United States | | PL 480 | | U.S.$ | | Fixed | | | 0.00 | | | 3.26 | | | 5,900 | | | 6 Y |
Paris Club | | United States | | PL 480 | | U.S.$ | | Fixed | | | 0.00 | | | 3.26 | | | 3,103 | | | 7 Y |
Paris Club | | United States | | PL 480 | | U.S.$ | | Fixed | | | 0.00 | | | 4.00 | | | 6,497 | | | 17 Y |
Paris Club | | United States | | PL 480 | | U.S.$ | | Fixed | | | 0.00 | | | 2.50 | | | 3,045 | | | 19 Y |
Paris Club | | United States | | PL 480 | | U.S.$ | | Fixed | | | 0.00 | | | 1.00 | | | 7,459 | | | 20 Y |
Paris Club | | United States | | PL 480 | | U.S.$ | | Fixed | | | 0.00 | | | 1.00 | | | 7,786 | | | 21 Y |
Paris Club | | United States | | PL 480 | | U.S.$ | | Fixed | | | 0.00 | | | 1.00 | | | 5,277 | | | 23 Y |
Paris Club | | United States | | PL 480 | | U.S.$ | | Fixed | | | 0.00 | | | 1.00 | | | 8,586 | | | 25 Y |
Paris Club | | United States | | PL 480 | | U.S.$ | | Fixed | | | 0.00 | | | 4.00 | | | 92 | | | 2 Y |
Paris Club | | United States | | PL 480 | | U.S.$ | | Fixed | | | 0.00 | | | 4.00 | | | 1,419 | | | 3 Y |
Paris Club | | United States | | PL 480 | | U.S.$ | | Fixed | | | 0.00 | | | 4.00 | | | 3,760 | | | 4 Y |
Paris Club | | United States | | PL 480 | | U.S.$ | | Fixed | | | 0.00 | | | 3.26 | | | 5,715 | | | 3 Y |
Paris Club | | United States | | PL 480 | | U.S.$ | | Fixed | | | 0.00 | | | 4.00 | | | 1,804 | | | 2 Y |
Paris Club | | France | | Banco Bilbao Vizcaya Argentaria S.A. | | EURO | | Commercial Interest Reference Rate | | | 0.00 | | | Variable | | | 3,701 | | | 8 Y |
Paris Club | | France | | Banque de France | | EURO | | Fixed | | | 0.00 | | | 3.50 | | | 4,247 | | | 3 Y |
Paris Club | | France | | Banque de France | | EURO | | Fixed | | | 0.00 | | | 3.50 | | | 1,230 | | | 3 Y |
Paris Club | | France | | Banque de France | | EURO | | Fixed | | | 0.00 | | | 3.50 | | | 5,134 | | | 6 Y |
A-3
| | | | | | | | | | | | | | | | | | | | |
Type of Lender | | Country | | Lender | | Currency | | Type of Interest Rate | | Spread (%) | | | Interest Rate (%) | | Outstanding
Amount as of
December 31, 2011
(in thousands of US) | | | Period to
Maturity |
Paris Club | | France | | Banque de France | | EURO | | Fixed | | | 0.00 | �� | | 3.50 | | | 2,990 | | | 6 Y |
Paris Club | | France | | Banque de France | | EURO | | Fixed | | | 0.00 | | | 3.50 | | | 15,260 | | | 7 Y |
Paris Club | | France | | Treasury of France | | EURO | | Fixed | | | 0.00 | | | 3.50 | | | 1 | | | 1 Y |
Paris Club | | France | | Treasury of France | | EURO | | Fixed | | | 0.00 | | | 3.50 | | | 1 | | | 1 Y |
Paris Club | | France | | Treasury of France | | EURO | | Fixed | | | 0.00 | | | 4.00 | | | 2,136 | | | 5 Y |
Paris Club | | France | | Treasury of France | | EURO | | Fixed | | | 0.00 | | | 3.00 | | | 193 | | | 13 Y |
Paris Club | | France | | Treasury of France | | EURO | | Fixed | | | 0.00 | | | 3.00 | | | 7,030 | | | 13 Y |
Paris Club | | France | | Treasury of France | | EURO | | Fixed | | | 0.00 | | | 3.40 | | | 2,465 | | | 9 Y |
Paris Club | | France | | Treasury of France | | EURO | | Fixed | | | 0.00 | | | 3.40 | | | 2,267 | | | 8 Y |
Paris Club | | France | | Treasury of France | | EURO | | Fixed | | | 0.00 | | | 0.80 | | | 6,650 | | | 23 Y |
Paris Club | | Italy | | Artigiancassa Spa | | EURO | | Fixed | | | 0.00 | | | 1.50 | | | 954 | | | 1 Y |
Paris Club | | Italy | | Artigiancassa Spa | | EURO | | Fixed | | | 0.00 | | | 1.50 | | | 1,841 | | | 1 Y |
Paris Club | | Japan | | Government of Japan | | ¥ | | Fixed | | | 0.00 | | | 0.17 | | | 13,729 | | | 6 Y |
Paris Club | | Japan | | Japan Bank for International Cooperation | | ¥ | | Fixed | | | 0.00 | | | 5.60 | | | 10,767 | | | 3 Y |
Paris Club | | Japan | | Japan Bank for International Cooperation | | ¥ | | Fixed | | | 0.00 | | | 3.50 | | | 4,403 | | | 3 Y |
Paris Club | | Japan | | Japan Bank for International Cooperation | | ¥ | | Fixed | | | 0.00 | | | 5.60 | | | 23,029 | | | 6 Y |
Paris Club | | Japan | | Japan Bank for International Cooperation | | ¥ | | Fixed | | | 0.00 | | | 5.60 | | | 86,804 | | | 7 Y |
Paris Club | | Japan | | Japan Bank for International Cooperation | | ¥ | | Fixed | | | 0.00 | | | 2.20 | | | 35,632 | | | 8 Y |
Paris Club | | Japan | | Japan Bank for International Cooperation | | ¥ | | Fixed | | | 0.00 | | | 2.15 | | | 8,942 | | | 8 Y |
Paris Club | | Japan | | Japan Bank for International Cooperation | | ¥ | | Fixed | | | 0.00 | | | 1.60 | | | 9,354 | | | 8 Y |
Paris Club | | Japan | | Japan Bank for International Cooperation | | ¥ | | Fixed | | | 0.00 | | | 2.30 | | | 4,599 | | | 8 Y |
Paris Club | | Japan | | Japan Bank for International Cooperation | | ¥ | | Fixed | | | 0.00 | | | 1.95 | | | 5,679 | | | 8 Y |
Paris Club | | Japan | | Japan Bank for International Cooperation | | ¥ | | Fixed | | | 0.00 | | | 1.60 | | | 3,795 | | | 8 Y |
Paris Club | | Japan | | Japan Bank for International Cooperation | | ¥ | | Fixed | | | 0.00 | | | 1.55 | | | 9,446 | | | 8 Y |
Paris Club | | Japan | | Japan Bank for International Cooperation | | ¥ | | Fixed | | | 0.00 | | | 1.60 | | | 9,936 | | | 8 Y |
A-4
| | | | | | | | | | | | | | | | | | | | |
Type of Lender | | Country | | Lender | | Currency | | Type of Interest Rate | | Spread (%) | | | Interest Rate (%) | | Outstanding
Amount as of
December 31, 2011
(in thousands of US) | | | Period to
Maturity |
Paris Club | | Japan | | Japan Bank for International Cooperation | | ¥ | | Fixed | | | 0.00 | | | 1.70 | | | 8,684 | | | 8 Y |
Paris Club | | Japan | | Japan Bank for International Cooperation | | ¥ | | Fixed | | | 0.00 | | | 1.80 | | | 9,331 | | | 8 Y |
Paris Club | | Japan | | Japan Bank for International Cooperation | | ¥ | | Fixed | | | 0.00 | | | 1.60 | | | 9,233 | | | 8 Y |
Paris Club | | Japan | | Japan Bank for International Cooperation | | ¥ | | Fixed | | | 0.00 | | | 1.50 | | | 6,888 | | | 8 Y |
Paris Club | | Japan | | Japan Bank for International Cooperation | | ¥ | | Fixed | | | 0.00 | | | 1.50 | | | 11,183 | | | 8 Y |
Paris Club | | Japan | | Japan Bank for International Cooperation | | ¥ | | Fixed | | | 0.00 | | | 2.10 | | | 154,601 | | | 5 Y |
Paris Club | | Japan | | Japan International Cooperation Agency | | ¥ | | Fixed | | | 0.00 | | | 4.10 | | | 20,602 | | | 3 Y |
Paris Club | | Japan | | Japan International Cooperation Agency | | ¥ | | Fixed | | | 0.00 | | | 3.00 | | | 76,753 | | | 15 Y |
Paris Club | | Japan | | Japan International Cooperation Agency | | ¥ | | Fixed | | | 0.00 | | | 2.50 | | | 74,285 | | | 10 Y |
Paris Club | | Japan | | Japan International Cooperation Agency | | ¥ | | Fixed | | | 0.00 | | | 2.10 | | | 9,208 | | | 10 Y |
Paris Club | | Japan | | Japan International Cooperation Agency | | ¥ | | Fixed | | | 0.00 | | | 2.70 | | | 179,432 | | | 10 Y |
Paris Club | | Japan | | Japan International Cooperation Agency | | ¥ | | Fixed | | | 0.00 | | | 2.30 | | | 28,188 | | | 10 Y |
Paris Club | | Japan | | Japan International Cooperation Agency | | ¥ | | Fixed | | | 0.00 | | | 4.10 | | | 29,666 | | | 6 Y |
Paris Club | | Japan | | Japan International Cooperation Agency | | ¥ | | Fixed | | | 0.00 | | | 4.10 | | | 61,207 | | | 7 Y |
Paris Club | | Japan | | Japan International Cooperation Agency | | ¥ | | Fixed | | | 0.00 | | | 1.70 | | | 21,824 | | | 13 Y |
Paris Club | | Japan | | Japan International Cooperation Agency | | ¥ | | Fixed | | | 0.00 | | | 0.75 | | | 2,168 | | | 28 Y |
Paris Club | | Japan | | Japan International Cooperation Agency | | ¥ | | Fixed | | | 0.00 | | | 1.70 | | | 48,034 | | | 13 Y |
Paris Club | | Japan | | Japan International Cooperation Agency | | ¥ | | Fixed | | | 0.00 | | | 0.75 | | | 68,954 | | | 28 Y |
Paris Club | | Japan | | Japan International Cooperation Agency | | ¥ | | Fixed | | | 0.00 | | | 1.70 | | | 16,988 | | | 13 Y |
Paris Club | | Japan | | Japan International Cooperation Agency | | ¥ | | Fixed | | | 0.00 | | | 2.20 | | | 49,035 | | | 13 Y |
Paris Club | | Japan | | Japan International Cooperation Agency | | ¥ | | Fixed | | | 0.00 | | | 0.75 | | | 8,825 | | | 28 Y |
Paris Club | | Japan | | Japan International Cooperation Agency | | ¥ | | Fixed | | | 0.00 | | | 2.20 | | | 112,169 | | | 13 Y |
Paris Club | | Japan | | Japan International Cooperation Agency | | ¥ | | Fixed | | | 0.00 | | | 0.75 | | | 31,827 | | | 28 Y |
Paris Club | | Japan | | Japan International Cooperation Agency | | ¥ | | Fixed | | | 0.00 | | | 1.70 | | | 39,787 | | | 14 Y |
Paris Club | | Japan | | Japan International Cooperation Agency | | ¥ | | Fixed | | | 0.00 | | | 0.75 | | | 3,025 | | | 29 Y |
Paris Club | | Japan | | Japan International Cooperation Agency | | ¥ | | Fixed | | | 0.00 | �� | | 1.70 | | | 22,607 | | | 14 Y |
Paris Club | | Japan | | Japan International Cooperation Agency | | ¥ | | Fixed | | | 0.00 | | | 0.75 | | | 6,599 | | | 29 Y |
A-5
| | | | | | | | | | | | | | | | | | | | |
Type of Lender | | Country | | Lender | | Currency | | Type of Interest Rate | | Spread (%) | | | Interest Rate (%) | | Outstanding
Amount as of
December 31, 2011
(in thousands of US) | | | Period to
Maturity |
| Paris Club | | Japan | | Japan International Cooperation Agency | | ¥ | | Fixed | | | 0.00 | | | 0.75 | | | 1,162 | | | 29 Y |
| Paris Club | | Japan | | Japan International Cooperation Agency | | ¥ | | Fixed | | | 0.00 | | | 0.75 | | | 579 | | | 29 Y |
| Paris Club | | Japan | | Japan International Cooperation Agency | | ¥ | | Fixed | | | 0.00 | | | 1.70 | | | 13,874 | | | 14 Y |
| Paris Club | | Japan | | Japan International Cooperation Agency | | ¥ | | Fixed | | | 0.00 | | | 0.75 | | | 1,064 | | | 29 Y |
| Paris Club | | Japan | | Japan International Cooperation Agency | | ¥ | | Fixed | | | 0.00 | | | 0.75 | | | 582 | | | 29 Y |
| Paris Club | | Japan | | Japan International Cooperation Agency | | ¥ | | Fixed | | | 0.00 | | | 0.75 | | | 223 | | | 29 Y |
| Paris Club | | Japan | | Japan International Cooperation Agency | | ¥ | | Fixed | | | 0.00 | | | 1.70 | | | 204,967 | | | 14 Y |
| Paris Club | | Japan | | Japan International Cooperation Agency | | ¥ | | Fixed | | | 0.00 | | | 0.75 | | | 44,020 | | | 29 Y |
| Paris Club | | Japan | | Japan International Cooperation Agency | | ¥ | | Fixed | | | 0.00 | | | 1.50 | | | 45,333 | | | 20 Y |
| Paris Club | | Japan | | Japan International Cooperation Agency | | ¥ | | Fixed | | | 0.00 | | | 0.40 | | | 68,096 | | | 12 Y |
| Paris Club | | Japan | | Japan International Cooperation Agency | | ¥ | | Fixed | | | 0.00 | | | 0.01 | | | 11,491 | | | 12 Y |
| Paris Club | | Japan | | Japan International Cooperation Agency | | ¥ | | Fixed | | | 0.00 | | | 0.80 | | | 18,175 | | | 13 Y |
| Paris Club | | Japan | | Japan International Cooperation Agency | | ¥ | | Fixed | | | 0.00 | | | 0.40 | | | 26,170 | | | 13 Y |
| Paris Club | | Japan | | Japan International Cooperation Agency | | ¥ | | Fixed | | | 0.00 | | | 0.01 | | | 10,205 | | | 13 Y |
| Paris Club | | Japan | | Japan International Cooperation Agency | | ¥ | | Fixed | | | 0.00 | | | 0.80 | | | 1,605 | | | 13 Y |
| Paris Club | | Japan | | Japan International Cooperation Agency | | ¥ | | Fixed | | | 0.00 | | | 0.01 | | | 2,070 | | | 13 Y |
| Paris Club | | Japan | | Japan International Cooperation Agency | | ¥ | | Fixed | | | 0.00 | | | 0.80 | | | 20,085 | | | 13 Y |
| Paris Club | | Japan | | Japan International Cooperation Agency | | ¥ | | Fixed | | | 0.00 | | | 0.01 | | | 9,241 | | | 13 Y |
| Paris Club | | Japan | | Japan International Cooperation Agency | | ¥ | | Fixed | | | 0.00 | | | 0.01 | | | 10,023 | | | 23 Y |
| Paris Club | | Japan | | Japan International Cooperation Agency | | ¥ | | Fixed | | | 0.00 | | | 1.40 | | | 119,862 | | | 24 Y |
| Paris Club | | The Netherlands | | Nederlanse Investiringsbank Voor Ontwikellingslande (NIO) | | EURO | | Fixed | | | 0.00 | | | 0.75 | | | 1,147 | | | 17 Y |
| Paris Club | | The Netherlands | | Nederlanse Investiringsbank Voor Ontwikellingslande (NIO) | | EURO | | Fixed | | | 0.00 | | | 0.75 | | | 3,928 | | | 15 Y |
| Paris Club | | The Netherlands | | Nederlanse Investiringsbank Voor Ontwikellingslande (NIO) | | EURO | | Fixed | | | 0.00 | | | 2.50 | | | 2,301 | | | 6 Y |
| International Organizations | | 1.8061 | | European Investment Bank | | U.S.$ | | Fixed | | | 0.00 | | | 6.73 | | | 11,690 | | | 5 Y |
| International Organizations | | 1.8061 | | European Investment Bank | | U.S.$ | | Fixed | | | 0.00 | | | 7.06 | | | 736 | | | 5 Y |
| International Organizations | | 5-CD-PE | | Inter-American Development Bank | | CAN$ | | No interest | | | 0.00 | | | 0.00 | | | 24 | | | 7 Y |
| International Organizations | | 852-2-OC-PE | | Inter-American Development Bank | | U.S.$ | | 6-month Libor for U.S.$ | | | 0.00 | | | Variable | | | 2,503 | | | 4 Y |
A-6
| | | | | | | | | | | | | | | | | | | | |
Type of Lender | | Country | | Lender | | Currency | | Type of Interest Rate | | Spread (%) | | | Interest Rate (%) | | Outstanding
Amount as of
December 31, 2011
(in thousands of US) | | | Period to
Maturity |
| International Organizations | | 958-SF-PE | | Inter-American Development Bank | | U.S.$ | | Fixed | | | 0.00 | | | 2.00 | | | 15,217 | | | 14 Y |
| International Organizations | | 1128-OC-PE | | Inter-American Development Bank | | U.S.$ | | Single currency facility-adjustable rate | | | 0.50 | | | Variable | | | 16,364 | | | 12 Y |
| International Organizations | | 1137-OC-PE | | Inter-American Development Bank | | U.S.$ | | 6-month Libor for U.S.$ | | | 0.00 | | | Variable | | | 95,663 | | | 8 Y |
| International Organizations | | 1421-OC-PE | | Inter-American Development Bank | | U.S.$ | | Fixed | | | 0.95 | | | 4.59 | | | 60,539 | | | 16 Y |
| International Organizations | | 1461-OC-PE | | Inter-American Development Bank | | U.S.$ | | Fixed | | | 0.95 | | | 4.59 | | | 33,129 | | | 17 Y |
| International Organizations | | 1461-OC-PE | | Inter-American Development Bank | | U.S.$ | | Fixed | | | 0.95 | | | 4.59 | | | 16,566 | | | 17 Y |
| International Organizations | | 1449-OC-PE/PPF | | Inter-American Development Bank | | U.S.$ | | Single currency facility-adjustable rate | | | 0.50 | | | Variable | | | 150 | | | 1 Y |
| International Organizations | | 1437-OC-PE | | Inter-American Development Bank | | U.S.$ | | Fixed | | | 0.95 | | | 4.59 | | | 8,065 | | | 12 Y |
| International Organizations | | 1437-OC-PE | | Inter-American Development Bank | | U.S.$ | | Fixed | | | 0.95 | | | 4.59 | | | 12,325 | | | 12 Y |
| International Organizations | | 1482-OC-PE | | Inter-American Development Bank | | U.S.$ | | Single currency facility-adjustable rate | | | 0.50 | | | Variable | | | 3,034 | | | 12 Y |
| International Organizations | | 1501-OC-PE | | Inter-American Development Bank | | U.S.$ | | Single currency facility-adjustable rate | | | 0.50 | | | Variable | | | 39,462 | | | 28 Y |
| International Organizations | | 1534-OC-PE | | Inter-American Development Bank | | U.S.$ | | Single currency facility-adjustable rate | | | 0.50 | | | Variable | | | 14,522 | | | 17 Y |
| International Organizations | | 1539-OC-PE/PPF | | Inter-American Development Bank | | U.S.$ | | Single currency facility-adjustable rate | | | 0.50 | | | Variable | | | 476 | | | 1 M |
| International Organizations | | 1591-OC-PE | | Inter-American Development Bank | | U.S.$ | | Single currency facility-adjustable rate | | | 0.50 | | | Variable | | | 9,312 | | | 13 Y |
| International Organizations | | 1586-OC-PE | | Inter-American Development Bank | | U.S.$ | | Single currency facility-adjustable rate | | | 0.50 | | | Variable | | | 11,336 | | | 13 Y |
| International Organizations | | 1601-OC-PE | | Inter-American Development Bank | | U.S.$ | | Single currency facility-adjustable rate | | | 0.50 | | | Variable | | | 4,323 | | | 13 Y |
| International Organizations | | 1696-OC-PE | | Inter-American Development Bank | | U.S.$ | | Single currency facility-adjustable rate | | | 0.50 | | | Variable | | | 2,674 | | | 14 Y |
| International Organizations | | 1657-OC-PE | | Inter-American Development Bank | | U.S.$ | | Single currency facility-adjustable rate | | | 0.50 | | | Variable | | | 24,102 | | | 15 Y |
| International Organizations | | 1663-OC-PE | | Inter-American Development Bank | | U.S.$ | | Single currency facility-adjustable rate | | | 0.50 | | | Variable | | | 24,163 | | | 20 Y |
| International Organizations | | 1805-OC-PE | | Inter-American Development Bank | | S/. | | Local currency facility | | | 0.95 | | | 6.48 | | | 55,172 | | | 10 Y |
| International Organizations | | 1805-OC-PE | | Inter-American Development Bank | | S/. | | Local currency facility | | | 0.95 | | | 6.48 | | | 89,264 | | | 8 Y |
| International Organizations | | 1805-OC-PE | | Inter-American Development Bank | | S/. | | Local currency facility | | | 0.95 | | | 6.69 | | | 31,546 | | | 8 Y |
A-7
| | | | | | | | | | | | | | | | | | | | |
Type of Lender | | Country | | Lender | | Currency | | Type of Interest Rate | | Spread (%) | | | Interest Rate (%) | | Outstanding
Amount as of
December 31, 2011
(in thousands of US) | | | Period to
Maturity |
| International Organizations | | 1805-OC-PE | | Inter-American Development Bank | | S/. | | Local currency facility | | | 0.95 | | | 6.14 | | | 36,417 | | | 8 Y |
| International Organizations | | 1810-OC-PE | | Inter-American Development Bank | | U.S.$ | | Single currency facility-adjustable rate | | | 0.50 | | | Variable | | | 44,934 | | | 16 Y |
| International Organizations | | 1827-OC-PE | | Inter-American Development Bank | | U.S.$ | | Single currency facility-adjustable rate | | | 0.50 | | | Variable | | | 60,252 | | | 16 Y |
| International Organizations | | 1899-OC-PE/PPF | | Inter-American Development Bank | | U.S.$ | | Single currency facility-adjustable rate | | | 0.50 | | | Variable | | | 1,044 | | | 1 Y |
| International Organizations | | 1836-OC-PE | | Inter-American Development Bank | | U.S.$ | | Single currency facility-adjustable rate | | | 0.50 | | | Variable | | | 1,440 | | | 16 Y |
| International Organizations | | 1915-OC-PE | | Inter-American Development Bank | | U.S.$ | | Single currency facility-adjustable rate | | | 0.50 | | | Variable | | | 49,974 | | | 22 Y |
| International Organizations | | 2045-OC-PE | | Inter-American Development Bank | | U.S.$ | | Single currency facility-adjustable rate | | | 0.95 | | | Variable | | | 15,000 | | | 17 Y |
| International Organizations | | 1442/OC-PE-1 | | Inter-American Development Bank | | U.S.$ | | Fixed | | | 0.95 | | | 4.59 | | | 1,085,691 | | | 16 Y |
| International Organizations | | 906/OC-PE-1 | | Inter-American Development Bank | | U.S.$ | | Fixed | | | 0.95 | | | 4.03 | | | 275,748 | | | 9 Y |
| International Organizations | | 1878/OC-PE-1 | | Inter-American Development Bank | | U.S.$ | | Single currency facility-adjustable rate | | | 0.95 | | | Variable | | | 503,580 | | | 17 Y |
| International Organizations | | 720/SF-PE-1 | | Inter-American Development Bank | | U.S.$ | | Fixed | | | 0.00 | | | 2.00 | | | 734 | | | 2 Y |
| International Organizations | | 720/SF-PE-1 | | Inter-American Development Bank | | U.S.$ | | Fixed | | | 0.00 | | | 2.00 | | | 637 | | | 2 Y |
| International Organizations | | 720/SF-PE-1 | | Inter-American Development Bank | | ¥ | | Fixed | | | 0.00 | | | 2.00 | | | 234 | | | 1 Y |
| International Organizations | | 720/SF-PE-1 | | Inter-American Development Bank | | EURO | | Fixed | | | 0.00 | | | 2.00 | | | 439 | | | 2 Y |
| International Organizations | | 720/SF-PE-1 | | Inter-American Development Bank | | FR.SZ | | Fixed | | | 0.00 | | | 2.00 | | | 74 | | | 2 Y |
| International Organizations | | 2092-OC-PE | | Inter-American Development Bank | | U.S.$ | | Single currency facility-adjustable rate | | | 0.95 | | | Variable | | | 4,744 | | | 18 Y |
| International Organizations | | 2118-OC-PE | | Inter-American Development Bank | | U.S.$ | | Single currency facility-adjustable rate | | | 0.95 | | | Variable | | | 100,000 | | | 18 Y |
| International Organizations | | 2118-OC-PE | | Inter-American Development Bank | | S/. | | Local currency facility | | | 0.95 | | | 5.395 | | | 51,405 | | | 8 Y |
| International Organizations | | 2166-OC-PE | | Inter-American Development Bank | | U.S.$ | | Single currency facility-adjustable rate | | | 0.95 | | | Variable | | | 1,280 | | | 23 Y |
| International Organizations | | 2218-OC-PE | | Inter-American Development Bank | | U.S.$ | | Single currency facility-adjustable rate | | | 0.95 | | | Variable | | | 20,000 | | | 18 Y |
| International Organizations | | 2234-OC-PE | | Inter-American Development Bank | | U.S.$ | | Single currency facility-adjustable rate | | | 0.95 | | | Variable | | | 50,000 | | | 18 Y |
| International Organizations | | 2269-OC-PE | | Inter-American Development Bank | | U.S.$ | | Single currency facility-adjustable rate | | | 0.95 | | | Variable | | | 561 | | | 19 Y |
A-8
| | | | | | | | | | | | | | | | | | | | |
Type of Lender | | Country | | Lender | | Currency | | Type of Interest Rate | | Spread (%) | | | Interest Rate (%) | | Outstanding
Amount as of
December 31, 2011
(in thousands of US) | | | Period to
Maturity |
| International Organizations | | 2303-OC-PE | | Inter-American Development Bank | | U.S.$ | | Single currency facility-adjustable rate | | | 0.95 | | | Variable | | | 805 | | | 24 Y |
| International Organizations | | 2325-OC-PE | | Inter-American Development Bank | | U.S.$ | | Single currency facility-adjustable rate | | | 0.95 | | | Variable | | | 50,000 | | | 19 Y |
| International Organizations | | 2413-OC-PE | | Inter-American Development Bank | | U.S.$ | | Single currency facility-adjustable rate | | | 0.95 | | | Variable | | | 25,000 | | | 19 Y |
| International Organizations | | 2417-OC-PE | | Inter-American Development Bank | | U.S.$ | | Single currency facility-adjustable rate | | | 0.95 | | | Variable | | | 25,000 | | | 19 Y |
| International Organizations | | 2449-OC-PE | | Inter-American Development Bank | | U.S.$ | | Single currency facility-adjustable rate | | | 0.95 | | | Variable | | | 50,000 | | | 19 Y |
| International Organizations | | 2455-OC-PE | | Inter-American Development Bank | | U.S.$ | | Single currency facility-adjustable rate | | | 0.95 | | | Variable | | | 25,000 | | | 19 Y |
| International Organizations | | 2446-OC-PE | | Inter-American Development Bank | | U.S.$ | | Single currency facility-adjustable rate | | | 0.95 | | | Variable | | | 100,000 | | | 19 Y |
| International Organizations | | 2374-OC-PE | | Inter-American Development Bank | | U.S.$ | | Single currency facility-adjustable rate | | | 0.95 | | | Variable | | | 2,046 | | | 24 y |
| International Organizations | | 2456-OC-PE | | Inter-American Development Bank | | U.S.$ | | Single currency facility-adjustable rate | | | 0.95 | | | Variable | | | 25,000 | | | 19 Y |
| International Organizations | | 2445-OC-PE | | Inter-American Development Bank | | U.S.$ | | Single currency facility-adjustable rate | | | 0.95 | | | Variable | | | 528 | | | 24 Y |
| International Organizations | | 2531-OC-PE | | Inter-American Development Bank | | U.S.$ | | Single currency facility-adjustable rate | | | 0.95 | | | Variable | | | 25,000 | | | 20 Y |
| International Organizations | | 2544-OC-PE | | Inter-American Development Bank | | U.S.$ | | Single currency facility-adjustable rate | | | 0.95 | | | Variable | | | 25,000 | | | 20 Y |
| International Organizations | | 2544-OC-PE | | Inter-American Development Bank | | U.S.$ | | Single currency facility-adjustable rate | | | 0.95 | | | Variable | | | 25,000 | | | 20 Y |
| International Organizations | | 2604-OC-PE | | Inter-American Development Bank | | U.S.$ | | Single currency facility-adjustable rate | | | 0.95 | | | Variable | | | 25,000 | | | 20 Y |
| International Organizations | | CFA-3525 | | Andean Development Corporation | | U.S.$ | | 6-month Libor for U.S.$ | | | 1.50 | | | Variable | | | 7,600 | | | 7 Y |
| International Organizations | | CFA-3572 | | Andean Development Corporation | | U.S.$ | | 6-month Libor for U.S.$ | | | 0.60 | | | Variable | | | 13,536 | | | 10 Y |
| International Organizations | | CFA-3804 | | Andean Development Corporation | | U.S.$ | | 6-month Libor for U.S.$ | | | 1.00 | | | Variable | | | 581 | | | 4 Y |
| International Organizations | | CFA-004495/4496 | | Andean Development Corporation | | U.S.$ | | 6-month Libor for U.S.$ | | | 0.20 | | | Variable | | | 250,000 | | | 14 Y |
| International Organizations | | CFA-4579/4580 | | Andean Development Corporation | | U.S.$ | | 6-month Libor for U.S.$ | | | 0.20 | | | Variable | | | 150,000 | | | 15 Y |
| International Organizations | | CFA-5094/5096 | | Andean Development Corporation | | U.S.$ | | 6-month Libor for U.S.$ | | | 1.90 | | | Variable | | | 140,326 | | | 15 Y |
| International Organizations | | CFA-05129 | | Andean Development Corporation | | U.S.$ | | 6-month Libor for U.S.$ | | | 1.35 | | | Variable | | | 298,032 | | | 14 Y |
| International Organizations | | CFA-6141 | | Andean Development Corporation | | U.S.$ | | 6-month Libor for U.S.$ | | | 2.40 | | | Variable | | | 296,852 | | | 17 Y |
A-9
| | | | | | | | | | | | | | | | | | | | |
Type of Lender | | Country | | Lender | | Currency | | Type of Interest Rate | | Spread (%) | | | Interest Rate (%) | | Outstanding
Amount as of
December 31, 2011
(in thousands of US) | | | Period to
Maturity |
| International Organizations | | CFA-6616 | | Andean Development Corporation | | U.S.$ | | 6-month Libor for U.S.$ | | | 2.40 | | | Variable | | | 69,072 | | | 17 Y |
| International Organizations | | CFA-6923 | | Andean Development Corporation | | U.S.$ | | 6-month Libor for U.S.$ | | | 2.30 | | | Variable | | | 183,837 | | | 14 Y |
| International Organizations | | CFA-6922 | | Andean Development Corporation | | U.S.$ | | 6-month Libor for U.S.$ | | | 1.95 | | | Variable | | | 300,000 | | | 5 Y |
| International Organizations | | | | Andean Development Corporation | | U.S.$ | | 6-month Libor for U.S.$ | | | 0.85 | | | Variable | | | 30,000 | | | 2Y |
| International Organizations | | CFA-7454 | | Andean Development Corporation | | U.S.$ | | 6-month Libor for U.S.$ | | | 1.10 | | | Variable | | | 108,916 | | | 9 Y |
| International Organizations | | 3540-S PE | | International Bank For Reconstruction and Development | | S/POOL | | Fixed | | | 0.00 | | | 2.49 | | | 2,991 | | | 2 Y |
| International Organizations | | 3437-S PE | | International Bank For Reconstruction and Development | | S/POOL | | Fixed | | | 0.00 | | | 2.49 | | | 45,124 | | | 2 Y |
| International Organizations | | 3489-S PE | | International Bank For Reconstruction and Development | | S/POOL | | Fixed | | | 0.00 | | | 2.49 | | | 58,562 | | | 2 Y |
| International Organizations | | 3452-S PE | | International Bank For Reconstruction and Development | | S/POOL | | Single currency basket rate | | | 0.50 | | | Variable | | | 30,638 | | | 1 Y |
| International Organizations | | 3595-S PE | | International Bank For Reconstruction and Development | | S/POOL | | Fixed | | | 0.00 | | | 2.49 | | | 21,078 | | | 2 Y |
| International Organizations | | 3610-S PE | | International Bank For Reconstruction and Development | | S/POOL | | Fixed | | | 0.00 | | | 2.49 | | | 1,790 | | | 2 Y |
| International Organizations | | 3684-S PE | | International Bank For Reconstruction and Development | | S/POOL | | Fixed | | | 0.00 | | | 2.49 | | | 17,622 | | | 2 Y |
| International Organizations | | 3717-A PE | | International Bank For Reconstruction and Development | | U.S.$ | | 6-month Libor for U.S.$ | | | 0.50 | | | Variable | | | 18,957 | | | 3 Y |
| International Organizations | | 3717-S PE | | International Bank For Reconstruction and Development | | S/POOL | | Fixed | | | 0.00 | | | 2.92 | | | 16,527 | | | 3 Y |
| International Organizations | | 3701-A PE | | International Bank For Reconstruction and Development | | U.S.$ | | 6-month Libor for U.S.$ | | | 0.50 | | | Variable | | | 5,802 | | | 3 Y |
| International Organizations | | 3701-S PE | | International Bank For Reconstruction and Development | | S/POOL | | Fixed | | | 0.00 | | | 2.92 | | | 2,339 | | | 3 Y |
| International Organizations | | 3810-S PE | | International Bank For Reconstruction and Development | | S/POOL | | Fixed | | | 0.00 | | | 2.92 | | | 25,042 | | | 3 Y |
| International Organizations | | 3811-A PE | | International Bank For Reconstruction and Development | | U.S.$ | | 6-month Libor for U.S.$ | | | 0.50 | | | Variable | | | 37,462 | | | 3 Y |
| International Organizations | | 3811-S PE | | International Bank For Reconstruction and Development | | S/POOL | | Fixed | | | 0.00 | | | 2.92 | | | 5,511 | | | 3 Y |
| International Organizations | | 3962-O PE | | International Bank For Reconstruction and Development | | U.S.$ | | 6-month Libor for U.S.$ | | | 0.50 | | | Variable | | | 7,220 | | | 1 Y |
| International Organizations | | 3826-A PE | | International Bank For Reconstruction and Development | | S/POOL | | 6-month Libor for U.S.$ | | | 0.50 | | | Variable | | | 4,680 | | | 1 Y |
| International Organizations | | 3826-S PE | | International Bank For Reconstruction and Development | | U.S.$ | | Fixed | | | 0.00 | | | 2.49 | | | 327 | | | 1 Y |
A-10
| | | | | | | | | | | | | | | | | | | | |
Type of Lender | | Country | | Lender | | Currency | | Type of Interest Rate | | Spread (%) | | | Interest Rate (%) | | Outstanding
Amount as of
December 31, 2011
(in thousands of US) | | | Period to
Maturity |
| International Organizations | | 4068-A PE | | International Bank For Reconstruction and Development | | S/POOL | | 6-month Libor for U.S.$ | | | 0.50 | | | Variable | | | 17,751 | | | 2 Y |
| International Organizations | | 4068-S PE | | International Bank For Reconstruction and Development | | U.S.$ | | Fixed | | | 0.00 | | | 2.49 | | | 2,869 | | | 2 Y |
| International Organizations | | 4076-O PE | | International Bank For Reconstruction and Development | | U.S.$ | | 6-month Libor for U.S.$ | | | 0.50 | | | Variable | | | 17,376 | | | 2 Y |
| International Organizations | | 4133-O PE | | International Bank For Reconstruction and Development | | U.S.$ | | 6-month Libor for U.S.$ | | | 0.50 | | | Variable | | | 38,125 | | | 3 Y |
| International Organizations | | 4130-O PE | | International Bank For Reconstruction and Development | | U.S.$ | | 6-month Libor for U.S.$ | | | 0.50 | | | Variable | | | 11,686 | | | 3 Y |
| International Organizations | | 4250-O PE | | International Bank For Reconstruction and Development | | U.S.$ | | 6-month Libor for U.S.$ | | | 0.50 | | | Variable | | | 19,373 | | | 4Y |
| International Organizations | | 4384-O PE | | International Bank For Reconstruction and Development | | U.S.$ | | 6-month Libor for U.S.$ | | | 0.01 | | | Variable | | | 12,001 | | | 4 Y |
| International Organizations | | 4497-O PE | | International Bank For Reconstruction and Development | | U.S.$ | | 6-month Libor for U.S.$ | | | 0.75 | | | Variable | | | 112,500 | | | 5 Y |
| International Organizations | | 4519-O PE | | International Bank For Reconstruction and Development | | U.S.$ | | 6-month Libor for U.S.$ | | | 0.75 | | | Variable | | | 3,692 | | | 6 Y |
| International Organizations | | 4536-O PE | | International Bank For Reconstruction and Development | | U.S.$ | | 6-month Libor for U.S.$ | | | 0.75 | | | Variable | | | 428 | | | 6 Y |
| International Organizations | | 4527-O PE | | International Bank For Reconstruction and Development | | U.S.$ | | 6-month Libor for U.S.$ | | | 0.75 | | | Variable | | | 12,375 | | | 6 Y |
| International Organizations | | 4615-O PE | | International Bank For Reconstruction and Development | | U.S.$ | | 6-month Libor for U.S.$ | | | 0.75 | | | Variable | | | 58,350 | | | 7 Y |
| International Organizations | | 4614-O PE | | International Bank For Reconstruction and Development | | U.S.$ | | 6-month Libor for U.S.$ | | | 0.75 | | | Variable | | | 27,970 | | | 7 Y |
| International Organizations | | 7142-O PE | | International Bank For Reconstruction and Development | | U.S.$ | | 6-month Libor for U.S.$ | | | 0.75 | | | Variable | | | 37,726 | | | 5 Y |
| International Organizations | | 4678-O PE | | International Bank For Reconstruction and Development | | U.S.$ | | 6-month Libor for U.S.$ | | | 0.75 | | | Variable | | | 66,680 | | | 8 Y |
| International Organizations | | 7177-O PE | | International Bank For Reconstruction and Development | | U.S.$ | | 6-month Libor for U.S.$ | | | 0.50 | | | Variable | | | 16,372 | | | 6 Y |
| International Organizations | | 7176-O PE | | International Bank For Reconstruction and Development | | U.S.$ | | 6-month Libor for U.S.$ | | | 0.50 | | | Variable | | | 26,566 | | | 6 Y |
| International Organizations | | 7200-O PE | | International Bank For Reconstruction and Development | | U.S.$ | | Fixed | | | 0.00 | | | 5.11 | | | 150,000 | | | 6 Y |
| International Organizations | | 7203-O PE | | International Bank For Reconstruction and Development | | U.S.$ | | Fixed | | | 0.00 | | | 5.13 | | | 150,000 | | | 6 Y |
| International Organizations | | 7209-O PE | | International Bank For Reconstruction and Development | | U.S.$ | | 6-month Libor for U.S.$ | | | 0.50 | | | Variable | | | 30,827 | | | 12 Y |
| International Organizations | | 7160-O PE | | International Bank For Reconstruction and Development | | U.S.$ | | 6-month Libor for U.S.$ | | | 0.50 | | | Variable | | | 15,000 | | | 8 Y |
| International Organizations | | 7219-O PE | | International Bank For Reconstruction and Development | | U.S.$ | | 6-month Libor for U.S.$ | | | 0.50 | | | Variable | | | 11,772 | | | 7 Y |
A-11
| | | | | | | | | | | | | | | | | | | | |
Type of Lender | | Country | | Lender | | Currency | | Type of Interest Rate | | Spread (%) | | | Interest Rate (%) | | Outstanding
Amount as of
December 31, 2011
(in thousands of US) | | | Period to
Maturity |
| International Organizations | | 7267-O PE | | International Bank For Reconstruction and Development | | U.S.$ | | Fixed | | | 0.00 | | | 5.14 | | | 100,000 | | | 7 Y |
| International Organizations | | 7255-O PE | | International Bank For Reconstruction and Development | | U.S.$ | | 6-month Libor for U.S.$ | | | 0.50 | | | Variable | | | 6,493 | | | 7 Y |
| International Organizations | | 7266-O PE | | International Bank For Reconstruction and Development | | U.S.$ | | Fixed | | | 0.00 | | | 5.13 | | | 100,000 | | | 7 Y |
| International Organizations | | 7254-O PE | | International Bank For Reconstruction and Development | | U.S.$ | | 6-month Libor for U.S.$ | | | 0.50 | | | Variable | | | 6,633 | | | 7 Y |
| International Organizations | | 7257-O PE | | International Bank For Reconstruction and Development | | U.S.$ | | 6-month Libor for U.S.$ | | | 0.50 | | | Variable | | | 1,984 | | | 7 Y |
| International Organizations | | 7257-O PE | | International Bank For Reconstruction and Development | | U.S.$ | | 6-month Libor for U.S.$ | | | 0.50 | | | Variable | | | 2,087 | | | 7 Y |
| International Organizations | | 7285-O PE | | International Bank For Reconstruction and Development | | U.S.$ | | 6-month Libor for U.S.$ | | | 0.50 | | | Variable | | | 23,161 | | | 8 Y |
| International Organizations | | 7308-O PE | | International Bank For Reconstruction and Development | | U.S.$ | | 6-month Libor for U.S.$ | | | 0.50 | | | Variable | | | 10,239 | | | 8 Y |
| International Organizations | | 7345-O PE | | International Bank For Reconstruction and Development | | U.S.$ | | 6-month Libor for U.S.$ | | | 0.50 | | | Variable | | | 150,000 | | | 6 Y |
| International Organizations | | 7322-O PE | | International Bank For Reconstruction and Development | | U.S.$ | | 6-month Libor for U.S.$ | | | 0.50 | | | Variable | | | 24,032 | | | 8 Y |
| International Organizations | | 7366-O PE | | International Bank For Reconstruction and Development | | U.S.$ | | 6-month Libor for U.S.$ | | | 0.50 | | | Variable | | | 48,515 | | | 6 Y |
| International Organizations | | 7368-O PE | | International Bank For Reconstruction and Development | | U.S.$ | | 6-month Libor for U.S.$ | | | 0.50 | | | Variable | | | 19,325 | | | 6 Y |
| International Organizations | | 7423-O PE | | International Bank For Reconstruction and Development | | U.S.$ | | 6-month Libor for U.S.$ | | | 0.50 | | | Variable | | | 42,802 | | | 7 Y |
| International Organizations | | 7419-O PE | | International Bank For Reconstruction and Development | | U.S.$ | | 6-month Libor for U.S.$ | | | 0.50 | | | Variable | | | 200,000 | | | 7 Y |
| International Organizations | | 7443-O PE | | International Bank For Reconstruction and Development | | U.S.$ | | 6-month Libor for U.S.$ | | | 0.50 | | | Variable | | | 13,916 | | | 7 Y |
| International Organizations | | 7455-O PE | | International Bank For Reconstruction and Development | | U.S.$ | | 6-month Libor for U.S.$ | | | 0.50 | | | Variable | | | 150,000 | | | 12 Y |
| International Organizations | | 7588-O PE | | International Bank For Reconstruction and Development | | U.S.$ | | 6-month Libor for U.S.$ | | | 0.75 | | | Variable | | | 70,000 | | | 18 Y |
| International Organizations | | 7588-O PE | | International Bank For Reconstruction and Development | | U.S.$ | | 6-month Libor for U.S.$ | | | 1.05 | | | Variable | | | 150,000 | | | 18 Y |
| International Organizations | | 7674-O PE | | International Bank For Reconstruction and Development | | U.S.$ | | 6-month Libor for U.S.$ | | | 0.75 | | | Variable | | | 20,000 | | | 19 Y |
| International Organizations | | 7668-O PE | | International Bank For Reconstruction and Development | | U.S.$ | | 6-month Libor for U.S.$ | | | 0.75 | | | Variable | | | 20,000 | | | 19 Y |
| International Organizations | | 7643-O PE | | International Bank For Reconstruction and Development | | U.S.$ | | 6-month Libor for U.S.$ | | | 0.75 | | | Variable | | | 3,475 | | | 23 Y |
| International Organizations | | 7701-O PE | | International Bank For Reconstruction and Development | | U.S.$ | | 6-month Libor for U.S.$ | | | 0.75 | | | Variable | | | 1,369 | | | 16 Y |
A-12
| | | | | | | | | | | | | | | | | | | | |
Type of Lender | | Country | | Lender | | Currency | | Type of Interest Rate | | Spread (%) | | | Interest Rate (%) | | Outstanding
Amount as of
December 31, 2011
(in thousands of US) | | | Period to
Maturity |
| International Organizations | | 7799-O PE | | International Bank For Reconstruction and Development | | U.S.$ | | 6-month Libor for U.S.$ | | | 0.75 | | | Variable | | | 150,000 | | | 19 Y |
| International Organizations | | 7810-O PE | | International Bank For Reconstruction and Development | | U.S.$ | | 6-month Libor for U.S.$ | | | 0.75 | | | Variable | | | 50,000 | | | 18 Y |
| International Organizations | | 7950-O PE | | International Bank For Reconstruction and Development | | U.S.$ | | 6-month Libor for U.S.$ | | | 0.75 | | | Variable | | | 75,000 | | | 17 Y |
| International Organizations | | 7954-O PE | | International Bank For Reconstruction and Development | | U.S.$ | | 6-month Libor for U.S.$ | | | 0.75 | | | Variable | | | 100,000 | | | 12 Y |
| International Organizations | | 7977-O PE | | International Bank For Reconstruction and Development | | U.S.$ | | 6-month Libor for U.S.$ | | | 0.75 | | | Variable | | | 50,000 | | | 12 Y |
| International Organizations | | 7969-O PE | | International Bank For Reconstruction and Development | | U.S.$ | | 6-month Libor for U.S.$ | | | 0.75 | | | Variable | | | 850 | | | 12Y |
| International Organizations | | 7878-O PE | | International Bank For Reconstruction and Development | | U.S.$ | | 6-month Libor for U.S.$ | | | 0.75 | | | Variable | | | 1,403 | | | 17 Y |
| International Organizations | | 297-PE | | International Fund For Agricultural Development | | DEG | | Fixed | | | 0.00 | | | 4.00 | | | 594 | | | 1 Y |
| International Organizations | | 386-PE | | International Fund For Agricultural Development | | DEG | | IFAD rate | | | 0.50 | | | Variable | | | 3,367 | | | 4 Y |
| International Organizations | | 467-PE | | International Fund For Agricultural Development | | DEG | | IFAD rate | | | 0.50 | | | Variable | | | 7,364 | | | 5 Y |
| International Organizations | | 602-PE | | International Fund For Agricultural Development | | DEG | | IFAD rate | | | 0.50 | | | Variable | | | 13,074 | | | 10 Y |
| International Organizations | | 744-PE | | International Fund For Agricultural Development | | DEG | | IFAD rate | | | 0.50 | | | Variable | | | 4,780 | | | 8 Y |
| International Organizations | | 799-PE | | International Fund For Agricultural Development | | DEG | | IFAD rate | | | 0.50 | | | Variable | | | 773 | | | 5 Y |
| International Organizations | | | | Nordic Investment Bank | | U.S.$ | | 6-month Libor for U.S.$ | | | 0.85 | | | Variable | | | 10,000 | | | 5 Y |
| International Organizations | | 696-PE | | The Opec Fund For International Development | | U.S.$ | | Fixed | | | 0.00 | | | 4.00 | | | 1,042 | | | 3 Y |
| International Organizations | | 755-PE | | The Opec Fund For International Development | | U.S.$ | | Fixed | | | 0.00 | | | 4.00 | | | 1,333 | | | 4 Y |
| Latin American Countries | | Venezuela | | Banco de Desarrollo Económico y Social de Venezuela | | U.S.$ | | 6-month Libor for U.S.$ | | | 0.75 | | | Variable | | | 6,230 | | | 5 Y |
| Latin American Countries | | Chile | | Corporación de Fomento de la Producción | | U.S.$ | | Fixed | | | 0.00 | | | 4.25 | | | 762 | | | 4 Y |
| Eastern Europe and China | | People’s Republic of China | | China Development Bank | | U.S.$ | | 6-month Libor for U.S.$ | | | 0.461 | | | Variable | | | 10,000 | | | 3 Y |
| Commercial Banks | | | | American Family Life Assurance Company of Columbus | | ¥ | | Fixed | | | 0.00 | | | 3.750 | | | 115,983 | | | 20 Y |
| Commercial Banks | | | | Standard Chartered Bank | | U.S.$ | | 6-month Libor for U.S.$ | | | 1.75 | | | Variable | | | 180,000 | | | 4 Y |
| Unsecured | | Italy | | Ansaldo Energia S.p.a. | | U.S.$ | | 6-month Libor for U.S.$ | | | 2.00 | | | Variable | | | 2,519 | | | 6 Y |
A-13
| | | | | | | | | | | | | | | | | | | | |
Type of Lender | | Country | | Lender | | Currency | | Type of Interest Rate | | Spread (%) | | | Interest Rate (%) | | Outstanding
Amount as of
December 31, 2011
(in thousands of US) | | | Period to
Maturity |
| Unsecured | | Italy | | Armamenti e Aerospazio S.P.A. | | U.S.$ | | Fixed | | | 0.00 | | | 5.0268275 | | | 16,985 | | | 9 Y |
| Unsecured | | Italy | | Armamenti e Aerospazio S.P.A. | | U.S.$ | | Fixed | | | 0.00 | | | 5.0268275 | | | 10,372 | | | 9 Y |
| External Debt Bonds | | | | Par Bonds | | U.S.$ | | Multiple rate | | | 0.00 | | | Variable | | | 53,674 | | | 16 Y |
| External Debt Bonds | | | | Global Bonds 2012 | | U.S.$ | | Fixed | | | 0.00 | | | 9.125 | | | 312,172 | | | 1 Y |
| External Debt Bonds | | | | Global Bonds 2015 | | U.S.$ | | Fixed | | | 0.00 | | | 9.875 | | | 28,392 | | | 4 Y |
| External Debt Bonds | | | | Global Bonds 2015 | | U.S.$ | | Fixed | | | 0.00 | | | 9.875 | | | 250,000 | | | 4 Y |
| External Debt Bonds | | | | Global Bonds 2033 | | U.S.$ | | Fixed | | | 0.00 | | | 8.750 | | | 500,000 | | | 22 Y |
| External Debt Bonds | | | | Global Bonds 2016 | | U.S.$ | | Fixed | | | 0.00 | | | 8.375 | | | 500,000 | | | 5 Y |
| External Debt Bonds | | | | Global Bonds 2014 | | EURO | | Fixed | | | 0.00 | | | 7.500 | | | 376,747 | | | 3 Y |
| External Debt Bonds | | | | Global Bonds 2033 | | U.S.$ | | Fixed | | | 0.00 | | | 8.750 | | | 400,000 | | | 22 Y |
| External Debt Bonds | | | | Global Bonds 2025 | | U.S.$ | | Fixed | | | 0.00 | | | 7.350 | | | 750,000 | | | 14 Y |
| External Debt Bonds | | | | Global Bonds 2025 | | U.S.$ | | Fixed | | | 0.00 | | | 7.350 | | | 500,000 | | | 14 Y |
| External Debt Bonds | | | | Global Bonds 2016 | | U.S.$ | | Fixed | | | 0.00 | | | 8.375 | | | 81,211 | | | 5 Y |
| External Debt Bonds | | | | Global Bonds 2033 | | U.S.$ | | Fixed | | | 0.00 | | | 8.750 | | | 84,636 | | | 22 Y |
| External Debt Bonds | | | | Global Bonds 2037 | | U.S.$ | | Fixed | | | 0.00 | | | 6.550 | | | 1,201,667 | | | 26 Y |
| External Debt Bonds | | | | Global Bonds 2019 | | U.S.$ | | Fixed | | | 0.00 | | | 7.125 | | | 1,000,000 | | | 8 Y |
| External Debt Bonds | | | | Global Bonds 2025 | | U.S.$ | | Fixed | | | 0.00 | | | 7.350 | | | 1,000,000 | | | 14 Y |
| External Debt Bonds | | | | Global Bonds 2033 | | U.S.$ | | Fixed | | | 0.00 | | | 8.750 | | | 1,260,803 | | | 22 Y |
| External Debt Bonds | | | | Global Bonds 2050 | | U.S.$ | | Fixed | | | 0.00 | | | 5.625 | | | 1,000,000 | | | 39 Y |
A-14
Abbreviations and symbols:
CAN$ = Canadian dollar
DEG = Special Drawing Rights (Derechos Especiales de Giro)
£ = English pound
M = Months
SFR = Swiss Franc
S/POOL = Single currency pool (World Bank unit of account, based on a basket of national currencies)
U.S.$ = United States dollar
¥ = Japanese Yen
Y = Years
| (1) | Includes COFIDE loans not guaranteed by Peru. |
Source: Ministry of Economy and Finance.
A-15
PART II
(Required by Items (11), (13) and (14) of Schedule B
of the Securities Act of 1933)
1. The following are the estimated expenses of the issuance and distribution of the securities being registered:
| | | | |
Registration fee | | U.S.$ | — | |
Listing fees and expenses* | | | 45,000 | |
Printing expenses* | | | 45,000 | |
Rating agency fees* | | | 35,000 | |
Fiscal agent fees and expenses* | | | 35,000 | |
Legal fees and expenses* | | | 100,000 | |
Other* | | | 20,000 | |
| | | | |
Total | | U.S.$ | 305,000 | |
2. The Registrant hereby agrees to furnish an opinion or opinions of counsel, with respect to the legality of the issue, in connection with the offering of securities under this registration statement, and to furnish copies of the documents authorizing each issue of securities under this Registration Statement, and any other governmental approvals of the Registrant required in connection with this issue, in amendments to this Registration Statement, in each case together with translations of the same into the English language.
II-1
UNDERTAKINGS
The Registrant hereby undertakes:
| (a) | To file, during any period in which offers or sales are being made, a post-effective amendment to this Registration Statement: |
| | (i) | To include any prospectus required by Section 10(a)(3) of the Securities Act of 1933. |
| | (ii) | To reflect in the prospectus any facts or events arising after the effective date of this Registration Statement (or the most recent post-effective amendment hereof) which, individually or in the aggregate, represent a fundamental change in the information set forth in this Registration Statement. Notwithstanding the foregoing, any increase or decrease in volume of securities offered (if the total dollar value of securities offered would not exceed that which was registered) and any deviation from the low or high end of the estimated maximum offering range may be reflected in the form of prospectus filed with the Commission pursuant to Rule 424(b) if, in the aggregate, the changes in volume and price represent no more than a 20% change in the maximum aggregate offering price set forth in the “Calculation of Registration Fee” table in the effective registration statement. |
| | (iii) | To include any material information with respect to the plan of distribution not previously disclosed in this Registration Statement or any material change to such information in this Registration Statement. |
| (b) | That, for the purpose of determining any liability under the Securities Act of 1933, each such post-effective amendment that contains a form of prospectus shall be deemed to be a new registration statement relating to the securities offered therein, and the offering of such securities at that time shall be deemed to be the initial bona fide offering thereof. |
| (c) | To remove from registration by means of a post-effective amendment any of the securities being registered which remain unsold at the termination of the offering. |
| (d) | That, for purposes of determining any liability under the Securities Act of 1933, the information omitted from the form of prospectus filed as part of this Registration Statement in reliance upon Rule 430A and contained in a form of prospectus filed by the Registrant pursuant to Rule 424(b)(1) or (4) or 497(h) under the Securities Act of 1933 shall be deemed to be part of this Registration Statement as of the time it was declared effective. |
II-2
CONTENTS
This Registration Statement comprises:
| 2. | The cross-reference sheet between Schedule B of the Securities Act of 1933 and the prospectus; |
| 3. | Part I consisting of the prospectus; |
| 4. | Part II consisting of pages II-1 to II-6; and |
| 5. | The following exhibits: |
| | A. | Form of Underwriting Agreement(1) |
| | B. | Fiscal Agency Agreement, dated as of February 6, 2003, between the Republic of Peru and JPMorgan Chase Bank, as fiscal agent, principal paying agent and registrar, including form of Debt Security(2) |
| | B.1 | Amendment No. 1 to the Fiscal Agency Agreement, dated November 21, 2003, between the Republic of Peru and JPMorgan Chase Bank(3) |
| | B.2 | Amendment No. 2 to the Fiscal Agency Agreement, dated October 14, 2004, between the Republic of Peru and JPMorgan Chase Bank(4) |
| | C. | Form of Warrant Agreement, including form of Warrant* |
| | E. | Opinion of the General Counsel of the Ministry of Economy and Finance of the Republic of Peru, with respect to the legality of the securities |
| | F. | Opinion of Simpson Thacher & Bartlett LLP, special New York Counsel to the Republic of Peru, with respect to the legality of the securities |
| | G. | Consent of the General Counsel of the Ministry of Economy and Finance of the Republic of Peru (included in Exhibit E) |
| | H. | Consent of Simpson Thacher & Bartlett LLP (included in Exhibit F) |
| (1) | Incorporated by reference to Exhibit A to Peru’s Registration Statement on Schedule B (No. 333-110394). |
| (2) | Incorporated by reference to Exhibit B to Peru’s Registration Statement on Schedule B (No. 333-110394). |
| (3) | Incorporated by reference to Exhibit C.1 to Peru’s Registration Statement on Schedule B (No. 333-110394). |
| (4) | Incorporated by reference to Exhibit C.2 to Peru’s Registration Statement on Schedule B (No. 333-110394). |
| * | To be filed by amendment. |
II-3
SIGNATURE
Pursuant to the requirements of the Securities Act of 1933, as amended, the Registrant, the Republic of Peru, has duly caused this Registration Statement or amendment thereto to be signed on its behalf by the undersigned, thereunto duly authorized, in the City of Lima, Peru, on the 3rd day of August 2012.
| | |
| By: | | /s/ Carlos Adrián Linares Peñaloza |
| Name: | | Carlos Adrián Linares Peñaloza |
| Title: | | General Director of the General Directorate of Public Indebtedness and Treasury of the Ministry of Economy and Finance of Peru |
II-4
SIGNATURE OF AUTHORIZED REPRESENTATIVE
Pursuant to the requirements of the Securities Act of 1933, as amended, the undersigned, as duly authorized representative in the United States of the Registrant, has signed this Registration Statement or amendment thereto in the City of New York, New York, on the 3rd day of August 2012.
| | |
| By: | | /s/ Fortunato Quesada Seminario |
| Name: | | Fortunato Quesada Seminario |
| Title: | | Consul General of Peru, New York |
II-5
EXHIBIT INDEX
Exhibit
| | A. | Form of Underwriting Agreement(1) |
| | B. | Fiscal Agency Agreement, dated as of February 6, 2003, between the Republic of Peru and JPMorgan Chase Bank, as fiscal agent, principal paying agent and registrar, including form of Debt Security(2) |
| | B.1 | Amendment No. 1 to the Fiscal Agency Agreement, dated November 21, 2003, between the Republic of Peru and JPMorgan Chase Bank(3) |
| | B.2 | Amendment No. 2 to the Fiscal Agency Agreement, dated October 14, 2004, between the Republic of Peru and JPMorgan Chase Bank(4) |
| | C. | Form of Warrant Agreement, including form of Warrant* |
| | E. | Opinion of the General Counsel of the Ministry of Economy and Finance of the Republic of Peru, with respect to the legality of the securities |
| | F. | Opinion of Simpson Thacher & Bartlett LLP, special New York Counsel to the Republic of Peru, with respect to the legality of the securities |
| | G. | Consent of the General Counsel of the Ministry of Economy and Finance of the Republic of Peru (included in Exhibit E) |
| | H | Consent of Simpson Thacher & Bartlett LLP (included in Exhibit F) |
| (1) | Incorporated by reference to Exhibit A to Peru’s Registration Statement on Schedule B (No. 333-110394). |
| (2) | Incorporated by reference to Exhibit B to Peru’s Registration Statement on Schedule B (No. 333-110394). |
| (3) | Incorporated by reference to Exhibit C.1 to Peru’s Registration Statement on Schedule B (No. 333-110394). |
| (4) | Incorporated by reference to Exhibit C.2 to Peru’s Registration Statement on Schedule B (No. 333-110394). |
| * | To be filed by amendment. |
II-6