Exhibit 13
SELECTED FINANCIAL DATA
|
|
|
|
|
|
|
|
|
|
|
|
|
|
|
|
|
FISCAL YEARS ENDED NOVEMBER 30, |
| 2005 |
| 2004 |
| 2003 |
| 2002 |
| 2001 |
| |||||
(in thousands, except |
|
|
|
|
|
|
|
|
|
| ||||||
RESULTS |
|
|
|
|
|
|
|
|
|
|
|
|
|
|
|
|
Revenues, net of interest expense |
| $ | 7,410,794 |
| $ | 6,812,883 |
| $ | 5,994,491 |
| $ | 5,128,236 |
| $ | 4,907,035 |
|
Employee compensation and benefits |
|
| 3,553,216 |
|
| 3,253,862 |
|
| 2,880,695 |
|
| 2,508,197 |
|
| 2,528,852 |
|
Non-compensation expenses |
|
| 1,650,519 |
|
| 1,536,867 |
|
| 1,341,527 |
|
| 1,309,076 |
|
| 1,443,739 |
|
Total expenses |
|
| 5,203,735 |
|
| 4,790,729 |
|
| 4,222,222 |
|
| 3,817,273 |
|
| 3,972,591 |
|
Net income |
| $ | 1,462,177 |
| $ | 1,344,733 |
| $ | 1,156,406 |
| $ | 878,345 |
| $ | 618,692 |
|
Net income applicable to common shares |
| $ | 1,437,856 |
| $ | 1,316,661 |
| $ | 1,125,031 |
| $ | 842,739 |
| $ | 579,579 |
|
FINANCIAL POSITION |
|
|
|
|
|
|
|
|
|
|
|
|
|
| ||
Total assets |
| $ | 292,635,233 |
| $ | 255,949,894 |
| $ | 212,168,110 |
| $ | 184,854,423 |
| $ | 185,530,228 |
|
Long-term borrowings |
| $ | 43,489,616 |
| $ | 36,843,277 |
| $ | 29,430,465 |
| $ | 23,681,399 |
| $ | 23,429,054 |
|
Guaranteed Preferred Beneficial Interests in Company Subordinated Debt Securities(1) |
| $ | — |
| $ | — |
| $ | 562,500 |
| $ | 562,500 |
| $ | 762,500 |
|
Stockholders’ equity |
| $ | 10,791,432 |
| $ | 8,990,872 |
| $ | 7,470,088 |
| $ | 6,382,083 |
| $ | 5,628,527 |
|
COMMON SHARE DATA |
|
|
|
|
|
|
|
|
|
|
|
|
| |||
Basic earnings per share |
| $ | 11.42 |
| $ | 10.88 |
| $ | 9.44 |
| $ | 7.00 |
| $ | 4.49 |
|
Diluted earnings per share |
| $ | 10.31 |
| $ | 9.76 |
| $ | 8.52 |
| $ | 6.47 |
| $ | 4.27 |
|
Cash dividends declared per common share |
| $ | 1.00 |
| $ | 0.85 |
| $ | 0.74 |
| $ | 0.62 |
| $ | 0.60 |
|
Book value per common share |
| $ | 71.08 |
| $ | 59.13 |
| $ | 48.69 |
| $ | 39.94 |
| $ | 33.84 |
|
Common shares outstanding(2) |
|
| 146,431,767 |
|
| 144,484,099 |
|
| 142,369,836 |
|
| 145,591,496 |
|
| 146,465,210 |
|
FINANCIAL RATIOS |
|
|
|
|
|
|
|
|
|
|
|
|
|
| ||
Return on average common equity |
|
| 16.5 | % |
| 19.1 | % |
| 20.2 | % |
| 18.1 | % |
| 13.7 | % |
Profit margin(3) |
|
| 29.8 | % |
| 29.7 | % |
| 29.6 | % |
| 25.6 | % |
| 19.0 | % |
OTHER DATA(in billions, except employees) |
|
|
| |||||||||||||
Assets under management (in billions) |
| $ | 41.9 |
| $ | 37.8 |
| $ | 29.2 |
| $ | 24.0 |
| $ | 24.2 |
|
Average value-at-risk (in millions) |
| $ | 20.5 |
| $ | 15.8 |
| $ | 15.8 |
| $ | 16.5 |
| $ | 15.0 |
|
Employees |
|
| 11,843 |
|
| 10,961 |
|
| 10,532 |
|
| 10,574 |
|
| 10,452 |
|
|
|
(1) | In accordance with FIN No. 46 (R) the Company has deconsolidated Bear Stearns Capital Trust III effective beginning with the quarter ended February 29, 2004. As a result, the Debentures issued by the Company to Bear Stearns Capital Trust III are included within long-term borrowings. The $262.5 million of Preferred Securities issued by Capital Trust III is still outstanding, providing the funding for such Debentures. The Preferred Securities issued by Capital Trust III are no longer included in the Company’s Consolidated Statements of Financial Condition. As of November 30, 2003 and 2002, Guaranteed Preferred Beneficial Interests in Company Subordinated Debt Securities consists of $300 million of Preferred Securities issued by Bear Stearns Capital Trust II and $262.5 million of Preferred Securities issued by Bear Stearns Capital Trust III. As of November 30, 2001, Guaranteed Preferred Beneficial Interests in Company Subordinated Debt Securities consists of $200 million of Capital Securities issued by Bear Stearns Capital Trust I, $300 million of Preferred Securities issued by Bear Stearns Capital Trust II and $262.5 million of Preferred Securities issued by Bear Stearns Capital Trust III. |
|
|
(2) | Common shares outstanding include units issued under certain stock compensation plans, which will be distributed as shares of common stock. |
|
|
(3) | Represents the ratio of income before provision for income taxes to revenues, net of interest expense. |
Financial Report
Table of Contents
|
|
|
Management’s Discussion and Analysis of Financial Condition and Results of Operations |
| |
32 | ||
32 | ||
33 | ||
33 | ||
35 | ||
44 | ||
56 | ||
57 | ||
58 | ||
61 | ||
62 | ||
62 | ||
| ||
| ||
63 | ||
64 | ||
69 | ||
72 | ||
72 | ||
73 | ||
|
| |
Management’s Report on Internal Control over Financial Reporting | 74 | |
| ||
75 | ||
| ||
76 | ||
|
| |
Consolidated Financial Statements |
| |
77 | ||
78 | ||
79 | ||
80 | ||
|
| |
| ||
82 | ||
87 | ||
88 | ||
88 | ||
90 | ||
Variable Interest Entities and Mortgage Loan Special Purpose Entities | 93 | |
94 | ||
95 | ||
95 | ||
97 | ||
98 | ||
98 | ||
98 | ||
102 | ||
103 | ||
105 | ||
106 | ||
108 | ||
110 | ||
113 | ||
114 | ||
|
|
|
| ||
115 | ||
THE BEAR STEARNS COMPANIES INC.
MANAGEMENT’S DISCUSSION AND ANALYSIS OF FINANCIAL CONDITION
AND RESULTS OF OPERATIONS
The Bear Stearns Companies Inc. (the “Company”) is a holding company that through its broker-dealer and international bank subsidiaries, principally Bear, Stearns & Co. Inc. (“Bear Stearns”), Bear, Stearns Securities Corp. (“BSSC”), Bear, Stearns International Limited (“BSIL”) and Bear Stearns Bank plc (“BSB”), is a leading investment banking, securities and derivatives trading, clearance and brokerage firm serving corporations, governments, institutional and individual investors worldwide. BSSC, a subsidiary of Bear Stearns, provides professional and correspondent clearing services in addition to clearing and settling customer transactions and certain proprietary transactions of the Company. The Company also conducts significant activities through other wholly owned subsidiaries, including: Bear Stearns Global Lending Limited; Custodial Trust Company; Bear Stearns Financial Products Inc.; Bear Stearns Capital Markets Inc.; Bear Stearns Credit Products Inc.; Bear Stearns Forex Inc.; EMC Mortgage Corporation; and Bear Stearns Commercial Mortgage, Inc. The Company is primarily engaged in business as a securities broker-dealer operating in three principal segments: Capital Markets, Global Clearing Services and Wealth Management. As used in this report, the “Company” refers (unless the context requires otherwise) to The Bear Stearns Companies Inc. and its subsidiaries. Unless specifically noted otherwise, all references to fiscal 2005, 2004 and 2003 refer to the twelve months ended November 30, 2005, 2004 and 2003, respectively.
CERTAIN FACTORS AFFECTING RESULTS OF OPERATIONS
The Company’s principal business activities—investment banking, securities and derivatives sales and trading, clearance, brokerage and asset management—are, by their nature, highly competitive and subject to various risks, including volatile trading markets and fluctuations in the volume of market activity. Consequently, the Company’s net income and revenues have been, and are likely to continue to be, subject to wide fluctuations, reflecting the effect of many factors, including general economic conditions, securities market conditions, the level and volatility of interest rates and equity prices, competitive conditions, liquidity of global markets, international and regional political conditions, regulatory and legislative developments, monetary and fiscal policy, investor sentiment, availability and cost of capital, technological changes and events, outcome of legal proceedings, changes in currency values, inflation, credit ratings and the size, volume and timing of transactions.
These and other factors can affect the Company’s volume of new securities issuances, mergers and acquisitions and business restructurings; the stability and liquidity of securities and futures markets; and ability of issuers, other securities firms and counterparties to perform on their obligations. A decrease in the volume of new securities issuances, mergers and acquisitions or restructurings generally results in lower revenues from investment banking and, to a lesser extent, reduced principal transactions. A reduced volume of securities and futures transactions and reduced market liquidity generally results in lower revenues from principal transactions and commissions. Lower price levels for securities may result in a reduced volume of transactions, and may also result in losses from declines in the market value of securities held in proprietary trading and underwriting accounts. In periods of reduced sales and trading or investment banking activity, profitability may be adversely affected because certain expenses remain relatively fixed. The Company’s securities trading, derivatives, arbitrage, market-making, specialist, leveraged lending, leveraged buyout and underwriting activities are conducted on a principal basis and expose the Company to significant risk of loss. Such risks include market, counterparty credit and liquidity risks. For a discussion of how the Company seeks to manage risks, see the “Risk Management” and “Liquidity and Capital Resources” sections in this report.
Substantial legal liability or a significant regulatory action against the Company could have a material adverse effect or cause significant reputational harm to the Company, which in turn could seriously harm the Company’s business prospects. Firms in the financial services industry have been operating in a difficult regulatory environment. The Company faces significant legal risks in its businesses, and the volume of claims and amount of damages and penalties claimed in litigation and regulatory proceedings against financial institutions have been increasing.
32
MANAGEMENT’S DISCUSSION AND ANALYSIS
continued
Certain statements contained in this discussion are “forward-looking statements” within the meaning of the Private Securities Litigation Reform Act of 1995. Such forward-looking statements concerning management’s expectations, strategic objectives, business prospects, anticipated economic performance and financial condition and other similar matters are subject to risks and uncertainties, including those described in the preceding paragraph, which could cause actual results to differ materially from those discussed in the forward-looking statements. Forward-looking statements speak only as of the date of the document in which they are made. We disclaim any obligation or undertaking to provide any updates or revisions to any forward-looking statement to reflect any change in our expectations or any change in events, conditions or circumstances on which the forward-looking statement is based.
Summary of Results
A generally favorable operating environment characterized by an expanding US economy and active equity and fixed income markets provided a healthy climate for the Company’s businesses during fiscal 2005. Revenues, net of interest expense (“net revenues”), for the fiscal year ended November 30, 2005 increased 8.8% to $7.41 billion from $6.81 billion for the fiscal year ended November 30, 2004, while pre-tax earnings increased 9.1% during the same period. The pre-tax profit margin for fiscal 2005 increased slightly to 29.8%, compared with 29.7% for fiscal 2004. Return on average common equity was 16.5% for fiscal 2005, compared with 19.1% for fiscal 2004.
Capital Markets net revenues increased 5.8% to $5.64 billion for fiscal 2005, compared with $5.33 billion for fiscal 2004. Within the Capital Markets segment, institutional equities net revenues increased 31.5% to $1.41 billion for fiscal 2005 from $1.07 billion for fiscal 2004. Domestic and international equity sales and trading net revenues and equity derivatives net revenues increased in fiscal 2005, benefiting from improved market conditions and higher trading volumes. Risk arbitrage revenues also increased on higher announced mergers and acquisitions (“M&A”) volumes. Fixed income net revenues increased 2.0% to $3.25 billion for fiscal 2005 from $3.19 billion for fiscal 2004. Revenues derived from the Company’s credit product businesses, particularly the credit derivatives, leveraged finance and distressed debt areas, reached record levels. The interest rate product businesses also produced strong results, reflecting market share gains along with increased customer volumes attributable to increased interest rate volatility. The Company’s foreign exchange business, in particular, reached record levels during fiscal 2005. Mortgage-backed securities revenues, while still strong, declined modestly from the robust results achieved in fiscal 2004. Investment banking revenues decreased 8.6% to $980.5 million for fiscal 2005 from $1.07 billion for fiscal 2004, primarily reflecting a decrease in merchant banking revenues, partially offset by an increase in underwriting revenues.
Global Clearing Services net revenues increased 14.5% to $1.07 billion for fiscal 2005 from $932.4 million for fiscal 2004. An increase in average customer margin and short sale balances, reflecting improved US equity markets, contributed to an increase in net interest revenues, partially offsetting a decline in commission revenues.
Wealth Management net revenues increased 8.4% to $678.8 million in fiscal 2005 from $626.3 million in fiscal 2004, reflecting increased net interest revenues associated with higher margin balances and growth in fee-based assets in the Company’s private client services (“PCS”) business. Asset management revenues also increased during fiscal 2005, reflecting increased performance fees on proprietary hedge fund products and increased management fees on higher levels of traditional assets under management.
Business Environment
Fiscal 2005
The business environment during the Company’s fiscal year ended November 30, 2005 was generally favorable due to a combination of factors, including an expanding US economy, improved corporate profitability and low inflation.
33
MANAGEMENT’S DISCUSSION AND ANALYSIS
continued
Favorable labor reports and an active housing market provided ongoing support to economic activity in fiscal 2005. The unemployment rate dropped to 4.9% in August 2005, its lowest level since August 2001 and ended fiscal 2005 at 5.0%. However, rising energy prices continued to be a cause for concern throughout fiscal 2005, as the price of oil increased from a low of approximately $41 a barrel in December 2004 to a high of approximately $70 a barrel by the end of August 2005, affected by hurricane-related supply disruptions. Rising energy costs reinforced concerns by investors that the US economy would slow in the second half of fiscal 2005. However, the US economy remained resilient. A number of positive economic reports during the second half of fiscal 2005 and a pullback in oil prices to $57 a barrel in November fueled a year-end rally in the equity markets. The Federal Reserve Board (the “Fed”) met eight times during fiscal 2005 and raised the federal funds rate each time, in 25 basis point increments, from 2.00% to 4.00%, supported by gains in productivity, a pickup in job growth and rising consumer confidence.
Each of the major US equity indices increased during the fiscal year ended November 30, 2005. The Standard & Poor’s 500 Index (“S&P 500”), the Dow Jones Industrial Average (“DJIA”) and the Nasdaq Composite Index (“NASDAQ”) increased 6.4%, 3.6% and 6.5%, respectively. Average daily trading volume on the New York Stock Exchange (“NYSE”) and the Nasdaq increased 9.4% and 3.9%, respectively, compared with fiscal 2004. Industry-wide US-announced M&A volumes increased 52% while industry-wide US-completed M&A volumes increased 8%, compared with fiscal 2004. Total equity issuances including initial public offerings (“IPOs”) volumes declined 11% and 14%, respectively, compared with the levels reached during fiscal 2004.
Fixed income markets continued to be robust in fiscal 2005 despite a more challenging environment associated with higher short-term interest rates and a flattening yield curve. Long-term rates, as measured by the 10-year Treasury bond, remained relatively stable during fiscal 2005. At the close of fiscal 2005, the 10-year Treasury bond yield was 4.50%, compared with 4.36% on November 30, 2004. Mortgage-backed securities underwriting volumes continued to benefit from favorable market conditions. Agency collateralized mortgage obligation (“CMO”) volumes declined industry-wide from the levels reached during fiscal 2004, but were offset by an increase in non-agency mortgage-backed originations. The mortgage purchase index increased approximately 5%, compared with fiscal 2004, as continued low long-term interest rates fueled a strong home purchasing market.
Fiscal 2004
The business environment during the Company’s fiscal year ended November 30, 2004 was favorable due to a combination of factors, including a strengthening US economy, improved corporate profitability, low interest rates and low inflation. The US economy continued its expansion in fiscal 2004. Gross Domestic Product grew approximately 4%, the unemployment rate fell to 5.4% and inflation, despite a rise in oil prices from just under $30 a barrel in January to over $55 a barrel in October, remained below 3%. Strong consumer spending and low mortgage rates continued to fuel the economy during the first half of fiscal 2004. However, mixed economic indicators, including uneven job growth, raised concerns about the sustainability of an economic recovery. The Fed met four times during the first half of fiscal 2004 and each time left the federal funds rate unchanged at 1.00%. During the second half of the fiscal year, the Fed raised the federal funds rate four times, beginning with its June meeting, in 25 basis point increments, from 1.00% to 2.00%, citing the expectation that the US economy was poised to resume a stronger pace of economic expansion. The rate increases were consistent with the Fed’s position of taking a “measured” approach to monetary policy. While the increase in interest rates, along with weaker-than-expected job growth, surging oil prices and the uncertain presidential election were causes for concern during the latter half of fiscal 2004, the equity markets performed well, lifted by strong corporate profits and an increase in investor confidence. In addition, a sharp decline in oil prices from the high of $55 a barrel in late October to $46 a barrel by the end of November fueled a year-end rally in the major equity indices.
The major equity indices all increased during the fiscal year ended November 30, 2004. The S&P 500, the DJIA and the NASDAQ increased 10.9%, 6.6% and 7.0%, respectively. Average daily trading volume on the NYSE and the Nasdaq increased 3.4% and 7.7%, respectively, compared with fiscal 2003. Improved equity market conditions served
34
MANAGEMENT’S DISCUSSION AND ANALYSIS
continued
to increase the volume of US IPOs and secondary offerings by 307% and 28%, respectively, during fiscal 2004 compared with fiscal 2003, and the rise in equity valuations and strengthening cash positions enabled companies to consider strategic acquisitions. Industry-wide US-announced and completed M&A volumes increased 30% and 72%, respectively, compared with fiscal 2003.
Fixed income markets continued to be robust in fiscal 2004, benefiting from continued improvement in corporate credit spreads and low interest rates. Investment grade and high yield origination volumes rose as issuers continued to take advantage of low borrowing rates. Long-term rates, as measured by the 10-year Treasury bond, experienced volatility during the year, but remained at historically low levels. On an intra-day basis, the 10-year Treasury bond yield climbed from a low of 3.65% to a high of 4.90% during fiscal 2004 and closed at 4.36% on November 30, 2004, compared with 4.32% on November 30, 2003. Mortgage-backed securities underwriting volumes continued to benefit from favorable market conditions despite the drop in residential mortgage refinancings. Agency CMO volumes declined during fiscal 2004, reflecting the decline in refinancing volumes but were offset by an increase in asset-backed and non-agency mortgage-backed originations. The mortgage purchase index increased approximately 11% during fiscal 2004, reflecting the low level of interest rates and strong home purchasing market.
Firmwide Results
The following table sets forth an overview of the Company’s financial results for the fiscal years ended November 30, 2005, 2004 and 2003:
|
|
|
|
|
|
|
|
|
|
|
|
|
|
|
|
|
|
|
| ||||||||||||||||||
(in thousands, except per share amounts, pre-tax profit margin and return on average common equity) |
|
|
|
|
|
|
|
|
|
|
|
|
|
|
|
|
|
|
|
|
|
|
|
|
|
|
|
| % Increase |
| |||||||
| 2005 |
| 2004 |
| 2003 |
| 2005/2004 |
| 2004/2003 |
| ||||||||
| ||||||||||||||||||
Revenues, net of interest expense |
|
| $ | 7,410,794 |
|
| $ | 6,812,883 |
| $ | 5,994,491 |
|
| 8.8 | % |
| 13.7 | % |
Income before provision for income tax |
| $ | 2,207,059 |
| $ | 2,022,154 |
| $ | 1,772,269 |
|
| 9.1 | % |
| 14.1 | % | ||
Net income |
| $ | 1,462,177 |
| $ | 1,344,733 |
| $ | 1,156,406 |
|
| 8.7 | % |
| 16.3 | % | ||
Diluted earnings per share |
| $ | 10.31 |
| $ | 9.76 |
| $ | 8.52 |
|
| 5.6 | % |
| 14.6 | % | ||
Pre-tax profit margin |
|
| 29.8 | % |
| 29.7 | % |
| 29.6 | % |
|
|
|
|
|
| ||
Return on average common equity |
|
| 16.5 | % |
| 19.1 | % |
| 20.2 | % |
|
|
|
|
|
| ||
| ||||||||||||||||||
The Company reported net income of $1.46 billion, or $10.31 per share (diluted), for fiscal 2005, which represented an increase of 8.7% from $1.34 billion, and 5.6% from $9.76 per share (diluted), for fiscal 2004. The Company reported net income of $1.16 billion for fiscal 2003, or $8.52 per share (diluted).
Fiscal 2005 versus Fiscal 2004 Net revenues increased 8.8% to $7.41 billion in fiscal 2005 from $6.81 billion in fiscal 2004 due to increases in all revenue categories, including net interest revenues, principal transactions revenues, commission revenues, investment banking revenues and asset management and other revenues.
35
MANAGEMENT’S DISCUSSION AND ANALYSIS
continued
The Company’s commission revenues by reporting category for the fiscal years ended November 30, 2005, 2004 and 2003 were as follows:
|
|
|
|
|
|
|
|
|
|
|
|
|
|
|
|
|
|
|
| ||||||||||||||||||
|
|
|
|
|
|
|
|
|
|
|
|
| % Increase (Decrease) |
| ||||
|
| 2005 |
| 2004 |
| 2003 |
| 2005/2004 |
| 2004/2003 |
| |||||||
| ||||||||||||||||||
(in thousands) |
|
|
|
|
|
|
|
|
|
|
|
|
|
|
|
|
|
|
| ||||||||||||||||||
Institutional |
|
| $ | 673,712 |
|
| $ | 619,241 |
| $ | 537,505 |
|
| 8.8 | % |
| 15.2 | % |
Clearance |
|
| 260,889 |
|
| 303,194 |
|
| 312,550 |
|
| (14.0 | %) |
| (3.0 | %) | ||
Retail & other |
|
| 265,853 |
|
| 255,639 |
|
| 227,871 |
|
| 4.0 | % |
| 12.2 | % | ||
| ||||||||||||||||||
Total commissions |
|
| $ | 1,200,454 |
|
| $ | 1,178,074 |
| $ | 1,077,926 |
|
| 1.9 | % |
| 9.3 | % |
| ||||||||||||||||||
Commission revenues in fiscal 2005 increased 1.9% to $1.20 billion from $1.18 billion in fiscal 2004. Institutional commissions increased 8.8% to $673.7 million from $619.2 million in fiscal 2004 due to increased average daily trading volume on the NYSE and market share improvement. Clearance commissions decreased 14.0% to $260.9 million in fiscal 2005 from $303.2 million in fiscal 2004, primarily reflecting lower trading volumes and rates from prime brokerage clients. Retail and other commissions increased 4.0% to $265.9 million in fiscal 2005 from $255.6 million in fiscal 2004 due to an increase in retail customer activity levels resulting from improved equity market conditions, which were driven in part by improved consumer confidence and a strengthened labor market.
The Company’s principal transactions revenues by reporting category for the fiscal years ended November 30, 2005, 2004 and 2003 were as follows:
|
|
|
|
|
|
|
|
|
|
|
|
|
|
|
|
|
|
|
| ||||||||||||||||||
|
|
|
|
|
|
|
|
|
|
|
|
| % Increase (Decrease) |
| ||||
|
| 2005 |
| 2004 |
| 2003 |
| 2005/2004 |
| 2004/2003 |
| |||||||
| ||||||||||||||||||
(in thousands) |
|
|
|
|
|
|
|
|
|
|
|
|
|
|
|
|
|
|
| ||||||||||||||||||
Fixed income |
|
| $ | 2,271,084 |
|
| $ | 2,586,772 |
| $ | 2,481,902 |
|
| (12.2 | %) |
| 4.2 | % |
Equities |
|
| 459,185 |
|
| 376,611 |
|
| 248,399 |
|
| 21.9 | % |
| 51.6 | % | ||
Derivative financial instruments |
|
| 1,105,748 |
|
| 632,212 |
|
| 578,005 |
|
| 74.9 | % |
| 9.4 | % | ||
| ||||||||||||||||||
Total principal transactions |
|
| $ | 3,836,017 |
|
| $ | 3,595,595 |
| $ | 3,308,306 |
|
| 6.7 | % |
| 8.7 | % |
| ||||||||||||||||||
Revenues from principal transactions in fiscal 2005 increased 6.7% to $3.84 billion from $3.60 billion in fiscal 2004. Fixed income revenues decreased 12.2% to $2.27 billion for fiscal 2005 from $2.59 billion for fiscal 2004, primarily attributable to a decrease in net revenues in the mortgage-backed securities business, which was partially offset by an increase in net revenues in the Company’s leveraged finance and distressed debt areas. Mortgage-backed securities origination revenues declined from the robust levels of fiscal 2004 due to a flattening yield curve, shifting market conditions and changes in product mix. A decline in agency CMO volumes was offset by an increase in non-agency mortgage originations. Secondary mortgage-backed securities revenues also declined from fiscal 2004 as an increase in hedging costs resulting from more volatile market conditions offset increased customer volumes. The net revenues from leveraged finance increased as acquisition-related financing rose on increased M&A activities and distressed debt revenues increased as credit spreads tightened and customer activity increased. Revenues derived from the Company’s equities activities increased 21.9% to $459.2 million in fiscal 2005 from $376.6 million in fiscal 2004, due primarily to principal gains of $75.6 million associated with the Company’s investment in the International Securities Exchange (“ISE”). In addition, equity revenues from the Company’s international equity sales and trading business increased which benefited from higher average daily trading volumes and increased market share. Revenues from derivative financial instruments increased 74.9% to $1.11 billion in fiscal 2005 from $632.2 million in fiscal 2004 due to across-the-board increases in revenues in the equity, credit and fixed income derivatives areas as a result of increased customer volume.
36
MANAGEMENT’S DISCUSSION AND ANALYSIS
continued
The Company’s investment banking revenues by reporting category for the fiscal years ended November 30, 2005, 2004 and 2003 were as follows:
|
|
|
|
|
|
|
|
|
|
|
|
|
|
|
| ||||||||||||||
|
|
|
|
|
|
|
|
|
|
| % Increase (Decrease) |
| ||
|
| 2005 |
| 2004 |
| 2003 |
| 2005/2004 |
| 2004/2003 |
| |||
| ||||||||||||||
(in thousands) |
|
|
|
|
|
|
|
|
|
|
|
|
|
|
| ||||||||||||||
Underwriting |
| $ | 470,910 |
| $ | 433,437 |
| $ | 340,360 |
| 8.6 | % | 27.3 | % |
Advisory and other fees |
|
| 412,689 |
|
| 350,727 |
|
| 331,735 |
| 17.7 | % | 5.7 | % |
Merchant banking |
|
| 153,614 |
|
| 246,887 |
|
| 181,199 |
| (37.8 | %) | 36.3 | % |
| ||||||||||||||
Total investment banking |
| $ | 1,037,213 |
| $ | 1,031,051 |
| $ | 853,294 |
| 0.6 | % | 20.8 | % |
| ||||||||||||||
Note: In fiscal 2005, the Company changed the income statement presentation of certain servicing fees and asset-based retail investor advisory fees. All net servicing fees are included in the investment banking line on the Consolidated Statements of Income. Asset-based retail investor advisory fees are included in the asset management and other income line on the Consolidated Statements of Income. These reclassifications were made to prior year amounts to conform to the current year’s presentation.
Investment banking revenues increased slightly to $1.04 billion in fiscal 2005 from $1.03 billion in fiscal 2004. Underwriting revenues increased 8.6% to $470.9 million in fiscal 2005 from $433.4 million in fiscal 2004, primarily resulting from higher levels of equity underwriting revenues reflecting strengthening market conditions and increased new issue activity. Partially offsetting these increases was a decline in high yield underwriting revenues on lower new issue volumes. Advisory and other fees for fiscal 2005 increased 17.7% to $412.7 million from $350.7 million for fiscal 2004 as M&A fees rose resulting from an increase in completed M&A assignments during fiscal 2005. In addition, mortgage servicing revenues increased during fiscal 2005 reflecting significant growth in loan servicing volumes. Merchant banking revenues decreased 37.8% to $153.6 million for fiscal 2005 from $246.9 million for fiscal 2004. Merchant banking revenues include realized and unrealized investment gains and performance fees on managed merchant banking funds. Fiscal 2004 includes merchant banking gains of approximately $163 million related to the Company’s investment in New York & Company, Inc.
Net interest revenues (interest and dividends revenue less interest expense) increased 36.3% to $965.4 million in fiscal 2005 from $708.3 million in fiscal 2004. The increase in net interest revenues was primarily attributable to higher levels of customer interest-bearing balances and improved net interest margins. Average customer margin debt balances increased 21.9% to $58.5 billion in fiscal 2005 from $48.0 billion in fiscal 2004. Average customer short balances increased 10.6% to $84.4 billion in fiscal 2005 from $76.3 billion in fiscal 2004 and average securities borrowed balances decreased 1.6% to $62.8 billion in fiscal 2005 from $63.8 billion in fiscal 2004.
Asset management and other revenues increased 24.0% to $371.7 million for fiscal 2005 from $299.9 million for fiscal 2004, primarily reflecting increased performance fees on proprietary hedge fund products. Management fees also increased during fiscal 2005 on higher levels of traditional assets under management. PCS fees increased as well due to higher levels of fee-based assets.
Fiscal 2004 versus Fiscal 2003 Net revenues increased 13.7% to $6.81 billion in fiscal 2004 from $5.99 billion in fiscal 2003 due to increases in all revenue categories, including investment banking revenues, principal transactions revenues, net interest revenues and commission revenues.
Commission revenues in fiscal 2004 increased 9.3% to $1.18 billion from $1.08 billion in fiscal 2003. Institutional commissions increased 15.2% to $619.2 million from $537.5 million, primarily due to the impact of the consolidation of Bear Wagner Specialists LLC commencing in the first quarter of 2004, as well as increased trading volumes and market share gains in US-listed securities. Clearance commissions decreased 3.0% to $303.2 million from $312.6 million, reflecting lower trading volumes from prime brokerage clients. Retail and other commissions were $255.6
37
MANAGEMENT’S DISCUSSION AND ANALYSIS
continued
million in fiscal 2004, up 12.2% compared with $227.9 million in fiscal 2003 due to an increase in retail customer activity levels resulting from improved equity market conditions.
Revenues from principal transactions in fiscal 2004 increased 8.7% to $3.60 billion from $3.31 billion in fiscal 2003. Fixed income revenues increased 4.2% to $2.59 billion from $2.48 billion in fiscal 2003, primarily reflecting increased net revenues achieved in the mortgage-backed securities business, with strong performance across many sectors, particularly in the adjustable-rate mortgage securities, whole loan and commercial securitization businesses. Revenues related to the high yield business, particularly leveraged finance and distressed debt, also increased as high yield credit spreads continued to tighten and customer activity increased. These increases were offset by reduced net revenues from the corporate bonds and government bonds areas, which were adversely affected by reduced volumes. Revenues derived from equities activities increased 51.6% to $376.6 million during fiscal 2004 from $248.4 million in fiscal 2003, primarily due to the impact of the consolidation of Bear Wagner Specialists LLC beginning in the first quarter of 2004. The international equity sales and trading area increased as a result of higher average daily trading volumes. The risk arbitrage area also performed well on increased announced and completed M&A activity. These results were substantially offset by a decrease in the convertible arbitrage area due to lower equity market volatility. Revenues from derivative financial instruments increased 9.4% to $632.2 million in fiscal 2004 from $578.0 million in fiscal 2003, primarily due to significant increases in the fixed income derivatives and foreign exchange areas as a result of increased customer volume. Such increases were partially offset by a decline in the equity derivatives area due to low levels of equity market volatility.
Investment banking revenues increased 20.8% to $1.03 billion in fiscal 2004 from $853.3 million in fiscal 2003. Underwriting revenues increased 27.3% to $433.4 million in fiscal 2004 from $340.4 million in fiscal 2003, reflecting a significant increase in the volume of both equity and high yield new issue activity. These increases were partially offset by reduced municipal underwriting revenues, reflecting the impact of lower issuance levels. Advisory and other fees in fiscal 2004 increased 5.7% to $350.7 million from $331.7 million in fiscal 2003, reflecting increased completed M&A activity. Merchant banking revenues increased 36.3% to $246.9 million in fiscal 2004, compared with $181.2 million in fiscal 2003. Merchant banking revenues include realized and unrealized investment gains and performance fees on managed merchant banking funds. The increase in merchant banking revenues in fiscal 2004 reflects increased realized and unrealized gains on investments and performance fees on the Company’s merchant banking portfolio.
Net interest revenues (interest and dividend revenue less interest expense) increased 27.8% to $708.3 million in fiscal 2004 from $554.4 million for fiscal 2003. The increase in net interest revenues was primarily attributable to higher levels of customer interest-bearing balances, reflecting improved US equity market conditions and improved net financing margins. Average customer margin debt balances increased 19.1% to $48.0 billion in fiscal 2004 from $40.3 billion in fiscal 2003. Average customer short balances increased 18.7% to $76.3 billion in fiscal 2004 from $64.3 billion in fiscal 2003 and average securities borrowed balances increased 20.4% to $63.8 billion in fiscal 2004 from $53.0 billion in fiscal 2003.
Asset management and other revenues increased 49.5% to $299.9 million for fiscal 2004 from $200.5 million for fiscal 2003. This increase was largely due to higher levels of fee income from PCS attributable to higher fee-based assets as well as higher management fees attributable to increased assets under management and improved performance fees on alternative investment products. The increase also includes approximately $22 million of revenues associated with the sale of the Company’s mutual fund business to Dreyfus.
38
MANAGEMENT’S DISCUSSION AND ANALYSIS
continued
Non-Interest Expenses
The Company’s non-interest expenses for the fiscal years ended November 30, 2005, 2004 and 2003 were as follows:
|
|
|
|
|
|
|
|
|
|
|
|
|
|
|
|
|
| ||||||||||||||||
|
|
|
|
|
|
|
|
|
|
| % Increase (Decrease) |
| ||||
|
| 2005 |
| 2004 |
| 2003 |
| 2005/2004 |
| 2004/2003 |
| |||||
| ||||||||||||||||
(in thousands) |
|
|
|
|
|
|
|
|
|
|
|
|
|
|
|
|
| ||||||||||||||||
Employee compensation and benefits |
| $ | 3,553,216 |
| $ | 3,253,862 |
| $ | 2,880,695 |
|
| 9.2 | % |
| 13.0 | % |
Floor brokerage, exchange and clearance fees |
|
| 221,553 |
|
| 230,652 |
|
| 180,548 |
|
| (3.9 | %) |
| 27.8 | % |
Communications and technology |
|
| 401,673 |
|
| 369,176 |
|
| 365,317 |
|
| 8.8 | % |
| 1.1 | % |
Occupancy |
|
| 167,825 |
|
| 141,916 |
|
| 137,778 |
|
| 18.3 | % |
| 3.0 | % |
Advertising and market development |
|
| 126,678 |
|
| 113,800 |
|
| 106,506 |
|
| 11.3 | % |
| 6.8 | % |
Professional fees |
|
| 229,198 |
|
| 197,086 |
|
| 133,304 |
|
| 16.3 | % |
| 47.8 | % |
Other expenses |
|
| 503,592 |
|
| 484,237 |
|
| 418,074 |
|
| 4.0 | % |
| 15.8 | % |
| ||||||||||||||||
Total non-interest expenses |
| $ | 5,203,735 |
| $ | 4,790,729 |
| $ | 4,222,222 |
|
| 8.6 | % |
| 13.5 | % |
| ||||||||||||||||
Fiscal 2005 versus Fiscal 2004 Employee compensation and benefits includes the cost of salaries and benefits and incentive compensation, including restricted stock and option awards. Employee compensation and benefits increased 9.2% to $3.55 billion for fiscal 2005 from $3.25 billion for fiscal 2004, primarily due to higher discretionary compensation associated with the increase in net revenues. Employee compensation and benefits as a percentage of net revenues was 47.9% for fiscal 2005, compared with 47.8% for fiscal 2004. Full-time employees increased to 11,843 at November 30, 2005 from 10,961 at November 30, 2004.
Non-compensation expenses increased 7.4% to $1.65 billion for fiscal 2005 from $1.54 billion for fiscal 2004. Non-compensation expenses as a percentage of net revenues decreased to 22.3% for fiscal 2005, compared with 22.6% for fiscal 2004. The increase in non-compensation-related costs compared with fiscal 2004 was principally related to increased communications and technology costs, occupancy costs and professional fees. Communications and technology costs increased 8.8% as increased headcount resulted in higher voice and market data-related costs. Occupancy costs increased 18.3% to $167.8 million for fiscal 2005, reflecting additional office space requirements and higher leasing costs associated with the Company’s headquarters building at 383 Madison Avenue in New York City. Professional fees increased 16.3% to $229.2 million in fiscal 2005 from $197.1 million in fiscal 2004 attributable to higher levels of legal fees, temporary help and employment agency fees. Other expenses increased $19.4 million, or 4.0%, in fiscal 2005, principally due to an increase in litigation-related costs. Partially offsetting these increases was a decrease in costs related to the Capital Accumulation Plan for Senior Managing Directors, as amended (“CAP Plan”). CAP Plan-related costs decreased to $144.0 million for fiscal 2005 from $176.0 million in fiscal 2004 due to fewer CAP Plan units outstanding. The Company achieved a pre-tax profit margin of 29.8% for fiscal 2005, up slightly from 29.7% for fiscal 2004.
On December 15, 2005, the Company announced that an offer of settlement had been submitted to the Securities and Exchange Commission (“SEC”) and the NYSE to resolve the previously disclosed investigations relating to mutual fund trading. The settlement offer, which was negotiated with the staffs of the SEC and the NYSE and will be recommended by them, is subject to approval by the respective regulators. Terms include a payment of $250 million and retention of independent consultants to review aspects of its mutual fund trading and global clearing operations. At November 30, 2005, the Company was fully reserved for this settlement. In each of fiscal 2005 and 2004, the Company incurred approximately $120 million in professional fees and litigation charges associated with mutual fund trading matters.
The Company’s effective tax rate increased to 33.75% for fiscal 2005, compared with 33.50% for fiscal 2004.
39
MANAGEMENT’S DISCUSSION AND ANALYSIS
continued
Fiscal 2004 versus Fiscal 2003 Employee compensation and benefits for fiscal 2004 was $3.25 billion, up 13.0% from $2.88 billion for fiscal 2003, primarily due to higher discretionary compensation associated with the increase in net revenues. Employee compensation and benefits as a percentage of net revenues was 47.8% for fiscal 2004, compared with 48.1% for fiscal 2003. Full-time employees increased to 10,961 at November 30, 2004 from 10,532 at November 30, 2003.
Non-compensation expenses increased 14.6% to $1.54 billion for fiscal 2004 from $1.34 billion for fiscal 2003. Non-compensation expenses as a percentage of net revenues increased slightly to 22.6% for fiscal 2004, compared with 22.4% for fiscal 2003. The increase in non-compensation expenses of 14.6%, when compared with the prior year, primarily reflects the consolidation of Bear Wagner Specialists LLC beginning in the first quarter of 2004. Excluding the impact of the consolidation of Bear Wagner Specialists LLC, non-compensation expenses increased 7.5% to $1.44 billion in the 2004 period, reflecting increases in legal and litigation-related costs (included in other expenses), professional fees and floor brokerage, exchange and clearance fees. CAP Plan-related costs (included in other expenses) were $176.0 million for fiscal 2004, a decrease of 8.8% when compared with $193.0 million in fiscal 2003, reflecting a decline in the aggregate number of CAP units outstanding when compared with fiscal 2003. The Company achieved a pre-tax profit margin of 29.7% for fiscal 2004 versus 29.6% for fiscal 2003.
The Company’s effective tax rate decreased to 33.50% for fiscal 2004, compared with 34.75% for fiscal 2003.
BUSINESS SEGMENTS
The remainder of “Results of Operations” is presented on a business segment basis. The Company’s three business segments—Capital Markets, Global Clearing Services and Wealth Management—are analyzed separately due to the distinct nature of the products they provide and the clients they serve. Certain Capital Markets products are distributed by the Wealth Management and Global Clearing Services distribution networks, with the related revenues of such intersegment services allocated to the respective segments.
The following segment operating results exclude certain unallocated revenues (predominantly interest) as well as certain corporate administrative functions, such as certain legal costs and costs related to the CAP Plan. See Note 19, “Segment and Geographic Area Data,” in the Notes to Consolidated Financial Statements for complete segment information.
Capital Markets
|
|
|
|
|
|
|
|
|
|
|
|
| ||||
| ||||||||||||||||
|
|
|
|
|
|
|
|
|
|
| % Increase (Decrease) |
| ||||
|
| 2005 |
| 2004 |
| 2003 |
| 2005/2004 |
| 2004/2003 |
| |||||
| ||||||||||||||||
(in thousands) |
|
|
|
|
|
|
|
|
|
|
|
|
|
|
|
|
| ||||||||||||||||
Net revenues |
|
|
|
|
|
|
|
|
|
|
|
|
|
|
|
|
Institutional equities |
| $ | 1,409,603 |
| $ | 1,071,609 |
| $ | 932,567 |
|
| 31.5 | % |
| 14.9 | % |
Fixed income |
|
| 3,251,333 |
|
| 3,186,741 |
|
| 2,972,192 |
|
| 2.0 | % |
| 7.2 | % |
Investment banking |
|
| 980,459 |
|
| 1,072,770 |
|
| 914,558 |
|
| (8.6 | %) |
| 17.3 | % |
| ||||||||||||||||
Total net revenues |
| $ | 5,641,395 |
| $ | 5,331,120 |
| $ | 4,819,317 |
|
| 5.8 | % |
| 10.6 | % |
Pre-tax income |
| $ | 1,969,564 |
| $ | 1,980,513 |
| $ | 1,924,071 |
|
| (0.6 | %) |
| 2.9 | % |
| ||||||||||||||||
Note: In fiscal 2005, the Company reclassified certain servicing fees within the Capital Markets segment from investment banking to fixed income. The reclassification was made to prior year amounts to conform to the current year’s presentation.
The Capital Markets segment comprises the institutional equities, fixed income and investment banking areas. The Capital Markets segment operates as a single integrated unit that provides the sales, trading and origination effort for
40
MANAGEMENT’S DISCUSSION AND ANALYSIS
continued
various fixed income, equity and advisory products and services. Each of the three businesses work in tandem to deliver these services to institutional and corporate clients.
Institutional equities consists of sales, trading and research in areas such as domestic and international equities, block trading, convertible bonds, over-the-counter equities, equity derivatives, risk and convertible arbitrage and through a majority-owned joint venture, specialist activities on the NYSE, American Stock Exchange (“AMEX”) and ISE. Fixed income includes sales, trading and research provided to institutional clients across a variety of products such as mortgage- and asset-backed securities, corporate and government bonds, municipal bonds, high yield products, foreign exchange and interest rate and credit derivatives. Investment banking provides services in capital raising, strategic advice, mergers and acquisitions and merchant banking. Capital raising encompasses the Company’s underwriting of equity, investment grade, municipal and high yield debt products.
Fiscal 2005 versus Fiscal 2004 Net revenues for Capital Markets increased 5.8% to $5.64 billion for fiscal 2005, compared with $5.33 billion for fiscal 2004. Pre-tax income for Capital Markets decreased slightly to $1.97 billion for fiscal 2005 from $1.98 billion for fiscal 2004. Pre-tax profit margin was 34.9% for fiscal 2005, compared with 37.2% for fiscal 2004.
Institutional equities net revenues for fiscal 2005 increased 31.5% to $1.41 billion from $1.07 billion for fiscal 2004. Net revenues from domestic and international institutional equities activities increased, reflecting higher customer trading volumes. Market share gains in Europe and improved Asian equities results contributed to an increase in net revenues from international equities activities in fiscal 2005. Risk arbitrage revenues increased during fiscal 2005 on higher announced M&A volumes and market share gains. Equity derivatives revenues also increased significantly during fiscal 2005 benefiting from improved market conditions and increased customer activity. Fiscal 2005 also includes principal gains of $63.3 million associated with the Company’s investment in the ISE. Partially offsetting these increases was a decline in net revenues from NYSE specialist activities during fiscal 2005, reflecting lower market volatility.
Fixed income net revenues increased 2.0% to $3.25 billion for fiscal 2005 from $3.19 billion for fiscal 2004, primarily reflecting strong results from the Company’s high yield business, particularly the leveraged finance and distressed debt areas. Credit derivatives net revenues increased during fiscal 2005 on improved customer volumes together with market share gains. In addition, net revenues from the Company’s interest rate business increased significantly on record foreign exchange net revenues. During fiscal 2005, the Company maintained its industry-leading position in underwriting adjustable-rate mortgages and non-conforming fixed-rate mortgages. Mortgage-backed securities revenues declined from the robust levels of fiscal 2004 due to a flattening yield curve, shifting market conditions and changes in product mix. Secondary mortgage-backed securities revenues also declined from fiscal 2004 as an increase in hedging costs resulting from volatile market conditions offset increased customer volumes.
Investment banking revenues decreased 8.6% to $980.5 million for fiscal 2005 from $1.07 billion for fiscal 2004. Underwriting revenues increased 2.4% to $532.0 million for fiscal 2005 from $519.7 million for fiscal 2004. Higher levels of equity underwriting revenues during fiscal 2005 were partially offset by lower levels of high yield underwriting revenues. Advisory and other fees for fiscal 2005 decreased 3.7% to $294.9 million from $306.2 million for fiscal 2004. Merchant banking revenues decreased 37.8% to $153.6 million for fiscal 2005 from $246.9 million for fiscal 2004. Merchant banking revenues include realized and unrealized investment gains and performance fees on managed merchant banking funds. Fiscal 2004 included merchant banking gains related to the Company’s investment in New York & Company, Inc.
Fiscal 2004 versus Fiscal 2003 Net revenues for Capital Markets were $5.33 billion in fiscal 2004, an increase of 10.6% from $4.82 billion in fiscal 2003. Pre-tax income for Capital Markets was $1.98 billion in fiscal 2004, an
41
MANAGEMENT’S DISCUSSION AND ANALYSIS
continued
increase of 2.9% from $1.92 billion in fiscal 2003. Pre-tax profit margin was 37.2% in fiscal 2004, compared with 39.9% for fiscal 2003.
Institutional equities net revenues for fiscal 2004 increased 14.9% to $1.07 billion from $932.6 million for fiscal 2003. Included within the Company’s institutional equities revenues for fiscal 2004 are the revenues of Bear Wagner Specialists LLC. These results, which were consolidated beginning with the first quarter of 2004, resulted in an increase in net revenues from specialist activities of approximately $164 million over fiscal 2003. International equity sales and trading net revenues increased, reflecting increased customer activity, offset by declines in the equity derivatives and convertible arbitrage areas due to lower equity market volatility.
Fixed income net revenues increased 7.2% to $3.19 billion for fiscal 2004 from $2.97 billion for fiscal 2003, primarily reflecting strong results from the Company’s mortgage-backed securities and interest rate product areas. In particular, mortgage-backed securities, interest rate derivatives and foreign exchange net revenues increased during fiscal 2004 when compared with the prior year. Despite the decline in overall mortgage origination volume caused by the increase in interest rates for fixed-rate residential 30-year mortgage loans, adjustable-rate mortgage volumes increased significantly as consumers shifted demand to lower interest rate products. During fiscal 2004, the Company’s industry-leading positions in underwriting adjustable-rate mortgages and non-conforming fixed-rate mortgages resulted in its being the leading underwriter of mortgage-backed securities offerings. An increase in secondary trading activity also contributed to the strong net revenues in the mortgage-backed securities business. The strong results delivered by the interest rate derivatives and foreign exchange businesses reflected increased customer volumes. These results were partially offset by a decrease in net revenues in the Company’s corporate and government bonds and credit derivatives businesses from the strong results they achieved in fiscal 2003.
Investment banking revenues increased 17.3% to $1.07 billion in fiscal 2004 from $914.6 million in fiscal 2003. Underwriting revenues increased 20.3% to $519.7 million in fiscal 2004 from $431.9 million in fiscal 2003, reflecting an increase in equity and high yield underwriting revenues on strong new issue activity. These increases were partially offset by reduced municipal underwriting revenues, reflecting the impact of lower issuance levels. Advisory services revenues in fiscal 2004 increased 1.6% to $306.2 million from $301.5 million in fiscal 2003 due to higher levels of completed US M&A activity. Merchant banking revenues increased 36.3% to $246.9 million in fiscal 2004, reflecting increased realized and unrealized gains on investments and performance fees on the Company’s merchant banking portfolio.
Global Clearing Services
|
|
|
|
|
|
|
|
|
|
|
|
|
|
|
|
|
|
| |||||||||||||||||
|
|
|
|
|
|
|
|
|
|
|
| % Increase |
| ||||
|
| 2005 |
|
| 2004 |
| 2003 |
| 2005/2004 |
| 2004/2003 |
| |||||
| |||||||||||||||||
(in thousands) |
|
|
|
|
|
|
|
|
|
|
|
|
|
|
|
|
|
| |||||||||||||||||
Net revenues |
| $ | 1,067,985 |
|
| $ | 932,416 |
| $ | 784,072 |
|
| 14.5 | % |
| 18.9 | % |
Pre-tax income |
| $ | 526,148 |
|
| $ | 404,312 |
| $ | 245,531 |
|
| 30.1 | % |
| 64.7 | % |
| |||||||||||||||||
The Global Clearing Services segment provides execution, clearing, margin lending and securities borrowing to facilitate customer short sales to clearing clients worldwide. Prime brokerage clients include hedge funds and clients of money managers, short sellers, arbitrageurs and other professional investors. Fully disclosed clients engage in either the retail or institutional brokerage business. At November 30, 2005 and 2004, the Company held approximately $258.1 billion and $247.5 billion, respectively, in equity in Global Clearing Services client accounts.
Fiscal 2005 versus Fiscal 2004Net revenues for Global Clearing Services increased 14.5% to $1.07 billion for fiscal 2005 from $932.4 million for fiscal 2004. Net interest revenues increased 27.6% to $777.5 million for fiscal 2005 from $609.3 million for fiscal 2004, primarily reflecting increased average customer margin and short sale balances from prime brokerage and fully disclosed clearance clients due to improving US equity market conditions. These results
42
MANAGEMENT’S DISCUSSION AND ANALYSIS
continued
were partially offset by a decline in commission revenues of 14.0% to $260.9 million for fiscal 2005 from $303.2 million for fiscal 2004, reflecting reduced trading volumes and rates from prime brokerage clients. Pre-tax income increased 30.1% to $526.1 million for fiscal 2005 from $404.3 million for fiscal 2004, reflecting higher net revenues and stable expenses. Pre-tax profit margin was 49.3% for fiscal 2005, compared with 43.4% for fiscal 2004.
The following table presents the Company’s interest-bearing balances for the fiscal years ended November 30, 2005 and 2004:
|
|
|
|
|
|
|
|
|
|
|
| 2005 |
|
|
| 2004 |
|
| ||||||||
(in billions) |
|
|
|
|
|
|
|
|
| ||||||||
Margin debt balances, average for period |
| $ | 58.5 |
|
| $ | 48.0 |
|
Margin debt balances, at period end |
|
| 59.5 |
|
|
| 57.3 |
|
Customer short balances, average for period |
|
| 84.4 |
|
|
| 76.3 |
|
Customer short balances, at period end |
|
| 79.9 |
|
|
| 85.4 |
|
Securities borrowed, average for period |
|
| 62.8 |
|
|
| 63.8 |
|
Securities borrowed, at period end |
|
| 54.6 |
|
|
| 65.2 |
|
Free credit balances, average for period |
|
| 29.7 |
|
|
| 28.6 |
|
Free credit balances, at period end |
|
| 31.0 |
|
|
| 30.8 |
|
Equity held in client accounts |
|
| 258.1 |
|
|
| 247.5 |
|
|
Fiscal 2004 versus Fiscal 2003Net revenues for Global Clearing Services increased 18.9% to $932.4 million for fiscal 2004 from $784.1 million for fiscal 2003. Net interest revenues increased 32.9% to $609.3 million for fiscal 2004 from $458.5 million for fiscal 2003, primarily reflecting increased margin balances from prime brokerage and fully disclosed clearance clients due to improving US equity market conditions. These results were partially offset by a decline in commission revenues of 3.0% to $303.2 million for fiscal 2004 from $312.6 million for the prior year, reflecting decreased trading volumes from prime brokerage clients. Pre-tax income increased 64.7% to $404.3 million from $245.5 million for fiscal 2003, reflecting higher net revenues. Pre-tax profit margin was 43.4% for fiscal 2004 compared with 31.3% for fiscal 2003.
Wealth Management
|
|
|
|
|
|
|
|
|
|
|
|
|
|
|
|
|
|
|
|
|
|
|
|
|
|
|
|
|
|
|
| % Increase (Decrease) |
| ||||||||
(in thousands) |
| 2005 |
| 2004 |
| 2003 |
| 2005/2004 |
| 2004/2003 |
| |||||||||
Net revenues |
|
|
|
|
|
|
|
|
|
|
|
|
|
|
|
|
|
|
|
|
Private client services revenues |
| $ | 543,767 |
| $ | 526,122 |
| $ | 477,227 |
|
|
| 3.3 | % |
|
|
| 10.2 | % |
|
Revenue transferred to Capital Markets segment |
|
| (93,586 | ) |
| (84,880 | ) |
| (98,440 | ) |
|
| (10.3 | %) |
|
|
| 13.8 | % |
|
|
| |||||||||||||||||||
Private client services net revenues |
| $ | 450,181 |
| $ | 441,242 |
| $ | 378,787 |
|
|
| 2.0 | % |
|
|
| 16.5 | % |
|
Asset management |
|
| 228,643 |
|
| 185,085 |
|
| 132,520 |
|
|
| 23.5 | % |
|
|
| 39.7 | % |
|
Total net revenues |
| $ | 678,824 |
| $ | 626,327 |
| $ | 511,307 |
|
|
| 8.4 | % |
|
|
| 22.5 | % |
|
Pre-tax income |
| $ | 39,665 |
| $ | 66,942 |
| $ | 19,217 |
|
|
| (40.7 | %) |
|
|
| 248.3 | % |
|
The Wealth Management segment is composed of the PCS and asset management areas. PCS provides high-net-worth individuals with an institutional level of investment service, including access to the Company’s resources and professionals. At November 30, 2005, PCS had approximately 500 account executives in its principal office, six regional offices and two international offices. Asset management manages equity, fixed income and alternative assets for corporate pension plans, public systems, endowments, foundations, multi-employer plans, insurance companies, corporations, families and high-net-worth individuals in the US and abroad.
Fiscal 2005 versus Fiscal 2004Net revenues for Wealth Management increased 8.4% to $678.8 million for fiscal 2005 from $626.3 million for fiscal 2004. PCS revenues increased 2.0% to $450.2 million for fiscal 2005 from $441.2
43
MANAGEMENT’S DISCUSSION AND ANALYSIS
continued
million for fiscal 2004, reflecting increased net interest revenues associated with higher margin balances and increased fee income attributable to higher levels of fee-based assets as well as an increase in broker productivity. Gross revenues per broker increased to $1.19 million in fiscal 2005 from $1.08 million in fiscal 2004. Asset management revenues increased 23.5% to $228.6 million for fiscal 2005 from $185.1 million for fiscal 2004, reflecting increased performance fees on proprietary hedge fund products. Management fees also increased during fiscal 2005 on higher levels of traditional assets under management. Pre-tax income for Wealth Management decreased 40.7% to $39.7 million in fiscal 2005 from $66.9 million for fiscal 2004. The pre-tax income decrease relates to $22 million in non-recurring income received from the sale of the mutual funds business to Dreyfus as well as increased operating costs incurred during fiscal 2005.
Assets under management were $41.9 billion at November 30, 2005, reflecting a 10.8% increase from $37.8 billion in assets under management at November 30, 2004. The increase in assets under management reflects continued increases in traditional equity assets attributable to market appreciation and net inflows. Assets under management at November 30, 2005 include $6.3 billion of assets from alternative investment products, a slight increase from $6.2 billion at November 30, 2004.
Fiscal 2004 versus Fiscal 2003Net revenues for Wealth Management increased 22.5% to $626.3 million for fiscal 2004 from $511.3 million for fiscal 2003. PCS revenues increased 16.5% to $441.2 million for fiscal 2004 from $378.8 million for fiscal 2003, reflecting higher levels of fee income attributable to higher fee-based assets, increased levels of retail customer activity on improving US equity markets, and increased net interest revenues associated with higher margin balances. Asset management revenues increased 39.7% to $185.1 million for fiscal 2004 from $132.5 million for fiscal 2003. This increase includes approximately $22 million of revenues associated with the sale of the Company’s mutual funds business to Dreyfus completed in the second quarter of 2004. In addition, asset management revenues increased on higher management fees attributable to increased assets under management in both traditional and hedge fund products, as well as improved performance fees on alternative investment products. Pre-tax income for Wealth Management was $66.9 million in fiscal 2004, a 248.3% increase compared with pre-tax income of $19.2 million for fiscal 2003, reflecting higher net revenues. Fiscal 2004 results included approximately $7 million of non-recurring transaction costs associated with the sale of the mutual funds business.
Assets under management were $37.8 billion at November 30, 2004, reflecting a 29.5% increase from $29.2 billion in assets under management at November 30, 2003. The increase in assets under management is due in part to the acquisition in the fourth quarter of 2004 of $6.1 billion of fixed income assets of TimesSquare Capital Management, Inc. together with growth in traditional equity assets. Partially offsetting these increases was the sale of the mutual funds business to Dreyfus in 2004, which reduced assets under management by $2.4 billion. Assets under management at November 30, 2004 include $6.2 billion of assets from alternative investment products, an increase of 4.5% from approximately $6.0 billion at November 30, 2003.
LIQUIDITY AND CAPITAL RESOURCES
Financial Leverage
Asset Composition
The Company’s actual level of capital, capital requirements and thereby the level of financial leverage, is a function of numerous variables, including asset composition, rating agency/creditor perception, business prospects, regulatory requirements, balance sheet liquidity, cost/availability of capital and risk of loss. The Company consistently maintains a highly liquid balance sheet, with the vast majority of the Company’s assets consisting of cash, marketable securities inventories and collateralized receivables arising from customer-related and proprietary securities transactions.
Collateralized receivables consist of resale agreements secured predominantly by US government and agency securities, customer margin loans and securities borrowed, which are typically secured by marketable corporate debt and equity securities. The nature of the Company’s business as a securities dealer requires it to carry significant levels of securities inventories to meet its customer and proprietary trading needs. Additionally, the Company’s role as a financial intermediary for customer activities, which it conducts on a principal basis, together with its customer-related
44
MANAGEMENT’S DISCUSSION AND ANALYSIS
continued
activities in its clearance business, results in significant levels of customer-related balances, including customer margin debt, securities borrowed and repurchase activity. The Company’s total assets and financial leverage can and do fluctuate, depending largely on economic and market conditions, volume of activity and customer demand.
The Company’s total assets at November 30, 2005 increased to $292.6 billion from $255.9 billion at November 30, 2004. The increase was primarily attributable to increases in financial instruments owned, assets of variable interest entities and mortgage loan special purpose entities, securities received as collateral, cash and cash equivalents and receivables from customers, partially offset by a decrease in securities borrowed and securities purchased under agreements to resell. The Company’s total capital base, which consists of long-term debt, preferred equity issued by subsidiaries and total stockholders’ equity, increased to $54.3 billion at November 30, 2005 from $45.8 billion at November 30, 2004. This change was primarily due to a net increase in long-term debt and an increase in stockholders’ equity due to earnings as well as income tax benefits attributable to the distribution of common stock under the Company’s deferred compensation plans.
The Company’s total capital base as of November 30, 2005 and 2004 was as follows:
|
|
|
|
|
|
|
|
|
|
| 2005 |
|
| 2004 |
| ||
| ||||||||
(in millions) |
|
|
|
|
|
|
|
|
| ||||||||
Long-term borrowings: |
|
|
|
|
|
|
|
|
Senior debt |
| $ | 43,227.1 |
|
| $ | 36,580.8 |
|
Subordinated debt(1) |
|
| 262.5 |
|
|
| 262.5 |
|
| ||||||||
Total long-term borrowings |
| $ | 43,489.6 |
|
| $ | 36,843.3 |
|
|
|
|
|
|
|
|
|
|
Stockholders’ equity: |
|
|
|
|
|
|
|
|
Preferred stockholders’ equity |
| $ | 372.3 |
|
| $ | 448.1 |
|
Common stockholders’ equity |
|
| 10,419.1 |
|
|
| 8,542.8 |
|
| ||||||||
Total stockholders’ equity |
| $ | 10,791.4 |
|
| $ | 8,990.9 |
|
| ||||||||
Total capital |
| $ | 54,281.0 |
|
| $ | 45,834.2 |
|
| ||||||||
(1) Represents junior subordinated deferrable interest debentures issued by the Company, held by Bear Stearns Capital Trust III. See Note 10, Preferred Stock, in the Notes to Consolidated Financial Statements for further information.
The amount of long-term debt as well as total capital that the Company maintains is driven by a number of factors, with particular focus on asset composition. The Company’s ability to support increases in total assets is a function of its ability to obtain short-term secured and unsecured funding, as well as its access to longer-term sources of capital (i.e., long-term debt and equity). The Company regularly measures and monitors its total capital requirements, which are primarily a function of the self-funding ability of its assets. The equity portion of total capital is primarily a function of on- and off-balance-sheet risks (i.e., market, credit and liquidity) and regulatory capital requirements. As such, the liquidity and risk characteristics of assets being held are critical determinants of both total capital and the equity portion thereof, thus significantly influencing the amount of leverage that the Company can employ.
Given the nature of the Company’s market-making and customer-financing activity, the overall size of the balance sheet fluctuates from time to time. The Company’s total assets at quarter end are lower than would be observed on an average basis. At the end of each quarter, the Company typically uses excess cash to finance high-quality, highly liquid securities inventory that otherwise would be funded via the repurchase agreement market. In addition, the Company reduces its matched book repurchase and reverse repurchase activities at quarter end. Finally, the Company may reduce the aggregate level of inventories through ordinary course, open market activities in the most liquid portions of the balance sheet, which are principally US government and agency securities and agency mortgage pass-through securities. At November 30, 2005 and November 30, 2004, total assets of $292.6 billion and $255.9 billion were approximately 5.6% and 6.4%, respectively, lower than the average of the month-end balances observed over the trailing 12-month period. Despite reduced total assets at quarter end, the Company’s overall market, credit and liquidity
45
MANAGEMENT’S DISCUSSION AND ANALYSIS
continued
risk profile does not change materially, since the reduction in asset balances is predominantly in highly liquid, short-term instruments that are financed on a secured basis. This periodic reduction verifies the inherently liquid nature of the balance sheet and provides consistency with respect to creditor constituents’ evaluation of the Company’s financial condition.
Leverage Ratios
Balance sheet leverage measures is one approach to assessing the capital adequacy of a securities firm, such as the Company. The following table presents total assets and net adjusted assets with the resultant leverage ratios at November 30, 2005 and November 30, 2004. Gross leverage equals total assets divided by stockholders’ equity, inclusive of preferred and trust preferred equity. The Company views its trust preferred equity as a component of its equity capital base given the equity-like characteristics of the securities. The Company also receives rating agency equity credit for these securities. Net adjusted leverage equals net adjusted assets divided by tangible equity capital, which excludes goodwill and intangible assets from both the numerator and denominator, as equity used to support goodwill and intangible assets is not available to support the balance of the Company’s net assets. With respect to a comparative measure of financial risk and capital adequacy, the Company believes that the low-risk, collateralized nature of its securities purchased under agreements to resell, securities borrowed, securities received as collateral, customer receivables and segregated cash assets renders net adjusted leverage as the relevant measure.
|
|
|
|
|
|
|
|
|
| 2005 |
| 2004 |
| ||
(in millions, except ratios) |
|
|
|
|
|
|
|
Total assets |
| $ | 292,635 |
| $ | 255,950 |
|
Deduct: |
|
|
|
|
|
|
|
Cash and securities deposited with clearing organizations or segregated in compliance with federal regulations |
|
| 5,270 |
|
| 4,423 |
|
Securities purchased under agreements to resell |
|
| 42,648 |
|
| 45,395 |
|
Securities received as collateral |
|
| 12,426 |
|
| 8,823 |
|
Securities borrowed |
|
| 62,915 |
|
| 69,793 |
|
Receivables from customers |
|
| 33,255 |
|
| 32,114 |
|
Goodwill & intangible assets |
|
| 355 |
|
| 365 |
|
Subtotal |
|
| 156,869 |
|
| 160,913 |
|
Add: |
|
|
|
|
|
|
|
Financial instruments sold, but not yet purchased |
|
| 35,004 |
|
| 29,476 |
|
Deduct: |
|
|
|
|
|
|
|
Derivative financial instruments sold, but not yet purchased |
|
| 12,957 |
|
| 9,672 |
|
Net adjusted assets |
| $ | 157,813 |
| $ | 114,841 |
|
Stockholders’ equity |
|
|
|
|
|
|
|
Common equity |
| $ | 10,419 |
| $ | 8,543 |
|
Preferred stock |
|
| 372 |
|
| 448 |
|
Total stockholders’ equity |
|
| 10,791 |
|
| 8,991 |
|
Add: |
|
|
|
|
|
|
|
Trust preferred equity |
|
| 263 |
|
| 263 |
|
Subtotal – leverage equity |
|
| 11,054 |
|
| 9,254 |
|
Deduct: |
|
|
|
|
|
|
|
Goodwill & intangible assets |
|
| 355 |
|
| 365 |
|
Tangible equity capital |
| $ | 10,699 |
| $ | 8,889 |
|
Gross leverage |
|
| 26.5 |
|
| 27.7 |
|
Net adjusted leverage |
|
| 14.8 |
|
| 12.9 |
|
Funding Strategy and Liquidity Risk Management
General Funding Strategy
Liquidity is extraordinarily important for financial services firms in general and for securities firms such as the Company in particular, given reliance on market confidence. Consequently, the Company focuses on management of funding and liquidity risk. The Company’s overall objective and general funding strategy seeks to ensure liquidity and diversity of funding sources to meet the Company’s financing needs at all times and under all market environments. In financing its balance sheet, the Company attempts to maximize its use of secured funding where economically competitive. Short-term sources of cash consist principally of collateralized borrowings, including repurchase
46
MANAGEMENT’S DISCUSSION AND ANALYSIS
continued
transactions, sell/buy arrangements, securities lending arrangements and customer free credit balances. Short-term unsecured funding sources expose the Company to rollover risk, as providers of credit are not obligated to refinance the instruments at maturity. For this reason, the Company seeks to prudently manage its reliance on short-term unsecured borrowings by maintaining an adequate total capital base and extensive use of secured funding. In addition to this strategy, the Company places emphasis on diversification by product, geography, maturity and instrument in order to further ensure prudent, moderate usage of more credit-sensitive, potentially less stable, funding. Short-term unsecured funding sources include commercial paper, medium-term notes and bank borrowings, which generally have maturities ranging from overnight to one year. The Company views its secured funding as inherently less credit sensitive and therefore a more stable source of funding due to the collateralized nature of the borrowing.
In addition to short-term funding sources, the Company utilizes equity and long-term debt, including floating- and fixed-rate notes, as longer-term sources of unsecured financing. The Company regularly monitors and analyzes the size, composition and liquidity characteristics of its asset base in the context of each asset’s ability to be used to obtain secured financing. This analysis helps the Company in determining its aggregate need for longer-term funding sources (i.e., long-term debt and equity). The Company views long-term debt as a stable source of funding, which effectively strengthens its overall liquidity profile and mitigates liquidity risk.
Alternative Funding Strategy
The Company maintains an alternative funding strategy focused on the liquidity and self-funding ability of the underlying assets. The objective of this strategy is to maintain sufficient cash capital (i.e., equity plus long-term debt maturing in more than 12 months) and funding sources to enable the Company to refinance short-term, unsecured borrowings with fully secured borrowings. As such, the Company is not reliant upon nor does it contemplate forced balance sheet reduction to endure a period of constrained funding availability. This underlying approach is supported by maintenance of a formal contingency funding plan, which includes a detailed delegation of authority and precise action steps for managing an event-driven liquidity crisis. The plan identifies the crisis management team, details an effective internal and external communication strategy, and facilitates the greater information flow required to effect a rapid and efficient transition to a secured funding environment.
As it relates to the alternative funding strategy discussed above, the Company prepares an analysis that focuses on a 12-month time period and assumes that the Company does not liquidate assets and cannot issue any new unsecured debt, including commercial paper. Under these assumptions, the Company monitors its cash position and the borrowing value of unencumbered, unhypothecated financial instruments in relation to its unsecured debt maturing over the next 12 months, striving to maintain the ratio of liquidity sources to maturing debt at 110% or greater. Also within this strategy, the Company seeks to maintain cash capital in excess of that portion of its assets that cannot be funded on a secured basis (i.e., positive net cash capital). These two measures, liquidity ratio and net cash capital, are complementary and constitute the core elements of the Company’s alternative funding strategy and, consequently, its approach to funding and liquidity risk management.
The borrowing value advance rates used in the Company’s liquidity ratio calculation and the haircuts incorporated in the cash capital model are symmetrical. These advance rates are considered readily available, even in a stress environment. In the vast majority of circumstances/asset classes they are derived from committed secured bank facilities, whereby a bank or group of banks is contractually obligated to lend to the Company at a pre-specified advance rate on specific types of collateral regardless of “market environment.” As such, the advance rates/haircuts in the alternative liquidity models are typically worse than those the Company realizes in normalized repo and secured lending markets. The advance rates in the liquidity ratio reflect what can be reliably realized in a stressed liquidity environment. The haircuts used in the cash capital model are consistent with the advance rates in the liquidity ratio in that the haircut is equal to one minus the advance rate.
As of November 30, 2005, the market value of unencumbered, unhypothecated financial instruments
47
MANAGEMENT’S DISCUSSION AND ANALYSIS
continued
owned by the Company was approximately $37.0 billion with a borrowing value of $28.8 billion. The assets are composed of primarily mortgage- and asset-backed securities, investment grade municipal and corporate bonds, US equities and residential and commercial mortgage whole loans. The average advance rate on these different asset types ranges from 74% to 96% and, as described above, is based predominantly on committed, secured facilities that the Company and its subsidiaries maintain in different regions globally. The liquidity ratio, explained above, based solely on Company-owned securities, has averaged 166% over the previous 12 months including unused committed unsecured bank credit, and 155% excluding the unsecured portion of the Company’s $3.7 billion committed revolving credit facility. On this same basis, the liquidity ratio was 157% as of November 30, 2005 and 149% excluding committed unsecured bank credit. In addition to Company-owned unencumbered financial instruments, as of year end, the Company held $61.2 billion of collateral owned by customers and introducing brokers that could be repledged to raise secured funding. Of this total, $2.2 billion was readily available to pledge to meet the Company’s liquidity needs given current reserve requirements. Inclusive of both the readily available portion of customer and introducing broker collateral and unused committed secured bank credit, the liquidity ratio at November 30, 2005 was 179%.
While The Bear Stearns Companies Inc. (“Parent Company”) is the primary issuer of unsecured debt in the marketplace, the collateral referred to in the preceding paragraph is held in various subsidiaries, both regulated and unregulated. A subsidiary’s legal entity status and the Company’s inter-company funding structure may constrain liquidity available to the Parent Company, as regulators may prevent the flow of funds and/or securities from a regulated subsidiary to its parent company or other subsidiaries. In recognition of this potential for liquidity to be trapped in subsidiaries, the Company maintains a minimum $5.0 billion of liquidity immediately accessible by the Parent Company at all times. This liquidity reserve takes the form of cash deposits and money market instruments that are held at the Parent Company and high-quality collateral (corporate bonds, municipal bonds, equity securities) that is owned by subsidiaries and explicitly pledged to and segregated for the benefit of the Parent Company and maintained at a third-party custodian. For purposes of calculating the aggregate value of the liquidity reserve, the contractually obligated advance rates described herein are used to determine the borrowing value of collateral pledged. In addition to this immediately available liquidity, the Company monitors unrestricted liquidity available to the Parent Company via the ability to monetize unencumbered assets held in unregulated and regulated entities. As of November 30, 2005, approximately $19.6 billion of the market value identified in the liquidity ratio data above was held in unregulated entities and thus unrestricted as to parent availability, while an additional $4.0 billion market value had been pledged to the Parent Company as collateral for inter-company borrowings and was thus readily available. The remaining $13.4 billion market value of unencumbered securities was held in regulated entities, a portion of which may be available to provide liquidity to the Parent Company.
The cash capital framework is utilized to evaluate the Company’s long-term funding sources and requirements in their entirety. Cash capital required to support all of the Company’s assets is determined on a regular basis. For purposes of broadly classifying the drivers of cash capital requirements, cash capital usage can be delineated across two very broad categories as (1) firmwide haircuts and (2) illiquid assets/long-term investments. More precisely, the Company holds cash capital to support longer-term funding requirements, including, but not limited to, the following:
|
|
|
| • | That portion of financial instruments owned that cannot be funded on a secured basis (i.e., the haircuts); |
|
|
|
| • | Margin loans and resale principal in excess of the borrowing value of collateral received; |
|
|
|
| • | Operational cash deposits required to support the regular activities of the Company (e.g., exchange initial margin); |
|
|
|
| • | Unfunded committed funding obligations, such as corporate loan commitments; |
|
|
|
| • | Less liquid and illiquid assets, such as goodwill and fixed assets; |
|
|
|
| • | Uncollateralized funded loans and funded loans secured by illiquid and/or non-rehypothecatable collateral; |
|
|
|
| • | Merchant banking assets and other long-term investments; and |
|
|
|
| • | Regulatory capital in excess of a regulated entity’s cash capital based longer-term funding requirements. |
Notwithstanding the lack of homogeneity of the longer-term funding requirements listed above, the table below summarizes the Company’s net cash capital position and classifies all of the long-term funding requirements of the
48
MANAGEMENT’S DISCUSSION AND ANALYSIS
continued
Company within the broad categories previously identified. At November 30, 2005, the Company’s net cash capital position was $5.7 billion. Fluctuations in net cash capital are common and are a function of variability in total assets, balance sheet composition and total capital. The Company attempts to maintain cash capital sources in excess of the aggregate longer-term funding requirements of the firm (i.e., positive net cash capital). Over the previous 12 months, the Company’s net cash capital position has averaged $1.6 billion.
The Company’s net cash capital position as of November 30, 2005 and 2004 was as follows:
|
|
|
|
|
|
|
|
|
|
| 2005 |
| 2004 |
| |||
| ||||||||
(in millions) |
|
|
|
|
|
|
|
|
| ||||||||
Cash capital available: |
|
|
|
|
|
|
|
|
Stockholders’ equity |
| $ | 10,791.4 |
|
| $ | 8,990.9 |
|
Subordinated debt(1) |
|
| 262.5 |
|
|
| 262.5 |
|
Long-term debt > 1 year(2) |
|
| 39,751.5 |
|
|
| 28,074.8 |
|
| ||||||||
Total cash capital available |
| $ | 50,805.4 |
|
| $ | 37,328.2 |
|
Cash capital required: |
|
|
|
|
|
|
|
|
Firmwide haircuts |
| $ | 37,340.2 |
|
| $ | 29,491.5 |
|
Illiquid assets/long-term investments |
|
| 7,804.1 |
|
|
| 6,212.9 |
|
| ||||||||
Total cash capital required |
| $ | 45,144.3 |
|
| $ | 35,704.4 |
|
| ||||||||
Net cash capital |
| $ | 5,661.1 |
|
| $ | 1,623.8 |
|
| ||||||||
(1) Represents junior subordinated deferrable interest debentures issued by the Company, held by Bear Stearns Capital Trust III. See Note 10, Preferred Stock, in the Notes to Consolidated Financial Statements for further information.
(2) Excludes certain long-term debt items not available for cash capital needs and includes certain sources of capital available to fund-specific assets within the cash capital model.
In addition to the alternative funding measures above, the Company monitors the maturity profile of its unsecured debt to minimize refinancing risk, maintains relationships with a broad global base of debt investors and bank creditors, establishes and adheres to strict short-term debt investor concentration limits, and periodically tests its secured and unsecured committed credit facilities. An important component of the Company’s funding and liquidity risk management efforts involves ongoing dialogues with a large number of creditor constituents. Strong relationships with
49
MANAGEMENT’S DISCUSSION AND ANALYSIS
continued
a diverse base of creditors and debt investors are crucial to the Company’s liquidity. The Company also maintains available sources of short-term funding that exceed actual utilization, thus allowing it to endure changes in investor appetite and credit capacity to hold the Company’s debt obligations.
With respect to the management of refinancing risk, the maturity profile of the long-term debt portfolio of the Company is monitored on an ongoing basis and structured within the context of two diversification guidelines. The Company has a general guideline of no more than 20% of its long-term debt portfolio maturing in any one year, as well as no more than 10% maturing in any one quarter over the next five years. The Company continued to meet these guidelines at the end of fiscal 2005 as evidenced by the bar graphs below. As of November 30, 2005, the weighted average maturity of the Company’s long-term debt was 4.4 years.
LONG-TERM DEBT MATURITY PROFILE
($ in millions)
($ in millions)
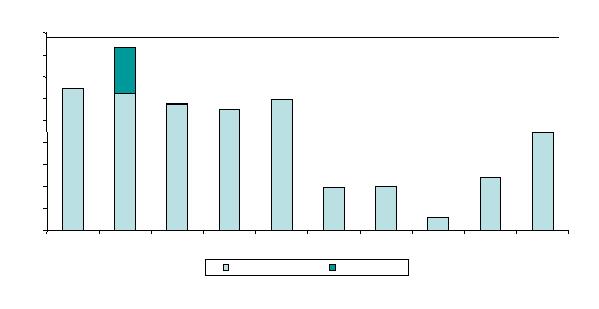
4,465
2,393
590
1,975
1,962
5,970
5,810
5,518
8,319
6,488
0
1,000
2,000
3,000
4,000
5,000
6,000
7,000
8,000
9,000
One
Two
Three
Four
Five
Six
Seven
Eight
Nine
Ten & >
Non-Extendibles
Extendibles
(1)
20%
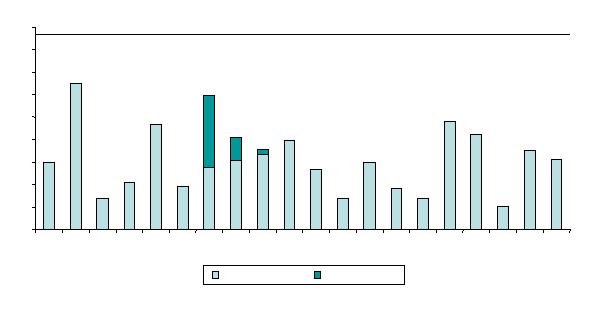
1,559
1,767
519
2,125
2,406
703
911
1,498
701
1,342
1,985
1,782
2,042
2,984
949
2,344
685
1,049
3,251
1,503
0
500
1,000
1,500
2,000
2,500
3,000
3,500
4,000
4,500
1Q06
2Q06
3Q06
4Q06
1Q07
2Q07
3Q07
4Q07
1Q08
2Q08
3Q08
4Q08
1Q09
2Q09
3Q09
4Q09
1Q10
2Q10
3Q10
4Q10
Non-Extendibles
Extendibles
(1)
10%
The charts above represent debt maturing in the indicated number of years as of November 30, 2005.
(1) Extendibles are debt instruments with an extendible maturity date and are included in long-term debt if the earliest maturity date is greater than one year. Unless debt holders instruct the Company to redeem their debt, the earliest maturity date of these instruments is automatically extended. Based on past experience, the majority of the Company’s extendibles is expected to remain outstanding beyond their earliest maturity date.
50
MANAGEMENT’S DISCUSSION AND ANALYSIS
continued
Committed Credit Facilities
The Company has a committed revolving credit facility (“Facility”) totaling $3.70 billion, which permits borrowing on a secured basis by the Parent Company, BSSC, BSIL and certain other subsidiaries. The Facility also allows the Parent Company and BSIL to borrow up to $1.85 billion of the Facility on an unsecured basis. Secured borrowings can be collateralized by both investment grade and non-investment-grade financial instruments as the Facility provides for defined advance rates on a wide range of financial instruments eligible to be pledged. The Facility contains financial covenants, the most significant of which require maintenance of specified levels of stockholders’ equity of the Company and net capital of BSSC. In February 2006, the Company renewed the Facility with substantially the same terms. There were no borrowings outstanding under the Facility at November 30, 2005.
The Company has a $1.50 billion committed revolving securities repo facility (“Repo Facility”), which permits borrowings secured by a broad range of collateral under a repurchase arrangement by the Parent Company, BSIL, Bear Stearns International Trading Limited (“BSIT”) and BSB. The Repo Facility contains financial covenants that require, among other things, maintenance of specified levels of stockholders’ equity of the Company. The Repo Facility terminates in August 2006, with all repos outstanding at that date payable no later than August 2007. There were no borrowings outstanding under the Repo Facility at November 30, 2005.
The Company has a $350 million committed revolving credit facility (“Pan Asian Facility”), which permits borrowing on a secured basis collateralized by foreign securities at pre-specified advance rates. The Pan Asian Facility contains financial covenants that require, among other things, maintenance of specified levels of stockholders’ equity of the Company and net capital of BSSC. In December 2005, the Company renewed the Facility at a $350 million committed level with substantially the same terms. The Pan Asian Facility terminates in December 2006 with all loans outstanding at that date payable no later than December 2007. There were no borrowings outstanding under the Pan Asian Facility at November 30, 2005.
The Company also maintains a series of committed credit facilities to support liquidity needs for the financing of investment grade and non-investment-grade corporate loans, residential mortgages, commercial mortgages and listed options. The facilities are expected to be drawn from time to time and expire at various dates, the longest of such periods ending in fiscal 2007. All of these facilities contain a term-out option of one year or more for borrowings outstanding at expiration. The banks providing these facilities are committed to providing up to an aggregate of approximately $2.9 billion. At November 30, 2005, the borrowings outstanding under these committed credit facilities were $283.3 million.
Capital Resources
The Parent Company, operating as the centralized unsecured funding arm of the Company, raises the vast majority of the Company’s unsecured debt, including both commercial paper and long-term debt. The Parent Company is thus the “central bank” of the Company, where all capital is held and from which capital is deployed. The Parent Company advances funds in the form of debt or equity to subsidiaries to meet their operating funding needs and regulatory capital requirements. In addition to the primary regulated subsidiaries, the Company also conducts significant activities through other wholly owned subsidiaries, including: Bear Stearns Global Lending Limited, Custodial Trust Company, Bear Stearns Financial Products Inc., Bear Stearns Capital Markets Inc., Bear Stearns Credit Products Inc., Bear Stearns Forex Inc., EMC Mortgage Corporation, Bear Stearns Commercial Mortgage, Inc. and Bear Hunter Holdings LLC. In connection with all of the Company’s operating activities, a substantial portion of the Company’s long-term borrowings and equity has been used to fund investments in, and advances to, these subsidiaries, including subordinated debt advances.
Within this funding framework, the Company attempts to fund equity investments in subsidiaries with equity from the Parent Company (i.e., utilize no equity double leverage). At November 30, 2005, the Parent Company’s equity investment in subsidiaries was $7.2 billion versus common stockholders’ equity and preferred equity of $10.4 billion and $372.3
51
MANAGEMENT’S DISCUSSION AND ANALYSIS
continued
million, respectively. As such, at November 30, 2005, the ratio of the equity investment in subsidiaries to Parent Company equity (equity double leverage) was approximately 0.69 based on common equity and 0.67 including preferred equity. At November 30, 2004, these measures were 0.70 based on common equity and 0.66 including preferred equity. Additionally, all subordinated debt advances to regulated subsidiaries for use as regulatory capital, which totaled $10.2 billion at the end of fiscal 2005, are funded with long-term debt issued by the Company having a remaining maturity equal to or greater than the maturity of the subordinated debt advance. The Company regularly monitors the nature and significance of assets or activities conducted in all subsidiaries and attempts to fund such assets with both capital and/or borrowings having a maturity profile and relative mix consistent with the nature and self-funding ability of the assets being financed. The funding mix also takes into account regulatory capital requirements for regulated subsidiaries.
Long-term debt totaling $37.0 billion and $30.7 billion had remaining maturities beyond one year at November 30, 2005 and November 30, 2004, respectively. The Company accesses funding in a variety of markets in the United States, Europe and Asia. The Company issues debt through syndicated US-registered offerings, US- registered and 144A medium-term note programs, other US and non-US bond and note offerings and other methods. The Company’s access to external sources of financing, as well as the cost of that financing, is dependent on various factors and could be adversely affected by a deterioration of the Company’s long- and short-term debt ratings, which are influenced by a number of factors. These include, but are not limited to: material changes in operating margins; earnings trends and volatility; the prudence of funding and liquidity management practices; financial leverage on an absolute basis or relative to peers; the composition of the balance sheet and/or capital structure; geographic and business diversification; and the Company’s market share and competitive position in the business segments in which it operates. Material deterioration in any one or a combination of these factors could result in a downgrade of the Company’s credit ratings, thus increasing the cost of and/or limiting the availability of unsecured financing. Additionally, a reduction in the Company’s credit ratings could also trigger incremental collateral requirements, predominantly in the over-the-counter derivatives market. As of November 30, 2005, a downgrade by either Moody’s Investors Service or Standard & Poor’s in the Company’s long-term credit ratings to the level of A3 or A- would result in the Company needing to post $68.5 million in additional collateral pursuant to contractual arrangements for outstanding over-the-counter derivatives contracts. A downgrade to Baa1 or BBB+ would result in needing to post an additional $417.8 million in collateral.
At November 30, 2005, the Company’s long-term/short-term debt ratings were as follows:
|
|
| Rating |
Dominion Bond Rating Service Limited | A (high)/R-1 (middle) |
Fitch | A+/F1+ |
Moody’s Investors Service | A1/P-1 |
Rating & Investment Information, Inc. | A+/NR |
Standard & Poor’s | A/A-1 |
NR – does not assign a short-term rating
In October 2005, Standard & Poor’s Ratings Services changed the outlook on The Bear Stearns Companies Inc. from stable to positive. Simultaneously, the A/A-1 ratings were affirmed. The outlook change reflects the Company’s high profitability with low earnings volatility during the past several years. Standard & Poor’s also cited the strength of the Company’s various franchises, conservative management team and low tolerance for risk. The outlook change indicates that the rating could be raised during the next one to two years if the Company continues to perform well.
Stock Repurchase Program
The Company has various employee stock compensation plans designed to increase the emphasis on stock-based incentive compensation and align the compensation of its key employees with the long-term interests of stockholders. Such plans provide for annual grants of stock units and stock options. The Company intends to offset the potentially dilutive impact of the annual grants by purchasing common stock throughout the year in open market and private transactions. On January 5, 2005, the Board of Directors of the Company approved an amendment to the Stock Repurchase Program (“Repurchase Program”) to replenish the previous authorizations to allow the Company to purchase up to $1.0 billion of common stock in fiscal 2005 and beyond. During the fiscal year ended November 30, 2005, the Company purchased under the current and prior authorizations a total of 7,063,528 shares at a cost of approximately $725.6 million. Approximately $338.8 million was available to be purchased under the current
52
MANAGEMENT’S DISCUSSION AND ANALYSIS
continued
authorization as of November 30, 2005. On December 12, 2005, the Board of Directors of the Company approved an amendment to the Repurchase Program to replenish the previous authorization in order to allow the Company to purchase up to $1.5 billion of common stock in fiscal 2006 and beyond. The Company expects to utilize the repurchase authorization to offset the dilutive impact of annual share awards. The Company may, depending upon price and other factors, acquire additional shares in excess of that required for annual share awards.
During the fiscal year ended November 30, 2005, the Company also purchased a total of 1,419,955 shares of its common stock at a total cost of $144.0 million pursuant to a $200 million CAP Plan Earnings Purchase Authorization, which was approved by the Compensation Committee of the Board of Directors of the Company on November 30, 2004. On December 9, 2005, the Compensation Committee of the Company approved an amendment to the CAP Plan Earnings Purchase Authorization to replenish the previous authorization in order to allow the Company to purchase up to $200 million of common stock in fiscal 2006.
Cash Flows
Fiscal 2005 Cash and cash equivalents increased $1.69 billion to $5.86 billion at November 30, 2005 from $4.17 billion at November 30, 2004. Cash used in operating activities was $14.01 billion, primarily attributable to increases in financial instruments owned and a decrease in net payables to customers, partially offset by increases in securities sold under agreements to repurchase, net of securities purchased under agreements to resell and financial instruments sold, but not yet purchased and a decrease in securities borrowed, net of securities loaned, which occurred in the normal course of business as a result of changes in customer needs, market conditions and trading strategies. Cash used in investing activities of $202.9 million reflected purchases of property, equipment and leasehold improvements. Cash provided by financing activities of $15.90 billion reflected net proceeds from the issuance of long-term borrowings of $16.00 billion and net proceeds relating to short-term borrowings of $7.80 billion, primarily to fund normal operating activities. This was partially offset by net payments for the retirement/repurchase of long-term borrowings of $7.27 billion. Treasury stock purchases of $869.6 million were made to provide for the annual grant of CAP Plan units, restricted stock units and stock options.
Fiscal 2004 Cash and cash equivalents increased $335.8 million to $4.17 billion at November 30, 2004 from $3.84 billion at November 30, 2003. Cash used in operating activities was $2.18 billion, primarily attributable to an increase in financial instruments owned, partially offset by an increase in net payables to brokers, dealers and others and financial instruments sold, but not yet purchased, as well as decreases in cash and securities deposited with clearing organizations or segregated in compliance with federal regulations and securities borrowed, net of securities loaned, which occurred in the normal course of business as a result of changes in customer needs, market conditions and trading strategies. Cash used in investing activities of $128.4 million reflected purchases of property, equipment and leasehold improvements. Cash provided by financing activities of $2.64 billion reflected net proceeds of $11.25 billion from issuances of long-term borrowings used primarily to fund normal operating activities. This was partially offset by repayments of $6.65 billion in long-term borrowings, and net payments of $1.18 billion relating to short-term borrowings and a $300 million redemption of trust-issued preferred stock. Treasury stock purchases of $780.8 million were made to provide for the annual grant of CAP Plan units, restricted stock units and stock options.
Fiscal 2003 Cash and cash equivalents decreased $1.68 billion to $3.84 billion at November 30, 2003 from $5.52 billion at November 30, 2002. Cash used in operating activities was $5.22 billion, primarily attributable to an increase in securities borrowed, net of securities loaned and financial instruments owned, as well as a decrease in net payables to brokers, dealers and others, partially offset by an increase in net payables to customers and securities sold under agreements to repurchase, net of securities purchased under agreements to resell, which occurred in the normal course of business as a result of changes in customer needs, market conditions and trading strategies. Cash used in investing activities of $36.7 million reflected purchases of property, equipment and leasehold improvements. Cash provided by financing activities of $3.57 billion reflected net proceeds of $11.20 billion from issuances of long-term borrowings used primarily to fund normal operating activities and to repay $6.07 billion in long-term borrowings, and net payments relating to short-term borrowings. Treasury stock purchases of $986.2 million were made to provide for the annual grant of CAP Plan units, restricted stock units and stock options.
53
MANAGEMENT’S DISCUSSION AND ANALYSIS
continued
Regulated Subsidiaries
As registered broker-dealers, Bear Stearns and BSSC are subject to the net capital requirements of the Exchange Act, the NYSE and the Commodity Futures Trading Commission, which are designed to measure the general financial soundness and liquidity of broker-dealers. BSIL and BSIT, London-based broker-dealer subsidiaries, are subject to the regulatory capital requirements of the Financial Services Authority. Additionally, BSB is subject to the regulatory capital requirements of the Irish Financial Services Regulatory Authority. At November 30, 2005, Bear Stearns, BSSC, BSIL, BSIT and BSB were in compliance with their respective regulatory capital requirements.
The Company’s broker-dealer subsidiaries and other regulated subsidiaries are subject to minimum capital requirements and may also be subject to certain restrictions on the payment of dividends, which could limit the Company’s ability to withdraw capital from such regulated subsidiaries, which in turn could limit the Company’s ability to pay dividends. See Note 16, “Regulatory Requirements,” in the Notes to Consolidated Financial Statements.
In June 2004, the SEC adopted rule amendments to “Alternative Net Capital Requirements for Broker-Dealers That Are Part of Consolidated Supervised Entities” (Rule 34-49830) that allow investment banks to voluntarily submit to be regulated by the SEC on a global consolidated basis. These regulations (referred to as CSE) were in response to what is known as the “Financial Conglomerates Directive” (2002/87/EC) of the European Parliament, which served to compel globally active institutions doing business in Europe to be regulated on a global consolidated basis. During fiscal 2005, the Company applied to the SEC to be regulated under this new CSE regime. The application filed with the SEC by Bear Stearns, the Company’s principal US broker-dealer, under the net capital rule amendments, was approved in November 2005. As a result, effective December 1, 2005, Bear Stearns will use alternative methods of computing market and derivative-related credit risk, and, as a condition of using these methods, the Company has consented to consolidated supervision by the SEC. The new framework will be a notable change in the Company’s regulation, as activities that are currently transacted outside of SEC-regulated entities will come under the scope of certain SEC regulations and capital adequacy oversight. In particular, the Company will: compute allowable capital and allowances for market, credit and operational risk on a consolidated basis in accordance with standards prescribed in Appendix G to the Net Capital Rules; permit the SEC to examine the books and records of the Parent Company and any affiliate that does not have a principal regulator; and adopt various additional SEC reporting, record-keeping and notification requirements. Additionally, the Company must comply with the provisions of Rule 15c3-4 of the Exchange Act with respect to a group-wide internal risk management control system in the affiliate group as if it were an OTC derivative dealer, subject to certain limitations. The Company is now deemed a CSE and is in compliance with regulatory capital requirements.
Merchant Banking and Private Equity Investments
In connection with the Company’s merchant banking activities, the Company has investments in merchant banking and private equity-related investment funds as well as direct investments in private equity-related investments. At November 30, 2005, the Company held investments with an aggregate recorded value of approximately $658.8 million, reflected in the Consolidated Statements of Financial Condition in “Other Assets.” At November 30, 2004, the Company held investments with an aggregate recorded value of approximately $469.4 million. In addition to these various direct and indirect principal investments, the Company has made commitments to invest in private equity-related investments and partnerships (see the summary table under “Commitments”).
High Yield Positions
As part of its fixed income activities, the Company participates in the underwriting and trading of non-investment-grade corporate debt securities and also invests in, syndicates and trades in loans to highly leveraged, below investment grade rated companies (collectively, “high
54
MANAGEMENT’S DISCUSSION AND ANALYSIS
continued
yield positions”). Non-investment-grade debt securities have been defined as non-investment-grade corporate debt, and emerging market debt rated BB+ or lower, or equivalent ratings recognized by credit rating agencies. At November 30, 2005 and November 30, 2004, the Company held high yield positions approximating $6.71 billion and $4.39 billion, respectively, substantially all of which are in “Financial Instruments Owned” in the Consolidated Statements of Financial Condition, and $1.72 billion and $1.02 billion, respectively, reflected in “Financial Instruments Sold, But Not Yet Purchased” in the Consolidated Statements of Financial Condition. Included in the high yield positions are extensions of credit to highly leveraged companies. At November 30, 2005 and November 30, 2004, the amount outstanding to highly leveraged borrowers totaled $4.24 billion and $2.09 billion, respectively. The largest industry concentration was the telecommunications industry, which approximated 17.2% and 15.7% of these highly leveraged borrowers’ positions at November 30, 2005 and November 30, 2004, respectively. Additionally, the Company has lending commitments with highly leveraged borrowers (see the summary table under “Commitments”).
The Company’s Risk Management Department and senior trading managers monitor exposure to market and credit risk for high yield positions and establish limits and concentrations of risk by individual issuer. High yield positions generally involve greater risk than investment grade debt securities due to credit considerations, liquidity of secondary trading markets and increased vulnerability to changes in general economic conditions. The level of the Company’s high yield positions, and the impact of such activities on the Company’s results of operations, can fluctuate from period to period as a result of customer demand, economic conditions and market considerations.
Contractual Obligations
In connection with its operating activities, the Company enters into contractual obligations that require future cash payments. At November 30, 2005, the Company’s contractual obligations by maturity, excluding derivative financial instruments, were as follows:
|
|
|
|
|
|
|
|
|
|
|
|
|
|
|
|
|
| Payments Due by Period |
|
|
|
| |||||||||||
|
|
|
|
| ||||||||||||
|
| Fiscal |
| Fiscal |
| Fiscal |
|
|
|
|
| |||||
|
| 2006 |
| 2007–2008 |
| 2009–2010 |
| Thereafter |
| Total |
| |||||
| ||||||||||||||||
(in millions) |
|
|
|
|
|
|
|
|
|
|
|
|
|
|
|
|
| ||||||||||||||||
Long-term borrowings(1)(2) |
| $ | 6,488 |
| $ | 14,129 |
| $ | 11,488 |
| $ | 11,385 |
| $ | 43,490 |
|
Future minimum operating lease payments(3)(4) |
| $ | 75 |
| $ | 156 |
| $ | 129 |
| $ | 213 |
| $ | 573 |
|
| ||||||||||||||||
(1) Amounts include fair value adjustments in accordance with Statement of Financial Accounting Standards (‘SFAS”) No. 133 as well as $262.5 million of junior subordinated deferrable interest debentures (“Debentures”). The Debentures will mature on May 15, 2031; however, the Company, at its option, may redeem the Debentures beginning May 15, 2006. The Debentures are reflected in the table at their contractual maturity dates.
(2) Included in fiscal 2007 and fiscal 2008 are approximately $2.20 billion and $0.1 billion, respectively, of floating-rate medium-term notes that are redeemable prior to maturity at the option of the noteholder. These notes contain certain provisions that effectively enable noteholders to put these notes back to the Company and, therefore, are reflected in the table at the date such notes first become redeemable. The final maturity dates of these notes are during fiscal 2009 and fiscal 2010.
(3) Includes 383 Madison Avenue in New York City.
(4) See Note 17, “Commitments and Contingencies,” in the Notes to Consolidated Financial Statements.
55
MANAGEMENT’S DISCUSSION AND ANALYSIS
continued
Commitments
The Company has commitments(1) under a variety of commercial arrangements. At November 30, 2005, the Company’s commitments associated with lending and financing, private equity-related investments and partnerships, outstanding letters of credit, underwriting and other commercial commitments summarized by period of expiration were as follows:
|
|
|
|
|
|
|
|
|
|
|
|
|
|
|
|
|
|
|
|
|
|
|
| Amount of Commitment Expiration Per Period |
|
| |||||||||||
|
|
|
|
|
|
| ||||||||||||
|
|
| Fiscal |
| Fiscal |
| Fiscal |
|
|
|
|
|
|
| ||||
|
|
|
| 2006 |
|
| 2007-2008 |
| 2009-2010 |
|
| Thereafter |
|
| Total |
| ||
(in millions) |
|
|
|
|
|
|
|
|
|
|
|
|
|
|
|
|
|
|
Lending-related commitments: |
|
|
|
|
|
|
|
|
|
|
|
|
|
|
|
|
|
|
Investment grade(2) |
|
| $ | 1,262 |
|
| $ | 325 |
| $ | 781 |
| $ | — |
| $ | 2,368 |
|
Non-investment-grade |
|
|
| 309 |
|
|
| 202 |
|
| 652 |
|
| 277 |
|
| 1,440 |
|
Contingent commitments(3) |
|
|
| 3,818 |
|
|
| — |
|
| — |
|
| — |
|
| 3,891 |
|
Commitments to invest in private equity-related investments and partnerships(4) |
|
|
|
|
|
|
|
|
|
|
|
|
|
|
|
| 222 |
|
Underwriting commitments |
|
|
| 943 |
|
|
| — |
|
| — |
|
| — |
|
| 943 |
|
Commercial and residential loans |
|
|
| 4,789 |
|
|
| 214 |
|
| 50 |
|
| — |
|
| 5,053 |
|
Letters of credit |
|
|
| 3,340 |
|
|
| 110 |
|
| 35 |
|
| — |
|
| 3,485 |
|
Other commercial commitments |
|
|
| 480 |
|
|
| 30 |
|
| — |
|
| — |
|
| 510 |
|
(1) See Note 17, “Commitments and Contingencies,” in the Notes to Consolidated Financial Statements.
(2) In order to mitigate the exposure to investment grade borrowings, the Company entered into credit default swaps aggregating $652.5 million at November 30, 2005.
(3) Includes $72.5 million in commitments with no stated maturity.
(4) At November 30, 2005, commitments to invest in private equity-related investments and partnerships aggregated $222.1 million. These commitments will be funded, if called, through the end of the respective investment periods, the longest of such periods ending in 2014.
OFF-BALANCE-SHEET ARRANGEMENTS
In the normal course of business, the Company enters into arrangements with special purpose entities (“SPEs”), also known as variable interest entities (“VIEs”). SPEs are corporations, trusts or partnerships that are established for a limited purpose. SPEs, by their nature, are generally not controlled by their equity owners, as the establishing documents govern all material decisions. The Company’s primary involvement with SPEs relates to securitization transactions in which transferred assets, including commercial and residential mortgages, consumer receivables, securities and other financial assets are sold to an SPE and repackaged into securities or similar beneficial interests. SPEs may also be used to create securities with a unique risk profile desired by investors and as a means of intermediating financial risk. The Company, in the normal course of business, may establish SPEs, sell assets to SPEs, underwrite, distribute and make a market in securities or other beneficial interests issued by SPEs, transact derivatives with SPEs, own securities or other beneficial interests, including residuals, in SPEs, and provide liquidity or other guarantees for SPEs.
The Company follows SFAS No. 140, “Accounting for Transfers and Servicing of Financial Assets and Extinguishments of Liabilities—a Replacement of FASB Statement No. 125,” to account for securitizations and other transfers of financial assets. In accordance with SFAS No. 140, the Company accounts for transfers of financial assets as sales provided that control has been relinquished. Control is deemed to be relinquished only when all of the following conditions have been met: (1) the assets have been isolated from the transferor, even in bankruptcy or other receivership; (2) the transferee is a Qualifying Special Purpose Entity (“QSPE”) or has the right to pledge or exchange the assets received; and (3) the transferor has not maintained effective control over the transferred assets. Therefore, the Company derecognizes financial assets transferred in securitizations, provided that such transfer meets all of these criteria. See Note 5, “Transfers of Financial Assets and Liabilities,” in the Notes to Consolidated Financial Statements
56
MANAGEMENT’S DISCUSSION AND ANALYSIS
continued
for a more complete discussion of the Company’s securitization activities.
The Company regularly creates or transacts with entities that may be VIEs. These entities are an essential part of its securitization, asset management and structured finance businesses. In addition, the Company purchases and sells instruments that may be variable interests. The Company adopted FIN No. 46 (R) for its variable interests in fiscal 2004. The Company consolidates those VIEs in which the Company is the primary beneficiary. See Note 6, “Variable Interest Entities and Mortgage Loan Special Purpose Entities,” in the Notes to Consolidated Financial Statements for a complete discussion of the consolidation of VIEs.
The majority of the SPEs that the Company sponsors or transacts with are QSPEs, which the Company does not consolidate in accordance with this guidance. QSPEs are entities that have little or no discretionary activities and may only passively hold assets and distribute cash generated by the assets they hold. The Company reflects the fair value of its interests in QSPEs on its balance sheet but does not recognize the assets or liabilities of QSPEs. QSPEs are employed extensively in the Company’s mortgage and asset securitization business.
Certain other SPEs do not meet the requirements of a QSPE, because their activities are not sufficiently limited or they have entered into certain non-qualifying transactions. The Company follows the criteria in FIN No. 46 (R) in determining whether it should consolidate such entities. These SPEs are commonly employed in collateralized debt obligation transactions where portfolio managers require the ability to buy and sell assets or in synthetic credit transactions.
In addition to the above, in the ordinary course of business the Company issues various guarantees to counterparties in connection with certain derivatives, leasing, securitization and other transactions. See Note 18, “Guarantees,” in the Notes to Consolidated Financial Statements for a complete discussion on guarantees.
DERIVATIVE FINANCIAL INSTRUMENTS
Derivative financial instruments are contractual commitments between counterparties that derive their values from changes in an underlying interest rate, currency exchange rate, index (e.g., S&P 500), reference rate (e.g., LIBOR), or asset value referenced in the related contract. Some derivatives, such as futures contracts, certain options and index-referenced warrants, can be traded on an exchange. Other derivatives, such as interest rate and currency swaps, caps, floors, collars, swaptions, equity swaps and options, structured notes and forward contracts, are negotiated in the over-the-counter markets. Derivatives generate both on- and off-balance-sheet risks depending on the nature of the contract. The Company is engaged as a dealer in over-the-counter derivatives and, accordingly, enters into transactions involving derivative instruments as part of its customer-related and proprietary trading activities.
The Company’s dealer activities require it to make markets and trade a variety of derivative instruments. In connection with these activities, the Company attempts to mitigate its exposure to market risk by entering into hedging transactions that may include over-the-counter derivatives contracts or the purchase or sale of interest-bearing securities, equity securities, financial futures and forward contracts. The Company also utilizes derivative instruments to hedge proprietary market-making and trading activities. In this regard, the utilization of derivative instruments is designed to reduce or mitigate market risks associated with holding dealer inventories or in connection with arbitrage-related trading activities. The Company also utilizes interest rate and currency swaps, futures contracts and US Treasury positions to hedge its debt issuances as part of its asset and liability management.
In connection with the Company’s dealer activities, the Company formed Bear Stearns Financial Products Inc. (“BSFP”) and its wholly owned subsidiary, Bear Stearns Trading Risk Management Inc. (“BSTRM”). BSFP is a wholly owned subsidiary of the Company. BSFP and BSTRM were established to provide clients with a AAA-rated counterparty that offers a wide range of global derivative products. BSFP is structured so that if a specified trigger event (including certain credit rating downgrades of the Company, the failure of BSFP to maintain its credit rating and
57
MANAGEMENT’S DISCUSSION AND ANALYSIS
continued
the occurrence of a bankruptcy event with respect to the Company) occurs, BSFP will perform on all of its contracts to their original maturities with the assistance of an independent derivatives portfolio manager who would assume the active management of BSFP’s portfolio. BSTRM is structured so that, on the occurrence of a specified trigger event, it will cash-settle all outstanding derivative contracts in a predetermined manner. Clients can use either structure. The AAA/Aaa ratings that BSFP and BSTRM have received are based on their ability to meet their respective obligations without any additional capital from the Company. In the unlikely occurrence of a trigger event, the Company does not expect any significant incremental impact on the liquidity or financial condition of the Company. At November 30, 2005, there was no potential cash settlement payable by BSTRM on the occurrence of a trigger event.
To measure derivative activity, notional or contract amounts are frequently used. Notional/contract amounts are used to calculate contractual cash flows to be exchanged and are generally not actually paid or received, with the exception of currency swaps, foreign exchange forwards and mortgage-backed securities forwards. The notional/contract amounts of financial instruments that give rise to off-balance-sheet market risk are indicative only to the extent of involvement in the particular class of financial instruments and are not necessarily an indication of overall market risk.
As of November 30, 2005 and November 30, 2004, the Company had notional/contract amounts of approximately $5.45 trillion and $3.50 trillion, respectively, of derivative financial instruments, of which $1.13 trillion and $692.0 billion, respectively, were listed futures and option contracts. The aggregate notional/contract value of derivative contracts is a reflection of the level of activity and does not represent the amounts that are recorded in the Consolidated Statements of Financial Condition. The Company’s derivative financial instruments outstanding, which either are used to hedge trading positions, modify the interest rate characteristics of its long- and short-term debt, or are part of its derivative dealer activities, are marked to fair value.
The Company’s derivatives had a notional weighted average maturity of approximately 4.1 years and 4.0 years at November 30, 2005 and November 30, 2004, respectively. The maturities of notional/contract amounts outstanding for derivative financial instruments as of November 30, 2005 were as follows:
|
|
|
|
|
|
|
|
|
|
|
|
|
|
|
|
|
|
|
|
| Less Than |
| One to Three |
| Three to Five |
| Greater Than |
|
|
|
| ||||||
|
| One Year |
| Years |
| Years |
| Five Years |
| Total |
| |||||||
| ||||||||||||||||||
(in billions) |
|
|
|
|
|
|
|
|
|
|
|
|
|
|
|
|
|
|
| ||||||||||||||||||
Swap agreements, including options, swaptions, caps, collars and floors |
|
| $ | 880.3 |
|
| $ | 1,075.1 |
| $ | 1,041.5 |
| $ | 1,224.9 |
| $ | 4,221.8 |
|
Futures contracts |
|
|
| 285.4 |
|
|
| 160.3 |
|
| 24.1 |
|
| — |
|
| 469.8 |
|
Forward contracts |
|
|
| 76.3 |
|
|
| — |
|
| — |
|
| — |
|
| 76.3 |
|
Options held |
|
|
| 383.7 |
|
|
| 112.3 |
|
| 1.3 |
|
| 0.2 |
|
| 497.5 |
|
Options written |
|
|
| 145.3 |
|
|
| 38.5 |
|
| 1.6 |
|
| 0.2 |
|
| 185.6 |
|
| ||||||||||||||||||
Total |
|
| $ | 1,771.0 |
|
| $ | 1,386.2 |
| $ | 1,068.5 |
| $ | 1,225.3 |
| $ | 5,451.0 |
|
| ||||||||||||||||||
Percent of total |
|
|
| 32.5 | % |
|
| 25.4 | % |
| 19.6 | % |
| 22.5 | % |
| 100.0 | % |
| ||||||||||||||||||
The consolidated financial statements of the Company are prepared in conformity with accounting principles generally accepted in the United States of America. These principles require management to make certain estimates and assumptions that could materially affect reported amounts in the financial statements (see Note 1, “Summary of Significant Accounting Policies,” in the Notes to Consolidated Financial Statements). Critical accounting policies are those policies that are the most important to the financial statements and/or those that require significant management judgment related to matters that are uncertain.
58
MANAGEMENT’S DISCUSSION AND ANALYSIS
continued
Valuation of Financial Instruments
The Company has identified the valuation of financial instruments as a critical accounting policy due to the complex nature of certain of its products, the degree of judgment required to appropriately value these products and the pervasive impact of such valuation on the financial condition and earnings of the Company.
The Company’s financial instruments can be aggregated in three broad categories: (1) those whose fair value is based on quoted market prices or for which the Company has independent external valuations, (2) those whose fair value is determined based on readily observable price levels for similar instruments and/or models or methodologies that employ data that are observable from objective sources, and (3) those whose fair value is estimated based on internally developed models or methodologies utilizing significant assumptions or other data that are generally less readily observable from objective sources.
(1) Financial Instruments Valued Based on Quoted Market Prices or for Which the Company Has Independent External Valuations
The Company’s valuation policy is to use quoted market prices from securities and derivatives exchanges where they are available and reliable. Financial instruments valued based on quoted market prices are primarily exchange-traded derivatives and listed equities. Financial instruments that are most typically valued using alternative approaches but for which the Company typically receives independent external valuation information include US Treasuries, most mortgage-backed securities and corporate, emerging market, high yield and municipal bonds. Unlike most equities, which tend to be traded on exchanges, the vast majority of fixed income trading (including US Treasuries) occurs in over-the-counter markets, and, accordingly, the Company’s valuation policy is based on its best estimate of the prices at which these financial instruments trade in those markets. The Company is an active dealer in most of the over-the-counter markets for these financial instruments, and typically has considerable insight into the trading level of financial instruments held in inventory and/or related financial instruments that it uses as a basis for its valuation.
(2) Financial Instruments Whose Fair Value Is Determined Based on Internally Developed Models or Methodologies That Employ Data That Are Readily Observable from Objective Sources
The second broad category consists of financial instruments for which the Company does not receive quoted prices; therefore, models or other methodologies are utilized to value these financial instruments. Such models are primarily industry-standard models that consider various assumptions, including time value, yield curve, volatility factors, prepayment speeds, default rates, loss severity, current market and contractual prices for the underlying financial instruments, as well as other relevant economic measures. Substantially all these assumptions are observable in the marketplace, can be derived from observable data or are supported by observable levels at which transactions are executed in the marketplace. A degree of subjectivity is required to determine appropriate models or methodologies as well as appropriate underlying assumptions. This subjectivity makes these valuations inherently less reliable than quoted market prices. Financial instruments in this category include non-exchange-traded derivatives such as interest rate swaps, certain mortgage-backed securities and certain other cash instruments. For an indication of the Company’s involvement in derivatives, including maturity terms, see the table setting forth notional/contract amounts outstanding in the preceding “Derivative Financial Instruments” section.
(3) Financial Instruments Whose Fair Value Is Estimated Based on Internally Developed Models or Methodologies Utilizing Significant Assumptions or Other Data That Are Generally Less Readily Observable from Objective Sources
Certain complex financial instruments and other investments have significant data inputs that cannot be validated by reference to readily observable data. These instruments are typically illiquid, long dated or unique in nature and therefore engender considerable judgment by traders and their management who, as dealers in many of these
59
MANAGEMENT’S DISCUSSION AND ANALYSIS
continued
instruments, have the appropriate knowledge to estimate data inputs that are less readily observable. For certain instruments, extrapolation or other methods are applied to observed market or other data to estimate assumptions that are not observable.
The Company follows Emerging Issues Task Force (“EITF”) Statement No. 02-3, “Issues Involved in Accounting for Derivative Contracts Held for Trading Purposes and Contracts Involved in Energy Trading and Risk Management Activities.” This guidance generally eliminates the practice of recognizing profit at the inception of a derivative contract unless the fair value of the derivative is obtained from a quoted market price in an active market or is otherwise evidenced by comparison to other observable current market transactions or based on a valuation technique that incorporates observable market data.
The Company participates in the underwriting, securitization or trading of non-performing mortgage-related assets, real estate assets and certain residuals. In addition, the Company has a portfolio of Chapter 13 and other credit card receivables from individuals. Certain of these high yield positions have limited price observability. In these instances, fair values are determined by statistical analysis of historical cash flows, default probabilities, recovery rates, time value of money and discount rates considered appropriate given the level of risk in the instrument and associated investor yield requirements.
The Company is also engaged in structuring and acting as principal in complex derivative transactions. Complex derivatives include certain long-dated equity derivatives, certain credit and municipal derivatives and other exotic derivative structures. These non-exchange-traded instruments may have immature or limited markets and, by their nature, involve complex valuation methodologies and models, which are often refined to correlate with the market risk of these instruments.
At November 30, 2005 and November 30, 2004, the total value of all financial instruments whose fair value is estimated based on internally developed models or methodologies utilizing significant assumptions or other data that are generally less readily observable from objective sources (primarily fixed income cash positions) aggregated approximately $6.7 billion and $4.0 billion, respectively, in “Financial Instruments Owned” and $3.4 billion and $1.6 billion, respectively, in “Financial Instruments Sold, But Not Yet Purchased” in the Consolidated Statements of Financial Condition.
Controls Over Valuation of Financial Instruments
In recognition of the importance the Company places on the accuracy of its valuation of financial instruments as described in the three categories above, the Company engages in an ongoing internal review of its valuations. Members of the Controllers and Risk Management Departments perform analysis of internal valuations, typically on a monthly basis but often on an intra-month basis as well. These departments are independent of the trading areas responsible for valuing the positions. Results of the monthly validation process are reported to the Mark-to-Market (“MTM”) Committee, which is composed of senior management from the Risk Management and Controllers Departments. The MTM Committee is responsible for ensuring that the approaches used to independently validate the Company’s valuations are robust, comprehensive and effective. Typical approaches include valuation comparisons with external sources, comparisons with observed trading, independent comparisons of key model valuation inputs, independent trade modeling and a variety of other techniques.
Merchant Banking
As part of its merchant banking activities, the Company participates from time to time in principal investments in leveraged transactions. As part of these activities, the Company originates, structures and invests in merger, acquisition, restructuring and leveraged capital transactions, including leveraged buyouts. The Company’s principal investments in
60
MANAGEMENT’S DISCUSSION AND ANALYSIS
continued
these transactions are generally made in the form of equity investments, equity-related investments or subordinated loans and have not historically required significant levels of capital investment.
Equity interests and securities acquired as a result of leveraged acquisition transactions are reflected in the consolidated financial statements at their initial cost until significant transactions or developments indicate that a change in the carrying value of the securities is appropriate. Generally, the carrying values of these securities will be increased only in those instances where market values are readily ascertainable by reference to substantial transactions occurring in the marketplace or quoted market prices. If quoted market prices are not available, or if liquidating the Company’s position is reasonably expected to affect market prices, fair value is determined based on other relevant factors. Reductions to the carrying value of these securities are made in the event that the Company’s estimate of net realizable value has declined below the carrying value. See “Merchant Banking and Private Equity Investments” in Management’s Discussion and Analysis for additional details.
Legal, Regulatory and Tax Contingencies
In the normal course of business, the Company has been named as a defendant in various legal actions, including arbitrations, class actions and other litigation. Certain of the legal actions include claims for substantial compensatory and/or punitive damages or claims for indeterminate amounts of damages. The Company is also involved in other reviews, investigations and proceedings by governmental and self-regulatory agencies regarding the Company’s business, certain of which may result in adverse judgments, settlements, fines, penalties, injunctions or other relief.
Reserves for litigation and regulatory proceedings are generally determined on a case-by-case basis and represent an estimate of probable losses after considering, among other factors, the progress of each case, prior experience, and the experience of others in similar cases, and the opinions and views of internal and external legal counsel. Because litigation is inherently unpredictable, particularly in cases where claimants seek substantial or indeterminate damages or where investigations and proceedings are in the early stages, the Company cannot predict with certainty the loss or range of loss related to such matters, how such matters will be resolved, when they will ultimately be resolved, or what the eventual settlement, fine, penalty or other relief might be.
The Company is subject to the income tax laws of the United States, its states and municipalities and those of the foreign jurisdictions in which the Company has significant business operations. These tax laws are complex and subject to different interpretations by the taxpayer and the relevant governmental taxing authorities. The Company must make judgments and interpretations about the application of these inherently complex tax laws when determining the provision for income taxes and must also make estimates about when in the future certain items affect taxable income in the various tax jurisdictions. Disputes over interpretations of the tax laws may be settled with the taxing authority upon examination or audit. The Company regularly evaluates the likelihood of assessments in each of the taxing jurisdictions resulting from current and subsequent years’ examinations and tax reserves are established as appropriate.
The Company establishes reserves for potential losses that may arise out of litigation, regulatory proceedings and tax audits to the extent that such losses are probable and can be estimated, in accordance with SFAS No. 5, “Accounting for Contingencies.” Once established, reserves are adjusted as additional information becomes available or when an event requiring a change to the reserves occurs. Significant judgment is required in making these estimates and the ultimate resolution may differ materially from the amounts reserved.
ACCOUNTING AND REPORTING DEVELOPMENTS
In December 2004, the FASB issued SFAS No. 123 (R), “Share-Based Payment.” SFAS No. 123 (R) is a revision of SFAS No. 123, “Accounting for Stock-Based Compensation,” and supersedes APB Opinion No. 25, “Accounting for Stock Issued to Employees,” and amends SFAS No. 95, “Statement of Cash Flows.” SFAS No. 123 (R) eliminates the ability to account for share-based compensation transactions using APB Opinion No. 25 and requires all share-based
61
MANAGEMENT’S DISCUSSION AND ANALYSIS
continued
payments to employees, including grants of employee stock options, to be recognized in the financial statements using a fair value-based method. Effective December 1, 2002, the Company elected to adopt fair value accounting for stock-based compensation consistent with SFAS No. 123 using the prospective method with guidance provided by SFAS No. 148. In April 2005, the SEC amended the effective date of SFAS No. 123 (R) to provide additional time for companies to comply with the reporting requirements. The Company adopted SFAS No. 123 (R), as required, on December 1, 2005, using the modified prospective method. The Company does not expect that adoption of this standard will have a material impact on the consolidated financial statements of the Company.
In June 2005, the EITF reached a consensus on EITF Issue No. 04-5, “Determining Whether a General Partner, or the General Partners as a Group, Controls a Limited Partnership or Similar Entity When the Limited Partners Have Certain Rights.” The EITF consensus requires a general partner in a limited partnership to consolidate the limited partnership unless the presumption of control is overcome. The general partner may overcome this presumption of control and not consolidate the entity if the limited partners have: (a) the substantive ability to dissolve or liquidate the limited partnership or otherwise remove the general partner without having to show cause; or (b) substantive participating rights in managing the partnership. This guidance became effective upon ratification by the FASB on June 29, 2005 for all newly formed limited partnerships and for existing limited partnerships for which the partnership agreements have been modified. For all other limited partnerships, the guidance is effective no later than the beginning of the first reporting period in fiscal years beginning after December 15, 2005. The Company does not expect the EITF consensus on EITF issue No. 04-5 to have a material impact on the consolidated financial statements of the Company.
The Company participates, through a majority-owned joint venture, in specialist activities on the NYSE, AMEX and ISE. For fiscal 2003, the Company included revenues from specialist activities in “Principal Transactions” revenues in the Consolidated Statements of Income. Due to the occurrence of a Control Event as defined by the joint venture Operating Agreement, triggered in December 2003, the Company became the controlling shareholder. As a result, commencing in fiscal 2004, the Company began consolidating this entity.
The Company’s assets are primarily recorded at their current market value and, to a large extent, are liquid in nature. The rate of inflation affects the Company’s expenses, such as employee compensation, office leasing costs, information technology and communications charges, which may not be readily recoverable in the price of services offered by the Company. In addition, to the extent that inflation causes interest rates to rise and has other adverse effects on the securities markets and on the value of securities held in inventory, it may adversely affect the Company’s financial position and results of operations.
62
THE BEAR STEARNS COMPANIES INC.
The Company’s principal business activities engender significant market and credit risks. In addition, the Company is subject to operational, legal, funding and other risks. Effective identification, assessment and management of these risks are critical to the success and stability of the Company. As a result, comprehensive risk management procedures have been established to identify, monitor and control each of these major risks. The risk management process encompasses many units independent of the trading desks, including the Risk Management, Global Credit, Global Clearing Services, Controllers, Operations, Compliance, Legal and Financial Analytics & Structured Transactions (“F.A.S.T.”) Departments. The Company’s diverse securities industry activities help to reduce the impact that volatility in any particular market may have on its net revenues. The Treasurer’s Department is independent of trading units and is responsible for the Company’s funding and liquidity risk management. Funding and liquidity risk management are discussed in Management’s Discussion and Analysis of Financial Condition and Results of Operations in the “Liquidity and Capital Resources” section.
The Company has established various management committees that have responsibilities for monitoring and oversight of its activities and risk exposures. Some of these committees are described below.
The Executive Committee is the most senior management committee of the Company. The ultimate approval of decisions regarding the Company’s risk appetite and risk-taking capacity rests with the Executive Committee.
The Management & Compensation Committee has primary responsibility for hiring approvals and compensation-related issues. In addition, a number of decisions regarding business risk and other issues are delegated to the Management & Compensation Committee from the Executive Committee.
The Operations Committee is composed of senior managing directors from various departments, primarily representing key internal control functions. The Operations Committee ensures the coordination of key operational, control and regulatory issues across the Company.
The Risk Committee is composed of senior managing directors from each trading department as well as the Risk Management Department. The Risk Committee provides a high level of oversight to trading departments and their trading strategies.
The Credit Policy Committee is composed of senior risk, legal and business managers. The Credit Policy Committee delegates credit approval authority to the Global Credit Committee, approves exposure measurement standards, reviews concentrations of credit risk, sets documentation and credit support standards, and considers new or unusual credit-related transactions.
The Global Credit Committee, which includes several members of the Credit Policy Committee, implements policy through its review and approval of counterparty credit limits.
The Model Review Committee is composed of senior members of the Risk Management, Global Credit and F.A.S.T. Departments, as well as senior business unit managers who have experience developing and using trading models. The Model Review Committee works with staff of the Risk Management Department to ensure that trading models are independently vetted and controlled.
The Principal Activities Committee is composed of senior investment banking, capital markets, credit and risk management professionals. The Principal Activities Committee reviews and approves loan underwriting proposals. Certain leveraged loan commitments, as well as large or unusual credit extensions, are referred by this committee for approval to the Company’s Executive Committee.
63
RISK MANAGEMENT
continued
The Mark-to-Market (MTM) Committee is composed of senior management from the Risk Management and Controllers Departments. The MTM Committee is responsible for ensuring that the approaches used to independently validate the Company’s valuations are robust, comprehensive and effective.
The New Products and Special Structured Transactions Committee is composed of senior management from various departments. The New Products and Special Structured Transactions Committee is responsible for ensuring that identified new businesses and products are reviewed in advance for legal, credit, operational, accounting, market and reputation risk and related concerns. The New Products and Special Structured Transactions Committee meets on a regular basis to review new business proposals and address-related issues.
The Disclosure Committee is composed of senior members of management, including the chief financial officer, controller and general counsel. The Disclosure Committee has oversight responsibilities for assisting in the review of disclosures to be made by the Company to help ensure that they are complete and accurate, fairly represent the Company’s financial condition and are in compliance with the requirements of applicable securities laws, rules and regulations of the NYSE.
The Company’s Ethics Compliance Committee is composed of the Company’s ethics compliance officer and senior management from various departments, including Administration, Legal and Compliance. The Ethics Compliance Committee is responsible for administering and enforcing the Company’s Code of Business Conduct and Ethics and ethics-related standards and procedures adopted by the Corporate Governance Committee. The Ethics Compliance Committee also evaluates potential conflicts of interest between the Company and its officers.
Market risk generally represents the risk of loss that may result from the potential change in the value of a financial instrument as a result of fluctuations in interest and currency exchange rates, equity and futures prices, changes in the implied volatility of interest rates, foreign exchange rates, equity and futures prices, and price deterioration or changes in value due to changes in market perception or actual credit quality of either the issuer or its country of origin. Market risk can be exacerbated in times of illiquidity where market participants refrain from transacting in normal quantities and/or at normal bid-offer spreads. Market risk is inherent to both cash and derivative financial instruments and, accordingly, the scope of the Company’s market risk management procedures includes all market risk-sensitive financial instruments. The Company’s exposure to market risk is directly related to its role as a financial intermediary in customer trading transactions and to its proprietary trading, investment and arbitrage activities.
The Company makes dealer markets in investment grade corporate debt, non-investment-grade corporate (“high yield”) debt, US government securities, sovereign debt, emerging markets debt obligations, mortgages and mortgage-backed securities, other collateralized securities and municipal bonds. The Company is also an active market maker and conducts block trading activities in both listed and over-the-counter equity markets. In connection with these activities, the Company may be required to maintain significant inventories to ensure availability and to facilitate customer order flow. The Company is also engaged as a dealer in both listed and over-the-counter derivatives and, accordingly, enters into transactions such as interest rate and cross-currency swaps, over-the-counter options on interest rates and foreign currencies, various credit default swaps and equity swaps and options, all as part of its customer and proprietary trading activities. In connection with these activities, the Company attempts to mitigate its exposure to market risk by entering into hedging transactions, which may include listed and over-the-counter derivatives contracts or the purchase or sale of securities, financial futures and options on futures or forward contracts. Additionally, the Company has a controlling interest in a majority-owned joint venture that transacts in specialist activities on the NYSE, AMEX and ISE. Stock exchange rules require that specialists maintain an orderly market, including purchasing shares in a declining market, which may result in trading losses.
64
RISK MANAGEMENT
continued
The Company’s arbitrage activities are designed to take advantage of market price discrepancies in securities trading in different markets, between related products or derivative instruments. Arbitrage activities involve maintaining offsetting positions in other financial instruments. In many instances, the Company may be required to purchase or sell derivative financial instruments as part of the arbitrage of a cash market security. These transactions may involve forward-settling transactions such as forwards or futures, where the objective may be to capture differences in the time value of money, or options transactions, which seek to capture differences between the expected and actual volatility of the underlying instrument. The Company attempts to mitigate market risk in these activities by entering into hedging transactions.
Managing risk at the Company begins with the expertise and experience of trading department management. Senior managing directors in each department have extensive knowledge of the specialized products, markets and activities in which they do business. Their experience and insight are supplemented by risk management procedures that monitor and evaluate the Company’s risk profile. Those procedures begin with the Company marking its financial instruments owned to fair value on a daily basis and producing daily profit and loss statements for senior management covering all trading departments.
The cornerstone of these procedures is constant communication between trading department management and senior management concerning inventory positions and market risk profile. This process culminates each week with the trading departments making formal reports of positions, profits and losses and certain trading strategies to the Risk Committee.
The Company believes that a clear understanding of how its positions generate profit or loss on a daily basis is crucial to managing risk. Many of the independent units are actively involved in ensuring the integrity and clarity of the daily profit and loss statements. Activities include daily and monthly price verification procedures, position reconciliation, review of pricing models and review of recording of complex transactions. Furthermore, the Company uses market-based credit pricing to estimate the appropriate credit reserves associated with certain counterparty credit exposures.
In addition, trading desk management, senior management and independent units also review the age and composition of proprietary accounts and review risk reports appropriate to the risk profile of each trading activity. Risk limits are established and monitored, market conditions are evaluated, certain transactions are reviewed in detail, and quantitative methods such as value-at-risk and stress testing are employed (see “Value-at-Risk”). These procedures better ensure that trading strategies are followed within acceptable risk parameters.
The Risk Management Department is independent of all trading areas and reports to the chief risk officer. The goals of the department are to understand the market risk profile of each trading area, to consolidate common risks on a firmwide basis, to articulate large trading or position risks to senior management, to provide traders with perspectives on their positions and to better ensure accurate mark-to-market pricing. The department supplements the communication between trading managers and senior management by providing its independent perspective on the Company’s market risk profile via a daily risk highlights report that is distributed to a number of senior managers in the Company.
The Company is an active participant in over-the-counter markets, including derivatives, commercial and residential mortgage loans, leveraged loans and Chapter 13 and other credit card receivables. The nature of many of these financial instruments is such that they are valued through the use of models. The complexities and reduced transparency inherent in financial instruments that are valued using models, as compared with exchange-traded prices or other quoted market valuations, introduce a particular element of operational risk into the Company’s business. In most cases, internal valuation models are developed by staff within the F.A.S.T. Department. Traders and trading management supplement and review the development efforts. A further level of review is performed by the independent model review team within the Risk Management Department. Results of the independent model review process are presented to the Model
65
RISK MANAGEMENT
continued
Review Committee. In certain cases, the Company is also able to compare its model-based valuations with counterparties in conjunction with collateral exchange agreements. Senior trading managers and independent Risk Management also emphasize the importance of two-way trading in financial instruments valued using models in order to verify the accuracy of the models. While the Company believes these controls to be effective, it is also important to note that the risk of model-based valuations is inherent in a number of the Company’s activities.
Following is a discussion of the Company’s primary market risk exposures as of November 30, 2005 and November 30, 2004, including a discussion of how those exposures are currently managed. The following discussion of the Company’s risk management procedures for its principal risks and the estimated amounts of the Company’s market risk exposure generated by the Company’s statistical analyses contains forward-looking statements. The analyses used to assess such risks are not predictions of future events, and actual results may vary significantly from such analyses due to events in the markets in which the Company operates and certain other factors as described herein.
Interest Rate Risk
Interest rate risk is a consequence of maintaining market-making and proprietary inventory positions and trading in interest rate-sensitive financial instruments. In connection with the Company’s dealer and arbitrage activities, including market making in over-the-counter derivatives contracts, the Company exposes itself to interest rate risk arising from changes in the level or volatility of interest rates, mortgage prepayment speeds or the level and shape of the yield curve. The Company’s fixed income activities also expose it to the risk of loss related to changes in credit spreads on debt instruments. Credit spread risk arises from the potential that changes in an issuer’s credit rating or credit perception could affect the value of financial instruments. Credit risk resulting from default on counterparty obligations is discussed in the “Credit Risk” section. The Company attempts to hedge its exposure to interest rate risk primarily through the use of interest rate swaps, options, eurodollar and US government securities, and futures and forward contracts designed to reduce the Company’s risk profile. Credit spread risk is hedged through the use of credit derivatives such as credit default swaps, as well as offsetting long or short positions in various related securities.
Foreign Exchange Rate Risk
Foreign exchange rate risk arises from the possibility that changes in foreign exchange rates will affect the value of financial instruments. When the Company buys or sells a foreign currency or a financial instrument denominated in a currency other than US dollars, exposure exists from a net open currency position. Until the position is covered by selling or buying the equivalent amount of the same currency or by entering into a financing arrangement denominated in the same currency, the Company is exposed to the risk that the exchange rate may move against it. The Company attempts to hedge the risk arising from its foreign exchange activities primarily through the use of currency borrowing, swaps, options, forwards and futures.
Equity Price Risk
The Company is exposed to equity price risk through making markets in equity securities, distressed debt, equity derivatives as well as specialist activities. Equity price risk results from changes in the level or volatility of equity prices, which affect the value of equity securities or instruments that derive their value from a particular stock, a basket of stocks or a stock index. The Company attempts to reduce the risk of loss inherent in its inventory of equity securities by entering into hedging transactions, including equity options and futures, designed to mitigate the Company’s market risk profile.
Value-at-Risk
An estimation of potential losses that could arise from changes in market conditions is typically accomplished through the use of statistical models known as value-at-risk (“VaR”) that seek to predict risk of loss based on historical and/or market-implied price and volatility patterns. VaR estimates the probability of the value of a financial instrument rising above or falling below a specified amount. The calculation uses the simulated changes in value of the market risk-
66
RISK MANAGEMENT
continued
sensitive financial instruments to estimate the amount of change in the current value that could occur at a specified probability level.
The Company has performed an entity-wide VaR analysis of the Company’s financial assets and liabilities, including financial instruments owned and sold, repurchase and resale agreements and funding assets and liabilities. The Company regularly evaluates and enhances such VaR models in an effort to more accurately measure risk of loss. Certain equity-method investments and non-publicly traded investments are not reflected in the VaR results. The VaR related to certain non-trading financial instruments has been included in this analysis and is not reported separately because the amounts are not material. The calculation is based on a methodology that uses a one-day interval and a 95% confidence level. The Company uses a historical simulation approach for VaR, which is supplemented by statistical risk add-ons for risk factors that do not lend themselves readily to historical simulation. Historical simulation involves the generation of price movements in a portfolio using price sensitivities, and actual historical movements of the underlying risk factors to which the securities are sensitive. Risk factors incorporated via historical simulation include interest rate movements, yield curve shape, general market credit spreads, equity price movement, option volatility movement (for certain option types) and foreign exchange movement, among others. Risk factors incorporated via add-on factors include the risk of specific bond issuers, among others. The Company believes that its VaR methodologies are consistent with industry practices for these calculations.
VaR has inherent limitations, including reliance on historical data, which may not accurately predict future market risk, and the quantitative risk information generated is limited by the parameters established in creating the models. There can be no assurance that actual losses occurring on any one day arising from changes in market conditions will not exceed the VaR amounts shown below or that such losses will not occur more than once in 20 trading days. VaR is not likely to accurately predict exposures in markets that exhibit sudden fundamental changes or shifts in market conditions or established trading relationships. Many of the Company’s hedging strategies are structured around likely established trading relationships and, consequently, those hedges may not be effective and VaR models may not accurately predict actual results. Furthermore, VaR calculated for a one-day horizon does not fully capture the market risk of positions that cannot be liquidated in a one-day period. However, the Company believes VaR models are an established methodology for the quantification of risk in the financial services industry despite these limitations. VaR is best used in conjunction with other financial disclosures in order to assess the Company’s risk profile.
The aggregate VaR presented here is less than the sum of the individual components (i.e., interest rate risk, foreign exchange rate risk, equity risk), due to the benefit of diversification among the risks. Diversification benefit equals the difference between aggregate VaR and the sum of the VaRs for the three risk categories. This benefit arises because the simulated one-day losses for each of the three primary market risk categories occur on different days and because of general diversification benefits introduced when risk is measured across a larger set of specific risk factors than exist in the respective categories; similar diversification benefits also are taken into account across risk factors within each category. The following table illustrates the VaR for each component of market risk as of November 30, 2005 and 2004. Commodity risk has been excluded due to immateriality at November 30, 2005 and 2004.
|
|
|
|
|
|
|
|
|
|
|
|
| 2005 |
|
| 2004 |
| ||
| |||||||||
(in millions) |
|
|
|
|
|
|
|
|
|
| |||||||||
MARKET RISK |
|
|
|
|
|
|
|
|
|
Interest rate |
|
| $ | 22.1 |
|
| $ | 15.3 |
|
Currency |
|
|
| 0.3 |
|
|
| 1.4 |
|
Equity |
|
|
| 3.6 |
|
|
| 2.8 |
|
Diversification benefit |
|
|
| (4.6 | ) |
|
| (4.7 | ) |
| |||||||||
Aggregate VaR |
|
| $ | 21.4 |
|
| $ | 14.8 |
|
| |||||||||
67
RISK MANAGEMENT
continued
The table below illustrates the high, low and average VaR for each component of market risk and aggregate market risk during fiscal 2005 (calculated on a daily basis) and fiscal 2004 (calculated on a monthly basis):
|
|
|
|
|
|
|
|
|
|
|
|
|
|
|
|
|
|
|
|
|
|
|
| Fiscal 2005 |
|
|
| Fiscal 2004 |
| ||||||||||||||
|
|
|
|
| |||||||||||||||||
|
| High |
| Low |
| Average |
|
|
| High |
| Low |
| Average |
| ||||||
|
|
| |||||||||||||||||||
(in millions) |
|
|
|
|
|
|
|
|
|
|
|
|
|
|
|
|
|
|
|
|
|
|
|
| |||||||||||||||||||
MARKET RISK |
|
|
|
|
|
|
|
|
|
|
|
|
|
|
|
|
|
|
|
|
|
Interest rate |
| $ | 30.6 |
| $ | 11.9 |
| $ | 22.1 |
|
|
| $ | 16.3 |
| $ | 13.3 |
| $ | 15.1 |
|
Currency |
|
| 3.4 |
|
| 0.0 |
|
| 1.2 |
|
|
|
| 2.2 |
|
| 0.7 |
|
| 1.5 |
|
Equity |
|
| 5.3 |
|
| 0.7 |
|
| 2.9 |
|
|
|
| 7.2 |
|
| 2.7 |
|
| 4.6 |
|
Aggregate VaR |
|
| 31.4 |
|
| 11.9 |
|
| 20.5 |
|
|
|
| 17.4 |
|
| 14.4 |
|
| 15.8 |
|
|
|
| |||||||||||||||||||
As previously discussed, the Company utilizes a wide variety of market risk management methods, including trading limits; marking all positions to market on a daily basis; daily profit and loss statements; position reports; daily risk highlight reports; aged inventory position reports; and independent verification of inventory pricing. Additionally, management of each trading department reports positions, profits and losses and notable trading strategies to the Risk Committee on a weekly basis. The Company believes that these procedures, which stress timely communication among traders, trading department management and senior management, are the most important elements of the risk management process.
Stress testing (also referred to as scenario analysis) measures the risk of loss over a variety of extreme market conditions that are defined in advance. Stress testing is a key methodology used in the management of market risk as well as counterparty credit risk (see “Credit Risk”). Stress tests are calculated at the firmwide level for particular trading books, customer accounts and individual positions. Stress tests are performed on a regular basis as well as on an ad hoc basis, as deemed appropriate. The ongoing evaluation process of trading risks as well as the consideration of new trading positions commonly incorporates an ad hoc discussion of “what-if” stressed market conditions and their impact on profitability. This analysis varies in its degree of formality based on the judgment of trading department management, risk management and senior managers. While the Company recognizes that no methodology can perfectly predict future market conditions, it believes that these tools are an important supplement to the Company’s risk management process. The Company expects to continue to develop and refine its formal stress testing methodologies.
The following chart represents a summary of the daily principal transactions revenues and reflects a combination of trading revenues, net interest revenues for certain trading areas and other revenues for the fiscal years ended November 30, 2005 and 2004. The chart represents a historical summary of the results generated by the Company’s trading activities as opposed to the probability approach used by the VaR model. The average daily trading profit was $15.2 million and $14.2 million for the fiscal years ended November 30, 2005 and 2004, respectively. There were nine daily trading losses for the fiscal year ended November 30, 2005 and eight daily trading losses for the fiscal year ended November 30, 2004. Daily trading losses never exceeded the reported average VaR amounts during the fiscal years ended November 30, 2005 and 2004. The frequency distribution of the Company’s daily net trading revenues reflects the Company’s historical ability to manage its exposure to market risk and the diversified nature of its trading activities. Market conditions were favorable for the Company’s trading activity in both its fiscal years ending November 30, 2005 and 2004. Hedging strategies were generally effective as established trading relationships remained substantially intact and volatility tended to be lower than historical norms. No guarantee can be given regarding future net trading revenues or future earnings volatility. However, the Company believes that these results are indicative of its commitment to the management of market trading risk.
68
RISK MANAGEMENT
continued
DISTRIBUTION OF DAILY NET TRADING REVENUES
FISCAL YEARS ENDED NOVEMBER 30, 2005 AND NOVEMBER 30, 2004
Credit risk arises from potential non-performance by counterparties, customers, borrowers or debt security issuers. The Company is exposed to credit risk as trading counterparty to dealers and customers, as direct lender, as holder of securities and as member of exchanges and clearing organizations. The Company has established policies and procedures to manage credit risk.
Dedicated professionals in several departments contribute to the administration of the Company’s credit policies and procedures. The responsible groups include Global Credit, Operations and Administration (Margin), Risk Management, Global Clearing Services (Prime Brokerage) and Investment Banking.
The Global Credit Department monitors and controls extensions of credit to customers and dealer counterparties and, in conjunction with the Credit Policy Committee and its subcommittee, the Global Credit Committee, establishes and reviews appropriate credit limits and collateral requirements for customers and dealer counterparties. Credit limits are set to control potential exposure arising from repurchase and resale agreements, stock borrowing or loan facilities, derivative financial instruments and other products that may give rise to secured and unsecured credit exposure.
The Global Credit Department professionals assess the creditworthiness of the Company’s counterparties, assign an internal credit rating that reflects the Global Credit Department’s quantitative and qualitative assessment of each counterparty’s relative probability of default, and assign or recommend credit limits and requirements. In addition, credit and quantitative analysts assess the quality and acceptability of collateral, measure potential credit exposure associated with certain transactions, monitor compliance with credit limits, obtain appropriate legal documentation and provide comprehensive credit risk reporting for senior management.
69
RISK MANAGEMENT
continued
The Company measures its actual credit exposure (the replacement cost of counterparty contracts) on a daily basis. Master netting agreements, collateral and credit insurance are used to mitigate counterparty credit risk. The credit exposures reflect these risk-reducing features to the extent they are legally enforceable. The Company’s net replacement cost of derivatives contracts in a gain position at November 30, 2005 and November 30, 2004 approximated $4.41 billion and $4.56 billion, respectively. Exchange-traded financial instruments, which typically are guaranteed by a highly rated clearing organization, have margin requirements that substantially mitigate risk of credit loss.
The following table summarizes the counterparty credit quality of the Company’s exposure with respect to over-the-counter derivatives (including foreign exchange and forward-settling mortgage transactions) as of November 30, 2005:
Over-the-Counter Derivatives Credit Exposure(1)
|
|
|
|
|
|
|
|
|
|
|
|
|
|
Rating(2) |
| Exposure |
| Collateral(3) |
| Exposure, |
| Percentage |
| ||||
| |||||||||||||
(in millions) |
|
|
|
|
|
|
|
|
|
|
|
|
|
| |||||||||||||
AAA |
| $ | 1,286 |
| $ | 156 |
| $ | 1,189 |
|
| 27 | % |
AA |
|
| 3,654 |
|
| 1,953 |
|
| 1,805 |
|
| 41 | % |
A |
|
| 2,361 |
|
| 1,410 |
|
| 1,030 |
|
| 23 | % |
BBB |
|
| 312 |
|
| 361 |
|
| 161 |
|
| 4 | % |
BB and lower |
|
| 1,342 |
|
| 2,914 |
|
| 191 |
|
| 4 | % |
Non-rated |
|
| 37 |
|
| 5 |
|
| 37 |
|
| 1 | % |
| |||||||||||||
(1) Excluded are covered transactions structured to ensure that the market values of collateral will at all times equal or exceed the related exposures. The net exposure for these transactions will, under all circumstances, be zero.
(2) Internal counterparty credit ratings, as assigned by the Company’s Credit Department, converted to rating agency equivalents.
(3) For lower-rated counterparties, the Company generally receives collateral in excess of the current market value of derivatives contracts.
(4) In calculating exposure net of collateral, collateral amounts are limited to the amount of current exposure for each counterparty. Excess collateral is not applied to reduce exposure because such excess in one counterparty portfolio cannot be applied to deficient collateral in a different counterparty portfolio.
The Company establishes potential exposure limits across a variety of financing and trading products for all counterparties on a group and individual entity basis. Potential exposure is the statistically estimated net credit exposure associated with adverse market moves over the life of transactions at a 97.7% confidence interval. For over-the-counter derivatives and foreign exchange contracts, the potential exposure is estimated daily, using sophisticated, internally developed risk models that employ Monte Carlo simulations. Potential exposure estimates consider the size and maturity of contracts; the volatility of, and correlations among, the underlying assets, indices and currencies; settlement mechanisms; rights to demand additional collateral; and other legally enforceable credit mitigants such as third-party guarantees or insurance. For other credit-sensitive fixed income products, potential exposure limits are converted to notional amounts using appropriate risk factors.
The Company establishes country concentration limits and monitors actual and potential exposures, including both position and counterparty exposures, in emerging markets. The Sovereign Risk Unit evaluates international macroeconomic conditions and recommends country concentration limits. The Company limits and monitors its exposure to sovereign default, devaluation and inconvertibility of local currencies.
The Margin Department is responsible for evaluating the risk of extending loans to the Company’s customers secured by certain marketable securities. The department evaluates the acceptability of collateral and actively monitors to ensure that collateral received meets regulatory and internal requirements. Internal (or “house”) margin requirements generally exceed minimum regulatory requirements and may be adjusted for specific securities based on volatility or
70
RISK MANAGEMENT
continued
liquidity. The Special Credit Services unit of the Global Credit Department evaluates and sets terms for loans secured by restricted or control stock, emerging markets securities and concentrated or less liquid securities.
The Risk Management Department is responsible for monitoring the market risk of the Company’s proprietary positions. As part of its duties, the group evaluates the credit quality of securities positions held in inventory to quantify and limit the risk to the Company of issuer default or changes in credit spreads. In a similar manner, the department also evaluates the credit quality of reference issuer obligations associated with derivatives contracts whose values are linked to the credit quality or credit spread trading level of reference issuers. The department monitors issuer credit exposures across the various cash and derivatives trading desks that trade in securities or derivatives of the same or related issuers to monitor aggregate exposures. This process also aggregates counterparty credit exposures with issuer exposures to produce a more comprehensive perspective on the Company’s exposure to credit risks.
The Company is subject to concentration risk by holding large positions or committing to hold large positions in certain types of securities, securities of a single issuer, including governments, issuers located in a particular country or geographic area, or issuers engaged in a particular industry. Positions taken and commitments made by the Company, including underwriting, often involve substantial amounts and significant exposure to individual issuers and businesses, including non-investment-grade issuers. At November 30, 2005, the Company’s most significant concentrations are related to US government and agency inventory positions, including those of the Federal National Mortgage Association (“Fannie Mae”) and the Federal Home Loan Mortgage Corporation (“Freddie Mac”). In addition, a substantial portion of the collateral held by the Company for reverse repurchase agreements consists of securities issued by the US government and agencies. The Company seeks to limit concentration risk through the use of the systems and procedures described in the preceding discussions of market and credit risk.
Global Clearing Services carries the accounts of professional clients, including floor traders and specialists, arbitrageurs, broker-dealers, hedge funds and fund of funds groups. These clients employ a wide variety of trading styles, including option hedging, market-neutral statistical arbitrage, risk arbitrage, hedged convertible strategies and multiple fixed income strategies. Trading strategies are employed in both domestic and international markets. The extension of credit, via secured margin debt for a given customer, is determined by the Risk Department of Global Clearing Services using a systematic analysis of the securities held and trading strategy that such customer employs. Global Clearing Services has established a risk-based margin lending policy under which the minimum capital requirement for a portfolio may be greater than the applicable regulatory capital requirement for the sum of the underlying constituents of that portfolio.
Client portfolios are analyzed and evaluated daily through extensive stress testing simulations designed to estimate market-related risk under different scenarios. Using its internally developed risk management system, known as RACS (Risk Analytic Control System), the Risk Department is able to analyze every professional client’s portfolio prior to each market opening and track that portfolio on an intra-day basis. Client positions are simulated across more than 200 different scenarios, resulting in a wide variety of potential profit and loss possibilities. Some basic assumptions used in the analysis are minimum portfolio moves of 20% as well as minimum moves in individual securities of 25% or more. Other scenarios include price movement tests of 1 and 2 standard deviations, fixed percentage moves and beta-weighted and market capitalization-driven extreme price moves. Scenarios are constructed in such a way as to assess position and portfolio sensitivities to changes in underlying prices, volatilities, interest rates, credit spreads, cross-currency rates and forward time horizons. Experienced managers review the results of the stress testing to determine whether additional margin is necessary. In addition to client-level security and portfolio analysis, the system produces over 40 various reports that provide multi-dimensional views, which include industry exposures, country/region exposures and security concentration and liquidity risk.
The Loan Portfolio Management Group is responsible for managing the credit risk in the Company’s loan portfolio. The group is responsible for evaluating transactions originated by investment bankers and advising on pricing or other
71
RISK MANAGEMENT
continued
considerations during the due diligence process. Specific portfolio limits have been established for the various types of lending, and there are formally approved guidelines for hedging the loan portfolio.
Operational risk is the potential for loss arising from inadequate or failed internal process, people or systems, or from external events. This includes, but is not limited to, limitations in the Company’s financial systems and controls, deficiencies in legal documentation, non-compliance with the execution of legal, regulatory and fiduciary responsibilities, deficiencies in technology and the risk of loss attributable to operational problems. These risks are less direct than credit and market risk, but managing them is critical, particularly in a rapidly changing environment with increasing regulation and transaction volumes. In an effort to reduce or mitigate these risks, the Company has established and maintains an internal control environment that incorporates various control mechanisms at different levels throughout the organization and within such departments as Controllers, Operations, Legal, Risk Management, Global Credit, Compliance and Internal Audit. These control mechanisms are designed to better ensure that operational policies and procedures are being followed and that the Company’s various businesses are operating within established corporate policies and limits.
In addition to these existing control mechanisms, the Company has an Operational Risk Management function with a view to facilitating internal communication, disclosure, and supervisory review of operational risk management practices. The Operational Risk Management function has responsibilities related to the development, consistent application and oversight of operational risk policies, processes and procedures firmwide. The function is independent of all business units and formally reports to the chief risk officer.
Management of the Company has established and maintains effective internal control over financial reporting. Internal control over financial reporting is a process designed to provide reasonable assurance regarding the reliability of financial reporting and the preparation of financial statements for external purposes in accordance with generally accepted accounting principles. The Company’s internal control over financial reporting includes those policies and procedures that: (i) pertain to the maintenance of records that, in reasonable detail, accurately and fairly reflect the transactions and dispositions of the assets of the Company; (ii) provide reasonable assurance that transactions are recorded as necessary to permit preparation of financial statements in accordance with generally accepted accounting principles and that receipts and expenditures of the Company are being made only in accordance with authorizations of management and directors of the Company; and (iii) provide reasonable assurance regarding prevention or timely detection of unauthorized acquisition, use or disposition of the Company’s assets that could have a material effect on the financial statements.
The Company has invested heavily in technology over the years to have the ability to gather and process information efficiently and to handle the wide variety of products and services the Company offers. In addition, the Company’s investment in technology allows the Company to communicate information efficiently and securely to customers and to groups within the Company.
Legal risk includes the risk of non-compliance with applicable legal and regulatory requirements and the risk that a counterparty will not perform on its obligations due to non-credit-related conditions, including counterparty legal authority and capacity. The Company is generally subject to extensive regulation in the various jurisdictions in which it conducts its business. The Company has established procedures based on legal and regulatory requirements on a worldwide basis that are designed to ensure compliance with applicable statutory and regulatory requirements. The Company has established policies and procedures in an effort to mitigate the risk that counterparty performance obligations will be unenforceable.
72
RISK MANAGEMENT
continued
Other risks encountered by the Company include political, regulatory and tax risks. These risks reflect the potential impact that changes in local and international laws, regulatory requirements or tax statutes have on the economics and viability of current or future transactions. In an effort to mitigate these risks, the Company seeks to continuously review new and pending regulations and legislation and participates in various industry interest groups.
73
THE BEAR STEARNS COMPANIES INC.
MANAGEMENT’S REPORT ON INTERNAL CONTROL OVER FINANCIAL REPORTING
Management of The Bear Stearns Companies Inc. and subsidiaries (the “Company”) is responsible for establishing and maintaining adequate internal control over financial reporting. Internal control over financial reporting is a process designed under the supervision of the Company’s principal executive and principal financial officers to provide reasonable assurance regarding the reliability of financial reporting and the preparation of the Company’s financial statements for external purposes in accordance with generally accepted accounting principles.
The Company’s internal control over financial reporting includes those policies and procedures that: (1) pertain to the maintenance of records that, in reasonable detail, accurately and fairly reflect the transactions and dispositions of the assets of the Company; (2) provide reasonable assurance that transactions are recorded as necessary to permit preparation of financial statements in accordance with generally accepted accounting principles and that receipts and expenditures of the Company are being made only in accordance with authorizations of management and directors of the Company; and (3) provide reasonable assurance regarding prevention or timely detection of unauthorized acquisition, use or disposition of the Company’s assets that could have a material effect on the financial statements.
Because of its inherent limitations, internal control over financial reporting may not prevent or detect misstatements. Projections of any evaluation of effectiveness to future periods are subject to the risk that controls may become inadequate because of changes in conditions, or that the degree of compliance with the policies or procedures may deteriorate.
The Company’s management assessed the effectiveness of the Company’s internal control over financial reporting as of November 30, 2005. In making this assessment, the Company’s management used the criteria set forth by the Committee of Sponsoring Organizations of the Treadway Commission (COSO) in Internal Control-Integrated Framework. Based on its assessment, management believes that, as of November 30, 2005, the Company’s internal control over financial reporting is effective based on those criteria.
The Company’s independent registered public accounting firm has audited management’s assessment of the effectiveness of the Company’s internal control over financial reporting as of November 30, 2005, as stated in their report, appearing on page 75.
74
THE BEAR STEARNS COMPANIES INC.
REPORT OF INDEPENDENT REGISTERED PUBLIC ACCOUNTING FIRM
To the Board of Directors and Stockholders of The Bear Stearns Companies Inc.
We have audited management’s assessment, included in the accompanying The Bear Stearns Companies Inc. Management’s Report on Internal Control Over Financial Reporting, that The Bear Stearns Companies Inc. and subsidiaries (the “Company”) maintained effective internal control over financial reporting as of November 30, 2005, based on criteria established inInternal Control—Integrated Frameworkissued by the Committee of Sponsoring Organizations of the Treadway Commission. The Company’s management is responsible for maintaining effective internal control over financial reporting and for its assessment of the effectiveness of internal control over financial reporting. Our responsibility is to express an opinion on management’s assessment and an opinion on the effectiveness of the Company’s internal control over financial reporting based on our audit.
We conducted our audit in accordance with the standards of the Public Company Accounting Oversight Board (United States). Those standards require that we plan and perform the audit to obtain reasonable assurance about whether effective internal control over financial reporting was maintained in all material respects. Our audit included obtaining an understanding of internal control over financial reporting, evaluating management’s assessment, testing and evaluating the design and operating effectiveness of internal control, and performing such other procedures as we considered necessary in the circumstances. We believe that our audit provides a reasonable basis for our opinions.
A company’s internal control over financial reporting is a process designed by, or under the supervision of, the company’s principal executive and principal financial officers, or persons performing similar functions, and effected by the company’s board of directors, management, and other personnel, to provide reasonable assurance regarding the reliability of financial reporting and the preparation of financial statements for external purposes in accordance with generally accepted accounting principles. A company’s internal control over financial reporting includes those policies and procedures that (1) pertain to the maintenance of records that, in reasonable detail, accurately and fairly reflect the transactions and dispositions of the assets of the company; (2) provide reasonable assurance that transactions are recorded as necessary to permit preparation of financial statements in accordance with generally accepted accounting principles, and that receipts and expenditures of the company are being made only in accordance with authorizations of management and directors of the company; and (3) provide reasonable assurance regarding prevention or timely detection of unauthorized acquisition, use, or disposition of the company’s assets that could have a material effect on the financial statements.
Because of the inherent limitations of internal control over financial reporting, including the possibility of collusion or improper management override of controls, material misstatements due to error or fraud may not be prevented or detected on a timely basis. Also, projections of any evaluation of the effectiveness of the internal control over financial reporting to future periods are subject to the risk that the controls may become inadequate because of changes in conditions, or that the degree of compliance with the policies or procedures may deteriorate.
In our opinion, management’s assessment that the Company maintained effective internal control over financial reporting as of November 30, 2005, is fairly stated, in all material respects, based on the criteria established inInternal Control—Integrated Framework issued by the Committee of Sponsoring Organizations of the Treadway Commission. Also in our opinion, the Company maintained, in all material respects, effective internal control over financial reporting as of November 30, 2005, based on the criteria established inInternal Control—Integrated Frameworkissued by the Committee of Sponsoring Organizations of the Treadway Commission.
We have also audited, in accordance with the standards of the Public Company Accounting Oversight Board (United States), the consolidated statement of financial condition as of November 30, 2005 and the related consolidated statements of income, cash flows and changes in stockholders’ equity for the year ended November 30, 2005 of the Company and our report dated February 10, 2006 expressed an unqualified opinion on those financial statements.
/s/ Deloitte & Touche LLP
New York, New York
February 10, 2006
75
THE BEAR STEARNS COMPANIES INC.
REPORT OF INDEPENDENT REGISTERED PUBLIC ACCOUNTING FIRM
To the Board of Directors and Stockholders of The Bear Stearns Companies Inc.
We have audited the accompanying consolidated statements of financial condition of The Bear Stearns Companies Inc. and subsidiaries (the “Company”) as of November 30, 2005 and 2004, and the related consolidated statements of income, cash flows and changes in stockholders’ equity for each of the three years in the period ended November 30, 2005. These financial statements are the responsibility of the Company’s management. Our responsibility is to express an opinion on these financial statements based on our audits.
We conducted our audits in accordance with the standards of the Public Company Accounting Oversight Board (United States). Those standards require that we plan and perform the audit to obtain reasonable assurance about whether the financial statements are free of material misstatement. An audit includes examining, on a test basis, evidence supporting the amounts and disclosures in the financial statements. An audit also includes assessing the accounting principles used and significant estimates made by management, as well as evaluating the overall financial statement presentation. We believe that our audits provide a reasonable basis for our opinion.
In our opinion, such consolidated financial statements present fairly, in all material respects, the financial position of The Bear Stearns Companies Inc. and subsidiaries as of November 30, 2005 and 2004, and the results of their operations and their cash flows for each of the three years in the period ended November 30, 2005, in conformity with accounting principles generally accepted in the United States of America.
As discussed in Note 1, the Company adopted Statement of Financial Accounting Standards (“SFAS”) No. 123, “Accounting for Stock-Based Compensation,” as amended by SFAS No. 148, “Accounting for Stock-Based Compensation–Transition and Disclosure, an amendment of FASB Statement No. 123,” in the fiscal year ended November 30, 2003.
We have also audited, in accordance with the standards of the Public Company Accounting Oversight Board (United States), the effectiveness of the Company’s internal control over financial reporting as of November 30, 2005, based on the criteria established inInternal Control—Integrated Framework issued by the Committee of Sponsoring Organizations of the Treadway Commission and our report dated February 10, 2006 expressed an unqualified opinion on management’s assessment of the effectiveness of the Company’s internal control over financial reporting and an unqualified opinion on the effectiveness of the Company’s internal control over financial reporting.
/s/ Deloitte & Touche LLP
New York,New York
February 10, 2006
76
THE BEAR STEARNS COMPANIES INC.
CONSOLIDATED STATEMENTS OF INCOME
|
|
|
|
|
|
|
|
|
|
|
|
|
Fiscal Years Ended November 30, |
|
| 2005 |
|
| 2004 |
| 2003 |
| |||
| ||||||||||||
(in thousands, except share and per share data) |
|
|
|
|
|
|
|
|
|
|
|
|
| ||||||||||||
REVENUES |
|
|
|
|
|
|
|
|
|
|
|
|
Commissions |
|
| $ | 1,200,454 |
|
| $ | 1,178,074 |
| $ | 1,077,926 |
|
Principal transactions |
|
|
| 3,836,017 |
|
|
| 3,595,595 |
|
| 3,308,306 |
|
Investment banking |
|
|
| 1,037,213 |
|
|
| 1,031,051 |
|
| 853,294 |
|
Interest and dividends |
|
|
| 5,107,019 |
|
|
| 2,317,315 |
|
| 1,955,373 |
|
Asset management and other income |
|
|
| 371,744 |
|
|
| 299,867 |
|
| 200,545 |
|
| ||||||||||||
Total revenues |
|
|
| 11,552,447 |
|
|
| 8,421,902 |
|
| 7,395,444 |
|
Interest expense |
|
|
| 4,141,653 |
|
|
| 1,609,019 |
|
| 1,400,953 |
|
| ||||||||||||
Revenues, net of interest expense |
|
|
| 7,410,794 |
|
|
| 6,812,883 |
|
| 5,994,491 |
|
| ||||||||||||
|
|
|
|
|
|
| ||||||
NON-INTEREST EXPENSES |
|
|
|
|
|
|
|
|
|
|
|
|
Employee compensation and benefits |
|
|
| 3,553,216 |
|
|
| 3,253,862 |
|
| 2,880,695 |
|
Floor brokerage, exchange and clearance fees |
|
|
| 221,553 |
|
|
| 230,652 |
|
| 180,548 |
|
Communications and technology |
|
|
| 401,673 |
|
|
| 369,176 |
|
| 365,317 |
|
Occupancy |
|
|
| 167,825 |
|
|
| 141,916 |
|
| 137,778 |
|
Advertising and market development |
|
|
| 126,678 |
|
|
| 113,800 |
|
| 106,506 |
|
Professional fees |
|
|
| 229,198 |
|
|
| 197,086 |
|
| 133,304 |
|
Other expenses |
|
|
| 503,592 |
|
|
| 484,237 |
|
| 418,074 |
|
| ||||||||||||
Total non-interest expenses |
|
|
| 5,203,735 |
|
|
| 4,790,729 |
|
| 4,222,222 |
|
| ||||||||||||
Income before provision for income taxes |
|
|
| 2,207,059 |
|
|
| 2,022,154 |
|
| 1,772,269 |
|
Provision for income taxes |
|
|
| 744,882 |
|
|
| 677,421 |
|
| 615,863 |
|
| ||||||||||||
Net income |
|
| $ | 1,462,177 |
|
| $ | 1,344,733 |
| $ | 1,156,406 |
|
| ||||||||||||
Net income applicable to common shares |
|
| $ | 1,437,856 |
|
| $ | 1,316,661 |
| $ | 1,125,031 |
|
| ||||||||||||
Basic earnings per share |
|
| $ | 11.42 |
|
| $ | 10.88 |
| $ | 9.44 |
|
Diluted earnings per share |
|
| $ | 10.31 |
|
| $ | 9.76 |
| $ | 8.52 |
|
| ||||||||||||
Weighted average common shares outstanding: |
|
|
|
|
|
|
|
|
|
|
|
|
Basic |
|
|
| 130,326,947 |
|
|
| 127,468,061 |
|
| 127,819,514 |
|
Diluted |
|
|
| 147,467,992 |
|
|
| 145,284,589 |
|
| 145,027,266 |
|
| ||||||||||||
See Notes to Consolidated Financial Statements.
Note: Certain prior year items have been reclassified to conform to the current year’s presentation.
77
THE BEAR STEARNS COMPANIES INC.
CONSOLIDATED STATEMENTS OF FINANCIAL CONDITION
|
|
|
|
|
|
|
|
|
As of November 30, |
| 2005 |
|
| 2004 |
| ||
| ||||||||
(in thousands, except share data) |
|
|
|
|
|
|
|
|
| ||||||||
ASSETS |
|
|
|
|
|
|
|
|
Cash and cash equivalents |
| $ | 5,859,133 |
|
| $ | 4,173,385 |
|
Cash and securities deposited with clearing organizations or segregated in compliance with federal regulations |
|
| 5,269,676 |
|
|
| 4,422,698 |
|
Securities purchased under agreements to resell |
|
| 42,647,603 |
|
|
| 45,395,149 |
|
Securities received as collateral |
|
| 12,426,383 |
|
|
| 8,823,117 |
|
Securities borrowed |
|
| 62,915,010 |
|
|
| 69,793,266 |
|
Receivables: |
|
|
|
|
|
|
|
|
Customers |
|
| 33,254,980 |
|
|
| 32,114,305 |
|
Brokers, dealers and others |
|
| 3,544,806 |
|
|
| 2,934,347 |
|
Interest and dividends |
|
| 433,305 |
|
|
| 315,686 |
|
|
|
|
|
|
|
|
|
|
Financial instruments owned, at fair value |
|
| 93,364,088 |
|
|
| 41,490,202 |
|
Financial instruments owned and pledged as collateral, at fair value |
|
| 12,880,333 |
|
|
| 36,906,933 |
|
|
|
| ||||||
Total financial instruments owned, at fair value |
|
| 106,244,421 |
|
|
| 78,397,135 |
|
|
|
|
|
|
|
|
|
|
Assets of variable interest entities and mortgage loan special purpose entities |
|
| 15,151,699 |
|
|
| 4,837,121 |
|
Property, equipment and leasehold improvements, net of accumulated depreciation and amortization of $968,197 and $841,008 in 2005 and 2004, respectively |
|
| 451,247 |
|
|
| 381,403 |
|
Other assets |
|
| 4,436,970 |
|
|
| 4,362,282 |
|
| ||||||||
Total Assets |
| $ | 292,635,233 |
|
| $ | 255,949,894 |
|
| ||||||||
LIABILITIES & STOCKHOLDERS’ EQUITY |
|
|
|
|
|
|
|
|
Short-term borrowings |
| $ | 20,015,727 |
|
| $ | 12,210,832 |
|
Securities sold under agreements to repurchase |
|
| 66,131,617 |
|
|
| 58,604,250 |
|
Obligation to return securities received as collateral |
|
| 12,426,383 |
|
|
| 8,823,117 |
|
Securities loaned |
|
| 10,104,325 |
|
|
| 10,718,592 |
|
Payables: |
|
|
|
|
|
|
|
|
Customers |
|
| 73,231,067 |
|
|
| 79,383,952 |
|
Brokers, dealers and others |
|
| 2,657,178 |
|
|
| 2,344,731 |
|
Interest and dividends |
|
| 796,956 |
|
|
| 568,525 |
|
Financial instruments sold, but not yet purchased, at fair value |
|
| 35,004,333 |
|
|
| 29,475,880 |
|
Liabilities of variable interest entities and mortgage loan special purpose entities |
|
| 14,321,285 |
|
|
| 4,761,981 |
|
Accrued employee compensation and benefits |
|
| 1,853,416 |
|
|
| 1,677,655 |
|
Other liabilities and accrued expenses |
|
| 1,811,898 |
|
|
| 1,546,230 |
|
| ||||||||
|
|
| 238,354,185 |
|
|
| 210,115,745 |
|
| ||||||||
Commitments and contingencies (Note 17) |
|
|
|
|
|
|
|
|
Long-term borrowings |
|
| 43,489,616 |
|
|
| 36,843,277 |
|
| ||||||||
STOCKHOLDERS’ EQUITY |
|
|
|
|
|
|
|
|
Preferred stock |
|
| 372,326 |
|
|
| 448,148 |
|
Common stock, $1.00 par value; 500,000,000 shares authorized as of November 30, 2005 and 2004; 184,805,848 shares issued as of November 30, 2005 and 2004 |
|
| 184,806 |
|
|
| 184,806 |
|
Paid-in capital |
|
| 4,109,166 |
|
|
| 3,548,379 |
|
Retained earnings |
|
| 7,492,951 |
|
|
| 6,176,871 |
|
Employee stock compensation plans |
|
| 2,600,186 |
|
|
| 2,666,879 |
|
Unearned compensation |
|
| (143,302 | ) |
|
| (158,662 | ) |
Treasury stock, at cost: |
|
|
|
|
|
|
|
|
Common stock: 70,937,640 and 81,018,928 shares as of November 30, 2005 and 2004, respectively |
|
| (3,824,701 | ) |
|
| (3,875,549 | ) |
| ||||||||
Total Stockholders’ Equity |
|
| 10,791,432 |
|
|
| 8,990,872 |
|
| ||||||||
Total Liabilities and Stockholders’ Equity |
| $ | 292,635,233 |
|
| $ | 255,949,894 |
|
| ||||||||
See Notes to Consolidated Financial Statements.
Note: Certain prior year items have been reclassified to conform to the current year’s presentation.
78
THE BEAR STEARNS COMPANIES INC.
CONSOLIDATED STATEMENTS OF CASH FLOWS
|
|
|
|
|
|
|
|
|
|
|
|
Fiscal Years Ended November 30, |
| 2005 |
|
| 2004 |
| 2003 |
| |||
| |||||||||||
(in thousands) |
|
|
|
|
|
|
|
|
|
|
|
| |||||||||||
CASH FLOWS FROM OPERATING ACTIVITIES |
|
|
|
|
|
|
|
|
|
|
|
Net income |
| $ | 1,462,177 |
|
| $ | 1,344,733 |
| $ | 1,156,406 |
|
Adjustments to reconcile net income to cash used in operating activities: |
|
|
|
|
|
|
|
|
|
|
|
Non-cash items included in net income: |
|
|
|
|
|
|
|
|
|
|
|
Depreciation and amortization |
|
| 269,169 |
|
|
| 212,575 |
|
| 175,876 |
|
Deferred income taxes |
|
| 112,937 |
|
|
| (82,575 | ) |
| (184,830 | ) |
Employee stock compensation plans |
|
| 801,216 |
|
|
| 763,162 |
|
| 729,406 |
|
Other |
|
| 7,489 |
|
|
| 8,598 |
|
| 10,467 |
|
Changes in operating assets and liabilities: |
|
|
|
|
|
|
|
|
|
|
|
Cash and securities deposited with clearing organizations or segregated in compliance with federal regulations |
|
| (846,978 | ) |
|
| 4,234,367 |
|
| (1,556,927 | ) |
Securities borrowed, net of securities loaned |
|
| 6,263,989 |
|
|
| 7,595,123 |
|
| (19,192,301 | ) |
Net receivables from brokers, dealers and others |
|
| (552,783 | ) |
|
| 2,996,454 |
|
| (3,109,166 | ) |
Financial instruments owned |
|
| (30,298,934 | ) |
|
| (21,418,456 | ) |
| (5,307,641 | ) |
Other assets |
|
| (831,155 | ) |
|
| (672,940 | ) |
| (222,153 | ) |
Securities sold under agreements to repurchase, net of securities purchased under agreements to resell |
|
| 10,274,913 |
|
|
| (432,360 | ) |
| 5,677,494 |
|
Net payables to customers |
|
| (7,293,560 | ) |
|
| (1,750,367 | ) |
| 13,311,105 |
|
Financial instruments sold, but not yet purchased |
|
| 5,528,453 |
|
|
| 2,366,733 |
|
| 2,687,874 |
|
Accrued employee compensation and benefits |
|
| 170,966 |
|
|
| 302,727 |
|
| 214,691 |
|
Other liabilities and accrued expenses |
|
| 920,154 |
|
|
| 2,355,022 |
|
| 392,248 |
|
| |||||||||||
Cash used in operating activities |
|
| (14,011,947 | ) |
|
| (2,177,204 | ) |
| (5,217,451 | ) |
| |||||||||||
CASH FLOWS FROM INVESTING ACTIVITIES |
|
|
|
|
|
|
|
|
|
|
|
Purchases of property, equipment and leasehold improvements |
|
| (202,911 | ) |
|
| (128,433 | ) |
| (36,711 | ) |
| |||||||||||
Cash used in investing activities |
|
| (202,911 | ) |
|
| (128,433 | ) |
| (36,711 | ) |
| |||||||||||
CASH FLOWS FROM FINANCING ACTIVITIES |
|
|
|
|
|
|
|
|
|
|
|
Net proceeds from (payments for) short-term borrowings |
|
| 7,804,896 |
|
|
| (1,176,830 | ) |
| (1,022,164 | ) |
Proceeds from issuances of long-term borrowings |
|
| 15,996,998 |
|
|
| 11,248,786 |
|
| 11,198,660 |
|
Payments for retirement/repurchase of long-term borrowings |
|
| (7,273,206 | ) |
|
| (6,653,510 | ) |
| (6,066,144 | ) |
Proceeds from issuances of derivatives with a financing element, net |
|
| 254,771 |
|
|
| 273,849 |
|
| 501,907 |
|
Redemption of preferred stock issued by a subsidiary |
|
| — |
|
|
| (300,000 | ) |
| — |
|
Issuance of common stock |
|
| 201,851 |
|
|
| 235,812 |
|
| 78,004 |
|
Redemption of preferred stock |
|
| (75,822 | ) |
|
| (89,037 | ) |
| (27,659 | ) |
Treasury stock purchases—common stock |
|
| (869,629 | ) |
|
| (780,827 | ) |
| (986,193 | ) |
Cash dividends paid |
|
| (139,253 | ) |
|
| (116,791 | ) |
| (104,964 | ) |
| |||||||||||
Cash provided by financing activities |
|
| 15,900,606 |
|
|
| 2,641,452 |
|
| 3,571,447 |
|
| |||||||||||
Net increase (decrease) in cash and cash equivalents |
|
| 1,685,748 |
|
|
| 335,815 |
|
| (1,682,715 | ) |
Cash and cash equivalents, beginning of year |
|
| 4,173,385 |
|
|
| 3,837,570 |
|
| 5,520,285 |
|
| |||||||||||
Cash and cash equivalents, end of year |
| $ | 5,859,133 |
|
| $ | 4,173,385 |
| $ | 3,837,570 |
|
| |||||||||||
Supplemental Disclosure of Cash Flow Information:
Cash payments for interest were $4.30 billion, $1.66 billion and $1.45 billion during the fiscal years ended November 30, 2005, 2004 and 2003, respectively. Cash payments for income taxes were $156.2 million, $525.5 million and $503.3 million for the fiscal years ended November 30, 2005, 2004 and 2003, respectively.
See Notes to Consolidated Financial Statements.
Note: Certain prior year items have been reclassified to conform to the current year’s presentation.
79
THE BEAR STEARNS COMPANIES INC.
CONSOLIDATED STATEMENTS OF CHANGES IN STOCKHOLDERS’ EQUITY
|
|
|
|
|
|
|
|
|
|
|
|
|
|
|
|
|
|
|
|
|
|
|
|
|
|
|
|
|
|
|
|
|
|
|
|
|
|
|
|
|
|
| Treasury Stock |
|
|
| |||||||||||
|
|
|
|
|
|
|
|
|
|
|
|
|
|
|
|
| ||||||||||||
|
|
|
|
|
|
|
|
|
|
|
|
|
| Adjustable-Rate |
|
|
|
|
| |||||||||
|
|
|
|
|
|
|
|
|
|
|
|
|
| Cumulative |
|
|
|
|
| |||||||||
|
|
|
|
|
|
|
|
|
| Employee |
|
|
| Preferred Stock, |
|
|
|
|
| |||||||||
|
|
|
| Common |
|
|
|
|
| Stock |
|
|
| Series A-$50 |
|
|
|
|
| |||||||||
|
| Preferred |
| Stock |
| Paid-in |
| Retained |
| Compensation |
| Unearned |
| Liquidation |
| Common |
|
|
| |||||||||
|
| Stock |
| $1 Par Value |
| Capital |
| Earnings |
| Plans |
| Compensation |
| Preference |
| Stock |
| Total |
| |||||||||
| ||||||||||||||||||||||||||||
(in thousands, except share and per share data) |
|
|
|
|
|
|
|
|
|
|
|
|
|
|
|
|
|
|
| |||||||||
| ||||||||||||||||||||||||||||
|
|
|
|
|
|
|
|
|
|
|
|
|
|
|
|
|
|
|
|
|
|
|
|
|
|
|
|
|
BALANCE, NOVEMBER 30, 2002 |
| $ | 692,832 |
| $ | 184,806 |
| $ | 2,866,290 |
| $ | 3,909,272 |
| $ | 2,213,979 |
| $ | (208,588 | ) | $ | (103,421 | ) | $ | (3,173,087 | ) | $ | 6,382,083 |
|
Net income |
|
|
|
|
|
|
|
|
|
|
| 1,156,406 |
|
|
|
|
|
|
|
|
|
|
|
|
|
| 1,156,406 |
|
Dividends declared— |
|
|
|
|
|
|
|
|
|
|
|
|
|
|
|
|
|
|
|
|
|
|
|
|
|
|
|
|
Common ($0.74 per share) |
|
|
|
|
|
|
|
|
|
|
| (80,318 | ) |
| 7,333 |
|
|
|
|
|
|
|
|
|
|
| (72,985 | ) |
Preferred |
|
|
|
|
|
|
|
|
|
|
| (31,572 | ) |
|
|
|
|
|
|
|
|
|
|
|
|
| (31,572 | ) |
Treasury stock— |
|
|
|
|
|
|
|
|
|
|
|
|
|
|
|
|
|
|
|
|
|
|
|
|
|
|
|
|
Common stock purchased |
|
|
|
|
|
|
|
|
|
|
|
|
|
|
|
|
|
|
|
|
|
|
| (986,193 | ) |
| (986,193 | ) |
(14,037,987 shares) |
|
|
|
|
|
|
|
|
|
|
|
|
|
|
|
|
|
|
|
|
|
|
|
|
|
|
|
|
Common stock issued out of treasury |
|
|
|
|
|
|
|
| 17,934 |
|
|
|
|
| (534,723 | ) |
|
|
|
|
|
|
| 596,041 |
|
| 79,252 |
|
(16,585,635 shares) |
|
|
|
|
|
|
|
|
|
|
|
|
|
|
|
|
|
|
|
|
|
|
|
|
|
|
|
|
Redemption of preferred stock |
|
| (154,417 | ) |
|
|
|
| 22,617 |
|
| 720 |
|
|
|
|
|
|
|
| 103,421 |
|
|
|
|
| (27,659 | ) |
Income tax benefit related to distributions from employee stock compensation plans |
|
|
|
|
|
|
|
| 247,475 |
|
|
|
|
|
|
|
|
|
|
|
|
|
|
|
|
| 247,475 |
|
Unearned employee stock compensation, net |
|
|
|
|
|
|
|
|
|
|
|
|
|
|
|
|
| 19,636 |
|
|
|
|
|
|
|
| 19,636 |
|
Employee stock compensation awards, net |
|
|
|
|
|
|
|
| 92,709 |
|
|
|
|
| 612,581 |
|
|
|
|
|
|
|
|
|
|
| 705,290 |
|
Amortization of preferred stock issue costs |
|
|
|
|
|
|
|
| (1,645 | ) |
|
|
|
|
|
|
|
|
|
|
|
|
|
|
|
| (1,645 | ) |
| ||||||||||||||||||||||||||||
BALANCE, NOVEMBER 30, 2003 |
| $ | 538,415 |
| $ | 184,806 |
| $ | 3,245,380 |
| $ | 4,954,508 |
| $ | 2,299,170 |
| $ | (188,952 | ) | $ | 0 |
| $ | (3,563,239 | ) | $ | 7,470,088 |
|
Net income |
|
|
|
|
|
|
|
|
|
|
| 1,344,733 |
|
|
|
|
|
|
|
|
|
|
|
|
|
| 1,344,733 |
|
Dividends declared— |
|
|
|
|
|
|
|
|
|
|
|
|
|
|
|
|
|
|
|
|
|
|
|
|
|
|
|
|
Common ($0.85 per share) |
|
|
|
|
|
|
|
|
|
|
| (94,888 | ) |
| 7,199 |
|
|
|
|
|
|
|
|
|
|
| (87,689 | ) |
Preferred |
|
|
|
|
|
|
|
|
|
|
| (28,712 | ) |
|
|
|
|
|
|
|
|
|
|
|
|
| (28,712 | ) |
Treasury stock— |
|
|
|
|
|
|
|
|
|
|
|
|
|
|
|
|
|
|
|
|
|
|
|
|
|
|
|
|
Common stock purchased |
|
|
|
|
|
|
|
|
|
|
|
|
|
|
|
|
|
|
|
|
|
|
| (780,827 | ) |
| (780,827 | ) |
(9,236,141 shares) |
|
|
|
|
|
|
|
|
|
|
|
|
|
|
|
|
|
|
|
|
|
|
|
|
|
|
|
|
Common stock issued out of treasury |
|
|
|
|
|
|
|
| 41,631 |
|
|
|
|
| (272,293 | ) |
|
|
|
|
|
|
| 468,517 |
|
| 237,855 |
|
(10,454,157 shares) |
|
|
|
|
|
|
|
|
|
|
|
|
|
|
|
|
|
|
|
|
|
|
|
|
|
|
|
|
Redemption of preferred stock |
|
| (90,267 | ) |
|
|
|
|
|
|
| 1,230 |
|
|
|
|
|
|
|
|
|
|
|
|
|
| (89,037 | ) |
Income tax benefit related to distributions from employee stock compensation plans |
|
|
|
|
|
|
|
| 163,887 |
|
|
|
|
|
|
|
|
|
|
|
|
|
|
|
|
| 163,887 |
|
Unearned employee stock compensation, net |
|
|
|
|
|
|
|
|
|
|
|
|
|
|
|
|
| 30,290 |
|
|
|
|
|
|
|
| 30,290 |
|
Employee stock compensation awards, net |
|
|
|
|
|
|
|
| 98,940 |
|
|
|
|
| 632,803 |
|
|
|
|
|
|
|
|
|
|
| 731,743 |
|
Amortization of preferred stock issue costs |
|
|
|
|
|
|
|
| (1,459 | ) |
|
|
|
|
|
|
|
|
|
|
|
|
|
|
|
| (1,459 | ) |
| ||||||||||||||||||||||||||||
|
|
|
|
|
|
|
|
|
|
|
|
|
|
|
|
|
|
|
|
|
|
|
|
|
|
|
|
|
BALANCE, NOVEMBER 30, 2004 |
| $ | 448,148 |
| $ | 184,806 |
| $ | 3,548,379 |
| $ | 6,176,871 |
| $ | 2,666,879 |
| $ | (158,662 | ) | $ | 0 |
| $ | (3,875,549 | ) | $ | 8,990,872 |
|
| ||||||||||||||||||||||||||||
See Notes to Consolidated Financial Statements.
80
THE BEAR STEARNS COMPANIES INC.
CONSOLIDATED STATEMENTS OF CHANGES IN STOCKHOLDERS’ EQUITY
(CONTINUED)
|
|
|
|
|
|
|
|
|
|
|
|
|
|
|
|
|
|
|
|
|
|
|
|
|
|
|
|
|
|
|
|
|
|
|
|
|
|
|
|
|
|
| Treasury Stock |
|
|
| |||||||||||
|
|
|
|
|
|
|
|
|
|
|
|
|
|
|
|
| ||||||||||||
|
|
|
|
|
|
|
|
|
|
|
|
|
| Adjustable-Rate |
|
|
|
|
| |||||||||
|
|
|
|
|
|
|
|
|
|
|
|
|
| Cumulative |
|
|
|
|
| |||||||||
|
|
|
|
|
|
|
|
|
| Employee |
|
|
| Preferred Stock, |
|
|
|
|
| |||||||||
|
|
|
| Common |
|
|
|
|
| Stock |
|
|
| Series A-$50 |
|
|
|
|
| |||||||||
|
| Preferred |
| Stock |
| Paid-in |
| Retained |
| Compensation |
| Unearned |
| Liquidation |
| Common |
|
|
| |||||||||
|
| Stock |
| $1 Par Value |
| Capital |
| Earnings |
| Plans |
| Compensation |
| Preference |
| Stock |
| Total |
| |||||||||
| ||||||||||||||||||||||||||||
(in thousands, except share and per share data) |
|
|
|
|
|
|
|
|
|
|
|
|
|
|
|
|
|
|
| |||||||||
| ||||||||||||||||||||||||||||
BALANCE, NOVEMBER 30, 2004 |
| $ | 448,148 |
| $ | 184,806 |
| $ | 3,548,379 |
| $ | 6,176,871 |
| $ | 2,666,879 |
| $ | (158,662 | ) | $ | 0 |
| $ | (3,875,549 | ) | $ | 8,990,872 |
|
Net income |
|
|
|
|
|
|
|
|
|
|
| 1,462,177 |
|
|
|
|
|
|
|
|
|
|
|
|
|
| 1,462,177 |
|
Dividends declared— |
|
|
|
|
|
|
|
|
|
|
|
|
|
|
|
|
|
|
|
|
|
|
|
|
|
|
|
|
Common ($1.00 per share) |
|
|
|
|
|
|
|
|
|
|
| (121,245 | ) |
| 7,181 |
|
|
|
|
|
|
|
|
|
|
| (114,064 | ) |
Preferred |
|
|
|
|
|
|
|
|
|
|
| (24,852 | ) |
|
|
|
|
|
|
|
|
|
|
|
|
| (24,852 | ) |
Treasury stock— |
|
|
|
|
|
|
|
|
|
|
|
|
|
|
|
|
|
|
|
|
|
|
|
|
|
|
|
|
Common stock purchased |
|
|
|
|
|
|
|
|
|
|
|
|
|
|
|
|
|
|
|
|
|
|
|
|
|
|
|
|
(8,483,483 shares) |
|
|
|
|
|
|
|
|
|
|
|
|
|
|
|
|
|
|
|
|
|
|
| (869,629 | ) |
| (869,629 | ) |
Common stock issued out of treasury |
|
|
|
|
|
|
|
|
|
|
|
|
|
|
|
|
|
|
|
|
|
|
|
|
|
|
|
|
(18,565,624 shares) |
|
|
|
|
|
|
|
| 12,776 |
|
|
|
|
| (729,226 | ) |
|
|
|
|
|
|
| 920,477 |
|
| 204,027 |
|
Redemption of preferred stock |
|
| (75,822 | ) |
|
|
|
|
|
|
|
|
|
|
|
|
|
|
|
|
|
|
|
|
|
| (75,822 | ) |
Income tax benefit related to distributions from employee stock compensation plans |
|
|
|
|
|
|
|
| 426,055 |
|
|
|
|
|
|
|
|
|
|
|
|
|
|
|
|
| 426,055 |
|
Unearned employee stock compensation, net |
|
|
|
|
|
|
|
|
|
|
|
|
|
|
|
|
| 15,360 |
|
|
|
|
|
|
|
| 15,360 |
|
Employee stock compensation awards, net |
|
|
|
|
|
|
|
| 123,198 |
|
|
|
|
| 655,352 |
|
|
|
|
|
|
|
|
|
|
| 778,550 |
|
Amortization of preferred stock issue costs |
|
|
|
|
|
|
|
| (1,242 | ) |
|
|
|
|
|
|
|
|
|
|
|
|
|
|
|
| (1,242 | ) |
| ||||||||||||||||||||||||||||
|
|
|
|
|
|
|
|
|
|
|
|
|
|
|
|
|
|
|
|
|
|
|
|
|
|
|
|
|
BALANCE, NOVEMBER 30, 2005 |
| $ | 372,326 |
| $ | 184,806 |
| $ | 4,109,166 |
| $ | 7,492,951 |
| $ | 2,600,186 |
| $ | (143,302 | ) | $ | 0 |
| $ | (3,824,701 | ) | $ | 10,791,432 |
|
| ||||||||||||||||||||||||||||
See Notes to Consolidated Financial Statements.
81
THE BEAR STEARNS COMPANIES INC.
NOTES TO CONSOLIDATED FINANCIAL STATEMENTS
1. SUMMARY OF SIGNIFICANT ACCOUNTING POLICIES
DESCRIPTION OF BUSINESS
The Bear Stearns Companies Inc. (the “Company”) is a holding company that, through its broker-dealer and international bank subsidiaries, principally Bear, Stearns & Co. Inc. (“Bear Stearns”), Bear, Stearns Securities Corp. (“BSSC”), Bear, Stearns International Limited (“BSIL”) and Bear Stearns Bank plc (“BSB”), is primarily engaged in business as a securities broker-dealer and operates in three principal segments: Capital Markets, Global Clearing Services and Wealth Management. Capital Markets comprises the institutional equities, fixed income and investment banking areas. Global Clearing Services provides clearance-related services for prime brokerage clients and clearance on a fully disclosed basis for introducing broker-dealers. Wealth Management comprises the private client services (“PCS”) and asset management areas. See Note 19, “Segment and Geographic Area Data,” in the Notes to Consolidated Financial Statements. The Company also conducts significant activities through other wholly owned subsidiaries, including: Bear Stearns Global Lending Limited; Custodial Trust Company; Bear Stearns Financial Products Inc.; Bear Stearns Capital Markets Inc.; Bear Stearns Credit Products Inc.; Bear Stearns Forex Inc.; EMC Mortgage Corporation; and Bear Stearns Commercial Mortgage, Inc. The Company participates, through a majority-owned joint venture, in specialist activities on the New York Stock Exchange (“NYSE”), American Stock Exchange (“AMEX”) and International Securities Exchange (“ISE”).
BASIS OF PRESENTATION
The consolidated financial statements include the accounts of the Company, its wholly owned subsidiaries and other entities in which the Company has a controlling interest. In accordance with Financial Accounting Standards Board (“FASB”) Interpretation (“FIN”) No. 46 (R), “Consolidation of Variable Interest Entities” (“FIN No. 46 (R)”), the Company also consolidates any variable interest entities (“VIEs”) for which it is the primary beneficiary. The assets and related liabilities of such variable interest entities have been shown in the Consolidated Statements of Financial Condition in the captions “Assets of variable interest entities and mortgage loan special purpose entities” and “Liabilities of variable interest entities and mortgage loan special purpose entities.” See Note 6, “Variable Interest Entities and Mortgage Loan Special Purpose Entities,” in the Notes to Consolidated Financial Statements.
When the Company does not have a controlling interest in an entity, but exerts significant influence over the entity’s operating and financial decisions (generally defined as owning a voting or economic interest of 20% to 50%), the Company applies the equity method of accounting.
All material intercompany transactions and balances have been eliminated in consolidation. Certain prior year amounts have been reclassified to conform to the current year’s presentation. During the quarter ended May 31, 2005, the Company changed the income statement presentation of certain servicing fees and asset-based retail investor advisory fees. All net servicing fees are included in the investment banking line on the Consolidated Statements of Income. Asset-based retail investor advisory fees are included in the asset management and other income line on the Consolidated Statements of Income. Within the Capital Markets segment, certain servicing fees have been reclassified from investment banking to fixed income. These reclassifications in both the Consolidated Statements of Income and the Capital Markets segment were made to prior year amounts to conform to the current year’s presentation.
The consolidated financial statements are prepared in conformity with accounting principles generally accepted in the United States of America. These principles require management to make certain estimates and assumptions, including those regarding inventory valuations, stock compensation, certain accrued liabilities and the potential outcome of litigation and tax matters, which may affect the amounts reported in the consolidated financial statements and accompanying notes. Actual results could differ materially from these estimates.
82
NOTES TO CONSOLIDATED FINANCIAL STATEMENTS
continued
FINANCIAL INSTRUMENTS
Proprietary securities, futures and other derivatives transactions are recorded on a trade date basis. Financial instruments owned and financial instruments sold, but not yet purchased, including contractual commitments arising pursuant to futures, forward and option contracts, interest rate swaps and other derivative contracts, are recorded at fair value with the resulting net unrealized gains and losses reflected in “Principal Transactions” revenues in the Consolidated Statements of Income.
Fair value is generally based on quoted market prices. If quoted market prices are not available, or if liquidating the Company’s position is reasonably expected to affect market prices, fair value is determined based on other relevant factors, including dealer price quotations, price activity for equivalent instruments and valuation pricing models. Valuation pricing models consider time value, yield curve and volatility factors, prepayment speeds, default rates, loss severity, current market and contractual prices for the underlying financial instruments, as well as other measurements.
The Company follows Emerging Issues Task Force (“EITF”) Statement No. 02-3, “Issues Involved in Accounting for Derivative Contracts Held for Trading Purposes and Contracts Involved in Energy Trading and Risk Management Activities.” This guidance generally eliminates the practice of recognizing profit at the inception of a derivative contract unless the fair value of the derivative is obtained from a quoted market price in an active market or is otherwise evidenced by comparison to other observable current market transactions or based on a valuation technique that incorporates observable market data.
Equity interests and securities acquired as a result of private equity and merchant banking activities are reflected in the consolidated financial statements at their initial costs until significant transactions or developments indicate that a change in the carrying value of the securities is appropriate. Generally, the carrying values of these securities will be increased only in those instances where market values are readily ascertainable by reference to substantial transactions occurring in the marketplace or quoted market prices. Reductions to the carrying value of these securities are made when the Company’s estimate of net realizable value has declined below the carrying value.
DERIVATIVE INSTRUMENTS AND HEDGING ACTIVITIES
The Company follows Statement of Financial Accounting Standards (“SFAS”) No. 133, “Accounting for Derivative Instruments and Hedging Activities,” as amended by SFAS No. 138, “Accounting for Certain Derivative Instruments and Certain Hedging Activities,” and SFAS No. 149, “Amendment of Statement 133 on Derivative Instruments and Hedging Activities,” which establishes accounting and reporting standards for stand-alone derivative instruments, derivatives embedded within other contracts or securities, and hedging activities. Accordingly, all derivatives, whether stand-alone or embedded within other contracts or securities (except in narrowly defined circumstances), are carried in the Company’s Consolidated Statements of Financial Condition at fair value, with changes in fair value recorded in current earnings in “Principal Transactions” revenues. Designated hedged items in fair value hedging relationships are marked for the risk being hedged, with such changes recorded in current earnings.
CUSTOMER TRANSACTIONS
Customer securities transactions are recorded on the Consolidated Statements of Financial Condition on a settlement date basis, which is generally three business days after trade date, while the related commission revenues and expenses are recorded on a trade date basis. Receivables from and payables to customers include amounts related to both cash and margin transactions. Securities owned by customers, including those that collateralize margin or other similar transactions, are generally not reflected in the Consolidated Statements of Financial Condition.
MORTGAGE SERVICING ASSETS, FEES AND ADVANCES
Mortgage servicing rights (“MSRs”), which are included in “Other Assets” on the Consolidated Statements of Financial Condition, are reported at the lower of amortized cost or market. MSRs are amortized in proportion to and over the
83
NOTES TO CONSOLIDATED FINANCIAL STATEMENTS
continued
period of estimated net servicing income. MSRs are periodically evaluated for impairment based on the fair value of those rights determined by using market-based models that discount anticipated future net cash flows considering loan prepayment predictions, interest rates, default rates, servicing costs and other economic factors. For purposes of impairment evaluation and measurement, the Company stratifies MSRs by securitizations, which are collateralized by loans with similar predominant risk characteristics. The excess of amortized cost over market value is reflected as a valuation allowance at balance sheet dates.
Contractual servicing fees, late fees and other ancillary servicing fees earned for servicing mortgage loans are reflected net of MSR amortization and impairment in investment banking revenues in the Consolidated Statements of Income. Contractual servicing fees are recognized when earned based on the terms of a servicing agreement. All other fees are recognized when received. In the normal course of its business, the Company makes principal, interest and other servicing advances to external investors on mortgage loans serviced for these investors. Such advances are generally recoverable from the mortgagors or from the proceeds received from the sales of the underlying properties. A charge to expense is recognized to the extent that servicing advances are estimated to be uncollectible under the provisions of the servicing contracts.
TRANSFERS AND SERVICING OF FINANCIAL ASSETS AND EXTINGUISHMENTS OF LIABILITIES
The Company follows SFAS No. 140, “Accounting for Transfers and Servicing of Financial Assets and Extinguishments of Liabilities—a Replacement of FASB Statement No. 125,” to account for securitizations and other transfers of financial assets and collateral. SFAS No. 140 establishes accounting and reporting standards with a financial-components approach that focuses on control. Under this approach, financial assets or liabilities are recognized when control is established and derecognized when control has been surrendered or the liability has been extinguished. Control is deemed to be relinquished only when all of the following conditions have been met: (1) the assets have been isolated from the transferor, even in bankruptcy or other receivership; (2) the transferee is a Qualifying Special Purpose Entity (“QSPE”) or has the right to pledge or exchange the assets received; and (3) the transferor has not maintained effective control over the transferred assets. The Company derecognizes financial assets transferred in securitizations provided that such transfer meets all of these criteria.
COLLATERALIZED SECURITIES TRANSACTIONS
Transactions involving purchases of securities under agreements to resell (“reverse repurchase agreements”) or sales of securities under agreements to repurchase (“repurchase agreements”) are treated as collateralized financing transactions and are recorded at their contracted resale or repurchase amounts plus accrued interest. Resulting interest income and expense is generally included in “Principal Transactions” revenues in the Consolidated Statements of Income. Reverse repurchase agreements and repurchase agreements are presented in the Consolidated Statements of Financial Condition on a net-by-counterparty basis, where permitted by generally accepted accounting principles. It is the Company’s general policy to take possession of securities with a market value in excess of the principal amount loaned plus the accrued interest thereon, in order to collateralize reverse repurchase agreements. Similarly, the Company is generally required to provide securities to counterparties to collateralize repurchase agreements. The Company’s agreements with counterparties generally contain contractual provisions allowing for additional collateral to be obtained, or excess collateral returned. It is the Company’s policy to value collateral and to obtain additional collateral, or to retrieve excess collateral from counterparties, when deemed appropriate.
Securities borrowed and securities loaned are recorded based upon the amount of cash collateral advanced or received. Securities borrowed transactions facilitate the settlement process and require the Company to deposit cash, letters of credit or other collateral with the lender. With respect to securities loaned, the Company receives collateral in the form of cash or other collateral. The amount of collateral required to be deposited for securities borrowed, or received for securities loaned, is an amount generally in excess of the market value of the applicable securities borrowed or loaned.
84
NOTES TO CONSOLIDATED FINANCIAL STATEMENTS
continued
The Company monitors the market value of securities borrowed and loaned, with excess collateral retrieved or additional collateral obtained, when deemed appropriate.
INVESTMENT BANKING AND ADVISORY SERVICES
Underwriting revenues and fees for mergers and acquisitions advisory services are accrued when services for the transactions are substantially completed. Transaction expenses are deferred until the related revenue is recognized.
ASSET MANAGEMENT AND OTHER INCOME
The Company receives advisory fees for investment management. In addition, the Company receives performance incentive fees for managing certain funds. Advisory fees are recognized over the period of advisory service. Unearned advisory fees are treated as deferred revenues and are included in other liabilities in the accompanying Consolidated Statements of Financial Condition. Performance incentive fees are recognized throughout the year as they become realizable based on achievement of specified performance targets.
FIXED ASSETS
Depreciation of property and equipment is provided by the Company on a straight-line basis over the estimated useful life of the asset. Amortization of leasehold improvements is provided on a straight-line basis over the lesser of the estimated useful life of the asset or the remaining life of the lease.
GOODWILL AND IDENTIFIABLE INTANGIBLE ASSETS
The Company accounts for goodwill and identifiable intangible assets under the provisions of SFAS No. 142, “Goodwill and Other Intangible Assets.” In accordance with this guidance, the Company does not amortize goodwill, but amortizes identifiable intangible assets over their useful lives. Goodwill is tested at least annually for impairment and identifiable intangible assets are tested for potential impairment whenever events or changes in circumstances suggest that the carrying value of an asset or asset group may not be fully recoverable in accordance with SFAS No. 144, “Accounting for the Impairment or Disposal of Long-Lived Assets.”
EARNINGS PER SHARE
Earnings per share (“EPS”) is computed in accordance with SFAS No. 128, “Earnings Per Share,” and EITF Statement No. 03-6, “Participating Securities and the Two Class Method Under FASB Statement No. 128, Earnings Per Share.” Basic EPS is computed by dividing net income applicable to common shares, adjusted for costs related to vested shares under the Capital Accumulation Plan for Senior Managing Directors, as amended (“CAP Plan”), as well as the effect of the redemption of preferred stock, by the weighted average number of common shares outstanding. Common shares outstanding includes vested units issued under certain stock compensation plans, which will be distributed as shares of common stock. Diluted EPS includes the determinants of basic EPS and, in addition, gives effect to dilutive potential common shares related to stock compensation plans.
STOCK-BASED COMPENSATION
Effective December 1, 2002, the Company elected to adopt fair value accounting for stock-based compensation consistent with SFAS No. 123, “Accounting for Stock-Based Compensation,” using the prospective method with guidance provided by SFAS No. 148, “Accounting for Stock-Based Compensation—Transition and Disclosure.” As a result, commencing with options granted after November 30, 2002, the Company expenses the fair value of stock options issued to employees over the related vesting period. Prior to December 1, 2002, the Company had elected to account for its stock-based compensation plans using the intrinsic value method prescribed by Accounting Principles Board (“APB”) Opinion No. 25, “Accounting for Stock Issued to Employees” (“APB No. 25”), as permitted by SFAS No. 123. Under the provisions of APB No. 25, compensation cost for stock options is measured as the excess, if any, of the quoted market price of the Company’s common stock at the date of grant over the amount an employee must pay to acquire the stock. Accordingly, no compensation expense had been recognized for stock option awards granted prior to
85
NOTES TO CONSOLIDATED FINANCIAL STATEMENTS
continued
December 1, 2002 because the exercise price was at the fair market value of the Company’s common stock on the grant date.
The cost related to stock-based compensation included in the determination of net income for the fiscal years ended November 30, 2005, 2004 and 2003 is less than that which would have been recognized if the fair value-based method had been applied to stock option awards since the original effective date of SFAS No. 123.
The following table illustrates the effect on net income and earnings per share if the fair value-based method had been applied to all outstanding awards in each fiscal year.
|
|
|
|
|
|
|
|
|
|
|
|
|
Fiscal Years Ended November 30, |
|
| 2005 |
|
| 2004 |
| 2003 |
| |||
| ||||||||||||
(in millions, except per share amounts) |
|
|
|
|
|
|
|
|
|
|
|
|
| ||||||||||||
Net income, as reported |
|
| $ | 1,462.2 |
|
| $ | 1,344.7 |
| $ | 1,156.4 |
|
Add: Stock-based employee compensation plans expense included in reported net income, net of related tax effect |
|
|
| 375.4 |
|
|
| 335.4 |
|
| 306.4 |
|
Deduct: Total stock-based employee compensation plans expense determined under the fair value based method, net of related tax effect |
|
|
| (387.3 | ) |
|
| (367.6 | ) |
| (359.5 | ) |
| ||||||||||||
Pro forma net income |
|
| $ | 1,450.3 |
|
| $ | 1,312.5 |
| $ | 1,103.3 |
|
| ||||||||||||
Earnings per share: |
|
|
|
|
|
|
|
|
|
|
|
|
Basic—as reported |
|
| $ | 11.42 |
|
| $ | 10.88 |
| $ | 9.44 |
|
Basic—pro forma |
|
| $ | 11.33 |
|
| $ | 10.63 |
| $ | 9.03 |
|
Diluted—as reported |
|
| $ | 10.31 |
|
| $ | 9.76 |
| $ | 8.52 |
|
Diluted—pro forma |
|
| $ | 10.23 |
|
| $ | 9.54 |
| $ | 8.16 |
|
| ||||||||||||
CASH EQUIVALENTS
The Company has defined cash equivalents as liquid investments not held for sale in the ordinary course of business with original maturities of three months or less that are not part of the Company’s trading inventory.
INCOME TAXES
The Company and certain of its subsidiaries file a US consolidated federal income tax return. The Company accounts for income taxes under the provisions of SFAS No. 109, “Accounting for Income Taxes.” Under SFAS No. 109, deferred income taxes are based on the net tax effects of temporary differences between the financial reporting and tax bases of assets and liabilities. In addition, deferred income taxes are determined by the enacted tax rates and laws expected to be in effect when the related temporary differences are expected to be reversed.
The Company is under continuous examination by various tax authorities in jurisdictions in which the Company has significant business operations. The Company regularly evaluates the likelihood of additional assessments in each of the tax jurisdictions resulting from these examinations. Tax reserves have been established, which the Company believes to be adequate in relation to the potential for additional assessments. Once established, reserves are adjusted as information becomes available or when an event requiring a change to the reserve occurs.
TRANSLATION OF FOREIGN CURRENCIES
Assets and liabilities denominated in foreign currencies are translated at fiscal year-end rates of exchange, while income statement items are translated at daily average rates of exchange during the fiscal year. Gains or losses resulting from foreign currency transactions are included in net income.
86
NOTES TO CONSOLIDATED FINANCIAL STATEMENTS
continued
ACCOUNTING AND REPORTING DEVELOPMENTS
In December 2004, the FASB issued SFAS No. 123 (R), “Share-Based Payment.” SFAS No. 123 (R) is a revision of SFAS No. 123 and supersedes APB Opinion No. 25 and amends SFAS No. 95, “Statement of Cash Flows.” SFAS No. 123 (R) eliminates the ability to account for share-based compensation transactions using APB Opinion No. 25 and requires all share-based payments to employees, including grants of employee stock options, to be recognized in the financial statements using a fair value-based method. Effective December 1, 2002, the Company elected to adopt fair value accounting for stock-based compensation consistent with SFAS No. 123 using the prospective method with guidance provided by SFAS No. 148. In April 2005, the SEC amended the effective date of SFAS No. 123 (R) to provide additional time for companies to comply with the reporting requirements. The Company adopted SFAS No. 123 (R), as required, on December 1, 2005, using the modified prospective method. The Company does not expect that adoption of this standard will have a material impact on the consolidated financial statements of the Company.
In June 2005, the EITF reached a consensus on EITF Issue No. 04-5, “Determining Whether a General Partner, or the General Partners as a Group, Controls a Limited Partnership or Similar Entity When the Limited Partners Have Certain Rights.” The EITF consensus requires a general partner in a limited partnership to consolidate the limited partnership unless the presumption of control is overcome. The general partner may overcome this presumption of control and not consolidate the entity if the limited partners have: (a) the substantive ability to dissolve or liquidate the limited partnership or otherwise remove the general partner without having to show cause; or (b) substantive participating rights in managing the partnership. This guidance became effective upon ratification by the FASB on June 29, 2005 for all newly formed limited partnerships and for existing limited partnerships for which the partnership agreements have been modified. For all other limited partnerships, the guidance is effective no later than the beginning of the first reporting period in fiscal years beginning after December 15, 2005. The Company does not expect the EITF consensus on EITF issue No. 04-5 to have a material impact on the consolidated financial statements of the Company.
2. FAIR VALUE OF FINANCIAL INSTRUMENTS
Substantially all of the Company’s assets and liabilities are carried at contracted amounts that approximate fair value. Assets that are recorded at contracted amounts approximating fair value consist largely of short-term secured receivables, including reverse repurchase agreements, securities borrowed, customer receivables and certain other receivables. Similarly, the Company’s short-term liabilities, such as bank loans, commercial paper, repurchase agreements, securities loaned, customer payables and certain other payables, are recorded at contracted amounts approximating fair value. These instruments generally have variable interest rates and/or short-term maturities, in many cases overnight, and accordingly, their fair values are not materially affected by changes in interest rates.
The estimated fair value of the Company’s long-term borrowings, based on market rates of interest and current foreign exchange rates available to the Company at November 30, 2005 for debt obligations of similar maturity, approximate carrying value as a result of applying SFAS No. 133. The Company uses derivatives to modify the interest rate characteristics of its long- and short-term debt. The Company generally enters into interest rate swaps and other transactions designed to either convert its fixed-rate debt into floating-rate debt or otherwise hedge its exposure to interest rate movements.
87
NOTES TO CONSOLIDATED FINANCIAL STATEMENTS
continued
Financial instruments owned and financial instruments sold, but not yet purchased, consisting of the Company’s proprietary trading inventories, at fair value, as of November 30, 2005 and 2004, were as follows:
|
|
|
|
|
|
|
|
|
|
|
|
|
| 2004 |
| ||||
| |||||||||
(in thousands) |
|
|
|
|
| ||||
| |||||||||
FINANCIAL INSTRUMENTS OWNED: |
|
|
|
|
|
|
|
|
|
US government and agency |
|
| $ | 9,914,866 |
|
| $ | 6,043,204 |
|
Other sovereign governments |
|
|
| 1,159,265 |
|
|
| 1,316,206 |
|
Corporate equity and convertible debt |
|
|
| 18,601,132 |
|
|
| 15,788,681 |
|
Corporate debt and other |
|
|
| 21,571,914 |
|
|
| 14,857,555 |
|
Mortgages, mortgage- and asset-backed |
|
|
| 40,297,016 |
|
|
| 27,679,581 |
|
Derivative financial instruments |
|
|
| 14,700,228 |
|
|
| 12,711,908 |
|
| |||||||||
|
|
| $ | 106,244,421 |
|
| $ | 78,397,135 |
|
| |||||||||
FINANCIAL INSTRUMENTS SOLD, |
|
|
|
|
|
|
|
|
|
BUT NOT YET PURCHASED: |
|
|
|
|
|
|
|
|
|
US government and agency |
|
| $ | 10,115,133 |
|
| $ | 8,851,452 |
|
Other sovereign governments |
|
|
| 1,617,998 |
|
|
| 1,240,916 |
|
Corporate equity and convertible debt |
|
|
| 6,900,004 |
|
|
| 6,386,064 |
|
Corporate debt and other |
|
|
| 3,274,034 |
|
|
| 2,896,233 |
|
Mortgages, mortgage- and asset-backed |
|
|
| 139,988 |
|
|
| 428,909 |
|
Derivative financial instruments |
|
|
| 12,957,176 |
|
|
| 9,672,306 |
|
| |||||||||
|
|
| $ | 35,004,333 |
|
| $ | 29,475,880 |
|
| |||||||||
As of November 30, 2005 and 2004, all financial instruments owned that were pledged to counterparties where the counterparty has the right, by contract or custom, to rehypothecate those securities are classified as “Financial Instruments Owned, Pledged as Collateral” in the Consolidated Statements of Financial Condition.
Financial instruments sold, but not yet purchased, represent obligations of the Company to purchase the specified financial instrument at the then current market price. Accordingly, these transactions result in off-balance-sheet risk as the Company’s ultimate obligation to repurchase such securities may exceed the amount recognized in the Consolidated Statements of Financial Condition.
CONCENTRATION RISK
The Company is subject to concentration risk by holding large positions or committing to hold large positions in certain types of securities, securities of a single issuer (including governments), issuers located in a particular country or geographic area, or issuers engaged in a particular industry. Positions taken and commitments made by the Company, including underwritings, often involve substantial amounts and significant exposure to individual issuers and businesses, including non-investment-grade issuers. At November 30, 2005, the Company’s most significant concentrations are related to US government and agency inventory positions, including those of the Federal National Mortgage Association and the Federal Home Loan Mortgage Corporation. In addition, a substantial portion of the collateral held by the Company for securities purchased under agreements to resell consists of securities issued by the US government and agencies.
4. DERIVATIVES AND HEDGING ACTIVITIES
The Company, in its capacity as a dealer in over-the-counter derivative financial instruments and its proprietary market-making and trading activities, enters into transactions in a variety of cash and derivative financial instruments for proprietary trading and to manage its exposure to market and credit risk. These risks include interest rate, exchange
88
NOTES TO CONSOLIDATED FINANCIAL STATEMENTS
continued
rate and equity price risk. Derivative financial instruments represent contractual commitments between counterparties that derive their value from changes in an underlying interest rate, currency exchange rate, index (e.g., Standard & Poor’s 500 Index), reference rate (e.g., London Interbank Offered Rate, or LIBOR), or asset value referenced in the related contract. Some derivatives, such as futures contracts, certain options and index-referenced warrants, can be traded on an exchange. Other derivatives, such as interest rate and currency swaps, caps, floors, collars, swaptions, equity swaps and options, credit derivatives, structured notes and forward contracts, are negotiated in the over-the-counter markets. Derivatives generate both on- and off-balance-sheet risks depending on the nature of the contract. Generally, these financial instruments represent commitments or rights to exchange interest payment streams or currencies or to purchase or sell other securities at specific terms at specified future dates. Option contracts generally provide the holder with the right, but not the obligation, to purchase or sell a financial instrument at a specific price on or before an established date or dates. Financial instruments sold, but not yet purchased may result in market and/or credit risk in excess of amounts recorded in the Consolidated Statements of Financial Condition.
MARKET RISK
Derivative financial instruments involve varying degrees of off-balance-sheet market risk, whereby changes in the level or volatility of interest rates, foreign currency exchange rates or market values of the underlying financial instruments may result in changes in the value of a particular financial instrument in excess of the amounts currently reflected in the Consolidated Statements of Financial Condition. The Company’s exposure to market risk is influenced by a number of factors, including the relationships among and between financial instruments with off-balance-sheet risk, the Company’s proprietary securities, futures and derivatives inventories as well as the volatility and liquidity in the markets in which the financial instruments are traded. The Company attempts to mitigate its exposure to market risk by entering into hedging transactions, which may include over-the-counter derivatives contracts or the purchase or sale of interest-bearing securities, equity securities, financial futures and forward contracts. In this regard, the utilization of derivative instruments is designed to reduce or mitigate market risks associated with holding dealer inventories or in connection with arbitrage-related trading activities.
DERIVATIVES CREDIT RISK
Credit risk arises from the potential inability of counterparties to perform in accordance with the terms of the contract. At any point in time, the Company’s exposure to credit risk associated with counterparty non-performance is generally limited to the net replacement cost of over-the-counter contracts, net of the value of collateral held. Such financial instruments are reported at fair value on a net-by-counterparty basis pursuant to enforceable netting agreements. Exchange-traded financial instruments, such as futures and options, generally do not give rise to significant unsecured counterparty exposure due to the Company’s margin requirements, which may be greater than those prescribed by the individual exchanges. Options written generally do not give rise to counterparty credit risk since they obligate the Company (not its counterparty) to perform.
The Company has controls in place to monitor credit exposures by assessing the future creditworthiness of counterparties and limiting transactions with specific counterparties. The Company also seeks to control credit risk by following an established credit approval process, monitoring credit limits and requiring collateral where appropriate.
NON-TRADING DERIVATIVES ACTIVITY
To modify the interest rate characteristics of its long- and short-term debt, the Company also engages in non-trading derivatives activities. The Company has issued US dollar- and foreign currency-denominated debt with both variable- and fixed-rate interest payment obligations. The Company has entered into interest rate swaps, primarily based on LIBOR, to convert fixed-rate interest payments on its debt obligations into variable-rate payments. In addition, for foreign currency debt obligations that are not used to fund assets in the same currency, the Company has entered into currency swap agreements that effectively convert the debt into US dollar obligations. Such transactions are accounted for as fair value hedges.
89
NOTES TO CONSOLIDATED FINANCIAL STATEMENTS
continued
These financial instruments are subject to the same market and credit risks as those that are traded in connection with the Company’s market-making and trading activities. The Company has similar controls in place to monitor these risks. Interest rate swap agreements reduced net interest expense on the Company’s long- and short-term debt obligations by $115.4 million, $589.3 million and $635.3 million during the fiscal years ended November 30, 2005, 2004 and 2003, respectively.
SFAS No. 133, as amended by SFAS No. 138 and SFAS No. 149, establishes accounting and reporting standards for stand-alone derivative instruments, derivatives embedded within other contracts or securities and for hedging activities. It requires that all derivatives, whether stand-alone or embedded within other contracts or securities (except in very defined circumstances) be carried on the Company’s Statement of Financial Condition at fair value. SFAS No. 133 also requires items designated as being fair value hedged to be recorded at fair value, as defined in SFAS No. 133, provided that the intent to hedge is fully documented. Any resultant net change in value for both the hedging derivative and the hedged item is recognized in earnings immediately, such net effect being deemed the “ineffective” portion of the hedge. The gains and losses associated with the ineffective portion of the fair value hedges are included in “Principal Transactions” revenues in the Consolidated Statements of Income. These amounts were immaterial for fiscal 2005, 2004 and 2003.
5. TRANSFERS OF FINANCIAL ASSETS AND LIABILITIES
SECURITIZATIONS
The Company is a market leader in mortgage-backed securitization and other structured financing arrangements. In the normal course of business, the Company regularly securitizes commercial and residential mortgages, consumer receivables and other financial assets. Securitization transactions are generally treated as sales, provided that control has been relinquished. In connection with securitization transactions, the Company establishes special-purpose entities (“SPEs”), in which transferred assets, including commercial and residential mortgages, consumer receivables and other financial assets are sold to an SPE and repackaged into securities or similar beneficial interests. Transferred assets are accounted for at fair value prior to securitization. The majority of the Company’s involvement with SPEs relates to securitization transactions meeting the definition of a QSPE under the provisions of SFAS No. 140. Provided it has relinquished control over such assets, the Company derecognizes financial assets transferred in securitizations and does not consolidate the financial statements of QSPEs. For SPEs that do not meet the QSPE criteria, the Company uses the guidance in FIN No. 46 (R) to determine whether the SPE should be consolidated.
In connection with these securitization activities, the Company may retain interests in securitized assets in the form of senior or subordinated securities or as residual interests. Retained interests in securitizations are generally not held to maturity and typically are sold shortly after the settlement of a securitization. The weighted average holding period for retained interest positions in inventory at November 30, 2005 and 2004 was approximately 90 days and 70 days, respectively. These retained interests are included in “Financial Instruments Owned” in the Consolidated Statements of Financial Condition and are carried at fair value. Consistent with the valuation of similar inventory, fair value is determined by broker-dealer price quotations and internal valuation pricing models that utilize variables such as yield curves, prepayment speeds, default rates, loss severity, interest rate volatilities and spreads. The assumptions used for pricing variables are based on observable transactions in similar securities and are further verified by external pricing sources, when available.
90
NOTES TO CONSOLIDATED FINANCIAL STATEMENTS
continued
The Company’s securitization activities are detailed below:
|
|
|
|
|
|
|
|
|
|
|
|
| Agency |
| Other Mortgage- |
| Total |
| |||
| ||||||||||
(in billions) |
|
|
|
|
|
|
|
|
|
|
| ||||||||||
Total securitizations |
|
|
|
|
|
|
|
|
|
|
Fiscal 2005 |
| $ | 26.2 |
| $ | 89.8 |
| $ | 116.0 |
|
Fiscal 2004 |
| $ | 30.2 |
| $ | 75.2 |
| $ | 105.4 |
|
Retained interests |
|
|
|
|
|
|
|
|
|
|
As of November 30, 2005 |
| $ | 1.8 |
| $ | 3.7 |
| $ | 5.5 | (1) |
As of November 30, 2004 |
| $ | 2.6 |
| $ | 1.9 |
| $ | 4.5 | (2) |
| ||||||||||
(1) Includes approximately $0.8 billion in non-investment-grade and unrated retained interests.
(2) Includes approximately $0.3 billion in non-investment-grade and unrated retained interests.
The following table summarizes cash flows from securitization trusts related to securitization transactions during the fiscal years ended November 30, 2005 and 2004:
|
|
|
|
|
|
|
|
|
|
|
|
| Agency |
| Other Mortgage- |
| Total |
| |||
| ||||||||||
(in millions) |
|
|
|
|
|
|
|
|
|
|
| ||||||||||
Cash flows received from retained interests |
|
|
|
|
|
|
|
|
|
|
Fiscal 2005 |
| $ | 452.9 |
| $ | 498.0 |
| $ | 950.9 |
|
Fiscal 2004 |
| $ | 537.2 |
| $ | 260.8 |
| $ | 798.0 |
|
Cash flows from servicing |
|
|
|
|
|
|
|
|
|
|
Fiscal 2005 |
| $ | 1.7 |
| $ | 68.8 |
| $ | 70.5 |
|
Fiscal 2004 |
| $ | 1.0 |
| $ | 40.6 |
| $ | 41.6 |
|
| ||||||||||
The Company is an active market maker in these securities and therefore may retain interests in assets it securitizes, predominantly highly rated or government agency-backed securities. The models employed in the valuation of retained interests use discount rates that are based on the Treasury curve plus a spread. Key points on the constant maturity Treasury curve at November 30, 2005 were 4.40% for two-year Treasuries and 4.63% for 10-year Treasuries, and ranged from 3.97% to 4.83%. These models also consider prepayment speeds as well as credit losses. Credit losses are considered through option-adjusted spreads that also incorporate additional factors such as liquidity and optionality.
Weighted average key economic assumptions used in measuring the fair value of retained interests in assets the Company securitized at November 30, 2005 were as follows:
|
|
|
|
|
|
|
|
|
| Agency |
| Other Mortgage- |
| ||
| |||||||
Weighted average life (years) |
|
| 7.8 |
|
| 4.6 |
|
Average prepayment speeds (annual rate) |
|
| 6%-21 | % |
| 6%-49 | % |
Credit losses |
|
| 0.46 | % |
| 4.94 | % |
| |||||||
91
NOTES TO CONSOLIDATED FINANCIAL STATEMENTS
continued
The following hypothetical sensitivity analysis as of November 30, 2005 illustrates the potential adverse change in fair value of these retained interests due to a specified change in the key valuation assumptions. The interest rate changes represent a parallel shift in the Treasury curve. This shift considers the effect of other variables, including prepayments. The remaining valuation assumptions are changed independently. Retained interests in securitizations are generally not held to maturity and are typically sold shortly after the settlement of a securitization. The Company considers the current and expected credit profile of the underlying collateral in determining the fair value and periodically updates the fair value for changes in credit, interest rate, prepayment and other pertinent market factors. Actual credit losses on retained interests have not been significant.
|
|
|
|
|
|
|
|
|
| Agency |
| Other Mortgage- |
| ||
| |||||||
(in millions) |
|
|
|
|
|
|
|
| |||||||
Interest rates |
|
|
|
|
|
|
|
Impact of 50 basis point adverse change |
|
| ($34.0 | ) |
| ($100.1 | ) |
Impact of 100 basis point adverse change |
|
| (71.4 | ) |
| (191.6 | ) |
| |||||||
Prepayment speeds |
|
|
|
|
|
|
|
Impact of 10% adverse change |
|
| (0.8 | ) |
| (18.5 | ) |
Impact of 20% adverse change |
|
| (1.5 | ) |
| (34.2 | ) |
| |||||||
Credit losses |
|
|
|
|
|
|
|
Impact of 10% adverse change |
|
| (4.3 | ) |
| (44.6 | ) |
Impact of 20% adverse change |
|
| (8.5 | ) |
| (87.1 | ) |
| |||||||
In the normal course of business, the Company originates and purchases conforming and non-conforming, conventional fixed-rate and adjustable-rate residential mortgage loans and sells such loans to investors. In connection with these activities, the Company may retain MSRs that entitle the Company to a future stream of cash flows based on the contractual servicing fee. In addition, the Company may purchase and sell MSRs. At November 30, 2005, the key economic assumptions and the sensitivity of the current fair value of MSRs to immediate changes in those assumptions were as follows:
|
|
|
|
|
|
|
|
|
|
|
|
| Sub-Prime Loans |
| Fixed-Rate Prime |
| Adjustable-Rate |
| |||
| ||||||||||
(in millions) |
|
|
|
|
|
|
|
|
|
|
| ||||||||||
Fair value of MSRs |
| $ | 155.3 |
| $ | 76.9 |
| $ | 236.3 |
|
|
|
|
|
|
|
|
|
|
|
|
Constant prepayment rate (in CPR) |
|
| 15%-75 | % |
| 10%-18 | % |
| 20%-46 | % |
|
|
|
|
|
|
|
|
|
|
|
Impact on fair value of: |
|
|
|
|
|
|
|
|
|
|
5 CPR adverse change |
| $ | (15.5 | ) | $ | (8.6 | ) | $ | (12.4 | ) |
10 CPR adverse change |
|
| (27.6 | ) |
| (18.3 | ) |
| (22.7 | ) |
|
|
|
|
|
|
|
|
|
|
|
Discount rate |
|
| 14 | % |
| 13 | % |
| 13 | % |
|
|
|
|
|
|
|
|
|
|
|
Impact on fair value of: |
|
|
|
|
|
|
|
|
|
|
5% adverse change |
| $ | (12.9 | ) | $ | (9.7 | ) | $ | (17.9 | ) |
10% adverse change |
|
| (22.3 | ) |
| (17.2 | ) |
| (33.4 | ) |
| ||||||||||
The previous tables should be viewed with caution since the changes in a single variable generally cannot occur without changes in other variables or conditions that may counteract or amplify the effect of the changes outlined in the tables. Changes in fair value based on a 10% adverse variation in assumptions generally cannot be extrapolated because
92
NOTES TO CONSOLIDATED FINANCIAL STATEMENTS
continued
the relationship of the change in assumptions to the change in fair value is not usually linear. In addition, the tables do not consider the change in fair value of hedging positions, which would generally offset the changes detailed in the tables, nor do they consider any corrective action that the Company may take in response to changes in these conditions. The impact of hedges is not presented because hedging positions are established on a portfolio level and allocating the impact would not be practicable.
MSRs are included in “Other Assets” on the Consolidated Statements of Financial Condition. The Company’s MSRs activities for the fiscal years ended November 30, 2005 and 2004 were as follows:
|
|
|
|
|
|
|
|
|
|
|
|
| 2005 |
|
| 2004 |
| ||
| |||||||||
(in millions) |
|
|
|
|
|
|
|
|
|
| |||||||||
Balance, beginning of year |
|
| $ | 230.2 |
|
| $ | 108.0 |
|
Additions |
|
|
| 384.1 |
|
|
| 206.4 |
|
Sales |
|
|
| (47.1 | ) |
|
| — |
|
Amortization |
|
|
| (135.9 | ) |
|
| (57.1 | ) |
Impairment |
|
|
| (0.2 | ) |
|
| (27.1 | ) |
| |||||||||
Balance, end of year |
|
| $ | 431.1 |
|
| $ | 230.2 |
|
| |||||||||
Changes in the MSR valuation allowance for the fiscal years ended November 30, 2005 and 2004 were as follows:
|
|
|
|
|
|
|
|
|
|
|
|
| 2005 |
|
| 2004 |
| ||
| |||||||||
(in millions) |
|
|
|
|
|
|
|
|
|
| |||||||||
Balance, beginning of year |
|
| $ | (33.7 | ) |
| $ | (6.6 | ) |
Impairment |
|
|
| (0.2 | ) |
|
| (27.1 | ) |
| |||||||||
Balance, end of year |
|
| $ | (33.9 | ) |
| $ | (33.7 | ) |
| |||||||||
6. VARIABLE INTEREST ENTITIES AND MORTGAGE LOAN SPECIAL PURPOSE ENTITIES
The Company regularly creates or transacts with entities that may be VIEs. These entities are an essential part of its securitization, asset management and structured finance businesses. In addition, the Company purchases and sells instruments that may be variable interests. The Company adopted FIN No. 46 (R) for its variable interests in fiscal 2004. The Company consolidates those VIEs in which the Company is the primary beneficiary.
The Company may perform various functions, including being the seller, investor, structurer or underwriter in securitization transactions. These transactions typically involve entities that are considered to be QSPEs as defined in SFAS No. 140. QSPEs are exempt from the requirements of FIN No. 46 (R). For securitization vehicles that do not qualify as QSPEs, the holders of the beneficial interests have no recourse to the Company, only to the assets held by the related VIE. In certain of these VIEs, the Company is the primary beneficiary often through its ownership of certain beneficial interests, and is, therefore, required to consolidate the assets and liabilities of the VIE.
The Company has a limited number of mortgage securitizations that did not meet the criteria for sale treatment under SFAS No. 140 because the securitization vehicles were not QSPEs. The assets in these mortgage securitizations approximated $5.3 billion and $1.6 billion at November 30, 2005 and 2004, respectively.
The Company also acts as portfolio manager and/or underwriter in several collateralized debt obligation transactions. In these transactions, the Company establishes a trust that purchases a portfolio of assets and issues trust certificates that represent interests in the portfolio of assets. In addition to receiving variable compensation for managing the portfolio, the Company may also retain certain trust certificates. In certain of these transactions, these interests result in the Company becoming the primary beneficiary of these entities. The holders of the trust certificates have recourse only to
93
NOTES TO CONSOLIDATED FINANCIAL STATEMENTS
continued
the underlying assets of the trusts and not to other assets of the Company.
Assets held by VIEs, which are currently consolidated because the Company is the primary beneficiary, approximated $1.2 billion and $0.4 billion at November 30, 2005 and 2004, respectively. At November 30, 2005 and 2004, the Company’s maximum exposure to loss as a result of its relationship with these VIEs is approximately $531.0 million and $16.3 million, respectively, which represents the fair value of its interests in the VIEs.
The Company also owns significant variable interests in several VIEs related to collateralized debt obligations or asset securitizations for which the Company is not the primary beneficiary and therefore does not consolidate these entities. In aggregate, these VIEs have assets approximating $4.7 billion and $5.8 billion at November 30, 2005 and 2004, respectively. At November 30, 2005 and 2004, the Company’s maximum exposure to loss from these entities approximates $29.6 million and $35.5 million, respectively, which represents the fair value of its interests and is reflected in the consolidated financial statements.
The Company purchases and sells interests in entities that may be deemed to be VIEs in its market-making capacity in the ordinary course of business. As a result of these activities, it is reasonably possible that such entities may be consolidated and deconsolidated at various points in time. Therefore, the Company’s variable interests included above may not be held by the Company in future periods.
The Company has retained call options on a limited number of securitization transactions that require the Company to continue recognizing the assets subject to the call options, which approximated $8.7 billion and $2.8 billion at November 30, 2005 and 2004, respectively.
7. COLLATERALIZED FINANCING ARRANGEMENTS
The Company enters into secured borrowing and lending agreements to obtain collateral necessary to effect settlements, finance inventory positions, meet customer needs or re-lend as part of its dealer operations.
The Company receives collateral under reverse repurchase agreements, securities borrowing transactions, derivative transactions, customer margin loans and other secured money-lending activities. In many instances, the Company is also permitted by contract or custom to rehypothecate securities received as collateral. These securities may be used to secure repurchase agreements, enter into securities lending or derivative transactions or cover short positions.
At November 30, 2005 and 2004, the fair value of securities received as collateral by the Company that can be repledged, delivered or otherwise used was approximately $254.62 billion and $259.01 billion, respectively. Of these securities received as collateral, those with a fair value of approximately $184.25 billion and $163.95 billion were delivered or repledged at November 30, 2005 and 2004, respectively.
The Company also pledges financial instruments owned to collateralize certain financing arrangements and permits the counterparty to pledge or rehypothecate the securities. These securities are recorded as “Financial Instruments Owned and Pledged As Collateral, at Fair Value” in the Consolidated Statements of Financial Condition. The carrying value of securities and other inventory positions owned that have been pledged or otherwise encumbered to counterparties where those counterparties do not have the right to sell or repledge was approximately $20.83 billion at November 30, 2005.
94
NOTES TO CONSOLIDATED FINANCIAL STATEMENTS
continued
The Company obtains short-term borrowings through the issuance of commercial paper and bank loans and other borrowings. The interest rates on such short-term borrowings reflect market rates of interest at the time of the transactions.
The Company’s short-term borrowings at November 30, 2005 and 2004 consisted of the following:
|
|
|
|
|
|
|
|
|
|
|
|
| 2005 |
|
| 2004 |
| ||
| |||||||||
(in thousands) |
|
|
|
|
|
|
|
|
|
| |||||||||
Commercial paper |
|
| $ | 9,675,903 |
|
| $ | 3,924,027 |
|
Bank loans and other borrowings (1) |
|
|
| 10,339,824 |
|
|
| 8,286,805 |
|
| |||||||||
Total short-term borrowings |
|
| $ | 20,015,727 |
|
| $ | 12,210,832 |
|
| |||||||||
(1) Included in bank loans and other borrowings at November 30, 2005 and 2004 were secured borrowings of $258.9 million and $484.1 million, respectively.
The effective weighted average interest rates for short-term borrowings are as follows:
|
|
|
|
|
|
|
|
|
|
|
|
|
|
|
|
|
|
|
|
|
|
| As of November 30, |
| Fiscal YearsEnded November 30, |
| |||||||||||||||
|
|
|
|
|
|
|
|
|
|
|
|
|
|
|
|
|
|
|
|
|
|
|
|
|
|
|
|
|
|
|
|
|
|
|
|
|
|
|
|
|
|
|
|
|
|
|
|
|
|
|
|
|
|
|
|
|
|
|
|
|
|
|
|
|
| 2005 |
|
| 2004 |
|
| 2005 |
|
| 2004 |
| 2003 |
| |||||
| ||||||||||||||||||||
Commercial paper |
|
|
| 4.11 | % |
|
| 1.96 | % |
|
| 3.28 | % |
|
| 1.32 | % |
| 1.28 | % |
Bank loans and other borrowings |
|
|
| 4.16 | % |
|
| 2.24 | % |
|
| 3.33 | % |
|
| 1.63 | % |
| 1.61 | % |
| ||||||||||||||||||||
The Company’s long-term borrowings (which have original maturities of at least 12 months) at November 30, 2005 and 2004 consisted of the following:
|
|
|
|
|
|
|
|
|
|
|
|
| 2005 |
|
| 2004 |
| ||
| |||||||||
(in thousands) |
|
|
|
|
|
|
|
|
|
| |||||||||
Fixed-rate notes due 2006 to 2018:(1) |
|
|
|
|
|
|
|
|
|
US dollar-denominated |
|
| $ | 12,414,889 |
|
| $ | 12,605,006 |
|
Floating-rate notes due 2007 to 2010: |
|
|
|
|
|
|
|
|
|
US dollar-denominated |
|
|
| 2,707,346 |
|
|
| 1,308,989 |
|
Medium-term notes and other borrowings: |
|
|
|
|
|
|
|
|
|
Fixed-rate, US dollar-denominated |
|
|
| 4,226,308 |
|
|
| 2,778,131 |
|
Fixed-rate, non-US-dollar-denominated |
|
|
| 5,331,974 |
|
|
| 3,002,511 |
|
Floating-rate, US dollar-denominated |
|
|
| 7,610,466 |
|
|
| 9,256,014 |
|
Floating-rate, non-US-dollar-denominated |
|
|
| 3,890,974 |
|
|
| 2,974,133 |
|
Index/equity/credit-linked notes |
|
|
|
|
|
|
|
|
|
US dollar-denominated |
|
|
| 1,999,226 |
|
|
| 1,364,806 |
|
Non-US-dollar-denominated |
|
|
| 5,308,433 |
|
|
| 3,553,687 |
|
| |||||||||
Total long-term borrowings |
|
| $ | 43,489,616 |
|
| $ | 36,843,277 |
|
| |||||||||
Amounts include fair value adjustments in accordance with SFAS No. 133.
(1) At November 30, 2005, US dollar-denominated fixed-rate notes are at interest rates ranging from 2.9% to 7.8%.
The Company has entered into interest rate swaps and other transactions to convert its fixed-rate notes into floating rates based on LIBOR. For floating-rate notes that are not based on LIBOR, the Company has generally entered into
95
NOTES TO CONSOLIDATED FINANCIAL STATEMENTS
continued
interest rate swaps and other transactions to convert them into floating rates based on LIBOR. The Company’s long-term MTNs have initial maturities ranging from 12 months to 30 years from the date of issue and bear interest at either a fixed rate or a variable rate primarily based on LIBOR. The Company has entered into interest rate swaps and certain other transactions to convert substantially all of its fixed-rate MTNs into floating rates based on LIBOR. Index/equity-linked borrowings include various structured instruments whose payments and redemption values are linked to the performance of a specific index (e.g., Dow Jones Industrial Average), a basket of stocks or a specific equity security. To minimize the exposure resulting from movements in the underlying equity position or index, the Company has entered into various equity swap contracts. Credit-linked notes include various structured instruments whose payments and redemption values are linked to the performance of a basket of credit products, an index or an individual security. To minimize exposure to these instruments, the Company has entered into swaps that pay the performance of the underlying security or index.
The effective weighted average interest rates for long-term borrowings, after giving effect to the swaps, are as follows:
|
|
|
|
|
|
|
|
|
|
|
|
|
|
|
|
|
|
|
|
|
|
| As of November 30, |
| Fiscal YearEnded November 30, |
| |||||||||||||||
|
|
|
|
|
|
|
|
|
|
|
|
|
|
|
|
|
|
|
|
|
|
|
|
|
|
|
|
|
|
|
|
|
|
|
|
|
|
|
|
|
|
|
|
|
|
|
|
|
|
|
|
|
|
|
|
|
|
|
|
|
|
|
|
|
|
| 2005 |
|
|
| 2004 |
|
|
| 2005 |
|
|
| 2004 |
|
| 2003 |
|
| ||||||||||||||||||||
Fixed-rate notes |
|
|
| 4.71 | % |
|
| 2.68 | % |
|
| 3.76 | % |
|
| 2.02 | % |
| 1.99 | % |
Floating-rate notes |
|
|
| 4.46 | % |
|
| 2.54 | % |
|
| 3.80 | % |
|
| 1.97 | % |
| 1.77 | % |
Medium-term notes and other borrowings |
|
|
| 4.50 | % |
|
| 2.60 | % |
|
| 3.61 | % |
|
| 2.01 | % |
| 1.95 | % |
| ||||||||||||||||||||
The Company’s long-term borrowings at November 30, 2005 mature as follows:
|
|
|
|
|
|
|
|
|
|
|
|
|
|
|
|
|
|
|
|
|
|
|
|
|
|
|
|
|
| US Dollar |
|
| Non-US-Dollar |
| |||||||||||||||||||||
|
|
|
|
|
|
|
|
|
|
|
|
|
|
|
|
|
|
|
|
|
|
|
|
|
|
|
|
|
|
|
|
|
|
|
|
|
|
|
|
|
|
|
|
|
|
|
|
|
|
|
|
|
|
|
|
|
|
|
|
|
|
|
|
|
|
|
|
|
|
|
|
|
|
|
|
|
|
|
|
|
|
|
|
|
|
|
|
|
|
|
|
| MTNs and other borrowings |
|
| MTNs and other borrowings |
| ||||||||||||||
| |||||||||||||||||||||||||||
|
| Fixed |
| Floating |
|
| Fixed |
| Floating |
| Index/Equity |
|
| Fixed |
| Floating |
| Index/Equity |
| ||||||||
| |||||||||||||||||||||||||||
(in millions) |
|
|
|
|
|
|
|
|
|
|
|
|
|
|
|
|
|
|
|
|
|
|
|
|
|
|
|
| |||||||||||||||||||||||||||
FISCAL YEAR |
|
|
|
|
|
|
|
|
|
|
|
|
|
|
|
|
|
|
|
|
|
|
|
|
|
|
|
2006 |
| $ | 2,391 |
| $ | — |
|
| $ | — |
| $ | 2,412 |
| $ | 236 |
|
| $ | 336 |
| $ | 766 |
| $ | 347 |
|
2007 |
|
| 1,948 |
|
| 496 |
|
|
| 1,717 |
|
| 2,930 |
|
| 489 |
|
|
| 191 |
|
| 4 |
|
| 543 |
|
2008 |
|
| 2,111 |
|
| 1,542 |
|
|
| 318 |
|
| 319 |
|
| 566 |
|
|
| 322 |
|
| 221 |
|
| 411 |
|
2009 |
|
| 705 |
|
| — |
|
|
| 215 |
|
| 1,406 |
|
| 167 |
|
|
| 882 |
|
| 1,204 |
|
| 939 |
|
2010 |
|
| 2,228 |
|
| 669 |
|
|
| 66 |
|
| 153 |
|
| 301 |
|
|
| 1,377 |
|
| 326 |
|
| 850 |
|
Thereafter |
|
| 3,032 |
|
| — |
|
|
| 1,910 |
|
| 390 |
|
| 240 |
|
|
| 2,224 |
|
| 1,370 |
|
| 2,218 |
|
| |||||||||||||||||||||||||||
Total |
| $ | 12,415 |
| $ | 2,707 |
|
| $ | 4,226 |
| $ | 7,610 |
| $ | 1,999 |
|
| $ | 5,332 |
| $ | 3,891 |
| $ | 5,308 |
|
|
|
|
|
|
|
|
|
|
|
|
|
|
|
|
|
|
|
|
|
|
|
|
|
|
|
|
|
|
|
|
|
|
|
|
|
|
|
|
|
|
|
|
|
|
|
|
|
|
|
|
|
|
|
|
|
Amounts include fair value adjustments in accordance with SFAS No. 133 as well as $262.5 million of junior subordinated deferrable interest debentures (“Debentures”). The Debentures will mature on May 15, 2031; however, the Company, at its option, may redeem the Debentures beginning May 15, 2006. The Debentures are reflected in the table at their contractual maturity date.
Included in fiscal 2007 and fiscal 2008 are approximately $2.20 billion and $0.1 billion, respectively, of floating-rate MTNs that are redeemable prior to maturity at the option of the noteholder. These notes contain certain provisions that effectively enable noteholders to put these notes back to the Company and, therefore, are reflected in the table at the date such notes first become redeemable. The final maturity dates of these notes are during fiscal 2009 and fiscal 2010.
Instruments governing certain indebtedness of the Company contain various financial covenants, including maintenance of minimum levels of stockholders’ equity of the Company. At November 30, 2005, the Company was in compliance with all covenants contained in these debt agreements.
96
NOTES TO CONSOLIDATED FINANCIAL STATEMENTS
continued
PREFERRED STOCK ISSUED BY THE BEAR STEARNS COMPANIES INC.
The Company is authorized to issue a total of 10 million shares of preferred stock at par value of $1.00 per share. At November 30, 2005, the Company has 1,861,632 shares issued and outstanding under various series as described below. All preferred stock has a dividend preference over the Company’s common stock in the paying of dividends and a preference in the liquidation of assets.
The Company has outstanding 3,493,250 depositary shares representing 873,313 shares of Cumulative Preferred Stock, Series E (“Series E Preferred Stock”), having an aggregate liquidation preference of $174.7 million as of November 30, 2005. Each depositary share represents a one-fourth interest in a share of Series E Preferred Stock. Dividends on the Series E Preferred Stock are payable at an annual rate of 6.15%. Series E Preferred Stock is redeemable at the option of the Company at any time on or after January 15, 2008, in whole or in part, at a redemption price of $200 per share (equivalent to $50 per depositary share), plus accrued but unpaid dividends to the redemption date. During the fiscal year ended November 30, 2005, the Company did not repurchase any depositary shares.
The Company has outstanding 1,881,700 depositary shares representing 470,425 shares of Cumulative Preferred Stock, Series F (“Series F Preferred Stock”), having an aggregate liquidation preference of $94.1 million as of November 30, 2005. Each depositary share represents a one-fourth interest in a share of Series F Preferred Stock. Dividends on the Series F Preferred Stock are payable at an annual rate of 5.72%. Series F Preferred Stock is redeemable at the option of the Company at any time on or after April 15, 2008, in whole or in part, at a redemption price of $200 per share (equivalent to $50 per depositary share), plus accrued but unpaid dividends to the redemption date. During the fiscal year ended November 30, 2005, the Company redeemed and retired 731,100 depositary shares.
The Company has outstanding 2,071,575 depositary shares representing 517,894 shares of Cumulative Preferred Stock, Series G (“Series G Preferred Stock”), having an aggregate liquidation preference of $103.6 million as of November 30, 2005. Each depositary share represents a one-fourth interest in a share of Series G Preferred Stock. Dividends on the Series G Preferred Stock are payable at an annual rate of 5.49%. Series G Preferred Stock is redeemable at the option of the Company at any time on or after July 15, 2008, in whole or in part, at a redemption price of $200 per share (equivalent to $50 per depositary share), plus accrued but unpaid dividends to the redemption date. During the fiscal year ended November 30, 2005, the Company redeemed and retired 785,325 depositary shares.
PREFERRED STOCK ISSUED BY SUBSIDIARIES
Bear Stearns Capital Trust III (“Capital Trust III”), a wholly owned subsidiary of the Company, has issued $262.5 million (10,500,000 shares) of Guaranteed Preferred Beneficial Interests in Company Subordinated Debt Securities (“Preferred Securities”). The Preferred Securities are fixed-rate securities, which have a liquidation value of $25 per security. Holders of the Preferred Securities are entitled to receive quarterly preferential cash distributions at an annual rate of 7.8% through May 15, 2031. The proceeds of the issuance of the Preferred Securities were used to acquire junior subordinated deferrable interest debentures (“Debentures”) issued by the Company. The Debentures have terms that correspond to the terms of the Preferred Securities and are the sole assets of Capital Trust III. The Preferred Securities will mature on May 15, 2031. The Company, at its option, may redeem the Preferred Securities at their principal amount plus accrued distributions beginning May 15, 2006.
In accordance with FIN No. 46 (R) the Company has deconsolidated Capital Trust III. As a result, the Debentures issued by the Company to Capital Trust III are included within long-term borrowings at November 30, 2005 and 2004. The $262.5 million of Preferred Securities issued by Capital Trust III is still outstanding, providing the funding for such Debentures. The Preferred Securities issued by Capital Trust III are no longer included in the Company’s Consolidated Statements of Financial Condition.
97
NOTES TO CONSOLIDATED FINANCIAL STATEMENTS
continued
Basic EPS is computed by dividing net income applicable to common shares, adjusted for costs related to vested shares under the CAP Plan, as well as the effect of the redemption of preferred stock, by the weighted average number of common shares outstanding. Common shares outstanding includes vested units issued under certain stock compensation plans, which will be distributed as shares of common stock. Diluted EPS includes the determinants of Basic EPS and, in addition, gives effect to dilutive potential common shares related to stock compensation plans.
The computations of Basic and Diluted EPS for the fiscal years ended November 30, 2005, 2004 and 2003 are set forth below:
|
|
|
|
|
|
|
|
|
|
|
|
|
|
|
| 2005 |
|
| 2004 |
| 2003 |
| |||
| ||||||||||||
(in thousands, except per share amounts) |
|
|
|
|
|
|
|
|
|
|
|
|
| ||||||||||||
Net income |
|
| $ | 1,462,177 |
|
| $ | 1,344,733 |
| $ | 1,156,406 |
|
Preferred stock dividends |
|
|
| (24,321 | ) |
|
| (28,072 | ) |
| (31,375 | ) |
Redemption of preferred stock |
|
|
| — |
|
|
| 1,230 |
|
| 720 |
|
Income adjustment (net of tax) applicable to deferred compensation arrangements—vested shares |
|
|
| 50,630 |
|
|
| 69,518 |
|
| 81,177 |
|
| ||||||||||||
Net earnings used for Basic EPS |
|
|
| 1,488,486 |
|
|
| 1,387,409 |
|
| 1,206,928 |
|
Income adjustment (net of tax) applicable to deferred compensation arrangements—non-vested shares |
|
|
| 31,622 |
|
|
| 31,011 |
|
| 29,063 |
|
| ||||||||||||
Net earnings used for Diluted EPS |
|
| $ | 1,520,108 |
|
| $ | 1,418,420 |
| $ | 1,235,991 |
|
| ||||||||||||
Total basic weighted average common shares outstanding(1) |
|
|
| 130,327 |
|
|
| 127,468 |
|
| 127,820 |
|
| ||||||||||||
Effect of dilutive securities: |
|
|
|
|
|
|
|
|
|
|
|
|
Employee stock options |
|
|
| 4,064 |
|
|
| 3,604 |
|
| 2,415 |
|
CAP and restricted units |
|
|
| 13,077 |
|
|
| 14,213 |
|
| 14,792 |
|
| ||||||||||||
Dilutive potential common shares |
|
|
| 17,141 |
|
|
| 17,817 |
|
| 17,207 |
|
| ||||||||||||
Weighted average number of common shares outstanding and dilutive potential common shares |
|
|
| 147,468 |
|
|
| 145,285 |
|
| 145,027 |
|
| ||||||||||||
Basic EPS |
|
| $ | 11.42 |
|
| $ | 10.88 |
| $ | 9.44 |
|
Diluted EPS |
|
| $ | 10.31 |
|
| $ | 9.76 |
| $ | 8.52 |
|
| ||||||||||||
(1) Includes 18,091,681; 24,557,902 and 29,610,739 vested units for the fiscal years ended November 30, 2005, 2004 and 2003, respectively, issued under certain employee stock compensation plans, which will be distributed as shares of common stock.
The Company has a qualified non-contributory profit sharing plan covering substantially all employees. Contributions are made at the discretion of management in amounts that relate to the Company’s level of income before provision for income taxes. The Company’s expense related to the profit sharing plan for the fiscal years ended November 30, 2005, 2004 and 2003 was $37.0 million, $26.0 million and $32.4 million, respectively.
The Company has various stock compensation plans designed to increase the emphasis on stock-based incentive compensation and align the compensation of its key employees with the long-term interests of stockholders. These plans are summarized below.
CAPITAL ACCUMULATION PLAN
Pursuant to the CAP Plan, certain key executives receive a portion of their total annual compensation in the form of CAP units. The number of CAP units credited is a function of the dollar amount awarded to each participant and the
98
NOTES TO CONSOLIDATED FINANCIAL STATEMENTS
continued
closing fair market value of the Company’s common stock on the date of the award. The CAP units awarded under the CAP Plan are generally subject to vesting. The total number of CAP units that may be issued under the CAP Plan during any fiscal year may not exceed 15% of the sum of issued and outstanding shares of common stock and CAP units outstanding determined as of the last day of the current fiscal year.
Each CAP unit gives the participant an unsecured right to receive, on an annual basis, an amount equal to the Company’s pre-tax income per share, as defined by the CAP Plan, less the value of certain changes in the Company’s book value per common share during such fiscal year resulting from increases or decreases in the Company’s consolidated retained earnings (“earnings adjustment”), subject to certain limitations. The earnings adjustment will be credited to each participant’s deferred compensation account in the form of additional CAP units, based on the number of CAP units in such account at the end of each fiscal year. The number of CAP units credited depends on the amount awarded to each participant and the average per share cost of common stock acquired by the Company. On completion of the five-year deferral period, participants are entitled to receive shares of common stock equal to the number of CAP units then credited to their respective deferred compensation accounts.
During the fiscal years ended November 30, 2005, 2004 and 2003, the Company expensed $363.4 million, $330.9 million and $294.8 million, respectively, attributable to CAP units granted to participants in each of those years. In addition, during the fiscal years ended November 30, 2005, 2004 and 2003, the Company recognized expense of $144.0 million, $176.0 million and $193.0 million, respectively, attributable to CAP units with respect to the earnings adjustment. Awards allocated pursuant to the CAP Plan are credited to participants’ deferred compensation accounts in the form of CAP units and are included in stockholders’ equity.
RESTRICTED STOCK UNIT PLAN
The Restricted Stock Unit Plan (“RSU Plan”) provides for a portion of certain key employees’ compensation to be granted in the form of restricted stock units (“RSUs”), with allocations made to participants’ deferred compensation accounts. Under the RSU Plan, RSUs granted to employees have various vesting provisions and generally convert to common stock within four years. Such units are restricted from sale, transfer or assignment until the end of the restriction period. Holders of RSUs generally may forfeit ownership of a portion of their award if employment is terminated before the end of the vesting period. Holders of RSUs are entitled to receive a dividend in the form of additional RSUs, based on dividends declared on the Company’s common stock. The total number of RSUs that may be granted under the RSU Plan may not exceed 15,000,000. As of November 30, 2005, the total number of RSUs outstanding was 8,657,602.
The Company measures compensation cost for RSUs based on the fair market value of its common stock at the award date. A portion related to current service is expensed in the year of the award and that portion relating to future service is amortized over the vesting period. Amounts awarded and deferred pursuant to the RSU Plan and the unamortized portion of these amounts are shown as separate components of stockholders’ equity. During the fiscal years ended November 30, 2005, 2004 and 2003, the Company recognized compensation expense of $130.5 million, $114.2 million and $111.9 million, respectively, related to these awards.
STOCK AWARD PLAN
Pursuant to the Stock Award Plan, certain key employees are given the opportunity to acquire common stock through the grant of options. Stock options generally have a 10-year expiration. The total number of stock options that may be issued under the Stock Award Plan may not exceed 40,000,000. As of November 30, 2005, the total number of stock options outstanding was 23,873,136.
Effective December 1, 2002, the Company has adopted fair value accounting for stock-based compensation consistent with SFAS No. 123, using the prospective method with guidance provided by SFAS No. 148. As a result, commencing
99
NOTES TO CONSOLIDATED FINANCIAL STATEMENTS
continued
with options granted after November 30, 2002, the Company expenses the fair value of stock options issued to employees over the related vesting period. Prior to December 1, 2002, the Company elected to account for its stock-based compensation plans using the intrinsic value method prescribed by APB No. 25, as permitted by SFAS No. 123. Under the provisions of APB No. 25, compensation cost for stock options is measured as the excess, if any, of the quoted market price of the Company’s common stock at the date of grant over the amount an employee must pay to acquire the stock. Accordingly, no compensation expense had been recognized for stock option awards prior to December 1, 2002 because the exercise price was at the fair market value of the Company’s common stock on the grant date.
The Company awarded approximately $108 million, $110 million and $110 million of employee stock options in fiscal 2005, 2004 and 2003, respectively, of which approximately $99 million, $90 million and $90 million were immediately vested and expensed in fiscal 2005, fiscal 2004 and fiscal 2003, respectively. The balance of the unvested awards will be expensed over the future vesting periods, generally over three years. In fiscal 2005, fiscal 2004 and fiscal 2003, the Company recognized total compensation expense related to stock options of $123.2 million, $98.9 million and $92.7 million, respectively.
Fair value was estimated at grant date based on a modified Black-Scholes option-pricing model. The weighted average fair value of options granted related to the fiscal years ended November 30, 2005, 2004 and 2003 was $26.50, $26.00 and $19.36 per option, respectively. These amounts reflect adjustments for vesting requirements and potential maturity shortening.
The following table highlights the assumptions used for the fiscal years ended November 30:
|
|
|
|
|
|
|
|
|
|
|
|
|
|
|
| 2005 |
|
| 2004 |
| 2003 |
| |||
| ||||||||||||
Risk-free interest rate |
|
|
| 4.46 | % |
|
| 4.24 | % |
| 3.17 | % |
Expected option life |
|
|
| 5 years |
|
|
| 5 years |
|
| 5 years |
|
Expected stock price volatility |
|
|
| 21 | % |
|
| 24 | % |
| 27 | % |
Dividend yield |
|
|
| 0.90 | % |
|
| 1.45 | % |
| 1.11 | % |
| ||||||||||||
NON-EMPLOYEE DIRECTORS’ STOCK OPTION AND STOCK UNIT PLAN
Pursuant to the Non-Employee Directors’ Stock Option and Stock Unit Plan (“Directors’ Plan”), members of the Board of Directors of the Company who are not employees of the Company or any of its subsidiaries (“Non-Employee Directors”) may be offered the opportunity to acquire common stock through the grant of options and will receive common stock on the vesting of RSUs. Non-Employee Directors may elect to exchange a portion of their annual cash retainer paid by the Company for services rendered as a director, for stock options or RSUs. Stock options and RSUs issued under the plan generally vest six months after the date of issuance and stock options have a 10-year expiration. The total number of stock options and RSUs combined that may be issued under the Directors’ Plan may not exceed 300,000. As of November 30, 2005, the total number of stock options and RSUs outstanding was 106,043 and 19,007, respectively.
100
NOTES TO CONSOLIDATED FINANCIAL STATEMENTS
continued
SUMMARY OF ALL STOCK UNIT AND OPTION ACTIVITY
The following is a summary of CAP units and RSUs outstanding:
|
|
|
|
|
|
|
|
|
|
|
|
|
| Cap Units |
| RSUs(2) |
| ||||
|
| |||||||||
Balance, November 30, 2002 |
|
|
| 39,470,584 |
|
|
| 9,876,842 |
|
|
Granted(1) |
|
|
| 6,785,704 |
|
|
| 2,386,795 |
|
|
Forfeited |
|
|
| (230,740 | ) |
|
| (458,073 | ) |
|
Distributed |
|
|
| (13,230,305 | ) |
|
| (1,436,785 | ) |
|
|
| |||||||||
Balance, November 30, 2003 |
|
|
| 32,795,243 |
|
|
| 10,368,779 |
|
|
Granted(1) |
|
|
| 5,213,688 |
|
|
| 1,707,215 |
|
|
Forfeited |
|
|
| (147,139 | ) |
|
| (771,777 | ) |
|
Distributed |
|
|
| (4,604,225 | ) |
|
| (1,394,443 | ) |
|
|
| |||||||||
|
|
|
|
|
|
|
|
|
|
|
Balance, November 30, 2004 |
|
|
| 33,257,567 |
|
|
| 9,909,774 |
|
|
Granted(1) |
|
|
| 4,679,369 |
|
|
| 2,198,554 |
|
|
Forfeited |
|
|
| (40,020 | ) |
|
| (392,243 | ) |
|
Distributed |
|
|
| (12,073,202 | ) |
|
| (3,039,476 | ) |
|
|
| |||||||||
Balance, November 30, 2005 |
|
|
| 25,823,714 |
|
|
| 8,676,609 |
|
|
|
| |||||||||
(1) Average market price for units granted was $112.01, $96.06 and $72.01 for fiscal years ended November 30, 2005, 2004 and 2003, respectively.
(2) Includes 208,907; 1,162,632; 2,267,594; and 3,381,903 RSUs outstanding as of November 30, 2005, 2004, 2003 and 2002, respectively, which were granted under a one-time award.
In December 2005, 6,809,175 CAP units and 1,239,897 RSUs were converted into common shares and distributed to participants. This distribution is not reflected in the table above.
Activity with respect to stock options for the fiscal years ended November 30, 2005, 2004 and 2003 is presented below:
|
|
|
|
|
|
|
|
|
|
|
|
|
|
|
|
|
|
|
|
|
|
|
|
| 2005 |
|
| 2004 |
| 2003 |
| ||||||||||||
| |||||||||||||||||||||
|
|
| Number of |
| Weighted |
|
| Number of |
| Weighted |
| Number of |
| Weighted |
| ||||||
| |||||||||||||||||||||
Beginning balance |
|
|
| 23,401,445 |
| $ | 67.94 |
|
|
| 23,810,849 |
| $ | 58.91 |
|
| 20,454,067 |
| $ | 53.12 |
|
Granted |
|
|
| 4,075,475 |
| $ | 115.83 |
|
|
| 4,352,561 |
| $ | 102.34 |
|
| 5,727,498 |
| $ | 73.70 |
|
Exercised |
|
|
| (3,398,603 | ) | $ | 59.39 |
|
|
| (4,402,820 | ) | $ | 53.36 |
|
| (1,869,506 | ) | $ | 41.72 |
|
Forfeited |
|
|
| (99,138 | ) | $ | 65.44 |
|
|
| (359,145 | ) | $ | 61.93 |
|
| (501,210 | ) | $ | 55.73 |
|
| |||||||||||||||||||||
Ending balance |
|
|
| 23,979,179 | (1) | $ | 77.31 |
|
|
| 23,401,445 | (1) | $ | 67.94 |
|
| 23,810,849 | (1) | $ | 58.91 |
|
(1) 21,826,644; 13,225,173 and 6,808,154 stock options were exercisable with a weighted average exercise price of $76.09, $70.69 and $63.98 at November 30, 2005, 2004 and 2003, respectively.
101
NOTES TO CONSOLIDATED FINANCIAL STATEMENTS
continued
Information for the Company’s stock options as of November 30, 2005 is presented in the following table:
|
|
|
|
|
|
|
|
|
|
|
|
|
|
|
|
|
|
|
|
|
|
|
|
|
|
|
|
| Options Outstanding |
| Options Exercisable |
| |||||||||||||||||||||
|
|
|
|
|
| Average |
|
|
|
| Weighted |
| ||||||||||||||
|
|
|
| Weighted |
| Remaining |
|
|
| Average |
| |||||||||||||||
Range of |
| Number |
| Average |
| Contractual |
| Number |
| Exercise |
| |||||||||||||||
Exercise Prices |
| Outstanding |
| Exercise Price |
| Life (Years) |
| Exercisable |
| Price |
| |||||||||||||||
$35.00-$49.99 |
|
|
| 4,402,391 |
|
|
| $ | 47.07 |
|
|
|
| 4.8 |
|
|
|
| 4,402,391 |
|
|
| $ | 47.07 |
|
|
$50.00-$64.99 |
|
|
| 6,940,114 |
|
|
| $ | 60.47 |
|
|
|
| 6.5 |
|
|
|
| 6,936,908 |
|
|
| $ | 60.47 |
|
|
$65.00-$79.99 |
|
|
| 4,278,799 |
|
|
| $ | 73.72 |
|
|
|
| 8.0 |
|
|
|
| 3,180,687 |
|
|
| $ | 73.72 |
|
|
$80.00-$94.99 |
|
|
| 40,750 |
|
|
| $ | 86.20 |
|
|
|
| 8.2 |
|
|
|
| 23,149 |
|
|
| $ | 86.26 |
|
|
$95.00-$109.99 |
|
|
| 4,492,856 |
|
|
| $ | 102.63 |
|
|
|
| 9.1 |
|
|
|
| 3,712,453 |
|
|
| $ | 102.63 |
|
|
$110.00-$124.99 |
|
|
| 3,824,269 |
|
|
| $ | 116.83 |
|
|
|
| 10.0 |
|
|
|
| 3,571,056 |
|
|
| $ | 116.67 |
|
|
|
|
|
|
|
|
|
|
|
|
|
|
|
|
|
|
|
|
|
|
|
|
| ||||
Total |
|
|
| 23,979,179 |
|
|
| $ | 77.31 |
|
|
|
| 7.5 |
|
|
|
| 21,826,644 |
|
|
| $ | 76.09 |
|
|
|
|
|
|
|
|
|
|
|
|
|
|
|
|
|
|
|
|
|
|
|
|
| ||||
CUSTOMER CREDIT RISKS
The Company’s clearance activities for both clearing clients and customers (collectively, “customers”), involve the execution, settlement and financing of customers’ securities and futures transactions. Customers’ securities activities are transacted on either a cash or margin basis, while customers’ futures transactions are generally transacted on a margin basis subject to exchange regulations.
In connection with the customer clearance activities, the Company executes and clears customer transactions involving the sale of securities short (“short sales”), entering into futures transactions and the writing of option contracts. Short sales require the Company to borrow securities to settle customer short sale transactions and as such, these transactions may expose the Company to loss if customers are unable to fulfill their contractual obligations and customers’ collateral balances are insufficient to fully cover their losses. In the event customers fail to satisfy their obligations, the Company may be required to purchase financial instruments at prevailing market prices in order to fulfill the customers’ obligations.
The Company seeks to control the risks associated with its customers’ activities by requiring customers to maintain margin collateral in compliance with various regulatory and internal guidelines. The Company monitors required margin levels and, pursuant to such guidelines, may require customers to deposit additional cash or collateral, or to reduce positions, when deemed necessary. The Company also establishes credit limits for customers engaged in futures activities and monitors credit compliance. Additionally, with respect to the Company’s correspondent clearing activities, introducing correspondent firms generally guarantee the contractual obligations of their customers. Further, the Company seeks to reduce credit risk by entering into netting agreements with customers, which permit receivables and payables with such customers to be offset in the event of a customer default.
In connection with the Company’s customer financing and securities settlement activities, the Company may pledge customers’ securities as collateral to satisfy the Company’s exchange margin deposit requirements or to support its various secured financing sources such as bank loans, securities loaned and repurchase agreements. In the event counterparties are unable to meet their contractual obligations to return customers’ securities pledged as collateral, the Company may be exposed to the risk of acquiring the securities at prevailing market prices to satisfy its obligations to such customers. The Company seeks to control this risk by monitoring the market value of securities pledged and by requiring adjustments of collateral levels in the event of excess exposure. Moreover, the Company establishes credit limits for such activities and monitors credit compliance.
102
NOTES TO CONSOLIDATED FINANCIAL STATEMENTS
continued
|
CONCENTRATIONS OF CREDIT RISKS |
|
The Company is engaged in providing securities processing services to a diverse group of individuals and institutional investors, including affiliates. A substantial portion of the Company’s transactions are collateralized and are executed with, or made on behalf of, institutional investors, including other brokers and dealers, commercial banks, insurance companies, pension plans, mutual funds, hedge funds and other financial institutions. The Company’s exposure to credit risk, associated with the non-performance of customers in fulfilling their contractual obligations pursuant to securities and futures transactions, can be directly affected by volatile or illiquid trading markets, which may impair customers’ ability to satisfy their obligations to the Company. The Company attempts to minimize credit risk associated with these activities by monitoring customers’ credit exposure and collateral values and requiring, when deemed necessary, additional collateral to be deposited with the Company. |
|
A significant portion of the Company’s securities processing activities includes clearing transactions for hedge funds, brokers and dealers and other professional traders, including affiliates. Due to the nature of their operations, which may include significant levels of credit extension such as leveraged purchases, short selling and option writing, the Company may have significant credit exposure should these customers be unable to meet their commitments. In addition, the Company may be subject to concentration risk through providing margin to those customers holding large positions in certain types of securities, securities of a single issuer, including sovereign governments, issuers located in a particular country or geographic area or issuers engaged in a particular industry, where the Company receives such large positions as collateral. The Company seeks to control these risks by monitoring margin collateral levels for compliance with both regulatory and internal guidelines. Additional collateral is obtained when necessary. To further control these risks, the Company has developed computerized risk control systems that analyze the customers’ sensitivity to major market movements. The Company will require customers to deposit additional margin collateral, or to reduce positions if it is determined that customers’ activities may be subject to above-normal market risk. |
|
The Company acts as a clearing broker for substantially all of the customer and proprietary securities and futures activities of its affiliates on either a fully disclosed or omnibus basis. Such activities are conducted on either a cash or margin basis. The Company requires its affiliates to maintain margin collateral in compliance with various regulatory guidelines. The Company monitors required margin levels and requests additional collateral when deemed appropriate. |
The Company and certain of its subsidiaries file a US consolidated federal income tax return. The provision for income taxes for the fiscal years ended November 30, 2005, 2004 and 2003 consisted of the following:
|
|
|
|
|
|
|
|
|
|
|
|
|
|
|
| 2005 |
|
| 2004 |
| 2003 |
| |||
| ||||||||||||
(in thousands) |
|
|
|
|
|
|
|
|
|
|
|
|
| ||||||||||||
CURRENT: |
|
|
|
|
|
|
|
|
|
|
|
|
Federal |
|
| $ | 448,843 |
|
| $ | 568,972 |
| $ | 594,442 |
|
State and local |
|
|
| 59,032 |
|
|
| 125,332 |
|
| 156,451 |
|
Foreign |
|
|
| 124,070 |
|
|
| 65,692 |
|
| 49,800 |
|
| ||||||||||||
Total current |
|
|
| 631,945 |
|
|
| 759,996 |
|
| 800,693 |
|
| ||||||||||||
DEFERRED: |
|
|
|
|
|
|
|
|
|
|
|
|
Federal |
|
|
| 93,860 |
|
|
| (28,519 | ) |
| (133,688 | ) |
State and local |
|
|
| 35,247 |
|
|
| (34,485 | ) |
| (52,700 | ) |
Foreign |
|
|
| (16,170 | ) |
|
| (19,571 | ) |
| 1,558 |
|
| ||||||||||||
Total deferred |
|
|
| 112,937 |
|
|
| (82,575 | ) |
| (184,830 | ) |
| ||||||||||||
Total provision for income taxes |
|
| $ | 744,882 |
|
| $ | 677,421 |
| $ | 615,863 |
|
| ||||||||||||
103
NOTES TO CONSOLIDATED FINANCIAL STATEMENTS
continued
As of November 30, 2005, the Company had approximately $961 million in accumulated earnings permanently reinvested overseas. If such income were repatriated, additional federal income tax (net of available tax credits) at current tax rates would be approximately $195 million.
Significant components of the Company’s deferred tax assets (liabilities) as of November 30, 2005 and 2004 were as follows:
|
|
|
|
|
|
|
|
|
|
|
|
| 2005 |
|
| 2004 |
| ||
| |||||||||
(in thousands) |
|
|
|
|
|
|
|
|
|
| |||||||||
DEFERRED TAX ASSETS: |
|
|
|
|
|
|
|
|
|
Deferred compensation |
|
| $ | 1,233,847 |
|
| $ | 1,229,316 |
|
Liability reserves and valuation adjustments |
|
|
| 168,274 |
|
|
| 202,689 |
|
Unrealized loss |
|
|
| 18,869 |
|
|
| 33,649 |
|
Other |
|
|
| 126,559 |
|
|
| 125,371 |
|
| |||||||||
Total deferred tax assets |
|
|
| 1,547,549 |
|
|
| 1,591,025 |
|
| |||||||||
DEFERRED TAX LIABILITIES: |
|
|
|
|
|
|
|
|
|
Unrealized appreciation |
|
|
| (123,341 | ) |
|
| (101,653 | ) |
Depreciation/amortization |
|
|
| (45,893 | ) |
|
| (30,386 | ) |
Other |
|
|
| (32,687 | ) |
|
| (421 | ) |
| |||||||||
Total deferred tax liabilities |
|
|
| (201,921 | ) |
|
| (132,460 | ) |
| |||||||||
Net deferred tax assets |
|
| $ | 1,345,628 |
|
| $ | 1,458,565 |
|
| |||||||||
At November 30, 2005 and 2004, no valuation allowance has been established against deferred tax assets since it is more likely than not that the deferred tax assets will be realized.
The Company is under continuous examination by various tax authorities in jurisdictions in which the Company has significant business operations. The Company regularly assesses the likelihood of additional assessments in each of the tax jurisdictions resulting from these examinations. Tax reserves have been established, which the Company believes to be adequate in relation to the potential for additional assessments. Once established, reserves are adjusted as information becomes available or when an event requiring a change to the reserve occurs. The resolution of tax matters could have a material impact on the Company’s effective tax rate.
A reconciliation of the statutory federal income tax rates to the Company’s effective tax rates for the fiscal years ended November 30, 2005, 2004 and 2003 was as follows:
|
|
|
|
|
|
|
|
|
|
| ||||||
|
|
| 2005 |
|
| 2004 |
|
| 2003 |
|
| |||||
|
| |||||||||||||||
Statutory rate |
|
|
| 35.0 | % |
|
|
| 35.0 | % |
|
|
| 35.0 | % |
|
State and local income taxes, net of federal benefit |
|
|
| 2.7 |
|
|
|
| 2.9 |
|
|
|
| 3.8 |
|
|
Tax-exempt interest income and dividend exclusion |
|
|
| (2.1 | ) |
|
|
| (2.3 | ) |
|
|
| (2.8 | ) |
|
Domestic tax credits |
|
|
| (0.5 | ) |
|
|
| (0.5 | ) |
|
|
| (0.3 | ) |
|
Other, net |
|
|
| (1.3 | ) |
|
|
| (1.6 | ) |
|
|
| (0.9 | ) |
|
|
| |||||||||||||||
Effective tax rate |
|
|
| 33.8 | % |
|
|
| 33.5 | % |
|
|
| 34.8 | % |
|
|
| |||||||||||||||
104
NOTES TO CONSOLIDATED FINANCIAL STATEMENTS
continued
Not included in the effective tax rate is the effect of approximately $426.1 million, $163.9 million and $247.5 million in income tax benefits attributable to the distribution of common stock under the CAP Plan and other deferred compensation plans as well as the exercise of options, credited directly to paid-in capital, for fiscal 2005, 2004 and 2003, respectively.
Bear Stearns and BSSC are registered broker-dealers and, accordingly, are subject to Rule 15c3-1 under the Securities Exchange Act of 1934 (“Net Capital Rule”) and the capital rules of the NYSE, the Commodity Futures Trading Commission (“CFTC”) and other principal exchanges of which Bear Stearns and BSSC are members. At November 30, 2005, Bear Stearns’ net capital of $1.27 billion exceeded the minimum requirement by $1.18 billion. Bear Stearns’ net capital computation, as defined, includes $792.0 million, which is net capital of BSSC in excess of 5.5% of aggregate debit items arising from customer transactions.
BSIL and Bear Stearns International Trading Limited (“BSIT”), London-based broker-dealer subsidiaries, are subject to the regulatory capital requirements of the Financial Services Authority.
BSB, an Ireland-based bank principally involved in the trading and sales of fixed income products, is registered in Ireland and is subject to the regulatory capital requirements of the Irish Financial Services Regulatory Authority.
At November 30, 2005, Bear Stearns, BSSC, BSIL, BSIT and BSB were in compliance with their respective regulatory capital requirements.
Regulatory rules, as well as certain covenants contained in various instruments governing indebtedness of the Company, Bear Stearns and other regulated subsidiaries, may restrict the Company’s ability to withdraw capital from its regulated subsidiaries, which in turn could limit the Company’s ability to pay dividends. Also, the Company’s broker-dealer subsidiaries and other regulated subsidiaries are subject to minimum capital requirements that may restrict the Company’s ability to withdraw capital from its regulated subsidiaries, which in turn could limit the Company’s ability to pay dividends. At November 30, 2005, approximately $3.75 billion in equity capital of Bear Stearns, BSSC, BSIL, BSIT and BSB was restricted as to the payment of cash dividends and advances to the Company.
In June 2004, the SEC adopted rule amendments to “Alternative Net Capital Requirements for Broker-Dealers That Are Part of Consolidated Supervised Entities” (Rule 34-49830) that allow investment banks to voluntarily submit to be regulated by the SEC on a global consolidated basis. These regulations (referred to as CSE) were in response to what is known as the “Financial Conglomerates Directive” (2002/87/EC) of the European Parliament, which served to compel globally active institutions doing business in Europe to be regulated on a global consolidated basis. During fiscal 2005, the Company applied to the SEC to be regulated under this new CSE regime. The application filed with the SEC by Bear Stearns, the Company’s principal US broker-dealer, under the net capital rule amendments, was approved in November 2005. As a result, effective December 1, 2005, Bear Stearns will use alternative methods of computing market and derivative-related credit risk, and, as a condition of using these methods, the Company has consented to consolidated supervision by the SEC. The new framework will be a notable change in the Company’s regulation, as activities which are currently transacted outside of SEC regulated entities will come under the scope of certain SEC regulations and capital adequacy oversight. In particular, the Company will: compute allowable capital and allowances for market, credit and operational risk on a consolidated basis in accordance with standards prescribed in Appendix G to the Net Capital Rules; permit the SEC to examine the books and records of the Parent Company and any affiliate that does not have a principal regulator; and adopt various additional SEC reporting, record-keeping and notification requirements. Additionally, the Company must comply with the provisions of Rule 15c3-4 of the Exchange Act with respect to a group-wide internal risk management control system in the affiliate group as if it were an OTC derivative dealer, subject to certain limitations. The Company is now deemed a CSE and is in compliance with regulatory capital requirements.
105
NOTES TO CONSOLIDATED FINANCIAL STATEMENTS
continued
17. COMMITMENTS AND CONTINGENCIES
In the ordinary course of business, the Company has commitments in connection with various activities, the most significant of which are as follows:
LEASES
The Company occupies office space under leases that expire at various dates through 2024. At November 30, 2005, future minimum aggregate annual rentals payable under non-cancelable leases (net of subleases), including 383 Madison Avenue in New York City, for fiscal years ended November 30, 2006 through 2010 and the aggregate amount thereafter, are as follows:
|
|
|
|
|
| ||||
(in thousands) |
|
|
|
|
| ||||
FISCAL YEAR |
|
|
|
|
2006 |
| $ | 74,971 |
|
2007 |
|
| 78,090 |
|
2008 |
|
| 77,946 |
|
2009 |
|
| 72,452 |
|
2010 |
|
| 56,363 |
|
Thereafter |
|
| 212,844 |
|
|
The various leases contain provisions for periodic escalations resulting from increased operating and other costs. Rental expense, including escalations and net of sublease rental income, under these leases was $134.2 million, $111.4 million and $108.1 million for the fiscal years ended November 30, 2005, 2004 and 2003, respectively.
LENDING-RELATED COMMITMENTS
In connection with certain of the Company’s business activities, the Company provides financing or financing commitments to investment grade and non-investment-grade companies in the form of senior and subordinated debt, including bridge financing. Commitments have varying maturity dates and are generally contingent on the accuracy and validity of certain representations, warranties and contractual conditions applicable to the borrower. Lending-related commitments to investment grade borrowers aggregated approximately $2.37 billion and $2.58 billion at November 30, 2005 and 2004, respectively. Of this amount, approximately $652.5 million and $511.0 million was hedged at November 30, 2005 and 2004, respectively. Lending-related commitments to non-investment-grade borrowers approximated $1.44 billion and $2.19 billion at November 30, 2005 and 2004, respectively.
The Company also had contingent commitments to investment grade and non-investment-grade companies of approximately $3.89 billion and $1.98 billion as of November 30, 2005 and 2004, respectively. Generally, these commitments are provided in connection with leveraged acquisitions. These commitments are not indicative of the Company’s actual risk because the borrower may never draw upon the commitment. In fact, the borrower may not be successful in the acquisition, the borrower may access the capital markets instead of drawing on the commitment, or the Company’s portion of the commitment may be reduced through the syndication process. Additionally, the borrower’s ability to draw may be subject to there being no material adverse change in either market conditions or the borrower’s financial condition, among other factors. These commitments generally contain certain flexible pricing features to adjust for changing market conditions prior to closing.
106
NOTES TO CONSOLIDATED FINANCIAL STATEMENTS
continued
PRIVATE EQUITY-RELATED INVESTMENTS AND PARTNERSHIPS
In connection with the Company’s merchant banking activities, the Company has commitments to invest in merchant banking and private equity-related investment funds as well as commitments to invest directly in private equity-related investments. At November 30, 2005 and 2004, such commitments aggregated $222.1 million and $338.3 million, respectively. These commitments will be funded, if called, through the end of the respective investment periods, with the longest of such periods ending in 2014.
UNDERWRITING
In connection with the Company’s mortgage-backed securitizations and fixed income underwriting, the Company had commitments to purchase new issues of securities aggregating $943.1 million and $418.2 million, respectively, at November 30, 2005 and 2004.
COMMERCIAL AND RESIDENTIAL LOANS
The Company participates in the acquisition, securitization, servicing, financing and disposition of commercial and residential loans. At November 30, 2005 and 2004, the Company had entered into commitments to purchase or finance mortgage loans of $5.1 billion and $1.2 billion, respectively.
LETTERS OF CREDIT
At November 30, 2005 and 2004, the Company was contingently liable for unsecured letters of credit of approximately $2.50 billion and $2.40 billion, respectively, and letters of credit of $985.6 million and $1.19 billion, respectively, secured by financial instruments, primarily used to provide collateral for securities borrowed and to satisfy margin requirements at option and commodity exchanges.
OTHER
The Company had commitments to purchase Chapter 13 and other credit card receivables of $159.8 million and $82.5 million respectively, at November 30, 2005 and 2004.
The Company has executed a set of contractual arrangements providing for the extension of credit under certain limitations with a merchant power generator. The limit of this facility is $350 million, is subject to various operating limits and secured by various forms of collateral. The Company receives a fee based on actual utilization of the facility. This facility has a term of one year expiring November 30, 2006 and is renewable on a quarterly basis with the mutual consent of each party. There were no borrowings outstanding under this facility at November 30, 2005.
With respect to certain of the commitments outlined above, the Company utilizes various hedging strategies to actively manage its market, credit and liquidity exposures. Additionally, since these commitments may expire unused, the total commitment amount may not necessarily reflect the actual future cash funding requirements.
LITIGATION
On December 15, 2005, the Company announced that an offer of settlement had been submitted to the Securities and Exchange Commission (“SEC”) and the NYSE to resolve the previously disclosed investigations relating to mutual fund trading. The settlement offer, which was negotiated with the staffs of the SEC and the NYSE and will be recommended by them, is subject to approval by the respective regulators. Terms include a payment of $250 million and retention of independent consultants to review aspects of its mutual fund trading and global clearing operations. At November 30, 2005, the Company was fully reserved for this settlement.
In the normal course of business, the Company has been named as a defendant in various legal actions, including arbitrations, class actions and other litigation. Certain of the legal actions include claims for substantial compensatory and/or punitive damages or claims for indeterminate amounts of damages. The Company is also involved in other
107
NOTES TO CONSOLIDATED FINANCIAL STATEMENTS
continued
reviews, investigations and proceedings by governmental and self-regulatory agencies regarding the Company’s business, certain of which may result in adverse judgments, settlements, fines, penalties, injunctions or other relief.
Because litigation is inherently unpredictable, particularly in cases where claimants seek substantial or indeterminate damages or where investigations and proceedings are in the early stages, the Company cannot predict with certainty the loss or range of loss related to such matters, how such matters will be resolved, when they will ultimately be resolved, or what the eventual settlement, fine, penalty or other relief might be. Consequently, the Company cannot estimate losses or ranges of losses for matters where there is only a reasonable possibility that a loss may have been incurred. Although the ultimate outcome of these matters cannot be ascertained at this time, it is the opinion of management, after consultation with counsel, that the resolution of the foregoing matters will not have a material adverse effect on the financial condition of the Company; taken as a whole, such resolution may, however, have a material effect on the operating results in any future period, depending on the level of income for such period.
The Company has provided reserves for such matters in accordance with SFAS No. 5, “Accounting for Contingencies.” The ultimate resolution may differ materially from the amounts reserved.
In the ordinary course of business, the Company issues various guarantees to counterparties in connection with certain derivative, leasing, securitization and other transactions. FIN No. 45, “Guarantor’s Accounting and Disclosure Requirements for Guarantees, Including Indirect Guarantees of Indebtedness of Others” requires the Company to recognize a liability at the inception of certain guarantees and to disclose information about its obligations under certain guarantee arrangements.
The guarantees covered by FIN No. 45 include contracts that contingently require the guarantor to make payments to the guaranteed party based on changes related to an asset, a liability or an equity security of the guaranteed party, contracts that contingently require the guarantor to make payments to the guaranteed party based on another entity’s failure to perform under an agreement and indirect guarantees of the indebtedness of others, even though the payment to the guaranteed party may not be based on changes to an asset, liability or equity security of the guaranteed party. In addition, FIN No. 45 covers certain indemnification agreements that contingently require the guarantor to make payments to the indemnified party, such as an adverse judgment in a lawsuit or the imposition of additional taxes due to either a change in the tax law or an adverse interpretation of the tax law.
The following table sets forth the maximum payout/notional amounts associated with the Company’s guarantees as of November 30, 2005:
|
|
|
|
|
|
|
|
|
|
|
|
|
|
|
|
|
|
| Amount of Guarantee Expiration Per Period | ||||||||||||||
(in millions) |
| Less Than |
| One to Three |
| Three to |
| Greater |
| Total |
| |||||
Certain derivatives contracts (notional)(1) |
| $ | 148,692 |
| $ | 217,712 |
| $ | 114,724 |
| $ | 97,142 |
| $ | 578,270 |
|
Municipal securities |
|
| 2,459 |
|
| 317 |
|
| — |
|
| — |
|
| 2,776 |
|
Residual value guarantee |
|
| — |
|
| — |
|
| 570 |
|
| — |
|
| 570 |
|
(1) The carrying value of these derivatives approximated $3.1 billion as of November 30, 2005.
DERIVATIVE CONTRACTS
The Company’s dealer activities cause it to make markets and trade a variety of derivative instruments. Certain derivatives contracts that the Company has entered into meet the accounting definition of a guarantee under FIN No. 45. Derivatives that meet the FIN No. 45 definition of guarantees include credit default swaps (whereby a default or
108
NOTES TO CONSOLIDATED FINANCIAL STATEMENTS
continued
significant change in the credit quality of the underlying financial instrument may obligate the Company to make a payment), put options, as well as floors, caps and collars. Since the Company does not track the counterparties’ purpose for entering into a derivative contract, it has disclosed derivatives contracts that are likely to be used to protect against a change in an underlying financial instrument, regardless of their actual use.
On certain of these contracts, such as written interest rate caps and foreign currency options, the maximum payout cannot be quantified since the increase in interest rates and foreign exchange rates is not contractually limited by the terms of the contracts. As such, the Company has disclosed notional amounts as a measure of the extent of its involvement in these classes of derivatives rather than maximum payout. Notional amounts do not represent the maximum payout and generally overstate the Company’s exposure to these contracts. These derivatives contracts are recorded at fair value, which approximated $3.1 billion at November 30, 2005.
In connection with these activities, the Company attempts to mitigate its exposure to market risk by entering into a variety of offsetting derivatives contracts and security positions. For a discussion of derivatives, see Risk Management and Management’s Discussion and Analysis of Financial Condition and Results of Operations.
MUNICIPAL SECURITIES
In 1997, the Company established a program whereby it created a series of municipal securities trusts in which it has retained interests. These trusts purchase fixed-rate, long-term, highly rated, insured or escrowed municipal bonds financed by the issuance of trust certificates. Certain of the trust certificates entitle the holder to receive future payments of principal and variable interest and to tender such certificates at the option of the holder on a periodic basis. The Company acts as placement agent and as liquidity provider. The purpose of the program is to allow the Company’s clients to purchase synthetic short-term, floating-rate municipal debt that does not otherwise exist in the marketplace. In the Company’s capacity as liquidity provider to the trusts, the maximum exposure to loss at November 30, 2005 was approximately $2.78 billion, which represents the outstanding amount of all trust certificates. This exposure to loss is mitigated by the underlying municipal bonds. The underlying municipal bonds in the trusts are either AAA or AA-rated, insured or escrowed to maturity. Such bonds had a market value, net of related hedges, approximating $2.84 billion at November 30, 2005.
RESIDUAL VALUE GUARANTEE
The Company has entered into an operating lease arrangement for its world headquarters at 383 Madison Avenue in New York City (the “Synthetic Lease”). Under the terms of the Synthetic Lease, the Company is obligated to make monthly payments based on the lessor's underlying interest costs. The Synthetic Lease expires on August 14, 2009 unless both parties agree to a renewal prior to expiration. At the expiration date of the Synthetic Lease, the Company has the right to purchase the building for the amount of the then outstanding indebtedness of the lessor or to arrange for the sale of the property with the proceeds of the sale to be used to satisfy the lessor's debt obligation. If the sale of the property does not generate sufficient proceeds to satisfy the lessor's debt obligation, the Company is required to fund the shortfall up to a maximum residual value guarantee. As of November 30, 2005, there was no expected shortfall and the maximum residual value guarantee approximated $570 million.
INDEMNIFICATIONS
The Company provides representations and warranties to counterparties in connection with a variety of commercial transactions, including certain asset sales and securitizations and occasionally indemnifies them against potential losses caused by the breach of those representations and warranties. To mitigate these risks with respect to assets being securitized that have been originated by third parties, the Company seeks to obtain appropriate representations and warranties from such third-party originators upon acquisition of such assets. The Company generally performs due diligence on assets purchased and maintains underwriting standards for assets originated. The Company may also provide indemnifications to some counterparties to protect them in the event additional taxes are owed or payments are
109
NOTES TO CONSOLIDATED FINANCIAL STATEMENTS
continued
withheld, due either to a change in or adverse application of certain tax laws. These indemnifications generally are standard contractual terms and are entered into in the normal course of business. Generally, there are no stated or notional amounts included in these indemnifications, and the contingencies triggering the obligation to indemnify are not expected to occur.
Maximum payout information under these indemnifications is not readily available because of the number, size and lives of these transactions. In implementing this accounting interpretation, the Company reviewed its experience with the indemnifications on these structures. Based on such experience, it is unlikely that the Company will have to make significant payments under these arrangements.
OTHER GUARANTEES
The Company is a member of numerous exchanges and clearinghouses. Under the membership agreements, members are generally required to guarantee the performance of other members. Additionally, if a member becomes unable to satisfy its obligations to the clearinghouse, other members would be required to meet these shortfalls. To mitigate these performance risks, the exchanges and clearinghouses often require members to post collateral. The Company’s maximum potential liability under these arrangements cannot be quantified. However, the potential for the Company to be required to make payments under these arrangements is remote. Accordingly, no contingent liability is recorded in the consolidated financial statements for these arrangements.
19. SEGMENT AND GEOGRAPHIC AREA DATA
The Company operates in three principal segments — Capital Markets, Global Clearing Services and Wealth Management. These segments offer different products and services and are managed separately as different levels and types of expertise are required to effectively manage the segments’ transactions.
The Capital Markets segment comprises the institutional equities, fixed income and investment banking areas. The Capital Markets segment operates as a single integrated unit that provides the sales, trading and origination effort for various fixed income, equity and advisory products and services. Each of the three businesses work in tandem to deliver these services to institutional and corporate clients.
Institutional equities consists of research, sales and trading in areas such as domestic and international equities, block trading, convertible bonds, over-the-counter equities, equity derivatives, risk and convertible arbitrage and the NYSE, AMEX and ISE specialist activities. Fixed income includes sales, trading and research provided to institutional clients across a variety of products such as mortgage- and asset-backed securities, corporate and government bonds, municipal bonds, high yield products, foreign exchange and interest rate and credit derivatives. Investment banking provides services in capital raising, strategic advice, mergers and acquisitions and merchant banking. Capital raising encompasses the Company’s underwriting of equity, investment grade, municipal and high yield debt products.
The Global Clearing Services segment provides execution, clearing, margin lending and securities borrowing to facilitate customer short sales to clearing clients worldwide. Prime brokerage clients include hedge funds and clients of money managers, short sellers and other professional investors. Fully disclosed clients engage in either the retail or institutional brokerage business.
The Wealth Management segment is composed of the PCS and asset management areas. PCS provides high-net-worth individuals with an institutional level of investment service, including access to the Company’s resources and professionals. Asset management manages equity, fixed income and alternative assets for leading corporate pension plans, public systems, endowments, foundations, multi-employer plans, insurance companies, corporations, families and high-net-worth individuals in the US and abroad.
110
NOTES TO CONSOLIDATED FINANCIAL STATEMENTS
continued
The three business segments comprise many business areas, with interactions among each. Revenues and expenses include those that are directly related to each segment. Revenues from intersegment transactions are based upon specific criteria or agreed-upon rates with such amounts eliminated in consolidation. Individual segments also include revenues and expenses relating to various items, including corporate overhead and interest, which are internally allocated by the Company primarily based on balance sheet usage or expense levels. The Company generally evaluates performance of the segments based on net revenues and profit or loss before provision for income taxes.
Within the Capital Markets segment, certain servicing fees were reclassified from investment banking to fixed income during the quarter ended May 31, 2005. These reclassifications within the Capital Markets segment were made to prior year amounts to conform to the current year’s presentation.
111
NOTES TO CONSOLIDATED FINANCIAL STATEMENTS
continued
|
|
|
|
|
|
|
|
|
|
|
|
|
|
|
|
|
|
|
|
|
|
| |||
Fiscal Years Ended November 30, |
|
| 2005 |
|
| 2004 |
| 2003 |
| |||
| ||||||||||||
(in thousands) |
|
|
|
|
|
|
|
|
|
|
|
|
| ||||||||||||
NET REVENUES(1) |
|
|
|
|
|
|
|
|
|
|
|
|
Capital Markets |
|
|
|
|
|
|
|
|
|
|
|
|
Institutional equities |
|
| $ | 1,409,603 |
|
| $ | 1,071,609 |
| $ | 932,567 |
|
Fixed income |
|
|
| 3,251,333 |
|
|
| 3,186,741 |
|
| 2,972,192 |
|
Investment banking |
|
|
| 980,459 |
|
|
| 1,072,770 |
|
| 914,558 |
|
| ||||||||||||
Total Capital Markets |
|
|
| 5,641,395 |
|
|
| 5,331,120 |
|
| 4,819,317 |
|
|
|
|
|
|
|
|
|
|
|
|
|
|
Global Clearing Services |
|
|
| 1,067,985 |
|
|
| 932,416 |
|
| 784,072 |
|
|
|
|
|
|
|
|
|
|
|
|
|
|
Wealth Management |
|
|
|
|
|
|
|
|
|
|
|
|
Private client services(2) |
|
|
| 450,181 |
|
|
| 441,242 |
|
| 378,787 |
|
Asset management |
|
|
| 228,643 |
|
|
| 185,085 |
|
| 132,520 |
|
| ||||||||||||
Total Wealth Management |
|
|
| 678,824 |
|
|
| 626,327 |
|
| 511,307 |
|
|
|
|
|
|
|
|
|
|
|
|
|
|
Other(3) |
|
|
| 22,590 |
|
|
| (76,980 | ) |
| (120,205 | ) |
| ||||||||||||
Total net revenues |
|
| $ | 7,410,794 |
|
| $ | 6,812,883 |
| $ | 5,994,491 |
|
| ||||||||||||
|
|
|
|
|
|
|
|
|
|
|
|
|
PRE-TAX INCOME |
|
|
|
|
|
|
|
|
|
|
|
|
Capital Markets |
|
| $ | 1,969,564 |
|
| $ | 1,980,513 |
| $ | 1,924,071 |
|
Global Clearing Services |
|
|
| 526,148 |
|
|
| 404,312 |
|
| 245,531 |
|
Wealth Management |
|
|
| 39,665 |
|
|
| 66,942 |
|
| 19,217 |
|
Other(3) |
|
|
| (328,318 | ) |
|
| (429,613 | ) |
| (416,550 | ) |
| ||||||||||||
Total pre-tax income |
|
| $ | 2,207,059 |
|
| $ | 2,022,154 |
| $ | 1,772,269 |
|
| ||||||||||||
|
|
|
|
|
|
|
|
|
|
|
|
|
(1) Certain prior year items have been reclassified to conform to the current year’s presentation. | ||||||||||||
|
|
|
|
|
|
|
|
|
|
|
|
|
(2) Private client services detail: | ||||||||||||
Gross revenues, before transfer to Capital Markets segment |
|
| $ | 543,767 |
|
| $ | 526,122 |
| $ | 477,227 |
|
Revenue transferred to Capital Markets segment |
|
|
| (93,586 | ) |
|
| (84,880 | ) |
| (98,440 | ) |
|
|
|
|
|
|
| ||||||
Private client services net revenues |
|
| $ | 450,181 |
|
| $ | 441,242 |
| $ | 378,787 |
|
|
|
|
|
|
|
|
|
|
|
|
|
|
(3) Includes consolidation and elimination entries, unallocated revenues (predominantly interest) and certain corporate administrative functions, including certain legal costs and costs related to the CAP Plan, which approximated $144.0 million, $176.0 million and $193.0 million for the fiscal years ended November 30, 2005, 2004 and 2003, respectively. | ||||||||||||
|
|
|
|
|
|
|
|
|
|
|
|
|
|
|
|
|
|
|
|
|
|
| |||
As of November 30, |
|
| 2005 |
|
| 2004 |
| 2003 |
| |||
| ||||||||||||
(in thousands) |
|
|
|
|
|
|
|
|
|
|
|
|
| ||||||||||||
SEGMENT ASSETS |
|
|
|
|
|
|
|
|
|
|
|
|
Capital Markets |
|
| $ | 195,292,625 |
|
| $ | 157,141,644 |
| $ | 123,174,061 |
|
Global Clearing Services |
|
|
| 85,625,396 |
|
|
| 87,793,151 |
|
| 79,251,142 |
|
Wealth Management |
|
|
| 2,751,749 |
|
|
| 2,679,697 |
|
| 2,325,456 |
|
Other |
|
|
| 8,965,463 |
|
|
| 8,335,402 |
|
| 7,417,451 |
|
| ||||||||||||
Total segment assets |
|
| $ | 292,635,233 |
|
| $ | 255,949,894 |
| $ | 212,168,110 |
|
| ||||||||||||
112
NOTES TO CONSOLIDATED FINANCIAL STATEMENTS
continued
The operations of the Company are conducted primarily in the United States of America. The Company also maintains offices in Europe, Asia and Latin America. The following are net revenues, income before provision for income taxes and assets by geographic region for the fiscal years ended November 30, 2005, 2004 and 2003:
|
|
|
|
|
|
|
|
|
|
|
|
|
|
|
|
|
|
|
|
|
|
|
|
|
|
|
|
| 2005 |
|
| 2004 |
| 2003 |
| |||
| ||||||||||||
(in thousands) |
|
|
|
|
|
|
|
|
|
|
|
|
| ||||||||||||
US net revenues |
|
| $ | 6,439,926 |
|
| $ | 6,172,286 |
| $ | 5,493,407 |
|
Non-US net revenues |
|
|
| 970,868 |
|
|
| 640,597 |
|
| 501,084 |
|
| ||||||||||||
Consolidated net revenues |
|
| $ | 7,410,794 |
|
| $ | 6,812,883 |
| $ | 5,994,491 |
|
| ||||||||||||
|
|
|
|
|
|
|
|
|
|
|
|
|
US income before provision for income taxes |
|
| $ | 1,882,484 |
|
| $ | 1,920,038 |
| $ | 1,704,898 |
|
Non-US income before provision for income taxes |
|
|
| 324,575 |
|
|
| 102,116 |
|
| 67,371 |
|
| ||||||||||||
Consolidated income before provision for income taxes |
|
| $ | 2,207,059 |
|
| $ | 2,022,154 |
| $ | 1,772,269 |
|
| ||||||||||||
|
|
|
|
|
|
|
|
|
|
|
|
|
US assets |
|
| $ | 346,267,057 |
|
| $ | 330,035,057 |
| $ | 279,673,476 |
|
Non-US assets |
|
|
| 74,268,831 |
|
|
| 57,627,686 |
|
| 43,432,595 |
|
Eliminations |
|
|
| (127,900,655 | ) |
|
| (131,712,849 | ) |
| (110,937,961 | ) |
| ||||||||||||
Consolidated assets |
|
| $ | 292,635,233 |
|
| $ | 255,949,894 |
| $ | 212,168,110 |
|
| ||||||||||||
Because of the international nature of the financial markets and the resultant integration of US and non-US services, it is difficult to precisely separate foreign operations. The Company conducts and manages these activities with a view toward the profitability of the Company as a whole. Accordingly, the foreign operations information is, of necessity, based on management judgments and internal allocations. Included within the Company’s US net revenues during fiscal 2005 and fiscal 2004 are the revenues of Bear Wagner Specialists LLC.
20. MAJORITY-OWNED JOINT VENTURE
The Company participates, through a majority-owned joint venture, in specialist activities on the NYSE, AMEX and ISE. For fiscal 2003, the Company included revenues from specialist activities in “Principal Transactions” revenues in the Consolidated Statement of Income. Due to the occurrence of a Control Event, as defined by the joint venture Operating Agreement, triggered in December 2003, the Company achieved a controlling interest in the joint venture. As a result, commencing in fiscal 2004, the Company began consolidating this entity. Included in the Consolidated Statements of Financial Condition at November 30, 2005 and 2004 are total assets of $1.7 billion and $1.8 billion, including approximately $323 million and $363 million of goodwill and identifiable intangible assets, respectively.
113
NOTES TO CONSOLIDATED FINANCIAL STATEMENTS
continued
21. QUARTERLY INFORMATION (UNAUDITED)
The unaudited quarterly results of operations of the Company for the fiscal years ended November 30, 2005 and 2004 are prepared in conformity with accounting principles generally accepted in the United States of America, which include industry practices, and reflect all adjustments that are, in the opinion of management, necessary for a fair presentation of the results of operations for the periods presented. Results of any interim period are not necessarily indicative of results for a full year.
|
|
|
|
|
|
|
|
|
|
|
|
|
|
|
|
|
|
| Quarters Ended, |
|
|
|
| ||||||||||
|
|
|
|
|
| |||||||||||
|
| February 28, |
| May 31, |
| August 31, |
| November 30, |
| Total |
| |||||
| ||||||||||||||||
(in thousands, except per share data) |
|
|
|
|
|
|
|
|
|
|
|
|
|
|
|
|
| ||||||||||||||||
FISCAL YEAR ENDED NOVEMBER 30, 2005 |
|
|
|
|
|
|
|
|
|
|
|
|
|
|
|
|
Revenues |
| $ | 2,622,369 |
| $ | 2,823,580 |
| $ | 2,925,394 |
| $ | 3,181,104 |
| $ | 11,552,447 |
|
Interest expense |
|
| 784,709 |
|
| 950,028 |
|
| 1,113,114 |
|
| 1,293,802 |
|
| 4,141,653 |
|
| ||||||||||||||||
Revenues, net of interest expense |
|
| 1,837,660 |
|
| 1,873,552 |
|
| 1,812,280 |
|
| 1,887,302 |
|
| 7,410,794 |
|
| ||||||||||||||||
|
|
|
|
|
|
|
|
|
|
|
|
|
|
|
|
|
Non-interest expenses |
|
|
|
|
|
|
|
|
|
|
|
|
|
|
|
|
Employee compensation and benefits |
|
| 906,775 |
|
| 922,908 |
|
| 850,985 |
|
| 872,548 |
|
| 3,553,216 |
|
Other |
|
| 352,557 |
|
| 488,205 |
|
| 381,140 |
|
| 428,617 |
|
| 1,650,519 |
|
| ||||||||||||||||
Total non-interest expenses |
|
| 1,259,332 |
|
| 1,411,113 |
|
| 1,232,125 |
|
| 1,301,165 |
|
| 5,203,735 |
|
| ||||||||||||||||
|
|
|
|
|
|
|
|
|
|
|
|
|
|
|
|
|
Income before provision for income taxes |
|
| 578,328 |
|
| 462,439 |
|
| 580,155 |
|
| 586,137 |
|
| 2,207,059 |
|
Provision for income taxes |
|
| 199,523 |
|
| 164,329 |
|
| 201,850 |
|
| 179,180 |
|
| 744,882 |
|
| ||||||||||||||||
Net income |
| $ | 378,805 |
| $ | 298,110 |
| $ | 378,305 |
| $ | 406,957 |
| $ | 1,462,177 |
|
| ||||||||||||||||
|
|
|
|
|
|
|
|
|
|
|
|
|
|
|
|
|
Basic earnings per share(1) |
| $ | 2.94 |
| $ | 2.32 |
| $ | 2.96 |
| $ | 3.21 |
| $ | 11.42 |
|
Diluted earnings per share(1) |
| $ | 2.64 |
| $ | 2.09 |
| $ | 2.69 |
| $ | 2.90 |
| $ | 10.31 |
|
| ||||||||||||||||
|
|
|
|
|
|
|
|
|
|
|
|
|
|
|
|
|
Cash dividends declared per common share |
| $ | 0.25 |
| $ | 0.25 |
| $ | 0.25 |
| $ | 0.25 |
| $ | 1.00 |
|
| ||||||||||||||||
|
|
|
|
|
|
|
|
|
|
|
|
|
|
|
|
|
|
| Quarters Ended, |
|
|
|
| ||||||||||
|
|
|
|
|
| |||||||||||
|
| February 29, |
| May 31, |
| August 31, |
| November 30, |
| Total |
| |||||
| ||||||||||||||||
(in thousands, except per share data) |
|
|
|
|
|
|
|
|
|
|
|
|
|
|
|
|
| ||||||||||||||||
FISCAL YEAR ENDED NOVEMBER 30, 2004 |
|
|
|
|
|
|
|
|
|
|
|
|
|
|
|
|
Revenues |
| $ | 2,081,445 |
| $ | 2,063,798 |
| $ | 1,894,353 |
| $ | 2,382,306 |
| $ | 8,421,902 |
|
Interest expense |
|
| 355,522 |
|
| 340,260 |
|
| 359,588 |
|
| 553,649 |
|
| 1,609,019 |
|
| ||||||||||||||||
Revenues, net of interest expense |
|
| 1,725,923 |
|
| 1,723,538 |
|
| 1,534,765 |
|
| 1,828,657 |
|
| 6,812,883 |
|
| ||||||||||||||||
|
|
|
|
|
|
|
|
|
|
|
|
|
|
|
|
|
Non-interest expenses |
|
|
|
|
|
|
|
|
|
|
|
|
|
|
|
|
Employee compensation and benefits |
|
| 849,148 |
|
| 860,053 |
|
| 743,038 |
|
| 801,623 |
|
| 3,253,862 |
|
Other |
|
| 345,797 |
|
| 352,009 |
|
| 347,848 |
|
| 491,213 |
|
| 1,536,867 |
|
| ||||||||||||||||
Total non-interest expenses |
|
| 1,194,945 |
|
| 1,212,062 |
|
| 1,090,886 |
|
| 1,292,836 |
|
| 4,790,729 |
|
| ||||||||||||||||
|
|
|
|
|
|
|
|
|
|
|
|
|
|
|
|
|
Income before provision for income taxes |
|
| 530,978 |
|
| 511,476 |
|
| 443,879 |
|
| 535,821 |
|
| 2,022,154 |
|
Provision for income taxes |
|
| 169,913 |
|
| 163,673 |
|
| 160,620 |
|
| 183,215 |
|
| 677,421 |
|
| ||||||||||||||||
Net income |
| $ | 361,065 |
| $ | 347,803 |
| $ | 283,259 |
| $ | 352,606 |
| $ | 1,344,733 |
|
| ||||||||||||||||
|
|
|
|
|
|
|
|
|
|
|
|
|
|
|
|
|
Basic earnings per share(1) |
| $ | 2.88 |
| $ | 2.77 |
| $ | 2.31 |
| $ | 2.91 |
| $ | 10.88 |
|
Diluted earnings per share |
| $ | 2.57 |
| $ | 2.49 |
| $ | 2.09 |
| $ | 2.61 |
| $ | 9.76 |
|
| ||||||||||||||||
|
|
|
|
|
|
|
|
|
|
|
|
|
|
|
|
|
Cash dividends declared per common share |
| $ | 0.20 |
| $ | 0.20 |
| $ | 0.20 |
| $ | 0.25 |
| $ | 0.85 |
|
| ||||||||||||||||
(1) Due to rounding and/or the effect of averaging the number of shares of common stock and common stock equivalents throughout the year, the sum of the quarters’ earnings per share amounts does not equal the full fiscal year amount.
114
THE BEAR STEARNS COMPANIES INC.
CORPORATE INFORMATION
PRICE RANGE OF COMMON STOCK AND DIVIDENDS
The common stock of the Company is traded on the NYSE under the symbol BSC. The table below sets forth for the periods indicated the closing high and low prices for the common stock and the cash dividends declared on the common stock.
As of February 6, 2006, there were 1,614 holders of record of the Company’ s common stock. On February 6, 2006, the last reported sales price of the Company’ s common stock was $128.94.
Dividends are payable on January 15, April 15, July 15 and October 15 in each year on the Company’ s outstanding Cumulative Preferred Stock, Series E; Cumulative Preferred Stock, Series F; and Cumulative Preferred Stock, Series G (collectively, the “ Preferred Stock”). The terms of the Preferred Stock require that all accrued dividends in arrears be paid prior to the payment of any dividends on the common stock.
Since the Company is a holding company, its ability to pay dividends is limited by the ability of its subsidiaries to pay dividends and to make advances to the Company. See Note 16, “Regulatory Requirements,” in the Notes to Consolidated Financial Statements for a further description of the restrictions on dividends.
|
|
|
|
|
|
|
|
|
|
|
|
| High | Low | Cash Dividends |
| |||||
| ||||||||||
FISCAL YEAR ENDED NOVEMBER 30, 2005 |
|
|
|
|
|
|
|
|
|
|
First Quarter (through February 28, 2005) |
| $ | 106.68 |
| $ | 96.65 |
| $ | 0.25 |
|
Second Quarter (through May 31, 2005) |
|
| 106.03 |
|
| 93.09 |
|
| 0.25 |
|
Third Quarter (through August 31, 2005) |
|
| 107.21 |
|
| 97.96 |
|
| 0.25 |
|
Fourth Quarter (through November 30, 2005) |
|
| 114.47 |
|
| 101.46 |
|
| 0.25 |
|
|
|
|
|
|
|
|
|
|
|
|
FISCAL YEAR ENDED NOVEMBER 30, 2004 |
|
|
|
|
|
|
|
|
|
|
First Quarter (through February 29, 2004) |
| $ | 87.84 |
| $ | 71.00 |
| $ | 0.20 |
|
Second Quarter (through May 31, 2004) |
|
| 91.09 |
|
| 76.62 |
|
| 0.20 |
|
Third Quarter (through August 31, 2004) |
|
| 89.50 |
|
| 79.40 |
|
| 0.20 |
|
Fourth Quarter (through November 30, 2004) |
|
| 98.55 |
|
| 86.25 |
|
| 0.25 |
|
| ||||||||||
115