Exhibit 99.1
CH2M HILL Companies, Ltd.
CEO Quarterly Report
Second Quarter 2015
Forward-looking Statements
This report contains “forward-looking statements,” as that term is defined in U.S. Federal and certain foreign securities regulations, including information related to our anticipated future operational and financial results, business strategies, client market segment concerns, and growth opportunities.
Although CH2M’s management believes that its expectations are based on reasonable assumptions, these assumptions are subject to a wide range of economic, business, regulatory, technical, legal, and other unforeseen risks which may cause actual results to differ materially from those stated or implied by these forward-looking statements. This communication should be read in conjunction with all the other information included in our most current Prospectus and European Prospectus, which are filed with the U.S. Securities and Exchange Commission (SEC) and the U.K. Financial Conduct Authority (FCA), respectively, and, for our stockholders outside of the U.S. and the European Union, similar documents filed with local securities regulators, where required. You should also read our Annual Report on Form 10-K and quarterly reports on Form 10-Q, which include a list of factors that could cause actual operational and financial results to differ from those expected. For information about the price of CH2M stock, please view our most recent Form 8-K. All documents required to be filed with the SEC and other regulators are available via the stockholder information website at www.ch2mstockholder.com and on the SEC’s website at www.sec.gov.
Dear Stockholders,
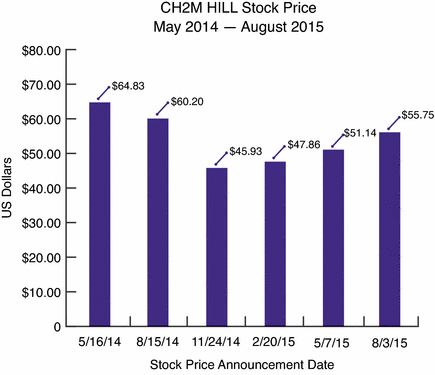
I’m pleased to share with you that we had another solid quarter, and we are reporting profitable financial performance and improved results when compared to the second quarter of 2014. Our second quarter net income is $16 million, or $0.59 per diluted share on revenue of $1.3 billion. This compares to net income of $11 million, or $0.40 per diluted share on revenue of $1.4 billion for the second quarter of 2014. Effective August 3, 2015, the Board of Directors valued our common stock at $55.75 per share, up from $51.14 per share from our previous quarter.
As of June 26, 2015, cash and cash equivalents totaled $191 million. Total debt outstanding was $329 million as compared to $513 million at December 31, 2014, and available capacity under our revolving credit facility was $484 million. We generated improved cash flow from operations of $33 million in the six months ending June 26, 2015 as compared to cash used in operations of $24 million for the same time frame in 2014.
Our performance is a result of solid delivery in several of our core businesses, improved operational efficiency, and continued cost savings from the restructuring efforts we began last September, an important part of laying a foundation for our company’s financial growth.
While I am pleased about our quarter overall, it was impacted by an additional $43 million loss on a fixed-price contract in our Transportation business group to design and construct roadway improvements in the southwestern United States, which we reported in previous quarters. While we are disappointed in this quarter’s loss, we have implemented an improved recovery strategy and have added additional experienced staff to the project. We are also working with the client for fair restitution. We’ll keep you updated as this progresses.
Despite this project loss, we’re optimistic about the second half of the year. Our sales pipeline is robust, and our overall sales effectiveness continues to improve. This quarter we won several exciting opportunities including the full delivery scope as Programme Management Consultant for the Dubai 2020 EXPO. We’ll also be working with the City of Vancouver, Washington, to provide operations and maintenance of the City’s two wastewater treatment facilities. In addition, our CH2M-led Canadian National Energy Alliance was selected as the preferred bidder for the Atomic Energy of Canada Limited’s restructuring of nuclear laboratories through a government-owned, contractor-operated model. The consortium will be responsible for the decommissioning and radioactive waste management of legacy materials accumulated during the more than 60 years of activity across 10 locations in Canada.
There is nothing more rewarding to us than winning and executing good work; however, our ability to invest in our future is another important aspect in sustaining profitable growth. As we disclosed on May 28, 2015, we closed our preferred stock sale with a subsidiary owned by investment funds affiliated with Apollo Global Management, LLC, which gives us the flexibility to pay down our debt, provide additional liquidity to our shareholders, and invest in our future.
In closing, we see positive momentum and concrete improvements in our company’s performance. Our laser focus and dedication to our clients is unwavering; we remain committed to delivering exceptional work and tackling their toughest challenges with optimism and imagination. We’re also very focused and committed to making smarter business decisions going forward with regard to how we operate in serving our clients because we believe if we do, there is tremendous benefit for our shareholders and opportunities for our employees. Our short- and long-term outlook is bright, and the leadership team and I are enthusiastic about our great company’s potential.
Thank you for your continued support and commitment to CH2M.

Jacqueline Hinman, Chairman and CEO
CH2M HILL Companies, Ltd.
2
Second Quarter 2015 Financial Results
Commenting on the second quarter results, CH2M’s Chief Financial Officer Gary McArthur said, “We had a good second quarter with year-over-year improvement, and we’re ahead of plan through the first half of the year even with our project loss. We’re still on track to meet our guidance for 2015.”
Here are additional highlights from the quarter.
New Gross Margin In (“NGMI”)
Gross margin from new wins increased $33 million or 13% as compared to the prior year quarter, including some key wins that position us well for the future. Increased client focus and a renewed effort on driving growth in our core businesses are expected to drive improved new win performance in the back half of the year.
Revenue
Second quarter revenue was $1.3 billion, a decrease of $78 million, or 6%, as compared to the same time frame in 2014. The decline was primarily due to a decrease of $52 million in our Power segment as we decided to shift away from fixed-price EPC projects last year, and ultimately, exited this business. We also saw a reduction in revenue in our Environment & Nuclear segment of $26 million, or 6%, when compared to the same quarter in 2014 due to lower volume and in our Oil, Gas & Chemicals segment where revenue decreased by $9 million, or 4% due to the general weakness in the energy sector.
Our Water segment increased $10 million, or 3%, our Industrial & Urban Environments segment increased $2 million, or 2%, while revenue for our Transportation segment was essentially flat. Excluding revenue from our Power business in the second quarter of 2015 and 2014, our revenue would have been $1.29 billion and $1.31 billion, respectively.
Year-to-date, revenue was $2.6 billion, decreasing by $94 million, or 3%, when compared to the same period in 2014, due to the same factors noted above.
Net Income
Net income in the second quarter of 2015 was $16 million as compared to $11 million for the same quarter in 2014, an increase of $5 million, or 42%. Strong bottom-line performance across all our business segments, primarily as result of the cost actions initiated late in 2014, was mostly offset by a $26 million after-tax charge on a Transportation fixed-price contract to design and construct roadway improvements on an expressway in the southwestern United States. Second quarter 2014 results included a $14 million after-tax project loss related to increased costs to complete an Industrial & Urban Environments communications installation project in Europe. Total Controlled Indirect Costs (“TCIC”), the company’s equivalent of selling, general and administrative expense, was $60 million lower than the same quarter last year.
Excluding restructuring costs of $6 million after-tax, our net income for the quarter ended June 26, 2015, would have been $22 million.
Net income for the six-month period ended June 26, 2015, was $40 million, an increase of $34 million as compared to the same period in 2014.
3
Operating Segments
Within the Industrial & Urban Environments segment, operating income was $7 million, an increase of $27 million, in the second quarter of 2015 compared to an operating loss of $20 million for the same period in 2014. As discussed above, the increase was due to the communications installation project loss in 2014.
Several other segments had improved performance in the second quarter of 2015 compared to the same quarter in 2014 primarily due to cost reductions related to restructuring activities as follows: in Water, operating income increased $7 million, or 37%; in Oil, Gas & Chemicals, operating income increased $5 million, going from $1 million in 2014 to $6 million in 2015; and in Environment & Nuclear, operating income increased $4 million, or 21%. The Power segment operating loss of $3 million was consistent with last year due to declines in revenue offset by cost reductions as we continue our exit from the Power business.
Offsetting these increases was a $43 million pre-tax charge in the quarter ended June 26, 2015, on the Transportation fixed-price contract discussed earlier, bringing the total pre-tax charge in 2015 to $54 million. The project cost growth was primarily caused by resource and work constraints reducing work productivity rates and delayed resolution with the client on movement of traffic considerations. Additionally, the project experienced delays from unexpected subsurface site conditions and from late delivery of a third-party contractor’s design. Management is assessing the recovery of cost overruns and schedule delays and is pursuing cost recovery through the contractual claims process. We may incur additional costs and losses if our cost estimation processes identify new costs not previously included in our total estimated loss or if our plans to meet our revised schedule are not achieved resulting in liquidated damages under our contract.
Cash and Liquidity
As of June 26, 2015, cash and cash equivalents totaled $191 million. Total debt outstanding was $329 million and available capacity under our revolving credit facility was $484 million. We generated improved cash flow from operations of $33 million in the six months ending June 26, 2015.
Preferred Stock
On June 24, 2015, the company sold and issued an aggregate of 3,214,400 shares of Series A Preferred Stock for an aggregate purchase price of $200 million in a private placement to a subsidiary owned by investment funds affiliated with Apollo Global Management, LLC (together with its subsidiaries, “Apollo”). Total proceeds from the preferred stock offering were $192 million, net of issuance costs of $8 million. The sale occurred in connection with the Initial Closing pursuant to the Subscription Agreement entered into by the Company and Apollo on May 27, 2015. Subject to the conditions within the Subscription Agreement, Apollo will purchase an additional 1,607,200 Series A Preferred Stock for an aggregate purchase price of approximately $100 million in a second closing that will occur on the one-year anniversary of the Initial Closing or upon the earlier election of the Company.
For a summary of the terms and conditions of the Series A Preferred Stock, see our Form 8-K’s filed with the Securities and Exchange Commission on May 28, 2015 and June 24, 2015.
2015 Outlook
Consistent with prior projections, we expect 2015 revenue to be in the same range as 2014 with substantially improved net income more in line with profitable past performance as a result of the recent restructuring actions, improved operational efficiency, and the expectation that we will have fewer projects in a loss position in 2015.
4
Stock Price
Effective August 3, 2015, the Board of Directors valued the price of our common stock at $55.75 per share, an increase of 9% compared to the price of CH2M common stock that was set by the CH2M Board of Directors on May 7, 2015.
The next trade date on CH2M’s internal market is September 3, 2015. Those eligible participants who wish to buy or sell CH2M common stock in their ownership accounts on this trade date will need to notify our broker, Neidiger, Tucker and Bruner, Inc. (“NTB”), no later than 5:00 p.m. MDT on August 14, 2015. All eligible participants will receive detailed information about the trade date and how to participate directly from NTB. Participants who wish to sell shares in their 401(k) account will need to notify Fidelity no later than 2:00 p.m. MDT on August 7, 2015.
5
Financial Highlights
Unaudited Consolidated Statements of Income (dollars in thousands, except per-share data):
| | Three Months Ended | | Six Months Ended | |
| | June 26, | | June 30, | | June 26, | | June 30, | |
| | 2015 | | 2014 | | 2015 | | 2014 | |
Gross revenue | | $ | 1,324,048 | | $ | 1,402,448 | | $ | 2,588,034 | | $ | 2,681,897 | |
Equity in earnings of joint ventures and affiliated companies | | 10,668 | | 15,890 | | 22,018 | | 35,177 | |
Operating expenses: | | | | | | | | | |
Direct cost of services and overhead | | (1,077,982 | ) | (1,119,346 | ) | (2,080,431 | ) | (2,170,199 | ) |
General and administrative | | (227,351 | ) | (279,417 | ) | (459,373 | ) | (536,846 | ) |
Operating income | | 29,383 | | 19,575 | | 70,248 | | 10,029 | |
Other income (expense): | | | | | | | | | |
Interest income | | 61 | | 281 | | 102 | | 495 | |
Interest expense | | (4,484 | ) | (3,325 | ) | (8,380 | ) | (6,755 | ) |
Income before provision for income taxes | | 24,960 | | 16,531 | | 61,970 | | 3,769 | |
Provision for income taxes | | (9,326 | ) | (4,373 | ) | (18,831 | ) | (488 | ) |
Net income | | 15,634 | | 12,158 | | 43,139 | | 3,281 | |
Less: loss (income) attributable to noncontrolling interests | | 644 | | (708 | ) | (3,363 | ) | 2,077 | |
Net income attributable to CH2M | | $ | 16,278 | | $ | 11,450 | | $ | 39,776 | | $ | 5,358 | |
Net income attributable to CH2M per common share: | | | | | | | | | |
Basic | | $ | 0.59 | | $ | 0.40 | | $ | 1.45 | | $ | 0.19 | |
Diluted | | $ | 0.59 | | $ | 0.40 | | $ | 1.45 | | $ | 0.18 | |
Weighted average number of common shares: | | | | | | | | | |
Basic | | 27,340,328 | | 28,505,659 | | 27,351,912 | | 28,657,340 | |
Diluted | | 27,364,202 | | 28,815,591 | | 27,382,949 | | 28,976,337 | |
6
Stock Price Chart
7
Reconciliation of Non-GAAP Financial Measures and Regulation G Disclosure
To supplement our consolidated financial statements, which are presented in accordance with U.S. generally accepted accounting principles (GAAP), we provide additional measures of net income attributable to CH2M and net income per diluted common share attributable to CH2M adjusted to exclude or deduct certain costs, charges or expenses. CH2M management believes these non-GAAP financial measures, when considered together with the GAAP financial measures, provide information that is useful to investors in understanding period-over-period operating results separate and apart from items that may, or could, have a disproportionately positive or negative impact on results in any particular period. CH2M management also believes that these non-GAAP financial measures enhance the ability of investors to analyze CH2M’s business trends and to understand CH2M’s performance. Any analysis of non-GAAP financial measures should be used only in conjunction with results presented in accordance with GAAP. A reconciliation of these non-GAAP financial measures with the most directly comparable financial measures calculated in accordance with GAAP follows:
| | Quarter Ended June 26, 2015 | |
| | As Reported | | Adjustment (A) | | Non-GAAP | |
| | (In millions, except per share amounts) |
Revenue | | $ | 1,324 | | $ | (35 | ) | $ | 1,289 | |
Net income attributable to CH2M | | $ | 16 | | $ | 6 | | $ | 22 | |
Net income per diluted common share attributable to CH2M | | $ | 0.59 | | $ | 0.24 | | $ | 0.83 | |
(A) Adjustments relate to 1) revenue from our Power business of $35 million, and 2) costs incurred in connection with activities resulting from our restructuring plan announced in the third quarter of 2014 and include after-tax restructuring charges of $6 million (or $0.24 per diluted share).
| | Quarter Ended June 30, 2014 | |
| | As Reported | | Adjustment (A) | | Non-GAAP | |
| | (In millions, except per share amounts) | |
Revenue | | $ | 1,402 | | $ | (88 | ) | $ | 1,314 | |
Net income attributable to CH2M | | $ | 11 | | $ | — | | $ | 11 | |
Net income per diluted common share attributable to CH2M | | $ | 0.40 | | $ | — | | $ | 0.40 | |
(A) Adjustments relate to revenue from our Power business of $88 million.
8
Reconciliation of Non-GAAP Financial Measures and Regulation G Disclosure (continued)
| | Six Months Ended June 26, 2015 | |
| | As Reported | | Adjustment (A) | | Non-GAAP | |
| | (In millions, except per share amounts) | |
Revenue | | $ | 2,588 | | $ | (71 | ) | $ | 2,517 | |
Net income attributable to CH2M | | $ | 40 | | $ | 13 | | $ | 53 | |
Net income per diluted common share attributable to CH2M | | $ | 1.45 | | $ | 0.48 | | $ | 1.93 | |
(A) Adjustments relate to 1) revenue from our Power business of $71 million, and 2) costs incurred in connection with activities resulting from our restructuring plan announced in the third quarter of 2014 and include after-tax restructuring charges of $12 million (or $0.44 per diluted share) and after-tax losses from our Power business of $1 million (or $0.04 per diluted share).
| | Six Months Ended June 30, 2014 | |
| | As Reported | | Adjustment | | Non-GAAP | |
| | (In millions, except per-share amounts) | |
Revenue | | $ | 2,682 | | $ | (162 | ) | $ | 2,520 | |
Net income attributable to CH2M | | $ | 5 | | $ | 29 | | $ | 34 | |
Net income per diluted common share attributable to CH2M | | $ | 0.18 | | $ | 1.01 | | $ | 1.19 | |
(A) Adjustments relate to 1) revenue from our Power business of $162 million, and 2) after-tax losses from our Power business of $29 million (or $1.01 per diluted share).
9