UNITED STATES
SECURITIES AND EXCHANGE COMMISSION
Washington, DC 20549
FORM N-CSR
CERTIFIED SHAREHOLDER REPORT OF REGISTERED MANAGEMENT
INVESTMENT COMPANIES
Investment Company Act file number File No. 811-04415
COLLEGE RETIREMENT EQUITIES FUND
(Exact Name of Registrant as specified in charter)
730 Third Avenue, New York, New York 10017-3206
(Address of Principal Executive Offices) (Zip code)
Rachael M. Zufall, Esq.
c/o TIAA-CREF
8500 Andrew Carnegie Blvd.
Charlotte, North Carolina 28262-8500
(Name and address of agent for service)
Registrant's telephone number, including area code: 704-595-1000
Date of fiscal year end: December 31
Date of reporting period: December 31, 2013
Item 1. Reports to Stockholders.

2013 Annual Report
College Retirement
Equities Fund
December 31, 2013

Understanding your CREF report
This annual report contains information about the eight CREF accounts and describes the accounts’ results for the twelve months ended December 31, 2013. The report contains three main sections:
| • | The account performance section compares each account’s investment returns with those of its benchmark index. |
| • | The summary portfolios of investments list the industries and types of securities in which each account had investments as of December 31, 2013. |
| • | The financial statements provide detailed information about the operations and financial condition of each account. |
The views and opinions expressed in this report are through the end of the period, as stated on the cover of this report. They are subject to change at any time based on a variety of factors. As such, they are not guarantees of future performance or investment results and should not be taken as investment advice. The risks of investing in the CREF accounts vary from account to account; to see the risks of investing in an individual account, please refer to the latest CREF prospectus.
As always, you should carefully consider the investment objectives, risks, charges and expenses of any account before investing. For a prospectus that contains this and other important information, please visit our website at tiaa-cref.org, or call 877 518-9161. We urge you to read the prospectus carefully before investing.
| 2 | 2013 Annual Report ■ College Retirement Equities Fund |
Information for CREF participants
Portfolio holdings
Securities and Exchange Commission (SEC) rules allow investment companies to list the top holdings of each account in their annual and semiannual reports, instead of providing complete portfolio listings. CREF also files complete portfolio listings with the SEC, and they are available to the public.
You can obtain a complete list of CREF’s portfolio holdings (Schedules of Investments) as of the most recently completed fiscal quarter in the following ways:
| • | By visiting our website at tiaa-cref.org; or |
| • | By calling us at 800 842-2252 to request a copy, which will be provided free of charge. |
You can also obtain a complete list of CREF’s portfolio holdings as of the most recently completed fiscal quarter, and for prior quarter-ends, from our SEC Form N-CSR and Form N-Q filings. Form N-CSR filings are as of December 31 or June 30; Form N-Q filings are as of March 31 or September 30. Copies of these forms are available:
| • | Through the Electronic Data Gathering and Retrieval System (EDGAR) on the SEC’s website at www.sec.gov; or |
| • | From the SEC’s Office of Investor Education and Advocacy. (Call 202 551-8090 for more information.) |
Proxy voting
CREF’s ownership of stock gives it the right to vote on proxy issues of companies in which it invests. A description of our proxy voting policies and procedures can be found on our website at tiaa-cref.org or on the SEC’s website at www.sec.gov. You can also call us at 800 842-2252 to request a free copy. A report of how the accounts voted during the most recently completed twelve-month period ended June 30 can be found on our website or on Form N-PX at www.sec.gov.
Contacting TIAA-CREF
There are three easy ways to contact us: by email, using the Contact Us link at the top of our home page; by mail at TIAA-CREF, 730 Third Avenue, New York, NY 10017–3206; or by phone at 800 842-2252.
Account management
The CREF accounts are managed by the portfolio management teams of TIAA-CREF Investment Management, LLC. The members of these teams are responsible for the day-to-day investment management of the accounts.
| College Retirement Equities Fund ■ 2013 Annual Report | 3 |
About the accounts’ benchmarks
CREF Stock Account
The account’s composite benchmark is a weighted average of two indexes: the Russell 3000® Index, which measures the performance of the broad U.S. stock market, and the MSCI All Country World ex USA Investable Market Index, which measures the performance of large-, mid- and small-cap stocks in 43 developed and emerging market nations throughout the world, excluding the United States.
CREF Global Equities Account
The account’s benchmark is the MSCI World Index, an aggregate of 23 country indexes in developed market nations, including the United States.
CREF Growth Account
The account’s benchmark is the Russell 1000® Growth Index, a subset of the Russell 1000 Index, which measures the performance of the stocks of the 1,000 largest companies in the Russell 3000 Index, based on market capitalization. The Russell 1000 Growth Index measures the performance of those stocks of the Russell 1000 Index with higher relative forecasted growth rates and price/book ratios.
CREF Equity Index Account
The account’s benchmark is the Russell 3000 Index, which measures the performance of the stocks of the 3,000 largest publicly traded U.S. companies, based on market capitalization. The index measures the performance of about 98% of the total market capitalization of the publicly traded U.S. equity market.
CREF Bond Market Account
The account’s benchmark is the Barclays U.S. Aggregate Bond Index, which measures the performance of the domestic investment-grade, fixed-rate bond market, including government and corporate securities, agency mortgage pass-through securities, asset-backed securities and commercial mortgage-backed securities.
CREF Inflation-Linked Bond Account
The account’s benchmark is the Barclays U.S. Treasury Inflation Protected Securities (TIPS) Index (Series-L), which measures the performance of fixed-income securities with fixed-rate coupon payments that are adjusted for inflation, as measured by the Consumer Price Index for All Urban Consumers (CPI-U).
| 4 | 2013 Annual Report ■ College Retirement Equities Fund |
About the accounts’ benchmarks
CREF Social Choice Account
The account’s composite benchmark is a weighted average of three indexes: the Russell 3000 Index, which measures the performance of the broad U.S. stock market; the Barclays U.S. Aggregate Bond Index, which measures the performance of the domestic investment-grade, fixed-rate bond market; and the MSCI EAFE+Canada Index, which measures stock performance in 22 developed market nations, excluding the United States.
You cannot invest directly in any index. Index returns do not include a deduction for fees or expenses.
Russell 1000 and Russell 3000 are trademarks and service marks of Russell Investments. TIAA-CREF products are not promoted or sponsored by, or affiliated with, Russell Investments. MSCI makes no express or implied warranties or representations and shall have no liability whatsoever with respect to any MSCI data contained herein. This report is not approved, reviewed or produced by MSCI. EAFE stands for Europe, Australasia, Far East.
| College Retirement Equities Fund ■ 2013 Annual Report | 5 |
Important information about expenses
All participants in the CREF accounts incur ongoing costs, including management fees and other account expenses.
The expense examples that appear on the performance pages are intended to help you understand your ongoing costs (in U.S. dollars) and do not reflect transactional costs incurred by the account for buying and selling securities. The examples are designed to help you compare these ongoing costs with the ongoing costs of investing in other variable annuity accounts and mutual funds. Participants in the CREF accounts do not incur a sales charge for purchases or other distributions.
The examples are based on an investment of $1,000 invested at the beginning of the six-month period and held for the entire period (July 1, 2013–December 31, 2013).
Actual expenses
The first line in each table uses the account’s actual expenses and its actual rate of return. You may use the information in this line, together with the amount you invested, to estimate the expenses that you paid over the six-month period.
Simply divide your account value by $1,000 (for example, an $8,600 account value divided by $1,000 = 8.6), then multiply the result by the number in the first line under the heading “Expenses paid during period” to estimate the expenses you paid during the six-month period.
Hypothetical example for comparison purposes
The second line in the table shows hypothetical account values and expenses based on the account’s actual expense ratio for the six-month period and an assumed 5% per year rate of return before expenses. This was not the account’s actual return.
This hypothetical example cannot be used to estimate the actual expenses you paid for the period but rather allows you to compare the ongoing costs of investing in the account with the costs of other accounts. To do so, compare this 5% hypothetical example with the 5% hypothetical examples that appear in the shareholder reports of other variable annuity accounts and mutual funds.
| 6 | 2013 Annual Report ■ College Retirement Equities Fund |
CREF Stock Account
Performance for the twelve months ended December 31, 2013
The CREF Stock Account returned 27.83% for the year, compared with the 28.07% return of its composite benchmark, a weighted average of the Russell 3000® Index and the MSCI All Country World ex USA Investable Market Index.
Global stocks produced outsized gains in 2013, as the Federal Reserve’s ongoing monetary stimulus, the strengthening U.S. economy and Europe’s emergence from recession increased investor appetite for riskier assets.
U.S. stocks, which comprised about two-thirds of the account’s portfolio at period-end, soared 33.55%, as measured by the Russell 3000. Stellar gains in consumer discretionary and financial stocks drove the benchmark higher.
The MSCI All Country World ex USA Investable Market Index, which measures stock performance in 43 developed and emerging market nations, returned 15.82% in U.S. dollars. Double-digit advances in British, French, German and Japanese shares were tempered by weak returns from emerging market countries, such as China (up 5.3%) and Brazil (down 16.8%).
A rising dollar versus the Japanese yen reduced foreign stock returns for U.S. investors. The MSCI index gained 20.76% in terms of local currencies.
The account generates a strong return for the year
During the year, the account participated in the strong equity market rally, generating an impressive absolute gain. The account trailed its composite benchmark by a small margin in part because it was negatively affected by fair value pricing adjustments. Among individual stock choices, underweight investments in Facebook and Korea Gas Corporation also detracted slightly from relative performance.
The account’s return, however, was enhanced by numerous favorable stock selections. The largest individual contributors were overweight positions in electronics retailer Best Buy and in two biotechnology firms—Gilead Sciences and Biogen Idec. Underweights in Brazilian beverage producer Ambev and in Thai discount store chain operator Siam Makro helped as well.
The account’s returns may sometimes diverge from the returns of its benchmark index more than would be expected. This divergence may be the result of the account’s fair value pricing adjustments or of the timing of foreign currency valuations. Many foreign exchanges close for trading before the account’s accumulation unit value (AUV) is calculated (generally 4 p.m. ET). In the intervening hours, the values of foreign securities can change, and these changes are not reflected immediately in the returns of the account’s benchmark. These changes are, however, taken into account to value the account’s portfolio holdings at the time the account’s AUV is calculated; these are known as fair value pricing adjustments.
| College Retirement Equities Fund ■ 2013 Annual Report | 7 |
CREF Stock Account
Performance as of December 31, 2013
| | | | | Total
return | | Average annual
total return | |
| | | Inception date | | 1 year | | | 5 years | | | 10 years | |
| CREF Stock Account | | 7/31/1952 | | 27.83 | % | | 16.84 | % | | | 7.28 | % |
| CREF Stock Composite Benchmark* | | — | | 28.07 | | | 16.89 | | | | 7.47 | |
| Broad market index | | | | | | | | | | | | |
| Russell 3000® Index | | — | | 33.55 | | | 18.71 | | | | 7.88 | |
The returns in this report show past performance, which is no guarantee of future results. Returns and the principal value of your investment will fluctuate. Current performance may be higher or lower than that shown, and you may have a gain or a loss when you redeem your accumulation units. For current performance information, including performance to the most recent month-end, please visit tiaa-cref.org.
You cannot invest directly in any index. Index returns do not include a deduction for fees or expenses.
| * | On December 31, 2013, the CREF Stock Composite Benchmark consisted of: 70.0% Russell 3000 Index and 30.0% MSCI All Country World ex USA Investable Market Index. The account’s benchmark, the components that make up the composite benchmark and the method of calculating the composite benchmark’s performance may vary over time. |
$10,000 over 10 years

For the purpose of comparison, the graph also shows the change in the value of the account’s composite benchmark and of a broad market index during the same period.
| 8 | 2013 Annual Report ■ College Retirement Equities Fund |
CREF Stock Account
Expense example
Six months ended December 31, 2013
| | | Beginning
account value | | | Ending
account value | | | Expenses paid
during period | † |
| CREF Stock Account | | (7/1/13 | ) | | (12/31/13 | ) | | (7/1/13–12/31/13 | ) |
| Actual return | | | $1,000.00 | | | | $1,170.33 | | | | $2.63 | |
| 5% annual hypothetical return | | | 1,000.00 | | | | 1,022.79 | | | | 2.45 | |
| † | “Expenses paid during period” is based on the account’s actual expense ratio for the most recent fiscal half-year, multiplied by the average account value over the six-month period, multiplied by 184/365. There were 184 days in the six months ended December 31, 2013. The account’s annualized six-month expense ratio for that period was 0.48%. |
For more information about this expense example, please see page 6.
Actual expenses
| Net expense ratio for the one-year period ended 12/31/2013 | | 0.48 | % |
Portfolio composition
| Sector | | % of net assets
as of 12/31/2013 | |
| Financials | | | 19.3 | |
| Information technology | | | 15.1 | |
| Consumer discretionary | | | 14.6 | |
| Industrials | | | 12.0 | |
| Health care | | | 11.5 | |
| Energy | | | 8.6 | |
| Consumer staples | | | 7.8 | |
| Materials | | | 5.3 | |
| Utilities | | | 2.7 | |
| Telecommunication services | | | 2.6 | |
| Short-term investments, other assets & liabilities, net | | | 0.5 | |
| Total | | | 100.0 | |
Holdings by company size
| Market capitalization | | % of equity investments
as of 12/31/2013 | |
| More than $50 billion | | | 41.6 | |
| More than $15 billion–$50 billion | | | 24.7 | |
| More than $2 billion–$15 billion | | | 26.8 | |
| $2 billion or less | | | 6.9 | |
| Total | | | 100.0 | |
Holdings by country
| | | % of portfolio investments
as of 12/31/2013 | |
| United States | | | 66.3 | |
| United Kingdom | | | 4.5 | |
| Japan | | | 4.4 | |
| France | | | 2.4 | |
| Canada | | | 2.2 | |
| Germany | | | 2.0 | |
| Switzerland | | | 1.8 | |
| China | | | 1.2 | |
| 55 other nations | | | 11.1 | |
| Short-term investments | | | 4.1 | |
| Total | | | 100.0 | |
| College Retirement Equities Fund ■ 2013 Annual Report | 9 |
CREF Global Equities Account
Performance for the twelve months ended December 31, 2013
The CREF Global Equities Account returned 27.27% for the year, compared with the 26.68% return of its benchmark, the MSCI World Index.
Global stocks produced outsized gains in 2013, as the strengthening U.S. economy, Europe’s emergence from recession and ongoing monetary stimulus by the Federal Reserve and other major central banks increased investor appetite for riskier assets.
U.S. stocks, which comprised more than half of the benchmark’s total market capitalization at period-end, soared 31.8% and were by far the main driver of index performance. Japanese stocks advanced 27.2%, as investors applauded that country’s efforts to jump-start its flagging economy. Solid gains in German (up 31.4%), French (up 26.3%) and British (up 20.7%) shares also contributed to the benchmark’s rise. In contrast, Canadian and Australian stocks—up just 5.6% and 4.2%, respectively—were constrained by slumping commodities prices.
In terms of local currencies, the World index gained 28.87%. Although the dollar fell relative to the euro and pound, its astronomical rise against the yen halved the value of Japanese shares in dollars, thereby reducing the index’s overall return for U.S. investors.
The account tops its benchmark on superior stock choices
Amid the powerful stock market rally, the account outpaced its benchmark because of advantageous stock selections. The largest contributor was an overweight position in British online fashion retailer Asos. Overweights in biotechnology firm Gilead Sciences, Dutch coffee and tea producer D.E Master Blenders 1753 and European Aeronautic Defence and Space, reorganized as Airbus Group, also boosted the account’s relative performance.
Partly detracting from results were overweight holdings in two mining giants: Chile’s Antofagasta and Britain’s Rio Tinto. An underweight position in Facebook and an overweight in alcoholic-beverage maker Rémy Cointreau also reduced returns slightly.
The account’s returns may sometimes diverge from the returns of its benchmark index more than would be expected. This divergence may be the result of the account’s fair value pricing adjustments or of the timing of foreign currency valuations. Many foreign exchanges close for trading before the account’s accumulation unit value (AUV) is calculated (generally 4 p.m. ET). In the intervening hours, the values of foreign securities can change, and these changes are not reflected immediately in the returns of the account’s benchmark. These changes are, however, taken into account to value the account’s portfolio holdings at the time the account’s AUV is calculated; these are known as fair value pricing adjustments.
| 10 | 2013 Annual Report ■ College Retirement Equities Fund |
CREF Global Equities Account
Performance as of December 31, 2013
| | | | | Total
return | | Average annual
total return |
| | | Inception date | | 1 year | | | 5 years | | | 10 years | |
| CREF Global Equities Account | | 5/1/1992 | | 27.27 | % | | 15.72 | % | | | 6.92 | % |
| MSCI World Index | | — | | 26.68 | | | 15.02 | | | | 6.98 | |
The returns in this report show past performance, which is no guarantee of future results. Returns and the principal value of your investment will fluctuate. Current performance may be higher or lower than that shown, and you may have a gain or a loss when you redeem your accumulation units. For current performance information, including performance to the most recent month-end, please visit tiaa-cref.org.
You cannot invest directly in any index. Index returns do not include a deduction for fees or expenses.
$10,000 over 10 years
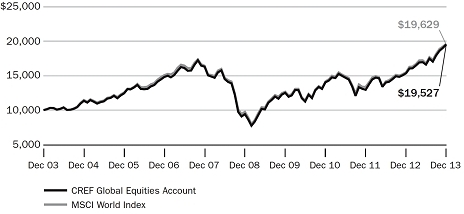
For the purpose of comparison, the graph also shows the change in the value of the account’s benchmark during the same period.
| College Retirement Equities Fund ■ 2013 Annual Report | 11 |
CREF Global Equities Account
Expense example
Six months ended December 31, 2013
| | | Beginning
account value | | | Ending
account value | | | Expenses paid
during period | * |
| CREF Global Equities Account | | (7/1/13 | ) | | (12/31/13 | ) | | (7/1/13–12/31/13 | ) |
| Actual return | | | $1,000.00 | | | | $1,175.48 | | | | $2.80 | |
| 5% annual hypothetical return | | | 1,000.00 | | | | 1,022.63 | | | | 2.60 | |
| * | “Expenses paid during period” is based on the account’s actual expense ratio for the most recent fiscal half-year, multiplied by the average account value over the six-month period, multiplied by 184/365. There were 184 days in the six months ended December 31, 2013. The account’s annualized six-month expense ratio for that period was 0.51%. |
For more information about this expense example, please see page 6.
| Actual expenses | | |
| Net expense ratio for the one-year period ended 12/31/2013 | | 0.52% |
| Portfolio composition | | | | |
| Sector | | | % of net assets
as of 12/31/2013 | |
| Financials | | | 20.4 | |
| Consumer discretionary | | | 16.3 | |
| Information technology | | | 13.1 | |
| Industrials | | | 13.0 | |
| Health care | | | 12.0 | |
| Consumer staples | | | 7.3 | |
| Energy | | | 7.3 | |
| Materials | | | 4.7 | |
| Telecommunication services | | | 2.5 | |
| Utilities | | | 2.1 | |
| Short-term investments, other assets & liabilities, net | | | 1.3 | |
| Total | | | 100.0 | |
| Holdings by company size | | | | |
| Market capitalization | | | % of equity investments
as of 12/31/2013 | |
| More than $50 billion | | | 45.5 | |
| More than $15 billion–$50 billion | | | 27.3 | |
| More than $2 billion–$15 billion | | | 25.1 | |
| $2 billion or less | | | 2.1 | |
| Total | | | 100.0 | |
| Holdings by country | | | | |
% of portfolio investments
as of 12/31/2013 | |
| United States | | | 51.9 | |
| Japan | | | 8.0 | |
| United Kingdom | | | 7.7 | |
| Germany | | | 4.1 | |
| France | | | 4.1 | |
| Switzerland | | | 4.0 | |
| Canada | | | 3.4 | |
| Australia | | | 2.0 | |
| 38 other nations | | | 11.5 | |
| Short-term investments | | | 3.3 | |
| Total | | | 100.0 | |
| 12 | 2013 Annual Report ■ College Retirement Equities Fund |
CREF Growth Account
Performance for the twelve months ended December 31, 2013
The CREF Growth Account returned 35.00% for the year, compared with the 33.48% return of its benchmark, the Russell 1000® Growth Index.
The broad U.S. stock market, as measured by the Russell 3000® Index, soared 33.55% in 2013. Investors were emboldened by the strengthening domestic economy: unemployment fell, housing prices climbed and consumer spending rose. At the same time, the Federal Reserve’s efforts to stimulate the economy by keeping interest rates low further increased investor appetite for riskier assets.
Large-cap growth stocks participated in the strong rally but fell just short of the robust gains registered by the broad U.S. equity market. Within the growth category, large-cap issues trailed their small- and mid-cap counterparts, which advanced 43.30% and 35.74%, respectively. (Returns by investment style and capitalization size are based on the Russell indexes.)
For the ten years ended December 31, 2013, the Russell 1000 Growth Index registered an average annual gain of 7.83%, slightly trailing the 7.88% average return of the Russell 3000 Index over the same period.
Strong stock choices boost the account’s relative performance
For the year, all ten industry sectors of the account’s benchmark achieved double-digit gains, including five that climbed more than 30%. The benchmark’s second-largest sector, consumer discretionary, advanced 44.5% and made the biggest contribution to the benchmark’s rise. An improving U.S. economy, coupled with strengthening consumer confidence, lifted investor sentiment for consumer discretionary issues. Substantial contributions from health care (up 48.2%), industrials (up 41.2%) and information technology (up 26.2%) further enhanced the benchmark’s gain. Together, these four sectors made up more than 70% of the index’s total market capitalization on December 31, 2013.
The account generated a double-digit gain and surpassed its benchmark by more than one-and-a-half percentage points on the strength of numerous successful stock selections. Among the largest positive contributions were overweight positions in three surging biotechnology companies: Celgene (up 115.3%), Gilead Sciences (up 104.5%) and Biogen Idec (up 91.0%). The account also benefited from underweight holdings in IBM, Philip Morris International and Coca-Cola, all of which substantially lagged for the period.
In contrast, underweight investments in online travel service provider Priceline.com, pharmaceutical company Bristol-Myers Squibb and biotechnology firm Amgen detracted from relative performance. The account was also hurt by an out-of-benchmark position in Japan’s Suntory Beverage & Food and by an overweight in Internet-based travel company Expedia.
| College Retirement Equities Fund ■ 2013 Annual Report | 13 |
CREF Growth Account
Performance as of December 31, 2013
| | | | | Total
return | | Average annual
total return |
| | | Inception date | | 1 year | | | 5 years | | | 10 years | |
| CREF Growth Account | | 4/29/1994 | | 35.00 | % | | 19.97 | % | | | 7.52 | % |
| Russell 1000® Growth Index | | — | | 33.48 | | | 20.39 | | | | 7.83 | |
The returns in this report show past performance, which is no guarantee of future results. Returns and the principal value of your investment will fluctuate. Current performance may be higher or lower than that shown, and you may have a gain or a loss when you redeem your accumulation units. For current performance information, including performance to the most recent month-end, please visit tiaa-cref.org.
You cannot invest directly in any index. Index returns do not include a deduction for fees or expenses.
$10,000 over 10 years
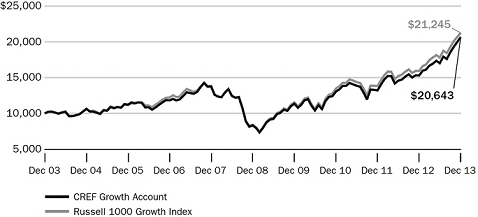
For the purpose of comparison, the graph also shows the change in the value of the account’s benchmark during the same period.
| 14 | 2013 Annual Report ■ College Retirement Equities Fund |
CREF Growth Account
Expense example
Six months ended December 31, 2013
| | | Beginning | | | Ending | | | Expenses paid | |
| | | account value | | | account value | | | during period | * |
| CREF Growth Account | | (7/1/13 | ) | | (12/31/13 | ) | | (7/1/13–12/31/13 | ) |
| Actual return | | | $1,000.00 | | | | $1,214.39 | | | | $2.57 | |
| 5% annual hypothetical return | | | 1,000.00 | | | | 1,022.89 | | | | 2.35 | |
| * | “Expenses paid during period” is based on the account’s actual expense ratio for the most recent fiscal half-year, multiplied by the average account value over the six-month period, multiplied by 184/365. There were 184 days in the six months ended December 31, 2013. The account’s annualized six-month expense ratio for that period was 0.46%. |
For more information about this expense example, please see page 6.
Actual expenses
| Net expense ratio for the one-year period ended 12/31/2013 | | | 0.46% |
Portfolio composition
| | | % of net assets | |
| Sector | | as of 12/31/2013 | |
| Information technology | | | 27.6 | |
| Consumer discretionary | | | 21.4 | |
| Health care | | | 14.6 | |
| Industrials | | | 12.2 | |
| Consumer staples | | | 7.3 | |
| Financials | | | 7.1 | |
| Materials | | | 4.3 | |
| Energy | | | 3.1 | |
| Telecommunication services | | | 1.3 | |
| Utilities | | | 0.1 | |
| Short-term investments, other assets & liabilities, net | | | 1.0 | |
| Total | | | 100.0 | |
Holdings by company size
| Market capitalization | | % of equity investments
as of 12/31/2013 | |
| More than $50 billion | | | 49.0 | |
| More than $15 billion–$50 billion | | | 25.7 | |
| More than $2 billion–$15 billion | | | 24.9 | |
| $2 billion or less | | | 0.4 | |
| Total | | | 100.0 | |
| College Retirement Equities Fund ■ 2013 Annual Report | 15 |
CREF Equity Index Account
Performance for the twelve months ended December 31, 2013
The CREF Equity Index Account returned 32.99% for the year, compared with the 33.55% return of its benchmark, the Russell 3000® Index.
For the twelve-month period, the account’s return trailed that of its benchmark index, primarily because of the effect of expenses. The account’s return includes a deduction for expenses, while the benchmark’s does not. The account benefited from participating in a securities lending program and had a risk profile similar to that of its benchmark.
The broad U.S. stock market, as measured by the Russell 3000 Index, soared 33.55% in 2013. Investors were emboldened by the strengthening domestic economy: unemployment fell, housing prices climbed and consumer spending rose. At the same time, the Federal Reserve’s efforts to stimulate the economy by keeping interest rates low further increased investor appetite for riskier assets.
Amid signs of an improving economy, optimistic investors favored small-capitalization stocks because of their higher return potential. Small caps gained 38.82% during the period, outpacing mid- and large-cap equities, which rose 34.76% and 33.11%, respectively. Growth issues within the Russell 3000 topped their value counterparts, 34.23% to 32.69%. (Returns by market capitalization and investment style are based on the Russell indexes.)
Financial and consumer discretionary stocks propel the benchmark higher
For the year, all ten industry sectors of the Russell 3000 Index scored double-digit gains, including seven that climbed more than 25%. The benchmark’s second- and third-largest sectors, financials and consumer discretionary, advanced 32.8% and 44.5%, respectively, and made the biggest contributions to the benchmark’s rise. The 30.9% gain of information technology stocks, the index’s largest sector, also made a substantial contribution, as did outsized results from health care (up 42.8%) and industrial (up 42.2%) issues. Together, these five sectors constituted more than 70% of the benchmark’s total market capitalization on December 31, 2013.
During the period, all of the five largest stocks in the index registered gains, and three surpassed the return of the broad U.S. stock market. Google was the best performer; its stock climbed 58.4% as the company expanded its core advertising business within the mobile device market. Microsoft and General Electric followed with gains of 44.3% and 37.9%, respectively. Exxon Mobil (up 20.1%) also posted a strong advance but failed to keep pace in a surging market environment. Apple, the index’s largest individual component in terms of market capitalization at period-end, substantially lagged; it returned 8.1%.
| 16 | 2013 Annual Report ■ College Retirement Equities Fund |
CREF Equity Index Account
Performance as of December 31, 2013
| | | | | Total | | Average annual |
| | | | | return | | total return |
| | | Inception date | | 1 year | | | 5 years | | | 10 years | |
| CREF Equity Index Account | | 4/29/1994 | | 32.99 | % | | 18.25 | % | | | 7.47 | % |
| Russell 3000 Index | | — | | 33.55 | | | 18.71 | | | | 7.88 | |
The returns in this report show past performance, which is no guarantee of future results. Returns and the principal value of your investment will fluctuate. Current performance may be higher or lower than that shown, and you may have a gain or a loss when you redeem your accumulation units. For current performance information, including performance to the most recent month-end, please visit tiaa-cref.org.
You cannot invest directly in any index. Index returns do not include a deduction for fees or expenses.
$10,000 over 10 years
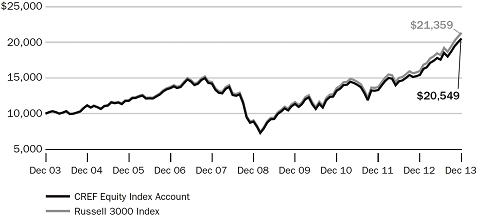
For the purpose of comparison, the graph also shows the change in the value of the account’s benchmark during the same period.
| College Retirement Equities Fund ■ 2013 Annual Report | 17 |
CREF Equity Index Account
Expense example
Six months ended December 31, 2013
| | | Beginning | | | Ending | | | Expenses paid | |
| | | account value | | | account value | | | during period | * |
| CREF Equity Index Account | | (7/1/13 | ) | | (12/31/13 | ) | | (7/1/13–12/31/13 | ) |
| Actual return | | | $1,000.00 | | | | $1,168.31 | | | | $2.30 | |
| 5% annual hypothetical return | | | 1,000.00 | | | | 1,023.09 | | | | 2.14 | |
| * | “Expenses paid during period” is based on the account’s actual expense ratio for the most recent fiscal half-year, multiplied by the average account value over the six-month period, multiplied by 184/365. There were 184 days in the six months ended December 31, 2013. The account’s annualized six-month expense ratio for that period was 0.42%. |
For more information about this expense example, please see page 6.
Actual expenses
| Net expense ratio for the one-year period ended 12/31/2013 | | | 0.42% |
Portfolio composition
| | | % of net assets | |
| Sector | | as of 12/31/2013 | |
| Information technology | | | 18.0 | |
| Financials | | | 17.5 | |
| Consumer discretionary | | | 13.4 | |
| Health care | | | 12.5 | |
| Industrials | | | 11.7 | |
| Energy | | | 9.2 | |
| Consumer staples | | | 8.5 | |
| Materials | | | 3.8 | |
| Utilities | | | 2.9 | |
| Telecommunication services | | | 2.1 | |
| Short-term investments, other assets & liabilities, net | | | 0.4 | |
| Total | | | 100.0 | |
Holdings by company size
| | | % of equity investments | |
| Market capitalization | | as of 12/31/2013 | |
| More than $50 billion | | | 48.3 | |
| More than $15 billion–$50 billion | | | 24.1 | |
| More than $2 billion–$15 billion | | | 22.3 | |
| $2 billion or less | | | 5.3 | |
| Total | | | 100.0 | |
| 18 | 2013 Annual Report ■ College Retirement Equities Fund |
CREF Bond Market Account
Performance for the twelve months ended December 31, 2013
The CREF Bond Market Account returned –2.01% for the year, compared with the –2.02% return of its benchmark, the Barclays U.S. Aggregate Bond Index.
The nation’s gross domestic product grew at an estimated annual rate of 4.1% in the third quarter of 2013, versus 2.5% in the second quarter and 1.1% in the first. Unemployment ended the year at 6.7%, down from 7.9% twelve months earlier. As the U.S. economy showed increasing signs of improvement, many investors left the relative safety of high-quality bonds to seek higher returns in riskier assets, such as stocks and below-investment-grade corporate securities.
At the same time, the Federal Reserve kept investors guessing about when it might begin reducing its massive bond buying program, designed to stimulate economic growth by restraining long-term interest rates. Investment-grade, fixed-rate bonds, as measured by the Barclays U.S. Aggregate Bond Index, fell sharply in May and June, in response to the Fed’s “taper talk.” They rallied in the fall, however, following the Fed’s surprise announcement that it would maintain its accommodative stance. At year-end, bond prices fell modestly when the Fed decided to reduce its bond purchases by $10 billion—to $75 billion a month.
Treasuries lead the benchmark’s atypical retreat
Although the decline in the Barclays aggregate index was disappointing, it was only the third such calendar-year retreat in the index’s 37-year history.
U.S. Treasury securities, the benchmark’s largest sector, recorded the biggest loss for the year, returning –2.5%, as falling bond prices pushed up their yields. Yields on 10-year Treasuries went from 1.78% as the year opened to 3.04% on December 31, 2013.
U.S. mortgage-backed securities, which constituted almost one-third of the index’s total market capitalization, returned –1.4%. Corporate bonds, which represented about one-fifth of the benchmark, returned –1.5%. Commercial mortgage-backed securities posted a small gain, 0.2%, while asset-backed and U.S. agency securities returned –0.3% and –1.6%, respectively.
In the challenging environment for bonds, the account’s return, though negative, closely matched that of its benchmark. The account benefited most from its significantly underweight position in U.S. Treasuries. Overweight holdings and advantageous security selections among government-related credit securities also aided the account’s relative performance, as did an underweight in mortgage-backed securities.
Limiting the account’s return were overweight positions in corporate securities. Overweight investments and unfavorable choices among municipal bonds further reduced results.
| College Retirement Equities Fund ■ 2013 Annual Report | 19 |
CREF Bond Market Account
Performance as of December 31, 2013
| | | | | Total | | Average annual |
| | | | | return | | total return |
| | | Inception date | | 1 year | | | 5 years | | | 10 years | |
| CREF Bond Market Account | | 3/1/1990 | | –2.01 | % | | 4.73 | % | | | 4.13 | % |
| Barclays U.S. Aggregate Bond Index | | — | | –2.02 | | | 4.44 | | | | 4.55 | |
The returns in this report show past performance, which is no guarantee of future results. Returns and the principal value of your investment will fluctuate. Current performance may be higher or lower than that shown, and you may have a gain or a loss when you redeem your accumulation units. For current performance information, including performance to the most recent month-end, please visit tiaa-cref.org.
You cannot invest directly in any index. Index returns do not include a deduction for fees or expenses.
$10,000 over 10 years

For the purpose of comparison, the graph also shows the change in the value of the account’s benchmark during the same period.
| 20 | 2013 Annual Report ■ College Retirement Equities Fund |
CREF Bond Market Account
Expense example
Six months ended December 31, 2013
| | | Beginning | | | Ending | | | Expenses paid | |
| | | account value | | | account value | | | during period | * |
| CREF Bond Market Account | | (7/1/13 | ) | | (12/31/13 | ) | | (7/1/13–12/31/13 | ) |
| Actual return | | | $1,000.00 | | | | $1,008.57 | | | | $2.28 | |
| 5% annual hypothetical return | | | 1,000.00 | | | | 1,022.94 | | | | 2.29 | |
| * | “Expenses paid during period” is based on the account’s actual expense ratio for the most recent fiscal half-year, multiplied by the average account value over the six-month period, multiplied by 184/365. There were 184 days in the six months ended December 31, 2013. The account’s annualized six-month expense ratio for that period was 0.45%. |
For more information about this expense example, please see page 6.
Actual expenses
| Net expense ratio for the one-year period ended 12/31/2013 | | | 0.45 | % |
Portfolio composition
| | | % of net assets | |
| | | | as of 12/31/2013 | |
| Mortgage-backed securities† | | | 25.1 | |
| Corporate bonds | | | 22.2 | |
| Foreign government & corporate bonds denominated in U.S. dollars | | | 16.2 | |
| U.S. Treasury securities | | | 13.7 | |
| Asset-backed securities | | | 9.4 | |
| Municipal bonds | | | 4.3 | |
| Commercial mortgage-backed securities | | | 3.8 | |
| U.S. agency securities | | | 2.9 | |
| Bank loan obligations | | | 0.2 | |
| Preferred stock | | | 0.1 | |
| Short-term investments, other assets & liabilities, net | | | 2.1 | |
| Total | | | 100.0 | |
| † | Includes mortgage pass-through securities and collateralized mortgage obligations |
Holdings by maturity
| % of fixed-income investments (excluding | |
| short-term investments) as of 12/31/2013 | |
| Less than 1 year | | | 5.3 | |
| 1–3 years | | | 19.5 | |
| 3–5 years | | | 23.7 | |
| 5–10 years | | | 39.7 | |
| Over 10 years | | | 11.8 | |
| Total | | | 100.0 | |
Holdings by credit quality‡
| % of fixed-income investments (excluding | |
| short-term investments) as of 12/31/2013 | |
| Aaa/AAA | | | 52.2 | |
| Aa/AA | | | 11.0 | |
| A/A | | | 13.7 | |
| Baa/BBB | | | 17.4 | |
| Ba/BB | | | 3.4 | |
| B/B | | | 1.2 | |
| Below B/B | | | 0.4 | |
| Non-rated | | | 0.7 | |
| Total | | | 100.0 | |
| ‡ | Credit quality ratings are based on the Barclays methodology, which uses the median rating of those compiled by the Moody’s, Standard & Poor’s and Fitch ratings agencies. If ratings are available from only two of these agencies, the lower rating is used. When only one rating is available, that one is used. These ratings are subject to change without notice. |
| College Retirement Equities Fund ■ 2013 Annual Report | 21 |
CREF Inflation-Linked Bond Account
Performance for the twelve months ended December 31, 2013
The CREF Inflation-Linked Bond Account returned –9.02% for the year, compared with the –8.61% return of its benchmark, the Barclays U.S. Treasury Inflation Protected Securities (TIPS) Index (Series-L).
On December 31, 2013, year-over-year inflation, as measured by the Consumer Price Index, was 1.5%, versus 1.7% one year earlier. The modest rise in inflation reflected the U.S. economy’s moderate rate of growth during the year and, according to the U.S. Department of Labor, was far below the 2.4% average annual increase in prices over the last ten years.
Oil prices, a widely watched indicator of current inflationary pressures, rose 7%, from $92 a barrel at year-end 2012 to $98 twelve months later. In contrast, the increase in food prices was the smallest since 1976, while medical costs rose at the slowest rate since 1949.
During the year, the Federal Reserve was concerned that decelerating prices could impede the nation’s economic recovery. With inflation still well below its target of 2.5%, the Fed continued its massive monthly bond buying program in an effort to stimulate the economy by restraining long-term interest rates.
As the economy slowly improved, investors worried that the Fed might soon taper its accommodative policies. Rising interest rates pushed down the values of many existing bonds, including those of TIPS.
TIPS lag the broad bond market
For the year, the return of TIPS significantly lagged the –2.02% return of the broad domestic investment-grade, fixed-rate bond market, as measured by the Barclays U.S. Aggregate Bond Index. TIPS’ longer maturities made them particularly vulnerable to the negative effects of rising rates. At the same time, with current inflation in check, investors lowered their expectations of future price increases.
However, for the ten years ended December 31, 2013, the average annual return of TIPS was 4.85%, compared with 4.55% for the broad bond market.
The account slightly underperformed its benchmark because of its expense charge. The account’s return includes a deduction for expenses, while the benchmark’s does not. Because the account’s portfolio was similar to that of its benchmark, the above discussion of the benchmark’s performance also applies to the account’s performance.
During the year, the account’s managers kept the account’s duration—a measure of its sensitivity to interest rate changes—close to that of the TIPS index. This strategy helped the account’s risk and reward characteristics more closely resemble those of its benchmark.
| 22 | 2013 Annual Report ■ College Retirement Equities Fund |
CREF Inflation-Linked Bond Account
Performance as of December 31, 2013
| | | | | Total
return | | Average annual
total return |
| | | Inception date | | 1 year | | | 5 years | | | 10 years | |
| CREF Inflation-Linked Bond Account | | 5/1/1997 | | –9.02 | % | | 4.92 | % | | | 4.38 | % |
| Barclays U.S. Treasury Inflation Protected Securities Index (Series-L) | | — | | –8.61 | | | 5.63 | | | | 4.85 | |
The returns in this report show past performance, which is no guarantee of future results. Returns and the principal value of your investment will fluctuate. Current performance may be higher or lower than that shown, and you may have a gain or a loss when you redeem your accumulation units. For current performance information, including performance to the most recent month-end, please visit tiaa-cref.org.
You cannot invest directly in any index. Index returns do not include a deduction for fees or expenses.
$10,000 over 10 years

For the purpose of comparison, the graph also shows the change in the value of the account’s benchmark during the same period.
| College Retirement Equities Fund ■ 2013 Annual Report | 23 |
CREF Inflation-Linked Bond Account
Expense example
Six months ended December 31, 2013
| | | Beginning | | | Ending | | | Expenses paid | |
| CREF Inflation-Linked | | account value | | | account value | | | during period | * |
| Bond Account | | (7/1/13 | ) | | (12/31/13 | ) | | (7/1/13–12/31/13 | ) |
| Actual return | | | $1,000.00 | | | $ | 985.09 | | | | $2.25 | |
| 5% annual hypothetical return | | | 1,000.00 | | | | 1,022.94 | | | | 2.29 | |
| * | “Expenses paid during period” is based on the account’s actual expense ratio for the most recent fiscal half-year, multiplied by the average account value over the six-month period, multiplied by 184/365. There were 184 days in the six months ended December 31, 2013. The account’s annualized six-month expense ratio for that period was 0.45%. |
For more information about this expense example, please see page 6.
| Actual expenses | | | |
| Net expense ratio for the one-year period ended 12/31/2013 | | 0.45 | % |
| Portfolio composition | | | |
| | | | % of net assets | |
| | | | as of 12/31/2013 | |
| U.S. Treasury securities | | | 99.4 | |
| Short-term investments, other assets & liabilities, net | | | 0.6 | |
| Total | | | 100.0 | |
| Holdings by maturity | | | | |
| % of fixed-income investments | |
| (excluding short-term investments) | |
| as of 12/31/2013 | |
| 1–3 years | | | 18.7 | |
| 3–5 years | | | 18.0 | |
| 5–10 years | | | 34.5 | |
| Over 10 years | | | 28.8 | |
| Total | | | 100.0 | |
| 24 | 2013 Annual Report ■ College Retirement Equities Fund |
CREF Social Choice Account
Performance for the twelve months ended December 31, 2013
The CREF Social Choice Account returned 16.67% for the year, compared with the 16.70% return of its composite benchmark, a weighted average of the Russell 3000® Index, the MSCI EAFE+Canada Index and the Barclays U.S. Aggregate Bond Index. The account uses certain environmental, social and governance criteria, while the benchmark does not.
Because of its criteria, the account did not invest in a number of stocks and bonds that were included in the indexes that comprise its composite benchmark. During the period, the account produced a solid absolute return that slightly trailed that of its composite benchmark. The underperformance was due in part to the exclusion of biotechnology firm Celgene and Facebook, both of which registered triple-digit gains. The absence of German drug maker Bayer and two well-performing automobile manufacturers, Daimler and Toyota, reduced the account’s relative return as well.
In contrast, relative performance was enhanced by the exclusion of Apple, whose shares rose just 8.1% for the year on concerns about increased competition and slowing growth rates. Avoiding Australian mining company BHP Billiton and three energy giants, Exxon Mobil, Chevron and Royal Dutch Shell, also enhanced the account’s results.
The account keeps pace with its composite benchmark
To compensate for the account’s exclusion of some stocks, its managers use quantitative (mathematical) modeling and other techniques in an attempt to match the overall risk characteristics of the portfolio with those of its composite benchmark. The account’s results were adversely affected by investments that did not perform as anticipated. Chief among these were overweight holdings in Newcrest Mining, Ariad Pharmaceuticals, telecommunications firm CenturyLink and Canadian mining company Teck Resources.
These unfavorable effects were partly offset by several positive contributors, including overweight positions in Germany’s Deutsche Post, Prudential and two surging biotechnology firms: Gilead Sciences and Biogen Idec.
In a challenging environment for most sectors of the domestic investment-grade, fixed-rate bond market, the account’s fixed-income component outpaced the Barclays aggregate index. The largest positive contribution came from a significant underweight position in U.S. Treasury securities, which lagged the broad bond market for the year. The account also benefited from advantageous selections among government-related credit securities. These positive effects were partly offset by overweight investments in corporate securities and unfavorable selections among municipal bonds.
| College Retirement Equities Fund ■ 2013 Annual Report | 25 |
CREF Social Choice Account
Performance as of December 31, 2013
| | | | | Total | | Average annual |
| | | | | return | | total return |
| | | Inception date | | 1 year | | | 5 years | | | 10 years | |
| CREF Social Choice Account | | 3/1/1990 | | 16.67 | % | | 12.56 | % | | | 6.21 | % |
| CREF Social Choice | | | | | | | | | | | | |
| Composite Benchmark* | | — | | 16.70 | | | 12.43 | | | | 6.35 | |
| Broad market index | | | | | | | | | | | | |
| Russell 3000® Index | | — | | 33.55 | | | 18.71 | | | | 7.88 | |
The returns in this report show past performance, which is no guarantee of future results. Returns and the principal value of your investment will fluctuate. Current performance may be higher or lower than that shown, and you may have a gain or a loss when you redeem your accumulation units. For current performance information, including performance to the most recent month-end, please visit tiaa-cref.org.
You cannot invest directly in any index. Index returns do not include a deduction for fees or expenses.
| * | On December 31, 2013, the CREF Social Choice Composite Benchmark consisted of: 47.0% Russell 3000 Index; 40.0% Barclays U.S. Aggregate Bond Index; and 13.0% MSCI EAFE+Canada Index. The account’s benchmark, the components that make up the composite benchmark and the method of calculating the composite benchmark’s performance may vary over time. |
$10,000 over 10 years
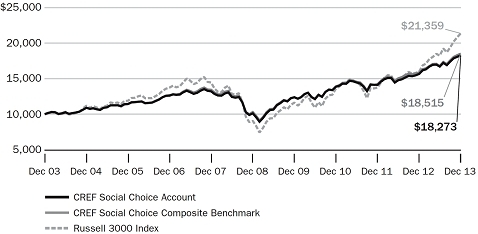
For the purpose of comparison, the graph also shows the change in the value of the account’s composite benchmark and of a broad market index during the same period.
| 26 | 2013 Annual Report ■ College Retirement Equities Fund |
CREF Social Choice Account
Expense example
Six months ended December 31, 2013
| | | Beginning | | | Ending | | | Expenses paid | |
| | | account value | | | account value | | | during period | † |
| CREF Social Choice Account | | (7/1/13 | ) | | (12/31/13 | ) | | (7/1/13–12/31/13 | ) |
| Actual return | | | $1,000.00 | | | | $1,094.56 | | | | $2.38 | |
| 5% annual hypothetical return | | | 1,000.00 | | | | 1,022.94 | | | | 2.29 | |
| † | “Expenses paid during period” is based on the account’s actual expense ratio for the most recent fiscal half-year, multiplied by the average account value over the six-month period, multiplied by 184/365. There were 184 days in the six months ended December 31, 2013. The account’s annualized six-month expense ratio for that period was 0.45%. |
For more information about this expense example, please see page 6.
Actual expenses
| Net expense ratio for the one-year period ended 12/31/2013 | | 0.45% |
Portfolio composition
| | | % of net assets | |
| | | as of 12/31/2013 | |
| Equities | | | 60.6 | |
| Long-term bonds | | | 37.7 | |
| Short-term investments, other assets & liabilities, net | | | 1.7 | |
| Total | | | 100.0 | |
Holdings by company size
| | | % of equity investments | |
| Market capitalization | | as of 12/31/2013 | |
| More than $50 billion | | | 34.0 | |
| More than $15 billion–$50 billion | | | 44.1 | |
| More than $2 billion–$15 billion | | | 20.0 | |
| $2 billion or less | | | 1.9 | |
| Total | | | 100.0 | |
Holdings by maturity
| | | % of fixed-income investments | |
| | | (excluding short-term investments)
as of 12/31/2013 | |
| Less than 1 year | | | 5.3 | |
| 1–3 years | | | 19.3 | |
| 3–5 years | | | 24.0 | |
| 5–10 years | | | 36.2 | |
| Over 10 years | | | 15.2 | |
| Total | | | 100.0 | |
| College Retirement Equities Fund ■ 2013 Annual Report | 27 |
CREF Money Market Account
Performance for the twelve months ended December 31, 2013
The CREF Money Market Account returned 0.00% for the year, compared with the 0.02% return of the iMoneyNet Money Fund Report Averages™—All Taxable, a simple average of over 1,000 taxable money market funds. The iMoneyNet average is not an index, and its return reflects the deduction of expenses charged by the funds included in the average.
In 2013, supplies of money market instruments shrank, boosting prices and lowering yields. Issuance of U.S. Treasury and agency securities was greatly curtailed, as budget cuts, higher tax receipts and large dividend payments by government-sponsored entities Fannie Mae and Freddie Mac reduced the federal government’s borrowing needs. In addition, the Federal Reserve’s large-scale purchases of government securities, intended to stimulate the economy by lowering interest rates, left fewer investment opportunities for other investors.
In the private sector, yields fell on repurchase agreements, which often use Treasuries as collateral. Issuance of commercial paper decreased, as businesses reported sufficient cash. Concerned that already-low yields might turn negative, the Fed introduced a reverse repurchase agreement program, lending its holdings as collateral on an overnight basis to create a floor on very short interest rates.
Declining yields pose challenges for money managers
For the year, the Fed kept its target federal funds rate—the interest rate U.S. commercial banks charge one another for overnight loans—near 0%. Six-month Treasury yields fell from 0.11% at year-end 2012 to 0.10% one year later.
LIBOR yields also declined. (LIBOR is an indicator of the interest rates that banks expect to pay to other banks for loans on the London market.) The three-month rate dropped from 0.31% to 0.25%. Although the inquiry continued into LIBOR’s manipulation by several major banks, it remained the reference rate for a substantial number of money market transactions.
Amid falling yields and diminished supplies, the account sought advantageous investment opportunities while complying with SEC regulations. The account maintained more than half of its portfolio in U.S. Treasury and agency securities. For higher yields, it purchased longer-term U.S. government floating-rate securities and selectively invested in high-quality Pacific Rim banks in addition to Canadian and Australian institutions. On December 31, 2013, the account’s weighted average maturity was 51 days, versus 47 days for the average iMoneyNet fund.
In response to exceptionally low interest rates, part or all of the account’s 12b-1 distribution fees and/or administrative fees were voluntarily withheld by TIAA (waived) to prevent the account’s yield from turning negative.
| 28 | 2013 Annual Report ■ College Retirement Equities Fund |
CREF Money Market Account
Net annualized yield for the 7 days ended December 31, 2013*
| | | Current yield | | | Effective yield | |
| CREF Money Market Account† | | | 0.00 | % | | | 0.00 | % |
| iMoneyNet Money Fund Report Averages™—All Taxable‡ | | | 0.01 | | | | 0.01 | |
The current yield more closely reflects current earnings than does the total return.
| * | Typically, iMoneyNet reports its 7-day yields as of Tuesday of each week. |
Performance as of December 31, 2013
| | | | | Total | | Average annual |
| | | | | return | | total return |
| | | Inception date | | 1 year | | | 5 years | | | 10 years | |
| CREF Money Market Account† | | 4/1/1988 | | 0.00 | % | | 0.02 | % | | | 1.59 | % |
| iMoneyNet Money Fund Report Averages—All Taxable‡ | | — | | 0.02 | | | 0.06 | | | | 1.48 | |
The returns in this report show past performance, which is no guarantee of future results. Returns and the principal value of your investment will fluctuate. Current performance may be higher or lower than that shown, and you may have a gain or a loss when you redeem your accumulation units. For current performance information, including performance to the most recent month-end, please visit tiaa-cref.org.
An investment in the CREF Money Market Account is neither insured nor guaranteed by the Federal Deposit Insurance Corporation (FDIC) or any other government agency. As with any investment, you can lose money by investing in this account.
Note: Unlike most money market funds, the CREF Money Market Account does not distribute income on a daily basis. Therefore, the account does not maintain a constant value of $1.00 per accumulation unit.
| † | Beginning July 16, 2009, part or all of the 12b-1 distribution fees and/or administrative fees for the CREF Money Market Account are being voluntarily withheld by TIAA (“waived”). Without this waiver, the 7-day current and effective annualized yields and total returns would have been lower. This 12b-1 and administrative fee waiver may be discontinued at any time without notice. Amounts waived on or after October 1, 2010, are subject to possible recovery by TIAA under certain conditions. |
| ‡ | The iMoneyNet Money Fund Report Averages—All Taxable category is a simple average of over 1,000 taxable money market funds. You cannot invest in it directly. |
| College Retirement Equities Fund ■ 2013 Annual Report | 29 |
CREF Money Market Account
Expense example
Six months ended December 31, 2013
| | | Beginning | | | Ending | | | Expenses paid | |
| | | account value | | | account value | | | during period | * |
| CREF Money Market Account | | (7/1/13 | ) | | (12/31/13 | ) | | (7/1/13–12/31/13 | ) |
| Actual return | | | $1,000.00 | | | | $1,000.00 | | | | $0.60 | |
| 5% annual hypothetical return | | | 1,000.00 | | | | 1,024.60 | | | | 0.61 | |
| * | “Expenses paid during period” is based on the account’s actual expense ratio for the most recent fiscal half-year, multiplied by the average account value over the six-month period, multiplied by 184/365. There were 184 days in the six months ended December 31, 2013. The account’s annualized six-month expense ratio for that period was 0.12%. The expense charges of the account reflect a voluntary waiver. Without this waiver, the expenses of the account would have been higher and its performance lower. |
For more information about this expense example, please see page 6.
Actual expenses
| Net expense ratio for the one-year period ended 12/31/2013 | | 0.14% |
Portfolio composition
| | | % of net assets | |
| | | as of 12/31/2013 | |
| Commercial paper | | | 35.2 | |
| U.S. government agency securities | | | 32.6 | |
| U.S. Treasury securities | | | 14.9 | |
| Floating rate securities, government | | | 11.3 | |
| Certificates of deposit | | | 6.0 | |
| Total | | | 100.0 | |
| 30 | 2013 Annual Report ■ College Retirement Equities Fund |
Summary portfolio of investments
CREF Stock Account ■ December 31, 2013
| | | | | | | | Value | | | % of net |
| | Principal | | | Issuer | | | (000) | | | assets |
| BONDS | | | | | | | | |
| | | | | | | | | |
| CORPORATE BONDS | | | | | | | | |
| CAPITAL GOODS | | $ | 0 | ^ | | | 0.0 | % |
| FOOD & STAPLES RETAILING | | | 34 | | | | 0.0 | |
| REAL ESTATE | | | 19 | | | | 0.0 | |
| | | | | TOTAL CORPORATE BONDS | (Cost $70) | | | 53 | | | | 0.0 | |
| | | | | | | | | | | | | |
| GOVERNMENT BONDS | | | | | | | | |
| U.S. TREASURY SECURITIES | | | 277 | | | | 0.0 | |
| | | | | TOTAL GOVERNMENT BONDS | (Cost $303) | | | 277 | | | | 0.0 | |
| | | | | TOTAL BONDS | (Cost $373) | | | 330 | | | | 0.0 | |
| | | | | | | | | | | | | |
| EQUITY-LINKED NOTES | | | | | | | | | |
| DIVERSIFIED FINANCIALS | | | 1,850 | | | | 0.0 | |
| | | | | TOTAL EQUITY-LINKED NOTES | (Cost $1,904) | | | 1,850 | | | | 0.0 | |
| | | | | | | | | | | | | |
| | Shares | | | Company | | | | | | | | | | |
| COMMON STOCKS | | | | | | | | |
| AUTOMOBILES & COMPONENTS | | | 2,960,320 | | | | 2.3 | |
| BANKS | | | | | | | | |
| | 26,769,342 | | | Wells Fargo & Co | | | 1,215,328 | | | | 0.9 | |
| | | | | Other | | | 6,294,952 | | | | 5.0 | |
| | | | | | | | 7,510,280 | | | | 5.9 | |
| CAPITAL GOODS | | | | | | | | |
| | 2,901,229 | | | 3M Co | | | 406,898 | | | | 0.3 | |
| | 4,152,384 | | | Boeing Co | | | 566,759 | | | | 0.5 | |
| | 41,884,029 | | | General Electric Co | | | 1,174,009 | | | | 0.9 | |
| | 6,105,717 | | | Honeywell International, Inc | | | 557,879 | | | | 0.4 | |
| | | | | Other | | | 7,764,234 | | | | 6.2 | |
| | | | | | | | 10,469,779 | | | | 8.3 | |
| COMMERCIAL & PROFESSIONAL SERVICES | | | 1,502,984 | | | | 1.3 | |
| CONSUMER DURABLES & APPAREL | | | 2,847,055 | | | | 2.3 | |
| CONSUMER SERVICES | | | 2,862,290 | | | | 2.3 | |
| DIVERSIFIED FINANCIALS | | | | | | | | |
| | 35,786,417 | | | Bank of America Corp | | | 557,194 | | | | 0.4 | |
| | 16,578,197 | | | Citigroup, Inc | | | 863,890 | | | | 0.7 | |
| | 2,745,432 | | | Goldman Sachs Group, Inc | | | 486,655 | | | | 0.4 | |
| | 14,500,269 | | | JPMorgan Chase & Co | | | 847,976 | | | | 0.7 | |
| | | | | Other | | | 4,466,036 | | | | 3.5 | |
| | | | | | | | 7,221,751 | | | | 5.7 | |
| See notes to financial statements | College Retirement Equities Fund ■ 2013 Annual Report | 31 |
| Summary portfolio of investments | continued |
CREF Stock Account ■ December 31, 2013
| | | | | | | | | Value | | | % of net |
| | Shares | | | | Company | | | (000) | | | assets |
| ENERGY | | | | | | | | |
| | 7,851,376 | | | | Chevron Corp | | $ | 980,715 | | | | 0.8 | % |
| | 15,214,568 | | | | Exxon Mobil Corp | | | 1,539,714 | | | | 1.2 | |
| | 5,814,758 | | | | Schlumberger Ltd | | | 523,968 | | | | 0.4 | |
| | | | | | Other | | | 7,857,727 | | | | 6.2 | |
| | | | | | | | | 10,902,124 | | | | 8.6 | |
| FOOD & STAPLES RETAILING | | | 2,008,877 | | | | 1.6 | |
| FOOD, BEVERAGE & TOBACCO | | | | | | | | |
| | 11,448,855 | | | | Altria Group, Inc | | | 439,522 | | | | 0.4 | |
| | 12,443,259 | | | | Coca-Cola Co | | | 514,031 | | | | 0.4 | |
| | 7,408,632 | | | | PepsiCo, Inc | | | 614,472 | | | | 0.5 | |
| | 6,142,880 | | | | Philip Morris International, Inc | | | 535,229 | | | | 0.4 | |
| | | | | | Other | | | 3,698,916 | | | | 2.9 | |
| | | | | | | | | 5,802,170 | | | | 4.6 | |
| HEALTH CARE EQUIPMENT & SERVICES | | | 4,142,256 | | | | 3.3 | |
| HOUSEHOLD & PERSONAL PRODUCTS | | | | | | | | |
| | 9,131,591 | | | | Procter & Gamble Co | | | 743,403 | | | | 0.6 | |
| | | | | | Other | | | 1,273,603 | | | | 1.0 | |
| | | | | | | | | 2,017,006 | | | | 1.6 | |
| INSURANCE | | | | | | | | |
| | 3,757,867 | | | | ACE Ltd | | | 389,052 | | | | 0.3 | |
| | 5,605,383 | | * | | Berkshire Hathaway, Inc (Class B) | | | 664,574 | | | | 0.5 | |
| | | | | | Other | | | 4,411,325 | | | | 3.5 | |
| | | | | | | | | 5,464,951 | | | | 4.3 | |
| MATERIALS | | | 6,729,710 | | | | 5.3 | |
| MEDIA | | | | | | | | |
| | 16,964,980 | | | | Comcast Corp (Class A) | | | 881,585 | | | | 0.7 | |
| | 7,018,477 | | *,e | | Walt Disney Co | | | 536,212 | | | | 0.4 | |
| | | | | | Other | | | 3,345,999 | | | | 2.7 | |
| | | | | | | | | 4,763,796 | | | | 3.8 | |
| PHARMACEUTICALS, BIOTECHNOLOGY & LIFE SCIENCES | | | | | | | |
| | 3,159,100 | | | | Bayer AG. | | | 443,571 | | | | 0.4 | |
| | 1,425,929 | | * | | Biogen Idec, Inc | | | 398,904 | | | | 0.3 | |
| | 2,437,831 | | * | | Celgene Corp | | | 411,896 | | | | 0.3 | |
| | 9,996,561 | | * | | Gilead Sciences, Inc | | | 751,241 | | | | 0.6 | |
| | 12,978,310 | | | | Johnson & Johnson | | | 1,188,683 | | | | 0.9 | |
| | 11,487,518 | | | | Merck & Co, Inc | | | 574,950 | | | | 0.5 | |
| | 5,423,710 | | | | Novartis AG. | | | 434,707 | | | | 0.4 | |
| | 26,392,751 | | | | Pfizer, Inc | | | 808,410 | | | | 0.6 | |
| | | | | | Other | | | 5,417,431 | | | | 4.3 | |
| | | | | | | | | 10,429,793 | | | | 8.3 | |
| REAL ESTATE | | | | | | | | |
| | 19,410,600 | | *,a | | Hibernia REIT plc | | | 31,243 | | | | 0.0 | |
| | | | | | Other | | | 3,983,837 | | | | 3.2 | |
| | | | | | | | | 4,015,080 | | | | 3.2 | |
| 32 | 2013 Annual Report ■ College Retirement Equities Fund | See notes to financial statements |
| Summary portfolio of investments | continued |
CREF Stock Account ■ December 31, 2013
| | | | | | | | | Value | | | % of net |
| | Shares | | | | Company | | | (000) | | | assets |
| RETAILING | | | | | | | | |
| | 1,429,814 | | * | | Amazon.com, Inc | | $ | 570,196 | | | | 0.5 | % |
| | 8,198,187 | | | | Home Depot, Inc | | | 675,039 | | | | 0.5 | |
| | | | | | Other | | | 3,803,444 | | | | 3.0 | |
| | | | | | | | | 5,048,679 | | | | 4.0 | |
| SEMICONDUCTORS & SEMICONDUCTOR EQUIPMENT | | | | | | | | |
| | 15,046,172 | | | | Intel Corp | | | 390,599 | | | | 0.3 | |
| | | | | | Other | | | 2,415,709 | | | | 1.9 | |
| | | | | | | | | 2,806,308 | | | | 2.2 | |
| SOFTWARE & SERVICES | | | | | | | | |
| | 7,221,089 | | * | | Facebook, Inc | | | 394,705 | | | | 0.3 | |
| | 1,237,999 | | * | | Google, Inc (Class A) | | | 1,387,438 | | | | 1.1 | |
| | 3,735,027 | | | | International Business Machines Corp | | | 700,579 | | | | 0.6 | |
| | 590,728 | | | | Mastercard, Inc (Class A) | | | 493,530 | | | | 0.4 | |
| | 34,871,890 | | | | Microsoft Corp | | | 1,305,255 | | | | 1.0 | |
| | 14,121,029 | | | | Oracle Corp | | | 540,270 | | | | 0.4 | |
| | 2,721,441 | | | | Visa, Inc (Class A) | | | 606,010 | | | | 0.5 | |
| | | | | | Other | | | 4,601,657 | | | | 3.6 | |
| | | | | | | | | 10,029,444 | | | | 7.9 | |
| TECHNOLOGY HARDWARE & EQUIPMENT | | | | | | | | |
| | 3,983,091 | | | | Apple, Inc | | | 2,234,952 | | | | 1.8 | |
| | 19,894,109 | | | | Cisco Systems, Inc | | | 446,623 | | | | 0.4 | |
| | 5,951,505 | | | | Qualcomm, Inc | | | 441,899 | | | | 0.3 | |
| | | | | | Other | | | 3,036,113 | | | | 2.4 | |
| | | | | | | | | 6,159,587 | | | | 4.9 | |
| TELECOMMUNICATION SERVICES | | | | | | | | |
| | 14,089,913 | | | | AT&T, Inc | | | 495,401 | | | | 0.4 | |
| | 11,403,254 | | | | Verizon Communications, Inc | | | 560,356 | | | | 0.4 | |
| | | | | | Other | | | 2,283,623 | | | | 1.8 | |
| | | | | | | | | 3,339,380 | | | | 2.6 | |
| TRANSPORTATION | | | | | | | | |
| | 2,789,380 | | | | Union Pacific Corp | | | 468,616 | | | | 0.4 | |
| | | | | | Other | | | 2,704,232 | | | | 2.1 | |
| | | | | | | | | 3,172,848 | | | | 2.5 | |
| UTILITIES | | | 3,432,023 | | | | 2.7 | |
| | | | | | TOTAL COMMON STOCKS | (Cost $100,742,614) | | | 125,638,491 | | | | 99.5 | |
| | | | | | | | | | | | | | |
| PREFERRED STOCKS | | | | | | | | |
| BANKS | | | ¸15,198 | | | | 0.0 | |
| DIVERSIFIED FINANCIALS | | | 1,435 | | | | 0.0 | |
| REAL ESTATE | | | 19 | | | | 0.0 | |
| | | | | | TOTAL PREFERRED STOCKS | (Cost $22,738) | | | 16,652 | | | | 0.0 | |
| See notes to financial statements | College Retirement Equities Fund ■ 2013 Annual Report | 33 |
| Summary portfolio of investments | continued |
| | |
| CREF Stock Account ■ December 31, 2013 | |
| | | | | | | | | Value | | | % of net |
| | Shares | | | | Company | | | (000) | | | assets |
| RIGHTS / WARRANTS | | | | | | | | |
| BANKS | | $ | 2,292 | | | | 0.0 | % |
| CAPITAL GOODS | | | 46 | | | | 0.0 | |
| CONSUMER SERVICES | | | 3 | | | | 0.0 | |
| DIVERSIFIED FINANCIALS | | | 957 | | | | 0.0 | |
| ENERGY | | | 1,418 | | | | 0.0 | |
| FOOD, BEVERAGE & TOBACCO | | | 4 | | | | 0.0 | |
| HEALTH CARE EQUIPMENT & SERVICES | | | 34 | | | | 0.0 | |
| MATERIALS | | | 614 | | | | 0.0 | |
| PHARMACEUTICALS, BIOTECHNOLOGY & LIFE SCIENCES | | | 360 | | | | 0.0 | |
| REAL ESTATE | | | 36 | | | | 0.0 | |
| UTILITIES | | | 34 | | | | 0.0 | |
| | | | | | TOTAL RIGHTS / WARRANTS | (Cost $4,747) | | | 5,798 | | | | 0.0 | |
| | | | | | | | | | | | | | | | |
| | Principal | | | | Issuer | | | | | | | | | | |
| SHORT-TERM INVESTMENTS | | | | | | | | |
| GOVERNMENT AGENCY DEBT | | | 281,165 | | | | 0.2 | |
| TREASURY DEBT | | | 144,280 | | | | 0.2 | |
| INVESTMENT OF CASH COLLATERAL FOR SECURITIES LOANED | | | | | | | | |
| REPURCHASE AGREEMENT | | | | | | | | |
| $ | 800,000,000 | | n | | Barclays | 0.010%, 01/02/14 | | | 800,000 | | | | 0.6 | |
| | 700,000,000 | | o | | Calyon | 0.020%, 01/02/14 | | | 700,000 | | | | 0.5 | |
| | 440,000,000 | | p | | Citigroup | 0.010%, 01/02/14 | | | 440,000 | | | | 0.3 | |
| | 600,000,000 | | q | | Merrill Lynch | 0.010%-0.050%, 01/02/14 | | | 600,000 | | | | 0.5 | |
| | 951,000,000 | | r | | Royal Bank of Scotland | 0.010%, 01/02/14 | | | 951,000 | | | | 0.7 | |
| | | | s | | Other Repurchase Agreements | 0.010%-0.020%, 01/02/14 | | | 859,000 | | | | 0.8 | |
| | | | | | | | | 4,350,000 | | | | 3.4 | |
| TREASURY DEBT | | | 140,000 | | | | 0.1 | |
| VARIABLE RATE SECURITIES | | | 474,497 | | | | 0.4 | |
| TOTAL INVESTMENT OF CASH COLLATERAL FOR SECURITIES LOANED | | | | 4,964,497 | | | | 3.9 | |
| | | | | | TOTAL SHORT-TERM INVESTMENTS | (Cost $5,391,872) | | | 5,389,942 | | | | 4.3 | |
| | | | | | | | | | | | | | |
| | | | | | TOTAL PORTFOLIO | (Cost $106,164,248) | | | 131,053,063 | | | | 103.8 | |
| | | | | | OTHER ASSETS & LIABILITIES, NET | | | | (4,709,701 | ) | | | (3.8 | ) |
| | | | | | NET ASSETS | | | $ | 126,343,362 | | | | 100.0 | % |
| 34 | 2013 Annual Report ■ College Retirement Equities Fund | See notes to financial statements |
| Summary portfolio of investments | concluded |
| | |
| CREF Stock Account ■ December 31, 2013 | |
| * | Non-income producing. |
| ^ | Amount represents less than $1,000. |
| a | Affiliated holding. |
| e | All or a portion of these securities are out on loan. The aggregate value of securities on loan is $4,975,468,000. |
| n | Agreement with Barclays, 0.01% dated 12/31/13 to be repurchased at $800,000,000 on 1/2/14, collateralized by U.S. Government Agency Securities valued at $816,422,000. |
| o | Agreement with Calyon, 0.02% dated 12/31/13 to be repurchased at $700,000,000 on 1/2/14, collateralized by U.S. Government Agency Securities valued at $714,000,000. |
| p | Agreement with Citigroup, 0.01% dated 12/31/13 to be repurchased at $440,000,000 on 1/2/14, collateralized by U.S. Government Agency Securities valued at $448,800,000. |
| q | Agreements with Merrill Lynch, 0.01%-0.05% dated 12/31/13 to be repurchased at $600,001,000 on 1/2/14, collateralized by U.S. Government Agency Securities valued at $612,000,000. |
| r | Agreement with Royal Bank of Scotland, 0.01% dated 12/31/13 to be repurchased at $951,003,000 on 1/2/14, collateralized by U.S. Government Agency Securities valued at $970,023,000. |
| s | Agreements, 0.01%-0.02% dated 12/31/13 to be repurchased at $859,002,000 on 1/2/14, collateralized by U.S. Government Agency Securities valued at $876,182,000. |
“Other” securities represent the aggregate value, by category, of securities that are not among the 50 largest holdings and, in total for any issuer, represent 1% or less of net assets.
At 12/31/13, the aggregate value of restricted securities amounted to $409,000, or 0.0% of net assets.
At 12/31/13, the aggregate value of securities exempt from registration under Rule 144(A) of the Securities Act of 1933 amounted to $6,690,000, or 0.0% of net assets. Such securities are deemed liquid and may be resold in transactions exempt from registration to qualified institutional buyers.
Cost amounts are in thousands.
For ease of presentation, a number of classification categories have been grouped together in the Summary Portfolio of Investments. Note that the Account uses more specific categories in following its investment limitations on investment concentrations.
| See notes to financial statements | College Retirement Equities Fund ■ 2013 Annual Report | 35 |
Summary of market values by country
CREF Stock Account ■ December 31, 2013
| | | | | | | % of | |
| | | Value | | | total | |
| Country | | (000) | | | portfolio | |
| DOMESTIC | | | | | | | | |
| UNITED STATES | | $ | 92,283,454 | | | | 70.4 | % |
| TOTAL DOMESTIC | | | 92,283,454 | | | | 70.4 | |
| | | | | | | | | |
| FOREIGN | | | | | | | | |
| ARGENTINA | | | 1,097 | | | | 0.0 | |
| AUSTRALIA | | | 1,579,882 | | | | 1.2 | |
| AUSTRIA | | | 131,406 | | | | 0.1 | |
| BELGIUM | | | 248,061 | | | | 0.2 | |
| BERMUDA | | | 69,703 | | | | 0.1 | |
| BRAZIL | | | 796,018 | | | | 0.6 | |
| CAMBODIA | | | 2,294 | | | | 0.0 | |
| CANADA | | | 2,818,620 | | | | 2.2 | |
| CAYMAN ISLANDS | | | 31,038 | | | | 0.0 | |
| CHILE | | | 108,930 | | | | 0.1 | |
| CHINA | | | 1,600,220 | | | | 1.2 | |
| COLOMBIA | | | 76,126 | | | | 0.1 | |
| CYPRUS | | | 13,249 | | | | 0.0 | |
| CZECH REPUBLIC | | | 24,992 | | | | 0.0 | |
| DENMARK | | | 328,240 | | | | 0.3 | |
| EGYPT | | | 16,761 | | | | 0.0 | |
| FAROE ISLANDS | | | 786 | | | | 0.0 | |
| FINLAND | | | 306,668 | | | | 0.2 | |
| FRANCE | | | 3,094,433 | | | | 2.4 | |
| GEORGIA | | | 3,894 | | | | 0.0 | |
| GERMANY | | | 2,611,758 | | | | 2.0 | |
| GIBRALTAR | | | 1,681 | | | | 0.0 | |
| GREECE | | | 104,253 | | | | 0.1 | |
| GUERNSEY, C.I. | | | 2,398 | | | | 0.0 | |
| HONG KONG | | | 880,916 | | | | 0.7 | |
| HUNGARY | | | 17,478 | | | | 0.0 | |
| INDIA | | | 567,485 | | | | 0.4 | |
| INDONESIA | | | 170,025 | | | | 0.1 | |
| IRELAND | | | 369,674 | | | | 0.3 | |
| ISLE OF MAN | | | 5,502 | | | | 0.0 | |
| ISRAEL | | | 103,485 | | | | 0.1 | |
| | | | | | % of | |
| | | Value | | | | total | |
| Country | | (000) | | | | portfolio | |
| ITALY | | $ | 525,080 | | | | 0.4 | % |
| JAPAN | | | 5,782,017 | | | | 4.4 | |
| JERSEY, C.I. | | | 4,870 | | | | 0.0 | |
| KOREA, REPUBLIC OF | | | 1,285,907 | | | | 1.0 | |
| LUXEMBOURG | | | 45,207 | | | | 0.0 | |
| MACAU | | | 26,528 | | | | 0.0 | |
| MALAYSIA | | | 275,133 | | | | 0.2 | |
| MEXICO | | | 407,296 | | | | 0.3 | |
| MONACO | | | 1,744 | | | | 0.0 | |
| NETHERLANDS | | | 1,267,340 | | | | 1.0 | |
| NEW ZEALAND | | | 90,557 | | | | 0.1 | |
| NORWAY | | | 263,659 | | | | 0.2 | |
| PANAMA | | | 37,307 | | | | 0.0 | |
| PERU | | | 22,899 | | | | 0.0 | |
| PHILIPPINES | | | 98,837 | | | | 0.1 | |
| POLAND | | | 132,587 | | | | 0.1 | |
| PORTUGAL | | | 40,364 | | | | 0.0 | |
| PUERTO RICO | | | 7,632 | | | | 0.0 | |
| ROMANIA | | | 596 | | | | 0.0 | |
| RUSSIA | | | 416,966 | | | | 0.3 | |
| SINGAPORE | | | 420,210 | | | | 0.3 | |
| SOUTH AFRICA | | | 538,412 | | | | 0.4 | |
| SPAIN | | | 500,520 | | | | 0.4 | |
| SWEDEN | | | 905,527 | | | | 0.7 | |
| SWITZERLAND | | | 2,383,614 | | | | 1.8 | |
| TAIWAN | | | 1,007,805 | | | | 0.8 | |
| THAILAND | | | 191,498 | | | | 0.1 | |
| TURKEY | | | 136,188 | | | | 0.1 | |
| UKRAINE | | | 2,962 | | | | 0.0 | |
| UNITED ARAB EMIRATES | | | 26,230 | | | | 0.0 | |
| UNITED KINGDOM | | | 5,837,044 | | | | 4.5 | |
| TOTAL FOREIGN | | | 38,769,609 | | | | 29.6 | |
| | | | | | | | | |
| TOTAL PORTFOLIO | | $ | 131,053,063 | | | | 100.0 | % |
| 36 | 2013 Annual Report ■ College Retirement Equities Fund | See notes to financial statements |
Summary portfolio of investments
CREF Global Equities Account ■ December 31, 2013
| | | | | | | Value | | | % of net |
| Shares | | | | Company | | (000) | | | assets |
| COMMON STOCKS |
| AUSTRALIA | | | | | | | | |
| | 2,183,307 | | | | BHP Billiton Ltd | | $ | 74,436 | | | | 0.4 | % |
| | | | | | Other | | | 320,463 | | | | 1.7 | |
| | | | | | | | | 394,899 | | | | 2.1 | |
| AUSTRIA | | | 17,285 | | | | 0.1 | |
| BELGIUM | | | 55,908 | | | | 0.3 | |
| BERMUDA | | | 16,577 | | | | 0.1 | |
| BRAZIL | | | 13,126 | | | | 0.1 | |
| CANADA | | | 669,602 | | | | 3.5 | |
| CAYMAN ISLANDS | | | | | 3,274 | | | | 0.0 | |
| CHINA | | | | | | | 212,028 | | | | 1.1 | |
| COLOMBIA | | | | | | | 2,901 | | | | 0.0 | |
| DENMARK | | | | | | | 72,094 | | | | 0.4 | |
| FINLAND | | | | | | | 67,961 | | | | 0.4 | |
| FRANCE | | | | | | | | | | | | |
| | 1,129,791 | | | | BNP Paribas | | | 88,132 | | | | 0.4 | |
| | 933,585 | | | | European Aeronautic Defence and Space Co | | | 71,671 | | | | 0.4 | |
| | 1,197,130 | | | | Total S.A. | | | 73,479 | | | | 0.4 | |
| | | | | | Other | | | 574,545 | | | | 3.0 | |
| | | | | | | | | 807,827 | | | | 4.2 | |
| GERMANY | | | | | | | | | | | | |
| | 501,168 | | | | Allianz AG. | | | 90,173 | | | | 0.5 | |
| | 971,305 | | | | Bayer AG. | | | 136,382 | | | | 0.7 | |
| | 697,946 | | | | Beiersdorf AG. | | | 70,761 | | | | 0.4 | |
| | 753,970 | | | | Daimler AG. (Reg) | | | 65,433 | | | | 0.3 | |
| | | | | | Other | | | 445,474 | | | | 2.3 | |
| | | | | | | | | 808,223 | | | | 4.2 | |
| GREECE | | | 5,073 | | | | 0.0 | |
| HONG KONG | | | 242,921 | | | | 1.3 | |
| INDIA | | | 59,663 | | | | 0.3 | |
| INDONESIA | | | 6,091 | | | | 0.0 | |
| IRELAND | | | 173,675 | | | | 0.9 | |
| ISLE OF MAN | | | 2,466 | | | | 0.0 | |
| ISRAEL | | | 10,898 | | | | 0.1 | |
| ITALY | | | 183,727 | | | | 1.0 | |
| JAPAN | | | | | | | | |
| | 2,214,848 | | | | Toyota Motor Corp | | | 135,051 | | | | 0.7 | |
| | | | | | Other | | | 1,427,075 | | | | 7.5 | |
| | | | | | | | | 1,562,126 | | | | 8.2 | |
| See notes to financial statements | College Retirement Equities Fund ■ 2013 Annual Report | 37 |
| Summary portfolio of investments | continued |
CREF Global Equities Account ■ December 31, 2013
| | | | | | | Value | | | % of net |
| Shares | | | | Company | | (000) | | | assets |
| JERSEY, C.I. | | $ | 553 | | | | 0.0 | % |
| KOREA, REPUBLIC OF | | | 37,611 | | | | 0.2 | |
| LUXEMBOURG | | | 4,332 | | | | 0.0 | |
| MACAU | | | 13,843 | | | | 0.1 | |
| MALAYSIA | | | 6,846 | | | | 0.0 | |
| MEXICO | | | 10,465 | | | | 0.0 | |
| NETHERLANDS | | | | | | | | |
| | 5,893,293 | | * | | ING Groep NV | | | 82,321 | | | | 0.4 | |
| | | | | | Other | | | 277,668 | | | | 1.5 | |
| | | | | | | | | 359,989 | | | | 1.9 | |
| NEW ZEALAND | | | 8,255 | | | | 0.0 | |
| NORWAY | | | 74,265 | | | | 0.4 | |
| PANAMA | | | 13,207 | | | | 0.1 | |
| PHILIPPINES | | | 15,217 | | | | 0.1 | |
| PORTUGAL | | | 4,221 | | | | 0.0 | |
| RUSSIA | | | 15,106 | | | | 0.1 | |
| SINGAPORE | | | 117,612 | | | | 0.6 | |
| SPAIN | | | 114,078 | | | | 0.6 | |
| SWEDEN | | | 220,180 | | | | 1.1 | |
| SWITZERLAND | | | | | | | | |
| | 1,090,163 | | | | Nestle S.A. | | | 79,898 | | | | 0.4 | |
| | 1,699,712 | | | | Novartis AG. | | | 136,231 | | | | 0.7 | |
| | 568,069 | | | | Roche Holding AG. | | | 159,131 | | | | 0.8 | |
| | 3,492,375 | | | | UBS AG. | | | 66,869 | | | | 0.4 | |
| | | | | | Other | | | 346,861 | | | | 1.8 | |
| | | | | | | | | 788,990 | | | | 4.1 | |
| TAIWAN | | | 54,350 | | | | 0.3 | |
| THAILAND | | | 12,391 | | | | 0.1 | |
| TURKEY | | | 19,441 | | | | 0.1 | |
| UKRAINE | | | 6,947 | | | | 0.0 | |
| UNITED ARAB EMIRATES | | | 4,871 | | | | 0.0 | |
| UNITED KINGDOM | | | | | | | | |
| | 23,399,325 | | | | Barclays plc | | | 105,809 | | | | 0.5 | |
| | 6,178,010 | | | | HSBC Holdings plc | | | 67,798 | | | | 0.4 | |
| | 3,255,075 | | | | Prudential plc | | | 72,731 | | | | 0.4 | |
| | 26,056,268 | | | | Vodafone Group plc | | | 102,589 | | | | 0.5 | |
| | | | | | Other | | | 1,160,574 | | | | 6.1 | |
| | | | | | | | | 1,509,501 | | | | 7.9 | |
| 38 | 2013 Annual Report ■ College Retirement Equities Fund | See notes to financial statements |
| Summary portfolio of investments | continued |
CREF Global Equities Account ■ December 31, 2013
| | | | | | | Value | | | % of net |
| Shares | | | | Company | | (000) | | | assets |
| UNITED STATES | | | | | | | | | |
| | 1,786,750 | | | | Abbott Laboratories | | $ | 68,486 | | | | 0.4 | % |
| | 679,286 | | | | ACE Ltd | | | 70,326 | | | | 0.4 | |
| | 568,407 | | | | Apple, Inc | | | 318,939 | | | | 1.7 | |
| | 474,935 | | * | | Celgene Corp | | | 80,245 | | | | 0.4 | |
| | 925,721 | | | | Chevron Corp | | | 115,632 | | | | 0.6 | |
| | 2,547,732 | | | | Citigroup, Inc | | | 132,762 | | | | 0.7 | |
| | 2,374,975 | | | | Comcast Corp (Class A) | | | 123,416 | | | | 0.6 | |
| | 1,931,332 | | d | | Exxon Mobil Corp | | | 195,451 | | | | 1.0 | |
| | 6,061,404 | | | | General Electric Co | | | 169,901 | | | | 0.9 | |
| | 1,642,697 | | * | | General Motors Co | | | 67,137 | | | | 0.3 | |
| | 1,622,088 | | * | | Gilead Sciences, Inc | | | 121,900 | | | | 0.6 | |
| | 477,240 | | | | Goldman Sachs Group, Inc | | | 84,596 | | | | 0.4 | |
| | 184,166 | | * | | Google, Inc (Class A) | | | 206,397 | | | | 1.1 | |
| | 1,363,673 | | | | Home Depot, Inc | | | 112,285 | | | | 0.6 | |
| | 1,061,991 | | | | Honeywell International, Inc | | | 97,034 | | | | 0.5 | |
| | 1,284,436 | | | | iShares MSCI EAFE Index Fund | | | 86,134 | | | | 0.4 | |
| | 1,232,714 | | | | Johnson & Johnson | | | 112,904 | | | | 0.6 | |
| | 1,591,540 | | | | JPMorgan Chase & Co | | | 93,073 | | | | 0.5 | |
| | 3,819,249 | | | | Microsoft Corp | | | 142,954 | | | | 0.7 | |
| | 2,414,075 | | | | Oracle Corp | | | 92,363 | | | | 0.5 | |
| | 928,717 | | | | PepsiCo, Inc | | | 77,028 | | | | 0.4 | |
| | 4,833,385 | | | | Pfizer, Inc | | | 148,047 | | | | 0.8 | |
| | 773,910 | | | | Philip Morris International, Inc | | | 67,431 | | | | 0.3 | |
| | 1,333,860 | | | | Procter & Gamble Co | | | 108,590 | | | | 0.6 | |
| | 861,127 | | | | Schlumberger Ltd | | | 77,596 | | | | 0.4 | |
| | 470,883 | | | | Union Pacific Corp | | | 79,108 | | | | 0.4 | |
| | 1,892,737 | | | | Verizon Communications, Inc | | | 93,009 | | | | 0.5 | |
| | 478,145 | | | | Visa, Inc (Class A) | | | 106,473 | | | | 0.6 | |
| | 1,154,441 | | * | | Walt Disney Co | | | 88,199 | | | | 0.5 | |
| | 4,117,630 | | | | Wells Fargo & Co | | | 186,940 | | | | 1.0 | |
| | | | | | Other | | | 6,555,521 | | | | 34.3 | |
| | | | | | | | | 10,079,877 | | | | 52.7 | |
| | | | | | TOTAL COMMON STOCKS | (Cost $14,987,646) | | | 18,880,493 | | | | 98.7 | |
| | | | | | | | | | | | | | |
| RIGHTS / WARRANTS | | | | | | | |
| CANADA | | | | 203 | | | | 0.0 | |
| SINGAPORE | | | | 4 | | | | 0.0 | |
| SPAIN | | | 492 | | | | 0.0 | |
| UNITED STATES | | | 86 | | | | 0.0 | |
| | | | | | TOTAL RIGHTS / WARRANTS | (Cost $841) | | | 785 | | | | 0.0 | |
| See notes to financial statements | College Retirement Equities Fund ■ 2013 Annual Report | 39 |
| Summary portfolio of investments | concluded |
CREF Global Equities Account ■ December 31, 2013
| | | | | | | | Value | | | % of net |
| Principal | | | | Issuer | | | (000) | | | assets |
| SHORT-TERM INVESTMENTS | | | | | | | | | |
| GOVERNMENT AGENCY DEBT | | | $ | 19,998 | | | | 0.1 | % |
| TREASURY DEBT | | | | 210,816 | | | | 1.1 | |
| INVESTMENT OF CASH COLLATERAL FOR SECURITIES LOANED | | | | | | | | | |
| REPURCHASE AGREEMENT | | | | | | | | | |
| $ | 142,000,000 | | n | | Calyon | 0.020%, 01/02/14 | | | 142,000 | | | | 0.7 | |
| | 79,000,000 | | o | | Societe Generale | 0.010%, 01/02/14 | | | 79,000 | | | | 0.4 | |
| | | | p | | Other Repurchase Agreements | 0.010%, 01/02/14 | | | 99,000 | | | | 0.6 | |
| | | | | | | | | | 320,000 | | | | 1.7 | |
| VARIABLE RATE SECURITIES | | | | 88,192 | | | | 0.5 | |
| TOTAL INVESTMENT OF CASH COLLATERAL FOR SECURITIES LOANED | | | | 408,192 | | | | 2.2 | |
| TOTAL SHORT-TERM INVESTMENTS | (Cost $639,334) | | | 639,006 | | | | 3.4 | |
| | | | | | | | | | | | | | | |
| | | | | | TOTAL PORTFOLIO | (Cost $15,627,821) | | | 19,520,284 | | | | 102.1 | |
| | | | | | OTHER ASSETS & LIABILITIES, NET | | | | (392,565 | ) | | | (2.1 | ) |
| | | | | | NET ASSETS | | | $ | 19,127,719 | | | | 100.0 | % |
| * | Non-income producing. |
| d | All or a portion of these securities have been segregated by the custodian to cover margin or other requirements on open futures transactions. |
| n | Agreement with Calyon, 0.02% dated 12/31/13 to be repurchased at $142,000,000 on 1/2/14, collateralized by U.S. Government Agency Securities valued at $144,840,000. |
| o | Agreement with Societe Generale, 0.01% dated 12/31/13 to be repurchased at $79,000,000 on 1/2/14, collateralized by U.S. Government Agency Securities valued at $80,580,000. |
| p | Agreements, 0.01% dated 12/31/13 to be repurchased at $99,001,000 on 1/2/14, collateralized by U.S. Government Agency Securities valued at $100,981,000. |
“Other” securities represent the aggregate value, by category, of securities that are not among the 50 largest holdings and, in total for any issuer, represent 1% or less of net assets.
The aggregate value of securities on loan is $498,279,000.
Cost amounts are in thousands.
For ease of presentation, a number of classification categories have been grouped together in the Summary Portfolio of Investments. Note that the Account uses more specific categories in following its investment limitations on investment concentrations.
| 40 | 2013 Annual Report ■ College Retirement Equities Fund | See notes to financial statements |
Summary of market values by sector
CREF Global Equities Account ■ December 31, 2013
| | | Value | | | % of net |
| Sector | | (000) | | | assets |
| FINANCIALS | | $ | 3,888,816 | | | | 20.4 | % |
| CONSUMER DISCRETIONARY | | | 3,113,034 | | | | 16.3 | |
| INFORMATION TECHNOLOGY | | | 2,509,440 | | | | 13.1 | |
| INDUSTRIALS | | | 2,494,584 | | | | 13.0 | |
| HEALTH CARE | | | 2,300,075 | | | | 12.0 | |
| CONSUMER STAPLES | | | 1,398,289 | | | | 7.3 | |
| ENERGY | | | 1,386,284 | | | | 7.3 | |
| MATERIALS | | | 906,980 | | | | 4.7 | |
| TELECOMMUNICATION SERVICES | | | 479,220 | | | | 2.5 | |
| UTILITIES | | | 404,556 | | | | 2.1 | |
| SHORT-TERM INVESTMENTS | | | 639,006 | | | | 3.4 | |
| OTHER ASSETS & LIABILITIES, NET | | | (392,565 | ) | | | (2.1 | ) |
| NET ASSETS | | $ | 19,127,719 | | | | 100.0 | % |
| See notes to financial statements | College Retirement Equities Fund ■ 2013 Annual Report | 41 |
Summary portfolio of investments
CREF Growth Account ■ December 31, 2013
| | | | | | | Value | | | % of net |
| Shares | | | | Company | | (000) | | | assets |
| COMMON STOCKS | | | | | | | | |
| AUTOMOBILES & COMPONENTS | | | | | | | | |
| | 2,700,333 | | * | | General Motors Co | | $ | 110,362 | | | | 0.6 | % |
| | | | | | Other | | | 404,843 | | | | 2.1 | |
| | | | | | | | | 515,205 | | | | 2.7 | |
| BANKS | | | 52,882 | | | | 0.3 | |
| CAPITAL GOODS | | | | | | | | |
| | 1,761,298 | | | | Boeing Co | | | 240,400 | | | | 1.2 | |
| | 1,243,074 | | | | Honeywell International, Inc | | | 113,580 | | | | 0.6 | |
| | 420,941 | | | | Precision Castparts Corp | | | 113,359 | | | | 0.6 | |
| | 422,917 | | | | W.W. Grainger, Inc | | | 108,021 | | | | 0.6 | |
| | | | | | Other | | | 842,952 | | | | 4.3 | |
| | | | | | | | | 1,418,312 | | | | 7.3 | |
| COMMERCIAL & PROFESSIONAL SERVICES | | | 288,572 | | | | 1.5 | |
| CONSUMER DURABLES & APPAREL | | | | | | | | |
| | 1,194,398 | | | | Nike, Inc (Class B) | | | 93,928 | | | | 0.5 | |
| | | | | | Other | | | 457,814 | | | | 2.3 | |
| | | | | | | | | 551,742 | | | | 2.8 | |
| CONSUMER SERVICES | | | | | | | | |
| | 2,201,973 | | | | Las Vegas Sands Corp | | | 173,670 | | | | 0.9 | |
| | 1,904,123 | | | | Starbucks Corp | | | 149,264 | | | | 0.8 | |
| | | | | | Other | | | 343,100 | | | | 1.7 | |
| | | | | | | | | 666,034 | | | | 3.4 | |
| DIVERSIFIED FINANCIALS | | | | | | | | |
| | 963,638 | | | | Ameriprise Financial, Inc | | | 110,867 | | | | 0.6 | |
| | 553,785 | | | | Goldman Sachs Group, Inc | | | 98,164 | | | | 0.5 | |
| | 1,250,000 | | e | | iShares Russell 1000 Growth Index Fund | | | | 107,437 | | | | 0.5 | |
| | | | | | Other | | | 577,182 | | | | 3.0 | |
| | | | | | | | | 893,650 | | | | 4.6 | |
| ENERGY | | | | | | | | |
| | 587,013 | | | | EOG Resources, Inc | | | 98,524 | | | | 0.5 | |
| | 1,916,158 | | | | Schlumberger Ltd | | | 172,665 | | | | 0.9 | |
| | | | | | Other | | | 325,798 | | | | 1.7 | |
| | | | | | | | | 596,987 | | | | 3.1 | |
| FOOD & STAPLES RETAILING | | | | | | | | |
| | 1,284,243 | | | | Costco Wholesale Corp | | | 152,838 | | | | 0.8 | |
| | | | | | Other | | | 241,209 | | | | 1.2 | |
| | | | | | | | | 394,047 | | | | 2.0 | |
| 42 | 2013 Annual Report ■ College Retirement Equities Fund | See notes to financial statements |
| Summary portfolio of investments | continued |
CREF Growth Account ■ December 31, 2013
| | | | | | | Value | | | % of net |
| Shares | | | | Company | | (000) | | | assets |
| FOOD, BEVERAGE & TOBACCO | | | | | | | | |
| | 3,158,013 | | | | Altria Group, Inc | | $ | 121,236 | | | | 0.6 | % |
| | 3,177,358 | | | | Coca-Cola Co | | | 131,257 | | | | 0.7 | |
| | 1,782,015 | | | | PepsiCo, Inc | | | 147,800 | | | | 0.8 | |
| | 1,129,284 | | | | Philip Morris International, Inc | | | 98,394 | | | | 0.5 | |
| | | | | | Other | | | 354,882 | | | | 1.8 | |
| | | | | | | | | 853,569 | | | | 4.4 | |
| HEALTH CARE EQUIPMENT & SERVICES | | | 591,595 | | | | 3.1 | |
| HOUSEHOLD & PERSONAL PRODUCTS | | | 171,816 | | | | 0.9 | |
| INSURANCE | | | 172,797 | | | | 0.9 | |
| MATERIALS | | | | | | | | |
| | 1,655,148 | | | | LyondellBasell Industries AF S.C.A | | | 132,875 | | | | 0.7 | |
| | 1,777,228 | | | | Monsanto Co | | | 207,136 | | | | 1.1 | |
| | | | | | Other | | | 493,215 | | | | 2.5 | |
| | | | | | | | | 833,226 | | | | 4.3 | |
| MEDIA | | | | | | | | |
| | 6,515,507 | | | | Comcast Corp (Class A) | | | 338,578 | | | | 1.7 | |
| | 1,274,062 | | * | | Discovery Communications, Inc (Class A) | | | 115,201 | | | | 0.6 | |
| | | | | | Other | | | 581,088 | | | | 3.0 | |
| | | | | | | | | 1,034,867 | | | | 5.3 | |
| PHARMACEUTICALS, BIOTECHNOLOGY & LIFE SCIENCES | | | | | | | | |
| | 793,609 | | * | | Alexion Pharmaceuticals, Inc | | | 105,598 | | | | 0.6 | |
| | 973,383 | | | | Amgen, Inc | | | 111,121 | | | | 0.6 | |
| | 1,015,445 | | * | | Biogen Idec, Inc | | | 284,071 | | | | 1.5 | |
| | 1,297,690 | | * | | Celgene Corp | | | 219,258 | | | | 1.1 | |
| | 5,258,100 | | * | | Gilead Sciences, Inc | | | 395,146 | | | | 2.0 | |
| | 781,367 | | | | Perrigo Co plc | | | 119,908 | | | | 0.6 | |
| | 3,069,296 | | | | Zoetis Inc | | | 100,335 | | | | 0.5 | |
| | | | | | Other | | | 900,558 | | | | 4.6 | |
| | | | | | | | | 2,235,995 | | | | 11.5 | |
| REAL ESTATE | | | | | | | | |
| | 1,850,331 | | * | | Realogy Holdings Corp | | | | 91,536 | | | | 0.5 | |
| | | | | | Other | | | 165,490 | | | | 0.8 | |
| | | | | | | | | 257,026 | | | | 1.3 | |
| RETAILING | | | | | | | | |
| | 957,363 | | * | | Amazon.com, Inc | | | 381,787 | | | | 2.0 | |
| | 1,974,549 | | * | | Carmax, Inc | | | 92,843 | | | | 0.5 | |
| | 2,527,132 | | | | Home Depot, Inc | | | 208,084 | | | | 1.1 | |
| | | | | | Other | | | 711,142 | | | | 3.6 | |
| | | | | | | | | 1,393,856 | | | | 7.2 | |
| SEMICONDUCTORS & SEMICONDUCTOR EQUIPMENT | | | 315,206 | | | | 1.6 | |
| See notes to financial statements | College Retirement Equities Fund ■ 2013 Annual Report | 43 |
| Summary portfolio of investments | continued |
CREF Growth Account ■ December 31, 2013
| | | | | | | Value | | | % of net |
| Shares | | | | Company | | (000) | | | assets |
| SOFTWARE & SERVICES | | | | | | | | |
| | 2,828,207 | | * | | Adobe Systems, Inc | | $ | 169,353 | | | | 0.9 | % |
| | 3,468,159 | | * | | eBay, Inc | | | 190,367 | | | | 1.0 | |
| | 5,359,676 | | * | | Facebook, Inc | | | 292,960 | | | | 1.5 | |
| | 600,872 | | * | | Google, Inc (Class A) | | | 673,403 | | | | 3.5 | |
| | 1,074,172 | | | | International Business Machines Corp | | | 201,482 | | | | 1.0 | |
| | 2,496,237 | | | | Intuit, Inc | | | 190,513 | | | | 1.0 | |
| | 393,041 | | | | Mastercard, Inc (Class A) | | | 328,370 | | | | 1.7 | |
| | 10,394,599 | | | | Microsoft Corp | | | 389,070 | | | | 2.0 | |
| | 5,273,541 | | | | Oracle Corp | | | 201,766 | | | | 1.0 | |
| | 2,154,555 | | * | | Red Hat, Inc | | | 120,741 | | | | 0.6 | |
| | 1,411,392 | | | | Visa, Inc (Class A) | | | 314,289 | | | | 1.6 | |
| | | | | | Other | | | 771,267 | | | | 4.0 | |
| | | | | | | | | 3,843,581 | | | | 19.8 | |
| TECHNOLOGY HARDWARE & EQUIPMENT | | | | | | | | |
| | 1,359,361 | | d | | Apple, Inc | | | | 762,751 | | | | 3.9 | |
| | 2,286,344 | | | | Qualcomm, Inc | | | 169,761 | | | | 0.9 | |
| | | | | | Other | | | 273,635 | | | | 1.4 | |
| | | | | | | | | 1,206,147 | | | | 6.2 | |
| TELECOMMUNICATION SERVICES | | | | | | | | |
| | 2,429,547 | | | | Verizon Communications, Inc | | | 119,388 | | | | 0.6 | |
| | | | | | Other | | | 141,391 | | | | 0.7 | |
| | | | | | | | | 260,779 | | | | 1.3 | |
| TRANSPORTATION | | | | | | | | |
| | 945,385 | | | | Kansas City Southern Industries, Inc | | | 117,067 | | | | 0.6 | |
| | 675,724 | | | | Union Pacific Corp | | | 113,522 | | | | 0.6 | |
| | | | | | Other | | | 421,126 | | | | 2.2 | |
| | | | | | | | | 651,715 | | | | 3.4 | |
| UTILITIES | | | 17,331 | | | | 0.1 | |
| | | | | | TOTAL COMMON STOCKS | (Cost $14,251,762) | | | 19,216,937 | | | | 99.0 | |
| 44 | 2013 Annual Report ■ College Retirement Equities Fund | See notes to financial statements |
| Summary portfolio of investments | concluded |
CREF Growth Account ■ December 31, 2013
| | | | | | | Value | | | % of net |
| Principal | | | | Issuer | | (000) | | | assets |
| SHORT-TERM INVESTMENTS | | | | | | | | |
| GOVERNMENT AGENCY DEBT | | $ | 10,000 | | | | 0.1 | % |
| TREASURY DEBT | | | | 158,920 | | | | 0.8 | |
| | | | | | | | | | | | | | | | |
| Shares | | | | Company | | | | | | | | |
| INVESTMENTS IN REGISTERED INVESTMENT COMPANIES | | | | | | |
| | 338,935,715 | | a,c | | TIAA-CREF Short Term Lending Portfolio of the State Street Navigator Securities Lending Trust | | | 338,936 | | | | 1.7 | |
| | | | | | | | | 338,936 | | | | 1.7 | |
| | | | | | TOTAL SHORT-TERM INVESTMENTS | (Cost $507,847) | | | 507,856 | | | | 2.6 | |
| | | | | | | | | | | | | | |
| | | | | | TOTAL PORTFOLIO | (Cost $14,759,609) | | | 19,724,793 | | | | 101.6 | |
| | | | | | OTHER ASSETS & LIABILITIES, NET | | | | (311,131 | ) | | | (1.6 | ) |
| | | | | | NET ASSETS | | | $ | 19,413,662 | | | | 100.0 | % |
| * | Non-income producing. |
| a | Affiliated holding. |
| c | Investments made with cash collateral received from securities on loan. |
| d | All or a portion of these securities have been segregated by the custodian to cover margin or other requirements on open futures transactions. |
| e | All or a portion of these securities are out on loan. The aggregate value of securities on loan, including those in “Other,” is $332,501,000. |
“Other” securities represent the aggregate value, by category, of securities that are not among the 50 largest holdings and, in total for any issuer, represent 1% or less of net assets.
At 12/31/13, the aggregate value of securities exempt from registration under Rule 144(A) of the Securities Act of 1933 amounted to $18,944,000 or 0.1% of net assets. Such securities are deemed liquid and may be resold in transactions exempt from registration to qualified institutional buyers.
Cost amounts are in thousands.
For ease of presentation, a number of classification categories have been grouped together in the Summary Portfolio of Investments. Note that the Account uses more specific categories in following its investment limitations on investment concentrations.
| See notes to financial statements | College Retirement Equities Fund ■ 2013 Annual Report | 45 |
Summary portfolio of investments
CREF Equity Index Account ■ December 31, 2013
| | | | | | | Value | | | % of net |
| Shares | | | | Company | | (000) | | | assets |
| COMMON STOCKS | | | | | | | | |
| AUTOMOBILES & COMPONENTS | | $ | 181,619 | | | | 1.1 | % |
| BANKS | | | | | | | | |
| | 3,680,732 | | | | Wells Fargo & Co | | | 167,105 | | | | 1.0 | |
| | | | | | Other | | | 379,710 | | | | 2.4 | |
| | | | | | | | | 546,815 | | | | 3.4 | |
| CAPITAL GOODS | | | | | | | | |
| | 526,182 | | | | 3M Co | | | 73,797 | | | | 0.5 | |
| | 578,448 | | | | Boeing Co | | | 78,952 | | | | 0.5 | |
| | 7,883,007 | | | | General Electric Co | | | 220,961 | | | | 1.4 | |
| | 700,858 | | | | United Technologies Corp | | | 79,758 | | | | 0.5 | |
| | | | | | Other | | | 908,043 | | | | 5.7 | |
| | | | | | | | | 1,361,511 | | | | 8.6 | |
| COMMERCIAL & PROFESSIONAL SERVICES | | | 162,040 | | | | 1.0 | |
| CONSUMER DURABLES & APPAREL | �� | | 259,907 | | | | 1.6 | |
| CONSUMER SERVICES | | | | | | | | |
| | 764,374 | | | | McDonald’s Corp | | | 74,167 | | | | 0.5 | |
| | | | | | Other | | | 272,260 | | | | 1.7 | |
| | | | | | | | | 346,427 | | | | 2.2 | |
| DIVERSIFIED FINANCIALS | | | | | | | | |
| | 722,381 | | | | American Express Co | | | 65,542 | | | | 0.4 | |
| | 8,218,119 | | | | Bank of America Corp | | | 127,956 | | | | 0.8 | |
| | 2,319,717 | | | | Citigroup, Inc | | | 120,880 | | | | 0.8 | |
| | 349,609 | | | | Goldman Sachs Group, Inc | | | 61,972 | | | | 0.4 | |
| | 2,881,500 | | | | JPMorgan Chase & Co | | | 168,510 | | | | 1.1 | |
| | | | | | Other | | | 514,128 | | | | 3.2 | |
| | | | | | | | | 1,058,988 | | | | 6.7 | |
| ENERGY | | | | | | | | |
| | 1,477,880 | | | | Chevron Corp | | | 184,602 | | | | 1.2 | |
| | 932,077 | | | | ConocoPhillips | | | 65,851 | | | | 0.4 | |
| | 3,389,888 | | d | | Exxon Mobil Corp | | | 343,057 | | | | 2.1 | |
| | 1,013,608 | | | | Schlumberger Ltd | | | 91,336 | | | | 0.6 | |
| | | | | | Other | | | 777,408 | | | | 4.9 | |
| | | | | | | | | 1,462,254 | | | | 9.2 | |
| FOOD & STAPLES RETAILING | | | | | | | | |
| | 933,442 | | | | CVS Corp | | | 66,806 | | | | 0.4 | |
| | 1,227,726 | | | | Wal-Mart Stores, Inc | | | | 96,610 | | | | 0.6 | |
| | | | | | Other | | | 154,933 | | | | 1.0 | |
| | | | | | | | | 318,349 | | | | 2.0 | |
| 46 | 2013 Annual Report ■ College Retirement Equities Fund | See notes to financial statements |
| Summary portfolio of investments | continued |
CREF Equity Index Account ■ December 31, 2013
| | | | | | | Value | | | % of net |
| Shares | | | | Company | | (000) | | | assets |
| FOOD, BEVERAGE & TOBACCO | | | | | | | | |
| | 1,531,148 | | | | Altria Group, Inc | | $ | 58,781 | | | | 0.4 | % |
| | 2,915,970 | | | | Coca-Cola Co | | | 120,459 | | | | 0.8 | |
| | 1,178,968 | | | | PepsiCo, Inc | | | 97,783 | | | | 0.6 | |
| | 1,246,887 | | | | Philip Morris International, Inc | | | 108,641 | | | | 0.7 | |
| | | | | | Other | | | 336,935 | | | | 2.1 | |
| | | | | | | | | 722,599 | | | | 4.6 | |
| HEALTH CARE EQUIPMENT & SERVICES | | | | | | | | |
| | 777,615 | | | | UnitedHealth Group, Inc | | | 58,554 | | | | 0.4 | |
| | | | | | Other | | | 647,617 | | | | 4.1 | |
| | | | | | | | | 706,171 | | | | 4.5 | |
| HOUSEHOLD & PERSONAL PRODUCTS | | | | | | | | |
| | 2,089,539 | | | | Procter & Gamble Co | | | 170,109 | | | | 1.1 | |
| | | | | | Other | | | 134,961 | | | | 0.8 | |
| | | | | | | | | 305,070 | | | | 1.9 | |
| INSURANCE | | | | | | | | |
| | 1,372,059 | | * | | Berkshire Hathaway, Inc (Class B) | | | 162,671 | | | | 1.0 | |
| | | | | | Other | | | 506,071 | | | | 3.2 | |
| | | | | | | | | 668,742 | | | | 4.2 | |
| MATERIALS | | | 603,294 | | | | 3.8 | |
| MEDIA | | | | | | | | |
| | 2,000,507 | | | | Comcast Corp (Class A) | | | 103,956 | | | | 0.6 | |
| | 1,373,018 | | * | | Walt Disney Co | | | 104,899 | | | | 0.7 | |
| | | | | | Other | | | 407,484 | | | | 2.6 | |
| | | | | | | | | 616,339 | | | | 3.9 | |
| PHARMACEUTICALS, BIOTECHNOLOGY & LIFE SCIENCES | | | | | | | | |
| | 1,207,462 | | | | AbbVie, Inc | | | 63,766 | | | | 0.4 | |
| | 572,623 | | | | Amgen, Inc | | | 65,371 | | | | 0.4 | |
| | 1,252,290 | | | | Bristol-Myers Squibb Co | | | 66,559 | | | | 0.4 | |
| | 1,162,933 | | * | | Gilead Sciences, Inc | | | 87,394 | | | | 0.6 | |
| | 2,141,519 | | | | Johnson & Johnson | | | 196,142 | | | | 1.2 | |
| | 2,302,119 | | | | Merck & Co, Inc | | | 115,221 | | | | 0.7 | |
| | 5,098,843 | | | | Pfizer, Inc | | | 156,177 | | | | 1.0 | |
| | | | | | Other | | | 529,607 | | | | 3.4 | |
| | | | | | | | | 1,280,237 | | | | 8.1 | |
| REAL ESTATE | | | 496,103 | | | | 3.1 | |
| RETAILING | | | | | | | | |
| | 280,300 | | * | | Amazon.com, Inc | | | | 111,781 | | | | 0.7 | |
| | 1,113,653 | | | | Home Depot, Inc | | | 91,698 | | | | 0.6 | |
| | | | | | Other | | | 522,395 | | | | 3.3 | |
| | | | | | | | | 725,874 | | | | 4.6 | |
| See notes to financial statements | College Retirement Equities Fund ■ 2013 Annual Report | 47 |
| Summary portfolio of investments | continued |
CREF Equity Index Account ■ December 31, 2013
| | | | | | | Value | | | % of net |
| Shares | | | | Company | | (000) | | | assets |
| SEMICONDUCTORS & SEMICONDUCTOR EQUIPMENT | | | | | | | | |
| | 3,789,805 | | | | Intel Corp | | $ | 98,383 | | | | 0.6 | % |
| | | | | | Other | | | 241,242 | | | | 1.5 | |
| | | | | | | | | 339,625 | | | | 2.1 | |
| SOFTWARE & SERVICES | | | | | | | | |
| | 1,298,618 | | * | | Facebook, Inc | | | 70,982 | | | | 0.4 | |
| | 205,596 | | * | | Google, Inc (Class A) | | | 230,414 | | | | 1.4 | |
| | 793,653 | | | | International Business Machines Corp | | | 148,866 | | | | 0.9 | |
| | 89,025 | | | | Mastercard, Inc (Class A) | | | 74,377 | | | | 0.5 | |
| | 6,366,772 | | | | Microsoft Corp | | | 238,308 | | | | 1.5 | |
| | 2,706,734 | | | | Oracle Corp | | | 103,560 | | | | 0.7 | |
| | 398,295 | | | | Visa, Inc (Class A) | | | 88,692 | | | | 0.6 | |
| | | | | | Other | | | 649,957 | | | | 4.1 | |
| | | | | | | | | 1,605,156 | | | | 10.1 | |
| TECHNOLOGY HARDWARE & EQUIPMENT | | | | | | | | |
| | 715,623 | | | | Apple, Inc | | | 401,543 | | | | 2.5 | |
| | 4,074,383 | | | | Cisco Systems, Inc | | | 91,470 | | | | 0.6 | |
| | 1,317,314 | | | | Qualcomm, Inc | | | 97,811 | | | | 0.6 | |
| | | | | | Other | | | 323,964 | | | | 2.1 | |
| | | | | | | | | 914,788 | | | | 5.8 | |
| TELECOMMUNICATION SERVICES | | | | | | | | |
| | 4,101,542 | | | | AT&T, Inc | | | 144,210 | | | | 0.9 | |
| | 2,181,158 | | | | Verizon Communications, Inc | | | 107,182 | | | | 0.7 | |
| | | | | | Other | | | 80,818 | | | | 0.5 | |
| | | | | | | | | 332,210 | | | | 2.1 | |
| TRANSPORTATION | | | | | | | | |
| | 355,735 | | | | Union Pacific Corp | | | 59,763 | | | | 0.4 | |
| | | | | | Other | | | 266,867 | | | | 1.7 | |
| | | | | | | | | 326,630 | | | | 2.1 | |
| UTILITIES | | | 461,898 | | | | 2.9 | |
| | | | | | TOTAL COMMON STOCKS | (Cost $9,162,211) | | | 15,802,646 | | | | 99.6 | |
| | | | | | | | | |
| RIGHTS / WARRANTS | | | | | | | | |
| ENERGY | | | 16 | | | | 0.0 | |
| PHARMACEUTICALS, BIOTECHNOLOGY & LIFE SCIENCES | | | 4 | | | | 0.0 | |
| REAL ESTATE | | | 9 | | | | 0.0 | |
| | | | | | TOTAL RIGHTS / WARRANTS | (Cost $10) | | | 29 | | | | 0.0 | |
| 48 | 2013 Annual Report ■ College Retirement Equities Fund | See notes to financial statements |
| Summary portfolio of investments | concluded |
CREF Equity Index Account ■ December 31, 2013
| | | | | | | Value | | | % of net |
| | Principal | | | | Issuer | | | (000) | | | assets |
| SHORT-TERM INVESTMENTS | | | | | | | | |
| GOVERNMENT AGENCY DEBT | | $ | 11,529 | | | | 0.1 | % |
| TREASURY DEBT | | | 22,798 | | | | 0.1 | |
| | | | | | | | | | | | | | | | |
| Shares | | | | Company | | | | | | | | | | |
| INVESTMENTS IN REGISTERED INVESTMENT COMPANIES | | | | | | | | |
| | 536,110,401 | | a,c | | TIAA-CREF Short Term Lending Portfolio of the State Street Navigator Securities Lending Trust | | | 536,110 | | | | 3.4 | |
| | | | | | | | | 536,110 | | | | 3.4 | |
| | | | | | TOTAL SHORT-TERM INVESTMENTS | (Cost $570,436) | | | 570,437 | | | | 3.6 | |
| | | | | | | | | | | | | | |
| | | | | | TOTAL PORTFOLIO | (Cost $9,732,657) | | | 16,373,112 | | | | 103.2 | |
| | | | | | OTHER ASSETS & LIABILITIES, NET | | | | (515,101 | ) | | | (3.2 | ) |
| | | | | | | NET ASSETS | | | $ | 15,858,011 | | | | 100.0 | % |
| * | Non-income producing. |
| a | Affiliated holding. |
| c | Investments made with cash collateral received from securities on loan. |
| d | All or a portion of these securities have been segregated by the custodian to cover margin or other requirements on open futures transactions. |
“Other” securities represent the aggregate value, by category, of securities that are not among the 50 largest holdings and, in total for any issuer, represent 1% or less of net assets.
The aggregate value of securities on loan is $523,303,000.
Cost amounts are in thousands.
For ease of presentation, a number of classification categories have been grouped together in the Summary Portfolio of Investments. Note that the Account uses more specific categories in following its investment limitations on investment concentrations.
| See notes to financial statements | College Retirement Equities Fund ■ 2013 Annual Report | 49 |
Summary portfolio of investments
CREF Bond Market Account ■ December 31, 2013
| | | | | | | | | Value | | | % of net |
| Principal | | | | Issuer | | | (000) | | | assets |
| BANK LOAN OBLIGATIONS | | | | | | | | | |
| CAPITAL GOODS | | | $ | 8,155 | | | | 0.1 | % |
| FOOD, BEVERAGE & TOBACCO | | | | 10,803 | | | | 0.1 | |
| MEDIA | | | | 1,843 | | | | 0.0 | |
| UTILITIES | | | | 199 | | | | 0.0 | |
| | | | | | TOTAL BANK LOAN OBLIGATIONS | (Cost $20,879) | | | 21,000 | | | | 0.2 | |
| | | | | | | | | | | | | | | |
| BONDS | | | | | | | | | |
| | | | | | | | | | |
| CORPORATE BONDS | | | | | | | | | |
| AUTOMOBILES & COMPONENTS | | | | 13,975 | | | | 0.1 | |
| BANKS | | | | | | | | | |
| $ | 70,000,000 | | g | | Toronto-Dominion Bank | 1.500%, 03/13/17 | | | 70,749 | | | | 0.5 | |
| | | | | | Other | | | | 664,852 | | | | 5.1 | |
| | | | | | | | | | 735,601 | | | | 5.6 | |
| CAPITAL GOODS | | | | 88,894 | | | | 0.7 | |
| COMMERCIAL & PROFESSIONAL SERVICES | | | | 55,111 | | | | 0.4 | |
| CONSUMER DURABLES & APPAREL | | | | 40,321 | | | | 0.3 | |
| CONSUMER SERVICES | | | | 110,389 | | | | 0.8 | |
| DIVERSIFIED FINANCIALS | | | | | | | | | |
| | 54,367,424 | | | | Tagua Leasing LLC | 1.900%, 07/12/24 | | | 52,427 | | | | 0.4 | |
| | | | | | Other | | | | 662,210 | | | | 5.1 | |
| | | | | | | | | | 714,637 | | | | 5.5 | |
| ENERGY | | | | 376,473 | | | | 2.9 | |
| FOOD & STAPLES RETAILING | | | | 26,744 | | | | 0.2 | |
| FOOD, BEVERAGE & TOBACCO | | | | 124,226 | | | | 1.0 | |
| HEALTH CARE EQUIPMENT & SERVICES | | | | 97,799 | | | | 0.8 | |
| HOUSEHOLD & PERSONAL PRODUCTS | | | | 14,045 | | | | 0.1 | |
| INSURANCE | | | | 239,000 | | | | 1.8 | |
| MATERIALS | | | | 207,358 | | | | 1.6 | |
| MEDIA | | | | 206,335 | | | | 1.6 | |
| PHARMACEUTICALS, BIOTECHNOLOGY & LIFE SCIENCES | | | | 32,656 | | | | 0.3 | |
| REAL ESTATE | | | | 117,051 | | | | 0.9 | |
| RETAILING | | | | 83,102 | | | | 0.6 | |
| SOFTWARE & SERVICES | | | | 25,962 | | | | 0.2 | |
| TECHNOLOGY HARDWARE & EQUIPMENT | | | | 112,237 | | | | 0.9 | |
| TELECOMMUNICATION SERVICES | | | | 271,509 | | | | 2.1 | |
| 50 | 2013 Annual Report ■ College Retirement Equities Fund | See notes to financial statements |
| Summary portfolio of investments | continued |
CREF Bond Market Account ■ December 31, 2013
| | | | | | | | | Value | | | % of net |
| Principal | | | | Issuer | | | | (000) | | | assets |
| TRANSPORTATION | | $ | 50,231 | | | | 0.4 | % |
| UTILITIES | | | 424,051 | | | | 3.2 | |
| | | | | | TOTAL CORPORATE BONDS | (Cost $4,142,357) | | | 4,167,707 | | | | 32.0 | |
| | | | | | | | | | | | | | | | |
| GOVERNMENT BONDS | | | | | | | | |
| AGENCY SECURITIES | | | | | | | | |
| $ | 180,300,000 | | | | Private Export Funding Corp (PEFCO) | 1.375%-5.450%, 10/15/14-11/15/22 | | | 184,156 | | | | 1.4 | |
| | 62,753,000 | | | | Tunisia Government AID Bonds | | 1.686%, 07/16/19 | | | 60,648 | | | | 0.4 | |
| | | | | | Other | | | | | 150,727 | | | | 1.1 | |
| | | | | | | | | | | 395,531 | | | | 2.9 | |
| FOREIGN GOVERNMENT BONDS | | | | | | | | |
| | 41,500,000 | | | | Spain Government Bond | | 3.750%, 10/31/18 | | | 59,705 | | | | 0.5 | |
| | | | | | Other | | | | | 775,378 | | | | 5.9 | |
| | | | | | | | | | | 835,083 | | | | 6.4 | |
| MORTGAGE BACKED | | | | | | | | |
| | 100,000,000 | | h | | Federal Home Loan Mortgage Corp Gold (FGLMC) | | 4.500%, 01/15/44 | | | 105,809 | | | | 0.8 | |
| | 64,000,000 | | h | | FGLMC | | 3.500%, 01/15/44 | | | 63,500 | | | | 0.5 | |
| | 101,000,000 | | h | | FGLMC | | 4.000%, 01/15/44 | | | 103,722 | | | | 0.8 | |
| | 137,317,468 | | | | FGLMC | 4.000%-8.000%, 12/01/16-12/01/40 | | | 149,256 | | | | 1.1 | |
| | 81,000,000 | | h | | Federal National Mortgage Association (FNMA) | | 3.000%, 01/25/29 | | | 82,661 | | | | 0.6 | |
| | 50,000,000 | | | | FNMA | | 3.000%, 03/25/31 | | | 51,719 | | | | 0.4 | |
| | 50,000,000 | | | | FNMA | | 4.000%, 06/25/39 | | | 53,250 | | | | 0.4 | |
| | 146,000,000 | | h | | FNMA | | 4.000%, 01/25/44 | | | 150,289 | | | | 1.1 | |
| | 98,000,000 | | h | | FNMA | | 4.500%, 01/25/44 | | | 103,838 | | | | 0.8 | |
| | 291,000,000 | | h | | FNMA | | 5.000%, 01/25/44 | | | 316,031 | | | | 2.4 | |
| | 116,000,000 | | h | | FNMA | | 5.500%, 01/25/44 | | | 127,595 | | | | 1.0 | |
| | 266,000,000 | | h | | FNMA | | 4.000%, 02/25/44 | | | 272,982 | | | | 2.1 | |
| | 365,000,000 | | h | | FNMA | | 3.500%, 02/25/44 | | | 361,493 | | | | 2.8 | |
| | 54,698,719 | | | | FNMA | | 3.000%, 04/01/43 | | | 51,989 | | | | 0.4 | |
| | 514,818,611 | | | | FNMA | 2.020%-9.000%, 02/01/14-01/25/44 | | | 540,327 | | | | 4.1 | |
| | 95,000,000 | | h | | Government National Mortgage Association (GNMA) | | 4.500%, 01/15/44 | | | 101,361 | | | | 0.8 | |
| | 78,000,000 | | h | | GNMA | | 4.000%, 01/15/44 | | | 81,050 | | | | 0.6 | |
| | 198,000,000 | | h | | GNMA | | 3.500%, 01/15/44 | | | 199,555 | | | | 1.5 | |
| | 74,000,000 | | h | | GNMA | | 3.000%, 01/15/44 | | | 71,462 | | | | 0.5 | |
| | 67,000,000 | | h | | GNMA | | 3.500%, 01/20/44 | | | 67,589 | | | | 0.5 | |
| | 170,397,596 | | | | GNMA | 2.176%-9.500%, 06/15/16-01/20/44 | | | 185,556 | | | | 1.4 | |
| | | | | | Other | | | | | 64,334 | | | | 0.5 | |
| | | | | | | | | | | 3,305,368 | | | | 25.1 | |
| MUNICIPAL BONDS | | | | | | | | |
| | 204,685,000 | | | | State of Illinois | 0.750%-5.463%, 03/01/15-04/01/28 | | | 196,445 | | | | 1.5 | |
| | 60,000,000 | | | | University of California | | 1.796%, 07/01/19 | | | 57,670 | | | | 0.5 | |
| | | | | | Other | | | | | 302,269 | | | | 2.3 | |
| | | | | | | | | | | 556,384 | | | | 4.3 | |
| See notes to financial statements | College Retirement Equities Fund ■ 2013 Annual Report | 51 |
| Summary portfolio of investments | continued |
CREF Bond Market Account ■ December 31, 2013
| | | | | | | | | Value | | | % of net |
| Principal | | | | Issuer | | | | (000) | | | assets |
| U.S. TREASURY SECURITIES | | | | | | | | | |
| $ | 49,175,000 | | | | United States Treasury Bond | | 5.250%, 02/15/29 | | $ | 59,194 | | | | 0.5 | % |
| | 45,661,000 | | | | United States Treasury Bond | | 5.375%, 02/15/31 | | | 55,956 | | | | 0.4 | |
| | 150,570,000 | | | | United States Treasury Bond | | 3.625%, 08/15/43 | | | 142,195 | | | | 1.1 | |
| | 72,796,000 | | | | United States Treasury Note | | 0.250%, 05/31/15 | | | 72,830 | | | | 0.6 | |
| | 60,000,000 | | | | United States Treasury Note | | 0.250%, 03/31/14 | | | 60,023 | | | | 0.5 | |
| | 175,415,000 | | | | United States Treasury Note | | 0.250%, 01/31/15 | | | 175,559 | | | | 1.3 | |
| | 112,305,000 | | | | United States Treasury Note | | 0.250%, 02/28/15 | | | 112,375 | | | | 0.9 | |
| | 141,110,000 | | | | United States Treasury Note | | 0.250%, 08/15/15 | | | 141,055 | | | | 1.1 | |
| | 59,005,000 | | | | United States Treasury Note | | 0.250%, 09/15/15 | | | 58,957 | | | | 0.4 | |
| | 80,466,900 | | | | United States Treasury Note | | 1.375%, 09/30/18 | | | 79,486 | | | | 0.6 | |
| | 189,872,000 | | | | United States Treasury Note | | 8.000%, 11/15/21 | | | 263,744 | | | | 2.0 | |
| | 110,195,000 | | | | United States Treasury Note | | 2.750%, 11/15/23 | | | 107,802 | | | | 0.8 | |
| | 388,876,100 | | | | United States Treasury Note | 0.125%-3.750%, 02/28/14-11/15/43 | | | 388,235 | | | | 3.0 | |
| | | | | | Other | | | | | 66,747 | | | | 0.5 | |
| | | | | | | | | | | 1,784,158 | | | | 13.7 | |
| | | | | | TOTAL GOVERNMENT BONDS | (Cost $6,871,939) | | | 6,876,524 | | | | 52.4 | |
| | | | | | | | | | | | | | | | |
| STRUCTURED ASSETS | | | | | | | | | |
| ASSET BACKED | | | | | | | | | |
| | 52,000,000 | | | | Ally Auto Receivables Trust | | | | | | | | | | |
| | | | | | Series - 2013 2 (Class A2A) | | 0.540%, 07/15/16 | | | 52,002 | | | | 0.4 | |
| | 73,405,000 | | | | Discover Card Execution Note Trust | | | | | | | | | | |
| | | | | | Series - 2012 A1 (Class A1) | | 0.810%, 08/15/17 | | | 73,662 | | | | 0.6 | |
| | 134,080,506 | | g | | Dominos Pizza Master Issuer LLC | | | | | | | | | | |
| | | | | | Series - 2012 1A (Class A2) | | 5.216%, 01/25/42 | | | 142,117 | | | | 1.1 | |
| | 69,108,290 | | | | Hyundai Auto Receivables Trust | | | | | | | | | | |
| | | | | | Series - 2012 B (Class A3) | 0.620%, 09/15/16 | | | 69,203 | | | | 0.5 | |
| | | | | | Other | | | | | 888,063 | | | | 6.8 | |
| | | | | | | | | | | 1,225,047 | | | | 9.4 | |
| OTHER MORTGAGE BACKED | | | | | | | | | |
| | 59,550,833 | | | | JP Morgan Chase Commercial Mortgage Securities Trust | | | | | | | | | | |
| | | | | | Series - 2006 LDP9 (Class A1A) | 5.257%, 05/15/47 | | | 63,569 | | | | 0.5 | |
| | | | | | Other | | | | | 428,957 | | | | 3.3 | |
| | | | | | | | | | | 492,526 | | | | 3.8 | |
| | | | | | TOTAL STRUCTURED ASSETS | (Cost $1,720,853) | | | 1,717,573 | | | | 13.2 | |
| | | | | | TOTAL BONDS | (Cost $12,735,149) | | | 12,761,804 | | | | 97.6 | |
| | | | | | | | | | | | | | | | |
| | Shares | | | | Company | | | | | | | | | | | |
| PREFERRED STOCKS | | | | | | | | | |
| BANKS | | | | | | | 17,583 | | | | 0.1 | |
| | | | | | TOTAL PREFERRED STOCKS | (Cost $49,941) | | | 17,583 | | | | 0.1 | |
| 52 | 2013 Annual Report ■ College Retirement Equities Fund | See notes to financial statements |
| Summary portfolio of investments | concluded |
CREF Bond Market Account ■ December 31, 2013
| | | | | | | | | Value | | | % of net |
| Principal | | | | Issuer | | | | (000) | | | assets |
| SHORT-TERM INVESTMENTS | | | | | | | | | |
| GOVERNMENT AGENCY DEBT | | | $ | 126,490 | | | | 1.0 | % |
| TREASURY DEBT | | | | | | | | | |
| $ | 66,000,000 | | w | | United States Treasury Bill | 0.071%, 02/13/14 | | | 65,994 | | | | 0.5 | |
| | 58,800,000 | | w | | United States Treasury Bill | 0.055%-0.081%, 03/06/14 | | | 58,795 | | | | 0.5 | |
| | 71,600,000 | | w | | United States Treasury Bill | 0.053%-0.080%, 03/13/14 | | | 71,594 | | | | 0.5 | |
| | 200,000,000 | | w | | United States Treasury Bill | 0.105%, 04/03/14 | | | 199,965 | | | | 1.5 | |
| | 212,000,000 | | w | | United States Treasury Bill | 0.060%-0.067%, 04/17/14 | | | 211,977 | | | | 1.6 | |
| | 75,400,000 | | w | | United States Treasury Bill | 0.065%-0.085%, 04/24/14 | | | 75,386 | | | | 0.6 | |
| | 111,000,000 | | w | | United States Treasury Bill | 0.070%-0.107%, 05/01/14 | | | 110,981 | | | | 0.8 | |
| | 247,000,000 | | w | | United States Treasury Bill | 0.095%-0.096%, 06/26/14 | | | 246,901 | | | | 1.9 | |
| | 635,200,000 | | w | | United States Treasury Bill | 0.063%-0.120%, 07/24/14 | | | 634,922 | | | | 4.9 | |
| | 653,000,000 | | w | | United States Treasury Bill | 0.075%-0.135%, 08/21/14 | | | 652,707 | | | | 5.0 | |
| | | | | | Other | | | | | 144,962 | | | | 1.1 | |
| | | | | | | | | | | 2,474,184 | | | | 18.9 | |
| | | | | | TOTAL SHORT-TERM INVESTMENTS | (Cost $2,600,279) | | | 2,600,674 | | | | 19.9 | |
| | | | | | | | | | | | | | | |
| | | | | | TOTAL PORTFOLIO | (Cost $15,406,248) | | | 15,401,061 | | | | 117.8 | |
| | | | | | OTHER ASSETS & LIABILITIES, NET | | | | (2,325,644 | ) | | | (17.8 | ) |
| | | | | | NET ASSETS | | | $ | 13,075,417 | | | | 100.0 | % |
| g | Security is exempt from registration under Rule 144(A) of the Securities Act of 1933. Such securities are deemed liquid and may be resold in transactions exempt from registration to qualified institutional buyers. At 12/31/13, the aggregate value of these securities, including those in “Other,” was $1,777,372,000, or 13.6% of net assets. |
| h | All or a portion of these securities were purchased on a delayed delivery basis. |
| w | All or a portion of these securities have been segregated by the custodian to cover collateral requirements on mortgage dollar rolls. |
“Other” securities represent the aggregate value, by category, of securities that are not among the 50 largest holdings and, in total for any issuer, represent 1% or less of net assets.
Cost amounts are in thousands.
For ease of presentation, a number of classification categories have been grouped together in the Summary Portfolio of Investments. Note that the Account uses more specific categories in following its investment limitations on investment concentrations.
| See notes to financial statements | College Retirement Equities Fund ■ 2013 Annual Report | 53 |
Portfolio of investments
CREF Inflation-Linked Bond Account ■ December 31, 2013
| Principal | | | | Issuer | | | | Value
(000) | | | % of net
assets |
| GOVERNMENT BONDS | | | | | | | | | |
| U.S. TREASURY SECURITIES | | | | | | | | | |
| $ | 66,438,651 | | k | | United States Treasury Inflation Indexed Bonds | | 1.625%, 01/15/15 | | $ | 68,442 | | | | 0.9 | % |
| | 245,516,006 | | k | | United States Treasury Inflation Indexed Bonds | | 0.500%, 04/15/15 | | | 250,906 | | | | 3.3 | |
| | 196,449,244 | | k | | United States Treasury Inflation Indexed Bonds | | 1.875%, 07/15/15 | | | 207,054 | | | | 2.7 | |
| | 209,998,176 | | k | | United States Treasury Inflation Indexed Bonds | | 2.000%, 01/15/16 | | | 223,796 | | | | 2.9 | |
| | 408,869,160 | | k | | United States Treasury Inflation Indexed Bonds | | 0.125%, 04/15/16 | | | 419,826 | | | | 5.5 | |
| | 215,781,451 | | k | | United States Treasury Inflation Indexed Bonds | | 2.500%, 07/15/16 | | | 236,753 | | | | 3.1 | |
| | 173,738,576 | | k | | United States Treasury Inflation Indexed Bonds | | 2.375%, 01/15/17 | | | 191,194 | | | | 2.5 | |
| | 470,893,902 | | k | | United States Treasury Inflation Indexed Bonds | | 0.125%, 04/15/17 | | | 483,990 | | | | 6.3 | |
| | 142,783,298 | | k | | United States Treasury Inflation Indexed Bonds | | 2.625%, 07/15/17 | | | 160,609 | | | | 2.1 | |
| | 165,059,465 | | k | | United States Treasury Inflation Indexed Bonds | | 1.625%, 01/15/18 | | | 179,386 | | | | 2.4 | |
| | 188,441,465 | | k | | United States Treasury Inflation Indexed Bonds | | 0.125%, 04/15/18 | | | 192,196 | | | | 2.5 | |
| | 146,872,428 | | k | | United States Treasury Inflation Indexed Bonds | | 1.375%, 07/15/18 | | | 159,184 | | | | 2.1 | |
| | 144,142,775 | | k | | United States Treasury Inflation Indexed Bonds | | 2.125%, 01/15/19 | | | 160,967 | | | | 2.1 | |
| | 181,585,740 | | k | | United States Treasury Inflation Indexed Bonds | | 1.875%, 07/15/19 | | | 201,773 | | | | 2.6 | |
| | 220,662,387 | | k | | United States Treasury Inflation Indexed Bonds | | 1.375%, 01/15/20 | | | 236,953 | | | | 3.1 | |
| | 285,555,397 | | k | | United States Treasury Inflation Indexed Bonds | | 1.250%, 07/15/20 | | | 305,500 | | | | 4.0 | |
| | 355,486,697 | | k | | United States Treasury Inflation Indexed Bonds | | 1.125%, 01/15/21 | | | 373,622 | | | | 4.9 | |
| | 394,623,040 | | k | | United States Treasury Inflation Indexed Bonds | | 0.625%, 07/15/21 | | | 400,573 | | | | 5.2 | |
| | 336,395,061 | | k | | United States Treasury Inflation Indexed Bonds | | 0.125%, 01/15/22 | | | 323,307 | | | | 4.2 | |
| | 393,064,290 | | k | | United States Treasury Inflation Indexed Bonds | | 0.125%, 07/15/22 | | | 376,513 | | | | 4.9 | |
| | 215,532,570 | | k | | United States Treasury Inflation Indexed Bonds | | 0.125%, 01/15/23 | | | 203,560 | | | | 2.7 | |
| | 51,185,640 | | k | | United States Treasury Inflation Indexed Bonds | | 0.375%, 07/15/23 | | | 49,366 | | | | 0.7 | |
| | 266,728,666 | | k | | United States Treasury Inflation Indexed Bonds | | 2.375%, 01/15/25 | | | 306,592 | | | | 4.0 | |
| | 209,851,077 | | k | | United States Treasury Inflation Indexed Bonds | | 2.000%, 01/15/26 | | | 232,312 | | | | 3.0 | |
| | 163,536,428 | | k | | United States Treasury Inflation Indexed Bonds | | 2.375%, 01/15/27 | | | 188,374 | | | | 2.5 | |
| | 194,994,261 | | k | | United States Treasury Inflation Indexed Bonds | | 1.750%, 01/15/28 | | | 208,766 | | | | 2.7 | |
| | 170,437,542 | | k | | United States Treasury Inflation Indexed Bonds | | 3.625%, 04/15/28 | | | 225,457 | | | | 3.0 | |
| | 177,214,023 | | k | | United States Treasury Inflation Indexed Bonds | | 2.500%, 01/15/29 | | | 208,254 | | | | 2.7 | |
| | 166,357,959 | | k | | United States Treasury Inflation Indexed Bonds | | 3.875%, 04/15/29 | | | 227,988 | | | | 3.0 | |
| | 60,871,684 | | k | | United States Treasury Inflation Indexed Bonds | | 3.375%, 04/15/32 | | | 80,983 | | | | 1.1 | |
| | 84,990,763 | | k | | United States Treasury Inflation Indexed Bonds | | 2.125%, 02/15/40 | | | 95,495 | | | | 1.3 | |
| | 117,747,120 | | k | | United States Treasury Inflation Indexed Bonds | | 2.125%, 02/15/41 | | | 132,300 | | | | 1.7 | |
| | 234,950,918 | | k | | United States Treasury Inflation Indexed Bonds | | 0.750%, 02/15/42 | | | 188,879 | | | | 2.5 | |
| | 115,812,600 | | k | | United States Treasury Inflation Indexed Bonds | | 0.625%, 02/15/43 | | | 89,049 | | | | 1.2 | |
| | | | | | | | | | | 7,589,919 | | | | 99.4 | |
| | | | | | TOTAL GOVERNMENT BONDS | (Cost $7,318,881) | | | 7,589,919 | | | | 99.4 | |
| | | | | | | | | | | | | | | |
| | | | | | TOTAL PORTFOLIO | (Cost $7,318,881) | | | 7,589,919 | | | | 99.4 | |
| | | | | | OTHER ASSETS & LIABILITIES, NET | | | | 48,191 | | | | 0.6 | |
| | | | | | NET ASSETS | | | $ | 7,638,110 | | | | 100.0 | % |
| k | Principal amount for interest accrual purposes is periodically adjusted based on changes in the Consumer Price Index. |
Cost amounts are in thousands.
| 54 | 2013 Annual Report ■ College Retirement Equities Fund | See notes to financial statements |
Summary portfolio of investments
CREF Social Choice Account ■ December 31, 2013
| | | | | | | Value | | | % of net |
| | Principal | | | Issuer | | (000) | | | assets |
| BANK LOAN OBLIGATIONS | | | | | | | | |
| MEDIA | | $ | 9,765 | | | | 0.1 | % |
| | | | | TOTAL BANK LOAN OBLIGATIONS | (Cost $9,728) | | | 9,765 | | | | 0.1 | |
| | | | | | | | | |
| BONDS | | | | | | | | |
| | | | | | | | | |
| CORPORATE BONDS | | | | | | | | |
| AUTOMOBILES & COMPONENTS | | | 19,706 | | | | 0.2 | |
| BANKS | | | 522,994 | | | | 3.9 | |
| CAPITAL GOODS | | | 77,632 | | | | 0.6 | |
| COMMERCIAL & PROFESSIONAL SERVICES | | | 7,812 | | | | 0.1 | |
| CONSUMER DURABLES & APPAREL | | | 6,480 | | | | 0.0 | |
| CONSUMER SERVICES | | | 26,842 | | | | 0.2 | |
| DIVERSIFIED FINANCIALS | | | 248,491 | | | | 1.9 | |
| ENERGY | | | 122,778 | | | | 0.9 | |
| FOOD & STAPLES RETAILING | | | 29,208 | | | | 0.2 | |
| FOOD, BEVERAGE & TOBACCO | | | 13,169 | | | | 0.1 | |
| HEALTH CARE EQUIPMENT & SERVICES | | | 67,756 | | | | 0.5 | |
| HOUSEHOLD & PERSONAL PRODUCTS | | | 7,900 | | | | 0.1 | |
| INSURANCE | | | 59,422 | | | | 0.5 | |
| MATERIALS | | | 85,222 | | | | 0.6 | |
| MEDIA | | | 18,850 | | | | 0.1 | |
| PHARMACEUTICALS, BIOTECHNOLOGY & LIFE SCIENCES | | | 111,190 | | | | 0.8 | |
| REAL ESTATE | | | 80,568 | | | | 0.6 | |
| RETAILING | | | 12,525 | | | | 0.1 | |
| SEMICONDUCTORS & SEMICONDUCTOR EQUIPMENT | | | 13,136 | | | | 0.1 | |
| SOFTWARE & SERVICES | | | 20,136 | | | | 0.2 | |
| TECHNOLOGY HARDWARE & EQUIPMENT | | | 38,241 | | | | 0.3 | |
| TELECOMMUNICATION SERVICES | | | 32,400 | | | | 0.2 | |
| TRANSPORTATION | | | 55,024 | | | | 0.4 | |
| UTILITIES | | | 178,608 | | | | 1.3 | |
| | | | | TOTAL CORPORATE BONDS | (Cost $1,855,911) | | | 1,856,090 | | | | 13.9 | |
| | | | | | | | | | | | | | |
| GOVERNMENT BONDS | | | | | | | | |
| AGENCY SECURITIES | | | | | | | | |
| $ | 187,517,944 | | | Overseas Private Investment Corp (OPIC) | 0.000%-5.142%, 07/12/14-12/20/32 | | | 186,832 | | | | 1.3 | |
| | | | | Other | | | 366,485 | | | | 2.7 | |
| | | | | | | | | | 553,317 | | | | 4.0 | |
| See notes to financial statements | College Retirement Equities Fund ■ 2013 Annual Report | 55 |
| Summary portfolio of investments | continued |
CREF Social Choice Account ■ December 31, 2013
| | | | | | | | | Value | | | % of net |
| | Principal | | | | Issuer | | | (000) | | | assets |
| FOREIGN GOVERNMENT BONDS | | | | | | | | |
| $ | 49,000,000 | | | | International Bank for Reconstruction & Development | 0.375%, 08/24/15 | | $ | 49,000 | | | | 0.4 | % |
| | 55,210,000 | | | | International Finance Corp | 2.250%, 04/28/14 | | | 55,561 | | | | 0.4 | |
| | | | | | Other | | | 480,979 | | | | 3.7 | |
| | | | | | | | | 585,540 | | | | 4.5 | |
| MORTGAGE BACKED | | | | | | | | |
| | 61,000,000 | | h | | Federal National Mortgage Association (FNMA) | 4.000%, 01/25/44 | | | 62,792 | | | | 0.5 | |
| | 58,000,000 | | h | | FNMA | 4.500%, 01/25/44 | | | 61,455 | | | | 0.5 | |
| | 65,000,000 | | h | | FNMA | 5.000%, 01/25/44 | | | 70,591 | | | | 0.5 | |
| | 109,000,000 | | h | | FNMA | 4.000%, 02/25/44 | | | 111,861 | | | | 0.8 | |
| | 161,000,000 | | h | | FNMA | 3.500%, 02/25/44 | | | 159,453 | | | | 1.2 | |
| | 254,361,477 | | | | FNMA | 2.020%-8.500%, 05/01/14-01/25/44 | | | 262,227 | | | | 2.0 | |
| | 70,000,000 | | h | | Government National Mortgage Association (GNMA) | 3.500%, 01/15/44 | | | 70,550 | | | | 0.5 | |
| | 56,000,000 | | h | | GNMA | 3.000%, 01/15/44 | | | 54,079 | | | | 0.4 | |
| | 142,066,688 | | | | GNMA | 2.300%-9.000%, 12/15/17-01/20/44 | | | 148,854 | | | | 1.1 | |
| | | | | | Other | | | 95,929 | | | | 0.7 | |
| | | | | | | | | 1,097,791 | | | | 8.2 | |
| MUNICIPAL BONDS | | | 344,918 | | | | 2.6 | |
| U.S. TREASURY SECURITIES | | | | | | | | |
| | 131,045,000 | | | | United States Treasury Bond | 2.875%, 05/15/43 | | | 106,208 | | | | 0.8 | |
| | 62,390,000 | | | | United States Treasury Bond | 3.625%, 08/15/43 | | | 58,920 | | | | 0.4 | |
| | 49,910,000 | | | | United States Treasury Note | 2.750%, 11/15/23 | | | 48,826 | | | | 0.4 | |
| | 180,538,400 | | | | United States Treasury Note | 0.250%-2.500%, 05/31/14-11/15/22 | | | 179,356 | | | | 1.4 | |
| | | | | | Other | | | 5,137 | | | | 0.0 | |
| | | | | | | | | 398,447 | | | | 3.0 | |
| | | | | | TOTAL GOVERNMENT BONDS | (Cost $2,984,883) | | | 2,980,013 | | | | 22.3 | |
| | | | | | | | | | | | | | |
| STRUCTURED ASSETS | | | | | | | | |
| ASSET BACKED | | | 84,961 | | | | 0.6 | |
| OTHER MORTGAGE BACKED | | | 106,540 | | | | 0.8 | |
| | | | | | TOTAL STRUCTURED ASSETS | (Cost $189,314) | | | 191,501 | | | | 1.4 | |
| | | | | | TOTAL BONDS | (Cost $5,030,108) | | | 5,027,604 | | | | 37.6 | |
| | | | | | | | | | | | | | | | | |
| | Shares | | | | Company | | | | | | | | | | |
| COMMON STOCKS | | | | | | | | |
| AUTOMOBILES & COMPONENTS | | | 193,351 | | | | 1.5 | |
| BANKS | | | | | | | | |
| | 1,292,980 | | | | US Bancorp | | | 52,237 | | | | 0.4 | |
| | | | | | Other | | | 426,114 | | | | 3.2 | |
| | | | | | | | | 478,351 | | | | 3.6 | |
| 56 | 2013 Annual Report ■ College Retirement Equities Fund | See notes to financial statements |
| Summary portfolio of investments | continued |
CREF Social Choice Account ■ December 31, 2013
| | | | | | | | | Value | | | % of net |
| | Shares | | | | Company | | | (000) | | | assets |
| CAPITAL GOODS | | | | | | | | |
| | 440,679 | | | | 3M Co | | $ | 61,805 | | | | 0.5 | % |
| | 594,737 | | | | Danaher Corp | | | 45,913 | | | | 0.3 | |
| | 657,321 | | | | Emerson Electric Co | | | 46,131 | | | | 0.4 | |
| | | | | | Other | | | 509,219 | | | | 3.8 | |
| | | | | | | | | 663,068 | | | | 5.0 | |
| COMMERCIAL & PROFESSIONAL SERVICES | | | 56,641 | | | | 0.4 | |
| CONSUMER DURABLES & APPAREL | | | 104,258 | | | | 0.8 | |
| CONSUMER SERVICES | | | | | | | | |
| | 558,634 | | | | McDonald’s Corp | | | 54,204 | | | | 0.4 | |
| | 586,295 | | | | Starbucks Corp | | | 45,960 | | | | 0.4 | |
| | | | | | Other | | | 55,683 | | | | 0.4 | |
| | | | | | | | | 155,847 | | | | 1.2 | |
| DIVERSIFIED FINANCIALS | | | | | | | | |
| | 630,747 | | | | American Express Co | | | 57,228 | | | | 0.4 | |
| | 579,810 | | | | Capital One Financial Corp | | | 44,419 | | | | 0.3 | |
| | | | | | Other | | | 422,813 | | | | 3.2 | |
| | | | | | | | | 524,460 | | | | 3.9 | |
| ENERGY | | | 794,465 | | | | 6.0 | |
| FOOD & STAPLES RETAILING | | | 110,298 | | | | 0.8 | |
| FOOD, BEVERAGE & TOBACCO | | | | | | | | |
| | 801,664 | | | | PepsiCo, Inc | | | 66,490 | | | | 0.5 | |
| | | | | | Other | | | 231,540 | | | | 1.7 | |
| | | | | | | | | 298,030 | | | | 2.2 | |
| HEALTH CARE EQUIPMENT & SERVICES | | | | | | | | |
| | 1,196,888 | | | | Abbott Laboratories | | | 45,877 | | | | 0.3 | |
| | 819,631 | | | | Medtronic, Inc | | | 47,038 | | | | 0.4 | |
| | | | | | Other | | | 127,885 | | | | 1.0 | |
| | | | | | | | | 220,800 | | | | 1.7 | |
| HOUSEHOLD & PERSONAL PRODUCTS | | | | | | | | |
| | 707,780 | | | | Colgate-Palmolive Co | | | 46,154 | | | | 0.4 | |
| | 1,202,803 | | | | Procter & Gamble Co | | | 97,920 | | | | 0.7 | |
| | | | | | Other | | | 108,321 | | | | 0.8 | |
| | | | | | | | | 252,395 | | | | 1.9 | |
| INSURANCE | | | | | | | | |
| | 798,759 | | * | | Berkshire Hathaway, Inc (Class B) | | | 94,701 | | | | 0.7 | |
| | | | | | Other | | | 377,800 | | | | 2.8 | |
| | | | | | | | | 472,501 | | | | 3.5 | |
| MATERIALS | | | 472,721 | | | | 3.6 | |
| MEDIA | | | | | | | | |
| | 724,009 | | | | Time Warner, Inc | | | 50,478 | | | | 0.4 | |
| | | | | | Other | | | 186,881 | | | | 1.4 | |
| | | | | | | | | 237,359 | | | | 1.8 | |
| See notes to financial statements | College Retirement Equities Fund ■ 2013 Annual Report | 57 |
| Summary portfolio of investments | continued |
CREF Social Choice Account ■ December 31, 2013
| | | | | | | | | Value | | | % of net |
| | Shares | | | | Company | | | (000) | | | assets |
| PHARMACEUTICALS, BIOTECHNOLOGY & LIFE SCIENCES | | | | | | | | |
| | 177,187 | | * | | Biogen Idec, Inc | | $ | 49,568 | | | | 0.4 | % |
| | 1,067,635 | | | | Bristol-Myers Squibb Co | | | 56,745 | | | | 0.4 | |
| | 875,403 | | * | | Gilead Sciences, Inc | | | 65,786 | | | | 0.5 | |
| | 1,177,080 | | | | Johnson & Johnson | | | 107,809 | | | | 0.8 | |
| | 1,526,938 | | | | Merck & Co, Inc | | | 76,423 | | | | 0.6 | |
| | | | | | Other | | | 284,212 | | | | 2.1 | |
| | | | | | | | | 640,543 | | | | 4.8 | |
| REAL ESTATE | | | 269,645 | | | | 2.0 | |
| RETAILING | | | | | | | | |
| | 941,190 | | | | Lowe’s Companies, Inc | | | 46,636 | | | | 0.4 | |
| | 696,291 | | | | TJX Companies, Inc | | | 44,375 | | | | 0.3 | |
| | | | | | Other | | | 245,872 | | | | 1.8 | |
| | | | | | | | | 336,883 | | | | 2.5 | |
| SEMICONDUCTORS & SEMICONDUCTOR EQUIPMENT | | | | | | | | |
| | 2,727,539 | | | | Intel Corp | | | 70,807 | | | | 0.5 | |
| | | | | | Other | | | 105,005 | | | | 0.8 | |
| | | | | | | | | 175,812 | | | | 1.3 | |
| SOFTWARE & SERVICES | | | | | | | | |
| | 109,496 | | * | | Google, Inc (Class A) | | | 122,713 | | | | 0.9 | |
| | 467,530 | | | | International Business Machines Corp | | | 87,695 | | | | 0.7 | |
| | 1,919,450 | | | | Oracle Corp | | | 73,438 | | | | 0.6 | |
| | | | | | Other | | | 324,735 | | | | 2.4 | |
| | | | | | | | | 608,581 | | | | 4.6 | |
| TECHNOLOGY HARDWARE & EQUIPMENT | | | | | | | | |
| | 2,721,726 | | | | Cisco Systems, Inc | | | 61,103 | | | | 0.4 | |
| | 1,649,254 | | | | Hewlett-Packard Co | | | 46,146 | | | | 0.3 | |
| | 847,188 | | | | Qualcomm, Inc | | | 62,904 | | | | 0.5 | |
| | | | | | Other | | | 141,923 | | | | 1.1 | |
| | | | | | | | | 312,076 | | | | 2.3 | |
| TELECOMMUNICATION SERVICES | | | 176,864 | | | | 1.3 | |
| TRANSPORTATION | | | | | | | | |
| | 510,592 | | | | United Parcel Service, Inc (Class B) | | | 53,653 | | | | 0.4 | |
| | | | | | Other | | | 149,134 | | | | 1.1 | |
| | | | | | | | | 202,787 | | | | 1.5 | |
| UTILITIES | | | 292,934 | | | | 2.2 | |
| | | | | | TOTAL COMMON STOCKS | (Cost $5,190,127) | | | 8,050,670 | | | | 60.4 | |
| | | | | | | | | | | | | | |
| PREFERRED STOCKS | | | | | | | | |
| BANKS | | | 21,849 | | | | 0.2 | |
| | | | | | TOTAL PREFERRED STOCKS | (Cost $38,865) | | | 21,849 | | | | 0.2 | |
| | | | | | | | | | | | | | |
| RIGHTS / WARRANTS | | | | | | | | |
| ENERGY | | | 212 | | | | 0.0 | |
| | | | | | TOTAL RIGHTS / WARRANTS | (Cost $203) | | | 212 | | | | 0.0 | |
| 58 | 2013 Annual Report ■ College Retirement Equities Fund | See notes to financial statements |
| Summary portfolio of investments | concluded |
CREF Social Choice Account ■ December 31, 2013
| | | | | | | Value | | | % of net |
| | Principal | | | | Issuer | | | (000) | | | assets |
| SHORT-TERM INVESTMENTS | | | | | | | | |
| GOVERNMENT AGENCY DEBT | | $ | 77,534 | | | | 0.6 | % |
| TREASURY DEBT | | | | | | | | |
| $ | 76,000,000 | | w | | United States Treasury Bill | 0.056%-0.075%, 02/27/14 | | | 75,993 | | | | 0.6 | |
| | 54,500,000 | | | | United States Treasury Bill | 0.055%-0.081%, 03/06/14 | | | 54,495 | | | | 0.4 | |
| | 136,000,000 | | w | | United States Treasury Bill | 0.065%-0.085%, 04/24/14 | | | 135,975 | | | | 1.0 | |
| | 77,000,000 | | w | | United States Treasury Bill | 0.105%, 05/01/14 | | | 76,987 | | | | 0.6 | |
| | 256,300,000 | | w | | United States Treasury Bill | 0.063%-0.116%, 07/24/14 | | | 256,188 | | | | 1.9 | |
| | 129,000,000 | | w | | United States Treasury Bill | 0.075%-0.135%, 08/21/14 | | | 128,942 | | | | 0.9 | |
| | | | | | Other | | | 190,574 | | | | 1.4 | |
| | | | | | | | | 919,154 | | | | 6.8 | |
| INVESTMENT OF CASH COLLATERAL FOR SECURITIES LOANED | | | | | | | | |
| GOVERNMENT AGENCY DEBT | | | | | | | | |
| | 45,000,000 | | | | Federal Home Loan Bank (FHLB) | 0.035%-0.050%, 01/24/14 | | | 44,999 | | | | 0.3 | |
| | | | | | Other | | | 30,694 | | | | 0.3 | |
| | | | | | | | | | | 75,693 | | | | 0.6 | |
| TREASURY DEBT | | | | | | | | |
| | 54,000,000 | | | | United States Treasury Bill | 0.075%-0.138%, 08/21/14 | | | 53,976 | | | | 0.4 | |
| | | | | | Other | | | 231,202 | | | | 1.7 | |
| | | | | | | | | 285,178 | | | | 2.1 | |
| TOTAL INVESTMENT OF CASH COLLATERAL FOR SECURITIES LOANED | | | | 360,871 | | | | 2.7 | |
| | | | | | TOTAL SHORT-TERM INVESTMENTS | (Cost $1,357,440) | | | 1,357,559 | | | | 10.1 | |
| | | | | | | | | | | | | | |
| | | | | | TOTAL PORTFOLIO | (Cost $11,626,471) | | | 14,467,659 | | | | 108.4 | |
| | | | | | OTHER ASSETS & LIABILITIES, NET | | | | (1,126,699 | ) | | | (8.4 | ) |
| | | | | | NET ASSETS | | | $ | 13,340,960 | | | | 100.0 | % |
| * | Non-income producing. |
| h | All or a portion of these securities were purchased on a delayed delivery basis. |
| w | All or a portion of these securities have been segregated by the custodian to cover collateral requirements on mortgage dollar rolls. |
“Other” securities represent the aggregate value, by category, of securities that are not among the 50 largest holdings and, in total for any issuer, represent 1% or less of net assets.
The aggregate value of securities on loan is $356,841,000.
At 12/31/13, the aggregate value of securities exempt from registration under Rule 144(A) of the Securities Act of 1933 amounted to $432,691,000 or 3.2% of net assets. Such securities are deemed liquid and may be resold in transactions exempt from registration to qualified institutional buyers.
Cost amounts are in thousands.
For ease of presentation, a number of classification categories have been grouped together in the Summary Portfolio of Investments. Note that the Account uses more specific categories in following its investment limitations on investment concentrations.
| See notes to financial statements | College Retirement Equities Fund ■ 2013 Annual Report | 59 |
Summary portfolio of investments
CREF Money Market Account ■ December 31, 2013
| | | | | | | | | | | Value | | | % of net |
| | Principal | | | | Issuer | | | | | (000) | | | assets |
| SHORT-TERM INVESTMENTS | | | | | | | | |
| CERTIFICATE OF DEPOSIT | | | | | | | | |
| $ | 150,000,000 | | | | Banco Del Estado De Chile | | 0.200%-0.215%, 02/11/14-03/07/14 | | $ | 150,000 | | | | 1.3 | % |
| | 70,000,000 | | | | Toronto-Dominion Bank | | 0.150%, 01/06/14 | | | 70,000 | | | | 0.6 | |
| | 75,000,000 | | | | Wells Fargo Bank NA | | 0.160%, 03/03/14 | | | 75,000 | | | | 0.6 | |
| | | | | | Other | | | | | | 425,000 | | | | 3.5 | |
| | | | | | | | | | | | 720,000 | | | | 6.0 | |
| COMMERCIAL PAPER | | | | | | | | |
| | 199,475,000 | | | | American Honda Finance Corp | | 0.090%-0.130%, 01/06/14-03/17/14 | | | 199,443 | | | | 1.7 | |
| | 75,000,000 | | y | | Australia & New Zealand Banking Group Ltd | | 0.170%-0.175%, 03/25/14 | | | 74,970 | | | | 0.6 | |
| | 215,334,000 | | y | | Coca-Cola Co | | 0.060%-0.190%, 01/06/14-04/10/14 | | | 215,299 | | | | 1.8 | |
| | 139,865,000 | | y | | Commonwealth Bank of Australia | | 0.150%-0.215%, 01/02/14-02/28/14 | | | 139,851 | | | | 1.2 | |
| | 130,050,000 | | | | Exxon Mobil Corp | | 0.070%-0.090%, 01/17/14-02/25/14 | | | 130,040 | | | | 1.1 | |
| | 216,892,000 | | y | | Fairway Finance LLC | | 0.140%-0.190%, 01/09/14-03/04/14 | | | 216,857 | | | | 1.8 | |
| | 299,825,000 | | | | General Electric Capital Corp | | 0.100%-0.180%, 01/07/14-03/24/14 | | | 299,777 | | | | 2.5 | |
| | 95,000,000 | | y | | Nestle Capital Corp | | 0.100%-0.105%, 02/13/14 | | | 94,988 | | | | 0.8 | |
| | 160,004,000 | | y | | Old Line Funding LLC | | 0.180%-0.240%, 02/05/14-02/25/14 | | | 159,970 | | | | 1.3 | |
| | 223,100,000 | | y | | Procter & Gamble Co | | 0.090%-0.100%, 01/08/14-03/19/14 | | | 223,068 | | | | 1.9 | |
| | 215,624,000 | | | | Province of Ontario Canada | | 0.060%-0.100%, 01/06/14-03/13/14 | | | 215,600 | | | | 1.8 | |
| | 282,426,000 | | y | | Province of Quebec Canada | | 0.070%-0.105%, 01/03/14-03/03/14 | | | 282,407 | | | | 2.4 | |
| | 76,000,000 | | y | | PSP Capital, Inc | | 0.110%-0.125%, 01/14/14 | | | 75,997 | | | | 0.6 | |
| | 132,050,000 | | y | | PSP Capital, Inc | | 0.120%-0.270%, 01/16/14-07/28/14 | | | 132,020 | | | | 1.1 | |
| | 67,700,000 | | | | Shell International Finance BV | | 4.000%, 03/21/14 | | | 68,254 | | | | 0.6 | |
| | 150,250,000 | | y | | Standard Chartered Bank | | 0.150%-0.260%, 01/29/14-04/01/14 | | | 150,201 | | | | 1.2 | |
| | 195,000,000 | | | | Toyota Motor Credit Corp | | 0.140%-0.180%, 03/05/14-04/17/14 | | | 194,930 | | | | 1.6 | |
| | 211,270,000 | | y | | United Overseas Bank Ltd | | 0.160%-0.225%, 01/07/14-04/14/14 | | | 211,208 | | | | 1.8 | |
| | | | | | Other | | | | | | 1,136,675 | | | | 9.4 | |
| | | | | | | | | | | | 4,221,555 | | | | 35.2 | |
| GOVERNMENT AGENCY DEBT | | | | | | | | |
| | 80,610,000 | | | | Federal Home Loan Bank (FHLB) | | 0.035%-0.065%, 01/08/14 | | | 80,609 | | | | 0.7 | |
| | 144,200,000 | | | | FHLB | | 0.035%-0.130%, 01/10/14 | | | 144,197 | | | | 1.2 | |
| | 73,070,000 | | | | FHLB | | 0.040%-0.140%, 01/13/14 | | | 73,069 | | | | 0.6 | |
| | 73,210,000 | | | | FHLB | | 0.040%-0.050%, 01/15/14 | | | 73,209 | | | | 0.6 | |
| | 161,400,000 | | | | FHLB | | 0.020%-0.175%, 01/17/14 | | | 161,393 | | | | 1.4 | |
| | 112,185,000 | | | | FHLB | | 0.040%-0.100%, 01/22/14 | | | 112,182 | | | | 0.9 | |
| | 105,000,000 | | | | FHLB | | 0.050%-0.070%, 01/24/14 | | | 104,996 | | | | 0.9 | |
| | 81,002,000 | | | | FHLB | | 0.057%-0.060%, 01/29/14 | | | 80,998 | | | | 0.7 | |
| | 126,200,000 | | | | FHLB | | 0.063%-0.083%, 02/05/14 | | | 126,191 | | | | 1.1 | |
| | 117,620,000 | | | | FHLB | | 0.055%-0.085%, 02/07/14 | | | 117,611 | | | | 1.0 | |
| | 91,320,000 | | | | FHLB | | 0.080%-0.085%, 02/12/14 | | | 91,311 | | | | 0.8 | |
| | 86,901,000 | | | | FHLB | | 0.055%-0.083%, 02/14/14 | | | 86,893 | | | | 0.7 | |
| | 116,335,000 | | | | FHLB | | 0.083%-0.090%, 02/19/14 | | | 116,321 | | | | 1.0 | |
| | 86,450,000 | | | | FHLB | | 0.065%-0.110%, 02/21/14 | | | 86,441 | | | | 0.7 | |
| | 87,950,000 | | | | FHLB | | 0.060%-0.090%, 02/26/14 | | | 87,940 | | | | 0.7 | |
| | 92,400,000 | | | | FHLB | | 0.065%-0.090%, 02/28/14 | | | 92,389 | | | | 0.8 | |
| | 113,000,000 | | | | FHLB | | 0.090%-0.100%, 03/07/14 | | | 112,981 | | | | 0.9 | |
| | 147,600,000 | | | | FHLB | | 0.085%-0.100%, 03/12/14 | | | 147,573 | | | | 1.2 | |
| | 109,900,000 | | | | FHLB | | 0.090%-0.095%, 03/14/14 | | | 109,880 | | | | 0.9 | |
| 60 | 2013 Annual Report ■ College Retirement Equities Fund | See notes to financial statements |
| Summary portfolio of investments | continued |
CREF Money Market Account ■ December 31, 2013
| | | | | | | | | | Value | | | % of net |
| Principal | | | | Issuer | | | | | (000) | | | assets |
| GOVERNMENT AGENCY DEBT—continued | | | | | | |
| $ | 78,000,000 | | | | FHLB | | 0.085%-0.100%, 03/26/14 | | $ | 77,984 | | | | 0.7 | % |
| | 540,849,000 | | | | FHLB | | 0.035%-0.145%, 01/02/14-05/01/14 | | | 540,792 | | | | 4.5 | |
| | 95,500,000 | | | | Federal Home Loan Mortgage Corp (FHLMC) | | 0.060%-0.125%, 02/03/14 | | | 95,492 | | | | 0.8 | |
| | 73,160,000 | | | | FHLMC | | 0.065%-0.067%, 02/14/14 | | | 73,154 | | | | 0.6 | |
| | 113,775,000 | | | | FHLMC | | 0.050%-0.140%, 02/24/14 | | | 113,760 | | | | 1.0 | |
| | 87,732,000 | | | | FHLMC | | 0.088%-0.090%, 03/17/14 | | | 87,716 | | | | 0.7 | |
| | 516,898,000 | | | | FHLMC | | 0.030%-0.150%, 01/06/14-04/14/14 | | | 516,854 | | | | 4.3 | |
| | 387,773,000 | | | | Federal National Mortgage Association (FNMA) | | 0.042%-0.150%, 01/02/14-05/01/14 | | | 387,735 | | | | 3.2 | |
| | | | | | | | | | | 3,899,671 | | | | 32.6 | |
| TREASURY DEBT | | | | | | | | | | |
| | 80,000,000 | | | | United States Treasury Bill | | 0.026%-0.068%, 01/16/14 | | | 79,999 | | | | 0.7 | |
| | 83,355,000 | | | | United States Treasury Bill | | 0.021%-0.150%, 02/06/14 | | | 83,350 | | | | 0.7 | |
| | 92,000,000 | | | | United States Treasury Bill | | 0.076%-0.088%, 06/26/14 | | | 91,962 | | | | 0.8 | |
| | 86,225,000 | | | | United States Treasury Bill | | 0.089%-0.096%, 08/21/14 | | | 86,173 | | | | 0.7 | |
| | 235,390,000 | | | | United States Treasury Bill | | 0.031%-0.133%, 01/02/14-12/11/14 | | | 235,370 | | | | 1.9 | |
| | 117,630,000 | | | | United States Treasury Note | | 1.000%, 01/15/14 | | | 117,671 | | | | 1.0 | |
| | 100,000,000 | | | | United States Treasury Note | | 0.250%, 01/31/14 | | | 100,011 | | | | 0.8 | |
| | 100,000,000 | | | | United States Treasury Note | | 0.250%, 02/28/14 | | | 100,020 | | | | 0.8 | |
| | 98,510,000 | | | | United States Treasury Note | | 0.250%, 03/31/14 | | | 98,540 | | | | 0.8 | |
| | 100,175,000 | | | | United States Treasury Note | | 1.250%, 04/15/14 | | | 100,502 | | | | 0.8 | |
| | 100,000,000 | | | | United States Treasury Note | | 0.250%, 04/30/14 | | | 100,038 | | | | 0.8 | |
| | 99,625,000 | | | | United States Treasury Note | | 1.000%, 05/15/14 | | | 99,940 | | | | 0.8 | |
| | 101,610,000 | | | | United States Treasury Note | | 0.250%, 06/30/14 | | | 101,672 | | | | 0.9 | |
| | 111,325,000 | | | | United States Treasury Note | | 0.625%, 07/15/14 | | | 111,609 | | | | 0.9 | |
| | 100,000,000 | | | | United States Treasury Note | | 0.125%, 07/31/14 | | | 100,007 | | | | 0.8 | |
| | 179,695,000 | | | | United States Treasury Note | | 0.125%-1.250%, 03/15/14-01/15/15 | | | 180,068 | | | | 1.7 | |
| | | | | | | | | | | | 1,786,932 | | | | 14.9 | |
| VARIABLE RATE SECURITIES | | | | | | | | | | | |
| | 95,000,000 | | i | | Federal Farm Credit Bank (FFCB) | | 0.180%, 01/01/14 | | | 95,000 | | | | 0.8 | |
| | 94,500,000 | | i | | FFCB | | 0.180%, 01/01/14 | | | 94,486 | | | | 0.8 | |
| | 91,000,000 | | i | | FFCB | | 0.250%, 02/10/14 | | | 90,998 | | | | 0.8 | |
| | 70,000,000 | | i | | FFCB | | 0.120%, 10/27/14 | | | 70,000 | | | | 0.6 | |
| | 75,000,000 | | i | | FFCB | | 0.240%, 10/27/14 | | | 74,987 | | | | 0.6 | |
| | 621,850,000 | | i | | FFCB | | 0.130%-0.280%, 01/01/14-12/12/14 | | | 621,904 | | | | 5.2 | |
| | 80,000,000 | | i | | Federal National Mortgage Association (FNMA) | | 0.147%, 06/20/14 | | | 79,994 | | | | 0.7 | |
| | | | | | Other | | | | | | 220,012 | | | | 1.8 | |
| | | | | | | | | | | | 1,347,381 | | | | 11.3 | |
| | | | | | TOTAL SHORT-TERM INVESTMENTS | (Cost $11,975,539) | | | 11,975,539 | | | | 100.0 | |
| | | | | | | | | | | | | | | | | |
| | | | | | TOTAL PORTFOLIO | (Cost $11,975,539) | | | 11,975,539 | | | | 100.0 | |
| | | | | | OTHER ASSETS & LIABILITIES, NET | | | | 5,374 | | | | 0.0 | |
| | | | | | NET ASSETS | | | $ | 11,980,913 | | | | 100.0 | % |
| See notes to financial statements | College Retirement Equities Fund ■ 2013 Annual Report | 61 |
| Summary portfolio of investments | concluded |
CREF Money Market Account ■ December 31, 2013
| i | Floating or variable rate security. Coupon rate reflects the rate at period end. |
| y | Security exempt from registration under Section 4(2) of the Securities Act of 1933. Such securities are deemed liquid and may be resold in transactions exempt from registration only to dealers in that program or other “accredited investors.” At 12/31/2013, the aggregate value of these securities, including those in “Other,” was $2,855,372,000, or 23.8% of net assets. |
“Other” securities represent the aggregate value, by category, of securities that are not among the 50 largest holdings and, in total for any issuer, represent 1% or less of net assets.
Cost amounts are in thousands.
For ease of presentation, a number of classification categories have been grouped together in the Summary Portfolio of Investments. Note that the Account uses more specific categories in following its investment limitations on investment concentrations.
| 62 | 2013 Annual Report ■ College Retirement Equities Fund | See notes to financial statements |
[This page intentionally left blank.]
| College Retirement Equities Fund ■ 2013 Annual Report | 63 |
Statements of assets and liabilities
College Retirement Equities Fund ■ December 31, 2013
| (amounts in thousands, except accumulation unit value) | | Stock
Account | | | Global Equities
Account | | | Growth
Account | | | Equity Index
Account | | | Bond Market
Account | | | Inflation-Linked
Bond
Account | | | Social Choice
Account | | | Money Market
Account | |
| | | | | | | | | | | | | | | | | | | | | | | | | |
| ASSETS | | | | | | | | | | | | | | | | | | | | | | | | | | | | | | | | |
| Unaffiliated issuers*† | | $ | 131,021,820 | | | $ | 19,520,284 | | | $ | 19,385,857 | | | $ | 15,837,002 | | | $ | 15,401,061 | | | $ | 7,589,919 | | | $ | 14,467,659 | | | $ | 11,975,539 | |
| Affiliated issuers‡ | | | 31,243 | | | | — | | | | 338,936 | | | | 536,110 | | | | — | | | | — | | | | — | | | | — | |
| Total portfolio investments, at value | | $ | 131,053,063 | | | $ | 19,520,284 | | | $ | 19,724,793 | | | $ | 16,373,112 | | | $ | 15,401,061 | | | $ | 7,589,919 | | | $ | 14,467,659 | | | $ | 11,975,539 | |
| Cash**# | | | 192,310 | | | | 110,686 | | | | 610 | | | | 550 | | | | 95,256 | | | | 15,534 | | | | 41,768 | | | | 35 | |
| Cash — foreign^ | | | 30,648 | | | | 812 | | | | — | | | | — | | | | — | | | | — | | | | 94 | | | | — | |
| Dividends and interest receivable | | | 154,506 | | | | 23,007 | | | | 12,888 | | | | 21,467 | | | | 74,194 | | | | 38,645 | | | | 42,458 | | | | 3,121 | |
| Receivable from securities transactions | | | 497,893 | | | | 15,536 | | | | 9,579 | | | | 1,424 | | | | 2,736 | | | | — | | | | 1,315 | | | | — | |
| Receivable for delayed delivery securities | | | — | | | | — | | | | — | | | | — | | | | 683,855 | | | | — | | | | 289,946 | | | | — | |
| Due from affiliates | | | — | | | | — | | | | 3,912 | | | | — | | | | — | | | | — | | | | 4,268 | | | | 2,191 | |
| Receivable for variation margin on open futures contracts | | | — | | | | 320 | | | | 400 | | | | 83 | | | | — | | | | — | | | | — | | | | — | |
| Swap premiums paid | | | — | | | | — | | | | — | | | | — | | | | 30 | | | | — | | | | — | | | | — | |
| Other | | | 9,287 | | | | 1,428 | | | | 1,774 | | | | 1,470 | | | | 1,189 | | | | 1,061 | | | | 1,163 | | | | 1,244 | |
| Total assets | | | 131,937,707 | | | | 19,672,073 | | | | 19,753,956 | | | | 16,398,106 | | | | 16,258,321 | | | | 7,645,159 | | | | 14,848,671 | | | | 11,982,130 | |
| | | | | | | | | | | | | | | | | | | | | | | | | | | | | | | | | |
| LIABILITIES | | | | | | | | | | | | | | | | | | | | | | | | | | | | | | | | |
| Payable for collateral for securities loaned | | | 5,156,106 | | | | 518,882 | | | | 338,936 | | | | 536,110 | | | | — | | | | — | | | | 377,510 | | | | — | |
| Payable for securities transactions | | | 313,432 | | | | 23,475 | | | | — | | | | 2,764 | | | | 41,492 | | | | — | | | | 15,719 | | | | — | |
| Payable for delayed delivery securities | | | — | | | | — | | | | — | | | | — | | | | 3,136,598 | | | | — | | | | 1,113,456 | | | | — | |
| Due to affiliates | | | 116,727 | | | | 631 | | | | 229 | | | | 193 | | | | 2,951 | | | | 5,961 | | | | 153 | | | | 40 | |
| Swap premiums received | | | — | | | | — | | | | — | | | | — | | | | 327 | | | | — | | | | — | | | | — | |
| Unrealized depreciation on swap agreements | | | — | | | | — | | | | — | | | | — | | | | 473 | | | | — | | | | — | | | | — | |
| Other | | | 8,080 | | | | 1,366 | | | | 1,129 | | | | 1,028 | | | | 1,063 | | | | 1,088 | | | | 873 | | | | 1,177 | |
| Total liabilities | | | 5,594,345 | | | | 544,354 | | | | 340,294 | | | | 540,095 | | | | 3,182,904 | | | | 7,049 | | | | 1,507,711 | | | | 1,217 | |
| | | | | | | | | | | | | | | | | | | | | | | | | | | | | | | | | |
| NET ASSETS: | | | | | | | | | | | | | | | | | | | | | | | | | | | | | | | | |
| Accumulation Fund | | $ | 113,325,344 | | | $ | 18,769,529 | | | $ | 19,128,992 | | | $ | 15,563,057 | | | $ | 12,813,794 | | | $ | 7,403,712 | | | $ | 13,015,620 | | | $ | 11,773,869 | |
| Annuity Funds | | | 13,018,018 | | | | 358,190 | | | | 284,670 | | | | 294,954 | | | | 261,623 | | | | 234,398 | | | | 325,340 | | | | 207,044 | |
| Total net assets | | $ | 126,343,362 | | | $ | 19,127,719 | | | $ | 19,413,662 | | | $ | 15,858,011 | | | $ | 13,075,417 | | | $ | 7,638,110 | | | $ | 13,340,960 | | | $ | 11,980,913 | |
| | | | | | | | | | | | | | | | | | | | | | | | | | | | | | | | | |
| Accumulation units outstanding | | | 330,000 | | | | 140,867 | | | | 168,978 | | | | 108,049 | | | | 119,158 | | | | 114,996 | | | | 71,529 | | | | 461,111 | |
| Accumulation unit value | | $ | 343.41 | | | $ | 133.24 | | | $ | 113.20 | | | $ | 144.04 | | | $ | 107.54 | | | $ | 64.38 | | | $ | 181.96 | | | $ | 25.53 | |
| * | Includes securities loaned of | | $ | 4,975,468 | | | $ | 498,279 | | | $ | 332,501 | | | $ | 523,303 | | | $ | — | | | $ | — | | | $ | 356,841 | | | $ | — | |
| ** | Includes cash collateral for securities loaned of | | $ | 191,348 | | | $ | 110,664 | | | $ | — | | | $ | — | | | $ | — | | | $ | — | | | $ | 12,912 | | | $ | — | |
| # | Includes cash collateral for mortgage dollar rolls of | | $ | — | | | $ | — | | | $ | — | | | $ | — | | | $ | 95,000 | | | $ | — | | | $ | 27,549 | | | $ | — | |
| † | Portfolio investments; unaffiliated issuers cost | | $ | 106,137,687 | | | $ | 15,627,821 | | | $ | 14,420,673 | | | $ | 9,196,547 | | | $ | 15,406,248 | | | $ | 7,318,881 | | | $ | 11,626,471 | | | $ | 11,975,539 | |
| ‡ | Portfolio investments; affiliated issuers cost | | $ | 26,561 | | | $ | — | | | $ | 338,936 | | | $ | 536,110 | | | $ | — | | | $ | — | | | $ | — | | | $ | — | |
| ^ | Foreign cash, cost | | $ | 30,854 | | | $ | 811 | | | $ | — | | | $ | — | | | $ | — | | | $ | — | | | $ | 94 | | | $ | — | |
| 64 | 2013 Annual Report ■ College Retirement Equities Fund | See notes to financial statements | See notes to financial statements | College Retirement Equities Fund ■ 2013 Annual Report | 65 |
Statements of operations
College Retirement Equities Fund ■ For the year ended December 31, 2013
| (amounts in thousands) | | Stock
Account | | | Global Equities
Account | | | Growth
Account | | | Equity Index
Account | | | Bond Market
Account | | | Inflation-Linked
Bond
Account | | | Social Choice
Account | | | Money Market
Account | |
| | | | | | | | | | | | | | | | | | | | | | | | | |
| INVESTMENT INCOME | | | | | | | | | | | | | | | | | | | | | | | | | | | | | | | | |
| Dividends* | | $ | 2,433,900 | | | $ | 365,714 | | | $ | 220,217 | | | $ | 277,152 | | | $ | — | | | $ | — | | | $ | 162,561 | | | $ | — | |
| Income from securities lending | | | 74,377 | | | | 8,978 | | | | 4,072 | | | | 5,018 | | | | — | | | | — | | | | 3,689 | | | | — | |
| Interest | | | 326 | | | | 132 | | | | 92 | | | | 21 | | | | 316,487 | | | | 163,880 | | | | 109,862 | | | | 16,823 | |
| Other | | | — | | | | — | | | | — | | | | — | | | | 146 | | | | — | | | | 29 | | | | — | |
| Total income | | | 2,508,603 | | | | 374,824 | | | | 224,381 | | | | 282,191 | | | | 316,633 | | | | 163,880 | | | | 276,141 | | | | 16,823 | |
| | | | | | | | | | | | | | | | | | | | | | | | | | | | | | | | | |
| EXPENSES | | | | | | | | | | | | | | | | | | | | | | | | | | | | | | | | |
| Administrative | | | 322,666 | | | | 47,464 | | | | 46,981 | | | | 38,937 | | | | 38,380 | | | | 25,761 | | | | 34,255 | | | | 33,139 | |
| Investment advisory | | | 146,320 | | | | 27,972 | | | | 17,838 | | | | 8,583 | | | | 11,889 | | | | 7,682 | | | | 10,779 | | | | 6,545 | |
| Distribution | | | 87,788 | | | | 12,902 | | | | 12,767 | | | | 10,583 | | | | 10,470 | | | | 6,972 | | | | 9,326 | | | | 9,031 | |
| Mortality and expense risk charges | | | 5,804 | | | | 854 | | | | 845 | | | | 701 | | | | 689 | | | | 457 | | | | 616 | | | | 596 | |
| Total expenses | | | 562,578 | | | | 89,192 | | | | 78,431 | | | | 58,804 | | | | 61,428 | | | | 40,872 | | | | 54,976 | | | | 49,311 | |
| | | | | | | | | | | | | | | | | | | | | | | | | | | | | | | | | |
| Less: Expenses withheld by TIAA | | | — | | | | — | | | | — | | | | — | | | | — | | | | — | | | | — | | | | 32,565 | |
| | | | | | | | | | | | | | | | | | | | | | | | | | | | | | | | | |
| Net expenses | | | 562,578 | | | | 89,192 | | | | 78,431 | | | | 58,804 | | | | 61,428 | | | | 40,872 | | | | 54,976 | | | | 16,746 | |
| | | | | | | | | | | | | | | | | | | | | | | | | | | | | | | | | |
| Net investment income (loss) | | | 1,946,025 | | | | 285,632 | | | | 145,950 | | | | 223,387 | | | | 255,205 | | | | 123,008 | | | | 221,165 | | | | 77 | |
| | | | | | | | | | | | | | | | | | | | | | | | | | | | | | | | | |
| NET REALIZED AND UNREALIZED GAIN (LOSS) ON TOTAL INVESTMENTS | | | | | | | | | | | | | | | | | | | | | | | | | | | | | |
| Realized gain (loss): | | | | | | | | | | | | | | | | | | | | | | | | | | | | | | | | |
| Portfolio investments | | | 13,576,567 | | | | 1,545,623 | | | | 2,274,872 | | | | 219,275 | | | | 58,888 | | | | 286,945 | | | | 254,367 | | | | 2 | |
| Futures transactions | | | — | | | | 15,467 | | | | 18,902 | | | | 5,512 | | | | — | | | | — | | | | — | | | | — | |
| Written options | | | 47 | | | | — | | | | — | | | | — | | | | — | | | | — | | | | — | | | | — | |
| Swap transactions | | | — | | | | — | | | | — | | | | — | | | | 12 | | | | — | | | | — | | | | — | |
| Foreign currency transactions | | | (17,968 | ) | | | (3,776 | ) | | | (245 | ) | | | — | | | | 2 | | | | — | | | | (426 | ) | | | — | |
| Net realized gain (loss) on total investments | | | 13,558,646 | | | | 1,557,314 | | | | 2,293,529 | | | | 224,787 | | | | 58,902 | | | | 286,945 | | | | 253,941 | | | | 2 | |
| | | | | | | | | | | | | | | | | | | | | | | | | | | | | | | | | |
| Change in unrealized appreciation (depreciation) on: | | | | | | | | | | | | | | | | | | | | | | | | | | | | | | | | |
| Portfolio investments: | | | | | | | | | | | | | | | | | | | | | | | | | | | | | | | | |
| Unaffiliated issuers‡ | | | 12,964,262 | | | | 2,281,841 | | | | 2,664,336 | | | | 3,506,949 | | | | (604,902 | ) | | | (1,292,598 | ) | | | 1,411,865 | | | | — | |
| Affiliated issuers | | | 12,633 | | | | — | | | | — | | | | — | | | | — | | | | — | | | | — | | | | — | |
| Futures transactions | | | — | | | | 3,357 | | | | 4,241 | | | | 284 | | | | — | | | | — | | | | — | | | | — | |
| Swap transactions | | | — | | | | — | | | | — | | | | — | | | | (567 | ) | | | — | | | | — | | | | — | |
| Translation of assets (other than portfolio investments) and liabilities denominated in foreign currencies | | | 680 | | | | 243 | | | | (1 | ) | | | — | | | | — | | | | — | | | | 60 | | | | — | |
| Net change in unrealized appreciation (depreciation) on total investments | | | 12,977,575 | | | | 2,285,441 | | | | 2,668,576 | | | | 3,507,233 | | | | (605,469 | ) | | | (1,292,598 | ) | | | 1,411,925 | | | | — | |
| Net realized and unrealized gain (loss) on total investments | | | 26,536,221 | | | | 3,842,755 | | | | 4,962,105 | | | | 3,732,020 | | | | (546,567 | ) | | | (1,005,653 | ) | | | 1,665,866 | | | | 2 | |
| Net increase (decrease) in net assets from operations | | $ | 28,482,246 | | | $ | 4,128,387 | | | $ | 5,108,055 | | | $ | 3,955,407 | | | $ | (291,362 | ) | | $ | (882,645 | ) | | $ | 1,887,031 | | | $ | 79 | |
| * | Net of foreign withholding taxes of | | $ | 93,216 | | | $ | 17,170 | | | $ | 967 | | | $ | 105 | | | $ | — | | | $ | — | | | $ | 4,283 | | | $ | — | |
| ‡ | Includes net change in unrealized foreign capital gains taxes of | | $ | 1,860 | | | $ | — | | | $ | — | | | $ | — | | | $ | — | | | $ | — | | | $ | — | | | $ | — | |
| 66 | 2013 Annual Report ■ College Retirement Equities Fund | See notes to financial statements | See notes to financial statements | College Retirement Equities Fund ■ 2013 Annual Report | 67 |
Statements of changes in net assets
College Retirement Equities Fund ■ For the year ended
| | | Stock Account | | | Global Equities Account | | | Growth Account | |
| (amounts in thousands except accumulation units) | | December 31, 2013 | | | December 31, 2012 | | | December 31, 2013 | | | December 31, 2012 | | | December 31, 2013 | | | December 31, 2012 | |
| | | | | | | | | | | | | | | | | | | |
| OPERATIONS | | | | | | | | | | | | | | | | | | | | | | | | |
| Net investment income (loss) | | $ | 1,946,025 | | | $ | 2,082,840 | | | $ | 285,632 | | | $ | 300,378 | | | $ | 145,950 | | | $ | 182,878 | |
| Net realized gain (loss) on total investments | | | 13,558,646 | | | | 4,589,334 | | | | 1,557,314 | | | | 449,233 | | | | 2,293,529 | | | | 1,265,648 | |
| Net change in unrealized appreciation (depreciation) on total investments | | | 12,977,575 | | | | 9,631,671 | | | | 2,285,441 | | | | 1,648,725 | | | | 2,668,576 | | | | 646,824 | |
| Net increase (decrease) in net assets from operations | | | 28,482,246 | | | | 16,303,845 | | | | 4,128,387 | | | | 2,398,336 | | | | 5,108,055 | | | | 2,095,350 | |
| | | | | | | | | | | | | | | | | | | | | | | | | |
| FROM PARTICIPANT TRANSACTIONS | | | | | | | | | | | | | | | | | | | | | | | | |
| Premiums | | | 4,501,136 | | | | 4,292,100 | | | | 1,116,007 | | | | 984,197 | | | | 990,848 | | | | 982,835 | |
| Net transfers between CREF Accounts | | | (854,354 | ) | | | (1,326,978 | ) | | | 237,015 | | | | (23,773 | ) | | | (50,465 | ) | | | (68,567 | ) |
| Annuity payments | | | (1,249,549 | ) | | | (1,204,583 | ) | | | (28,826 | ) | | | (26,048 | ) | | | (22,260 | ) | | | (19,876 | ) |
| Withdrawals and death benefits | | | (10,509,456 | ) | | | (8,873,846 | ) | | | (1,532,548 | ) | | | (1,283,280 | ) | | | (1,557,216 | ) | | | (1,310,126 | ) |
| Net increase (decrease) from participant transactions | | | (8,112,223 | ) | | | (7,113,307 | ) | | | (208,352 | ) | | | (348,904 | ) | | | (639,093 | ) | | | (415,734 | ) |
| | | | | | | | | | | | | | | | | | | | | | | | | |
| Net increase (decrease) in net assets | | | 20,370,023 | | | | 9,190,538 | | | | 3,920,035 | | | | 2,049,432 | | | | 4,468,962 | | | | 1,679,616 | |
| | | | | | | | | | | | | | | | | | | | | | | | | |
| NET ASSETS | | | | | | | | | | | | | | | | | | | | | | | | |
| Beginning of period | | | 105,973,339 | | | | 96,782,801 | | | | 15,207,684 | | | | 13,158,252 | | | | 14,944,700 | | | | 13,265,084 | |
| End of period | | $ | 126,343,362 | | | $ | 105,973,339 | | | $ | 19,127,719 | | | $ | 15,207,684 | | | $ | 19,413,662 | | | $ | 14,944,700 | |
| | | | | | | | | | | | | | | | | | | | | | | | | |
| ACCUMULATION UNITS: | | | | | | | | | | | | | | | | | | | | | | | | |
| Units purchased | | | 14,779,827 | | | | 16,932,747 | | | | 9,466,300 | | | | 10,028,844 | | | | 10,197,318 | | | | 12,106,394 | |
| Units sold / transferred | | | (37,985,697 | ) | | | (40,844,632 | ) | | | (11,088,847 | ) | | | (13,469,376 | ) | | | (16,863,917 | ) | | | (17,196,832 | ) |
| Outstanding: | | | | | | | | | | | | | | | | | | | | | | | | |
| Beginning of period | | | 353,205,839 | | | | 377,117,724 | | | | 142,489,472 | | | | 145,930,004 | | | | 175,644,825 | | | | 180,735,263 | |
| End of period | | | 329,999,969 | | | | 353,205,839 | | | | 140,866,925 | | | | 142,489,472 | | | | 168,978,226 | | | | 175,644,825 | |
| 68 | 2013 Annual Report ■ College Retirement Equities Fund | See notes to financial statements | See notes to financial statements | College Retirement Equities Fund ■ 2013 Annual Report | 69 |
| Statements of changes in net assets | continued |
College Retirement Equities Fund ■ For the year ended
| | | Equity Index Account | | | Bond Market Account | | | Inflation-Linked Bond Account | |
| (amounts in thousands except accumulation units) | | December 31, 2013 | | | December 31, 2012 | | | December 31, 2013 | | | December 31, 2012 | | | December 31, 2013 | | | December 31, 2012 | |
| | | | | | | | | | | | | | | | | | | |
| OPERATIONS | | | | | | | | | | | | | | | | | | | | | | | | |
| Net investment income (loss) | | $ | 223,387 | | | $ | 220,522 | | | $ | 255,205 | | | $ | 306,373 | | | $ | 123,008 | | | $ | 264,149 | |
| Net realized gain (loss) on total investments | | | 224,787 | | | | 159,710 | | | | 58,902 | | | | 356,320 | | | | 286,945 | | | | 55,049 | |
| Net change in unrealized appreciation (depreciation) on total investments | | | 3,507,233 | | | | 1,315,002 | | | | (605,469 | ) | | | 53,728 | | | | (1,292,598 | ) | | | 323,715 | |
| Net increase (decrease) in net assets from operations | | | 3,955,407 | | | | 1,695,234 | | | | (291,362 | ) | | | 716,421 | | | | (882,645 | ) | | | 642,913 | |
| | | | | | | | | | | | | | | | | | | | | | | | | |
| FROM PARTICIPANT TRANSACTIONS | | | | | | | | | | | | | | | | | | | | | | | | |
| Premiums | | | 1,003,856 | | | | 839,362 | | | | 1,043,978 | | | | 1,205,338 | | | | 679,616 | | | | 1,014,337 | |
| Net transfers between CREF Accounts | | | 347,432 | | | | (51,156 | ) | | | 40,206 | | | | 777,288 | | | | (833,191 | ) | | | 566,952 | |
| Annuity payments | | | (22,907 | ) | | | (18,980 | ) | | | (23,834 | ) | | | (22,148 | ) | | | (23,422 | ) | | | (22,407 | ) |
| Withdrawals and death benefits | | | (1,438,860 | ) | | | (1,143,129 | ) | | | (2,184,672 | ) | | | (1,554,490 | ) | | | (2,125,347 | ) | | | (1,328,992 | ) |
| Net increase (decrease) from participant transactions | | | (110,479 | ) | | | (373,903 | ) | | | (1,124,322 | ) | | | 405,988 | | | | (2,302,344 | ) | | | 229,890 | |
| | | | | | | | | | | | | | | | | | | | | | | | | |
| Net increase (decrease) in net assets | | | 3,844,928 | | | | 1,321,331 | | | | (1,415,684 | ) | | | 1,122,409 | | | | (3,184,989 | ) | | | 872,803 | |
| | | | | | | | | | | | | | | | | | | | | | | | | |
| NET ASSETS | | | | | | | | | | | | | | | | | | | | | | | | |
| Beginning of period | | | 12,013,083 | | | | 10,691,752 | | | | 14,491,101 | | | | 13,368,692 | | | | 10,823,099 | | | | 9,950,296 | |
| End of period | | $ | 15,858,011 | | | $ | 12,013,083 | | | $ | 13,075,417 | | | $ | 14,491,101 | | | $ | 7,638,110 | | | $ | 10,823,099 | |
| | | | | | | | | | | | | | | | | | | | | | | | | |
| ACCUMULATION UNITS: | | | | | | | | | | | | | | | | | | | | | | | | |
| Units purchased | | | 7,934,869 | | | | 8,121,218 | | | | 9,637,856 | | | | 11,223,897 | | | | 10,034,924 | | | | 14,664,581 | |
| Units sold / transferred | | | (8,809,741 | ) | | | (11,657,858 | ) | | | (20,072,174 | ) | | | (7,546,388 | ) | | | (44,041,945 | ) | | | (11,508,551 | ) |
| Outstanding: | | | | | | | | | | | | | | | | | | | | | | | | |
| Beginning of period | | | 108,923,585 | | | | 112,460,225 | | | | 129,592,222 | | | | 125,914,713 | | | | 149,002,704 | | | | 145,846,674 | |
| End of period | | | 108,048,713 | | | | 108,923,585 | | | | 119,157,904 | | | | 129,592,222 | | | | 114,995,683 | | | | 149,002,704 | |
| 70 | 2013 Annual Report ■ College Retirement Equities Fund | See notes to financial statements | See notes to financial statements | College Retirement Equities Fund ■ 2013 Annual Report | 71 |
| Statements of changes in net assets | concluded |
College Retirement Equities Fund ■ For the year ended
| | | Social Choice Account | | | Money Market Account | |
| (amounts in thousands except accumulation units) | | December 31, 2013 | | | December 31, 2012 | | | December 31, 2013 | | | December 31, 2012 | |
| | | | | | | | | | | | | |
| OPERATIONS | | | | | | | | | | | | | | | | |
| Net investment income (loss) | | $ | 221,165 | | | $ | 233,237 | | | $ | 77 | | | $ | — | |
| Net realized gain (loss) on total investments | | | 253,941 | | | | 280,720 | | | | 2 | | | | 3 | |
| Net change in unrealized appreciation (depreciation) on total investments | | | 1,411,925 | | | | 614,082 | | | | — | | | | — | |
| Net increase (decrease) in net assets from operations | | | 1,887,031 | | | | 1,128,039 | | | | 79 | | | | 3 | |
| | | | | | | | | | | | | | | | | |
| FROM PARTICIPANT TRANSACTIONS | | | | | | | | | | | | | | | | |
| Premiums | | | 857,785 | | | | 685,306 | | | | 4,529,281 | | | | 3,954,609 | |
| Net transfers between CREF Accounts | | | 350,169 | | | | 21,316 | | | | 763,188 | | | | 104,918 | |
| Annuity payments | | | (27,380 | ) | | | (24,492 | ) | | | (20,863 | ) | | | (20,951 | ) |
| Withdrawals and death benefits | | | (1,007,941 | ) | | | (864,161 | ) | | | (5,199,990 | ) | | | (4,528,447 | ) |
| Net increase (decrease) from participant transactions | | | 172,633 | | | | (182,031 | ) | | | 71,616 | | | | (489,871 | ) |
| | | | | | | | | | | | | | | | | |
| Net increase (decrease) in net assets | | | 2,059,664 | | | | 946,008 | | | | 71,695 | | | | (489,868 | ) |
| | | | | | | | | | | | | | | | | |
| NET ASSETS | | | | | | | | | | | | | | | | |
| Beginning of period | | | 11,281,296 | | | | 10,335,288 | | | | 11,909,218 | | | | 12,399,086 | |
| End of period | | $ | 13,340,960 | | | $ | 11,281,296 | | | $ | 11,980,913 | | | $ | 11,909,218 | |
| | | | | | | | | | | | | | | | | |
| ACCUMULATION UNITS: | | | | | | | | | | | | | | | | |
| Units purchased | | | 5,034,332 | | | | 4,588,321 | | | | 177,383,548 | | | | 154,879,058 | |
| Units sold / transferred | | | (4,030,321 | ) | | | (5,743,840 | ) | | | (174,538,957 | ) | | | (173,537,292 | ) |
| Outstanding: | | | | | | | | | | | | | | | | |
| Beginning of period | | | 70,524,651 | | | | 71,680,170 | | | | 458,265,967 | | | | 476,924,201 | |
| End of period | | | 71,528,662 | | | | 70,524,651 | | | | 461,110,558 | | | | 458,265,967 | |
| 72 | 2013 Annual Report ■ College Retirement Equities Fund | See notes to financial statements | See notes to financial statements | College Retirement Equities Fund ■ 2013 Annual Report | 73 |
Financial highlights
College Retirement Equities Fund
| | | Selected per accumulation unit data | | | | Ratios and supplemental data |
| | | Gain (loss) from investment operations | | | | | | | | | | | | | | | | | |
| | | | | | | | | | | | Net realized | | | | | | | | | | Ratios to average net assets | | | | Accumulation | | | | Net | |
For the
year
ended | | Investment
income | a | | Expenses | a | | Net
investment
income
(loss | )a | | & unrealized
gain (loss
on total
investments | )
| Net
change in
accumulation
unit value | | Accumulation
unit value
beginning
of year | | Accumulation
unit value
end of
year | | Total
return | b | Gross
expenses | | Net
investment
income
(loss | ) | Portfolio
turnover
rate | | units
outstanding at
end of year
(in millions | ) | Accumulation
fund net
assets
(in millions | ) | assets
at end
of year
(in millions | ) |
| | | | | | | | | | | | | | | | | | | | | | | | | | | | |
| STOCK ACCOUNT | | | | | | | | | | | | | | | | | | | | | | | | | | | |
| 12/31/13 | | $6.581 | | | $1.476 | | | $5.105 | | | $ 69.661 | | $ 74.766 | | $268.644 | | $343.410 | | 27.83 | % | 0.48 | % | 1.68 | % | 59 | % | 330 | | $113,325 | | $126,343 | |
| 12/31/12 | | 6.328 | | | 1.244 | | | 5.084 | | | 34.469 | | 39.553 | | 229.091 | | 268.644 | | 17.26 | | 0.49 | | 2.01 | | 57 | | 353 | | 94,887 | | 105,973 | |
| 12/31/11 | | 5.308 | | | 1.151 | | | 4.157 | | | (16.066 | ) | (11.909 | ) | 241.000 | | 229.091 | | (4.94 | ) | 0.48 | | 1.73 | | 56 | | 377 | | 86,395 | | 96,783 | |
| 12/31/10 | | 4.506 | | | 1.006 | | | 3.500 | | | 29.246 | | 32.746 | | 208.254 | | 241.000 | | 15.72 | | 0.47 | | 1.63 | | 61 | | 401 | | 96,598 | | 108,700 | |
| 12/31/09 | | 4.251 | | | 0.849 | | | 3.402 | | | 47.129 | | 50.531 | | 157.723 | | 208.254 | | 32.04 | | 0.49 | | 1.97 | | 58 | | 418 | | 87,141 | | 98,509 | |
| | | | | | | | | | | | | | | | | | | | | | | | | | | | | | | | | |
| GLOBAL EQUITIES ACCOUNT | | | | | | | | | | | | | | | | | | | | | | | | | | | |
| 12/31/13 | | 2.590 | | | 0.616 | | | 1.974 | | | 26.579 | | 28.553 | | 104.690 | | 133.243 | | 27.27 | | 0.52 | | 1.67 | | 63 | | 141 | | 18,770 | | 19,128 | |
| 12/31/12 | | 2.566 | | | 0.522 | | | 2.044 | | | 14.260 | | 16.304 | | 88.386 | | 104.690 | | 18.45 | | 0.53 | | 2.09 | | 70 | | 142 | | 14,917 | | 15,208 | |
| 12/31/11 | | 2.131 | | | 0.490 | | | 1.641 | | | (9.051 | ) | (7.410 | ) | 95.796 | | 88.386 | | (7.74 | ) | 0.52 | | 1.74 | | 78 | | 146 | | 12,898 | | 13,158 | |
| 12/31/10 | | 1.888 | | | 0.432 | | | 1.456 | | | 8.987 | | 10.443 | | 85.353 | | 95.796 | | 12.24 | | 0.50 | | 1.69 | | 81 | | 152 | | 14,527 | | 14,833 | |
| 12/31/09 | | 1.862 | | | 0.374 | | | 1.488 | | | 19.648 | | 21.136 | | 64.217 | | 85.353 | | 32.91 | | 0.53 | | 2.11 | | 59 | | 155 | | 13,205 | | 13,490 | |
| | | | | | | | | | | | | | | | | | | | | | | | | | | | | | | | | |
| GROWTH ACCOUNT | | | | | | | | | | | | | | | | | | | | | | | | | | | |
| 12/31/13 | | 1.288 | | | 0.450 | | | 0.838 | | | 28.513 | | 29.351 | | 83.853 | | 113.204 | | 35.00 | | 0.46 | | 0.86 | | 63 | | 169 | | 19,129 | | 19,414 | |
| 12/31/12 | | 1.388 | | | 0.382 | | | 1.006 | | | 10.481 | | 11.487 | | 72.366 | | 83.853 | | 15.87 | | 0.47 | | 1.24 | | 67 | | 176 | | 14,728 | | 14,945 | |
| 12/31/11 | | 0.979 | | | 0.333 | | | 0.646 | | | 0.202 | | 0.848 | | 71.518 | | 72.366 | | 1.19 | | 0.46 | | 0.88 | | 57 | | 181 | | 13,079 | | 13,265 | |
| 12/31/10 | | 0.907 | | | 0.293 | | | 0.614 | | | 8.706 | | 9.320 | | 62.198 | | 71.518 | | 14.98 | | 0.46 | | 0.96 | | 77 | | 187 | | 13,350 | | 13,540 | |
| 12/31/09 | | 0.836 | | | 0.249 | | | 0.587 | | | 16.058 | | 16.645 | | 45.553 | | 62.198 | | 36.54 | | 0.48 | | 1.14 | | 81 | | 190 | | 11,842 | | 12,013 | |
| | | | | | | | | | | | | | | | | | | | | | | | | | | | | | | | | |
| EQUITY INDEX ACCOUNT | | | | | | | | | | | | | | | | | | | | | | | | | | | |
| 12/31/13 | | 2.546 | | | 0.531 | | | 2.015 | | | 33.715 | | 35.730 | | 108.308 | | 144.038 | | 32.99 | | 0.42 | | 1.59 | | 5 | | 108 | | 15,563 | | 15,858 | |
| 12/31/12 | | 2.391 | | | 0.442 | | | 1.949 | | | 12.978 | | 14.927 | | 93.381 | | 108.308 | | 15.98 | | 0.43 | | 1.89 | | 4 | | 109 | | 11,797 | | 12,013 | |
| 12/31/11 | | 1.832 | | | 0.390 | | | 1.442 | | | (0.825 | ) | 0.617 | | 92.764 | | 93.381 | | 0.66 | | 0.41 | | 1.53 | | 5 | | 112 | | 10,502 | | 10,692 | |
| 12/31/10 | | 1.613 | | | 0.343 | | | 1.270 | | | 11.830 | | 13.100 | | 79.664 | | 92.764 | | 16.45 | | 0.42 | | 1.54 | | 8 | | 116 | | 10,765 | | 10,962 | |
| 12/31/09 | | 1.470 | | | 0.288 | | | 1.182 | | | 16.176 | | 17.358 | | 62.306 | | 79.664 | | 27.86 | | 0.43 | | 1.77 | | 5 | | 116 | | 9,253 | | 9,426 | |
| | | | | | | | | | | | | | | | | | | | | | | | | | | | | | | | | |
| BOND MARKET ACCOUNT | | | | | | | | | | | | | | | | | | | | | | | | | | | |
| 12/31/13 | | 2.485 | | | 0.482 | | | 2.003 | | | (4.211 | ) | (2.208 | ) | 109.744 | | 107.536 | | (2.01 | ) | 0.45 | | 1.85 | | 363 | e | 119 | | 12,814 | | 13,075 | |
| 12/31/12 | | 2.835 | | | 0.482 | | | 2.353 | | | 3.163 | | 5.516 | | 104.228 | | 109.744 | | 5.29 | | 0.45 | | 2.19 | | 356 | e | 130 | | 14,222 | | 14,491 | |
| 12/31/11 | | 3.341 | | | 0.439 | | | 2.902 | | | 3.876 | | 6.778 | | 97.450 | | 104.228 | | 6.96 | | 0.44 | | 2.88 | | 261 | e | 126 | | 13,124 | | 13,369 | |
| 12/31/10 | | 3.470 | | | 0.422 | | | 3.048 | | | 3.096 | | 6.144 | | 91.306 | | 97.450 | | 6.73 | | 0.44 | | 3.19 | | 230 | e | 122 | | 11,915 | | 12,148 | |
| 12/31/09 | | 3.818 | | | 0.399 | | | 3.419 | | | 2.556 | | 5.975 | | 85.331 | | 91.306 | | 7.00 | | 0.45 | | 3.88 | | 185 | e | 113 | | 10,296 | | 10,512 | |
| 74 | 2013 Annual Report ■ College Retirement Equities Fund | See notes to financial statements | See notes to financial statements | College Retirement Equities Fund ■ 2013 Annual Report | 75 |
| Financial highlights | concluded |
College Retirement Equities Fund
| | | Selected per accumulation unit data | | | | Ratios and supplemental data | |
| | | Gain (loss) from investment operations | | | | | | | | | | | | | | | | | |
| | | | | | | | | | | Net realized | | | | | | | | | | Ratios to average net assets | | | | Accumulation | | | | Net | |
For the
year
ended | | Investment
income | a | Expenses | a | | Net
investment
income
(loss | )a | | & unrealized
gain (loss
on total
investments | )
| Net
change in
accumulation
unit value | | Accumulation
unit value
beginning
of year | | Accumulation
unit value
end of
year | | Total
return | b | Gross
expenses | | Net
investment
income
(loss | ) | Portfolio
turnover
rate | | units
outstanding at
end of year
(in millions | ) | Accumulation
fund net
assets
(in millions | ) | assets
at end
of year
(in millions | ) |
| | | | | | | | | | | | | | | | | | | | | | | | | | | | |
| INFLATION-LINKED BOND ACCOUNT | | | | | | | | | | | | | | | | | | | | | | | | |
| 12/31/13 | | $1.207 | | $0.301 | | | $0.906 | | | $(7.289 | ) | $(6.383 | ) | $ 70.765 | | $64.382 | | (9.02 | )% | 0.45 | % | 1.34 | % | 13 | % | 115 | | $ 7,404 | | $7,638 | |
| 12/31/12 | | 2.050 | | 0.310 | | | 1.740 | | | 2.523 | | 4.263 | | 66.502 | | 70.765 | | 6.40 | | 0.45 | | 2.52 | | 11 | | 149 | | 10,544 | | 10,823 | |
| 12/31/11 | | 2.817 | | 0.272 | | | 2.545 | | | 5.187 | | 7.732 | | 58.770 | | 66.502 | | 13.16 | | 0.43 | | 4.05 | | 13 | | 146 | | 9,699 | | 9,950 | |
| 12/31/10 | | 1.596 | | 0.254 | | | 1.342 | | | 1.929 | | 3.271 | | 55.499 | | 58.770 | | 5.89 | | 0.44 | | 2.33 | | 15 | | 135 | | 7,955 | | 8,177 | |
| 12/31/09 | | 0.974 | | 0.241 | | | 0.733 | | | 4.119 | | 4.852 | | 50.647 | | 55.499 | | 9.58 | | 0.45 | | 1.38 | | 11 | | 134 | | 7,453 | | 7,665 | |
| | | | | | | | | | | | | | | | | | | | | | | | | | | | | | | | |
| SOCIAL CHOICE ACCOUNT | | | | | | | | | | | | | | | | | | | | | | | | | | | |
| 12/31/13 | | 3.804 | | 0.757 | | | 3.047 | | | 22.950 | | 25.997 | | 155.966 | | 181.963 | | 16.67 | | 0.45 | | 1.79 | | 133 | f | 72 | | 13,016 | | 13,341 | |
| 12/31/12 | | 3.866 | | 0.677 | | | 3.189 | | | 12.242 | | 15.431 | | 140.535 | | 155.966 | | 10.98 | | 0.45 | | 2.14 | | 149 | f | 71 | | 10,999 | | 11,281 | |
| 12/31/11 | | 3.732 | | 0.619 | | | 3.113 | | | (0.595 | ) | 2.518 | | 138.017 | | 140.535 | | 1.82 | | 0.44 | | 2.22 | | 122 | f | 72 | | 10,074 | | 10,335 | |
| 12/31/10 | | 3.618 | | 0.561 | | | 3.057 | | | 11.683 | | 14.740 | | 123.277 | | 138.017 | | 11.95 | | 0.44 | | 2.39 | | 98 | f | 72 | | 9,968 | | 10,239 | |
| 12/31/09 | | 3.517 | | 0.488 | | | 3.029 | | | 19.530 | | 22.559 | | 100.718 | | 123.277 | | 22.41 | | 0.45 | | 2.81 | | 85 | f | 68 | | 8,430 | | 8,673 | |
|
| | | Selected per accumulation unit data | | | | Ratios and supplemental data | |
| | | Gain (loss) from investment operations | | | | | | | | | | | | | | | | | |
| | | | | | | | | | | Net realized | | | | | | | | | | Ratios to average net assets | | Accumulation | | | | Net | |
For the
year
ended | | Investment
income | a | Expenses | a | | Net
investment
income
(loss | )a | | & unrealized
gain (loss
on total
investments | )
| Net
change in
accumulation
unit value | | Accumulation
unit value
beginning
of year | | Accumulation
unit value
end of
year | | Total
return | b | Gross
expenses | | Expenses
net of
TIAA
withholding | | Net
investment
income
(loss | ) | units
outstanding at
end of year
(in millions | ) | Accumulation
fund net
assets
(in millions | ) | assets
at end
of year
(in millions | ) |
| | | | | | | | | | | | | | | | | | | | | | | | | | | |
| MONEY MARKET ACCOUNT | | | | | | | | | | | | | | | | | | | | | | | | | | |
| 12/31/13 | | $0.036 | | $0.036 | | | $0.000 | | | $0.000 | | $0.000 | | $ 25.534 | | $25.534 | | 0.00 | % | 0.41 | % | 0.14 | % | 0.00 | % | 461 | | $11,774 | | $11,981 | |
| 12/31/12 | | 0.044 | | 0.044 | | | 0.000 | | | 0.000 | | 0.000 | | 25.534 | | 25.534 | | 0.00 | | 0.42 | | 0.17 | | 0.00 | | 458 | | 11,701 | | 11,909 | |
| 12/31/11 | | 0.044 | | 0.044 | | | 0.000 | | | 0.001 | | 0.001 | | 25.533 | | 25.534 | | 0.00 | | 0.41 | | 0.17 | | 0.00 | | 477 | | 12,178 | | 12,399 | |
| 12/31/10 | | 0.062 | | 0.062 | | | 0.000 | | | 0.000 | | 0.000 | | 25.533 | | 25.533 | | 0.00 | | 0.41 | | 0.24 | | 0.00 | | 463 | | 11,816 | | 12,054 | |
| 12/31/09 | | 0.164 | | 0.104 | | | 0.060 | | | (0.031 | ) | 0.029 | | 25.504 | | 25.533 | | 0.11 | | 0.43 | | 0.41 | | 0.21 | | 512 | | 13,070 | | 13,327 | |
| a | Based on average units outstanding. |
| b | Based on per accumulation unit data. |
| e | The portfolio turnover rates excluding mortgage dollar roll transactions for the years ending December 31, 2013, December 31, 2012, December 31, 2011, December 31, 2010, and December 31, 2009 were 105%, 117%, 62%, 62%, and 96%, respectively. |
| f | The portfolio turnover rates excluding mortgage dollar roll transactions for the years ending December 31, 2013, December 31, 2012, December 31, 2011, December 31, 2010, and December 31, 2009 were 46%, 52%, 45%, 40%, and 49%, respectively. |
| 76 | 2013 Annual Report ■ College Retirement Equities Fund | See notes to financial statements | See notes to financial statements | College Retirement Equities Fund ■ 2013 Annual Report | 77 |
Notes to financial statements
College Retirement Equities Fund
Note 1—organization and significant accounting policies
The purpose of the College Retirement Equities Fund (“CREF”), as stated in its charter, is to aid and strengthen non-profit educational and research organizations, governmental entities, and other non-profit institutions by providing their employees with variable retirement benefits. CREF is registered with the Securities and Exchange Commission (“Commission”) under the Investment Company Act of 1940, as amended (“1940 Act”), as an open-end management investment company. It consists of eight investment portfolios: the Stock, Global Equities, Growth, Equity Index, Bond Market, Inflation-Linked Bond, Social Choice and Money Market Accounts (individually referred to as the “Account” or collectively referred to as the “Accounts”).
The accompanying financial statements were prepared in accordance with accounting principles generally accepted in the United States of America (“U.S. GAAP”), which may require the use of estimates made by management and the evaluation of subsequent events. Actual results may differ from those estimates. The Accumulation Unit Value (“AUV”) for financial reporting purposes may differ from the AUV for processing transactions. The AUV for financial reporting purposes includes security and participant transactions through the date of the report. Total return is computed based on the AUV used for processing transactions. The following is a summary of the significant accounting policies consistently followed by the Accounts.
Security valuation: For all Accounts (other than the Money Market Account), investments in securities are recorded at their estimated fair value as described in the valuation of investments note to the financial statements. Investments held by the Money Market Account are recorded at amortized cost, which approximates fair value. The amortized cost of an instrument is determined by valuing it at its original cost and thereafter accreting or amortizing any discount or premium to its face value at a constant rate until maturity.
Accumulation and Annuity Fund: The Accumulation Fund represents the net assets attributable to participants in the accumulation phase of their investment. The Annuity Fund represents the net assets attributable to the participants currently receiving annuity payments. The net increase or decrease in net assets from investment operations is apportioned between the funds based upon their relative daily net asset values. Death benefits are paid to beneficiaries if the annuitant dies during the accumulation period or the annuity period. Annuitants bear the mortality risk under their contracts.
Investments and investment income: Securities transactions are accounted for as of the trade date for financial reporting purposes. Interest income is recorded as earned and includes accretion of discounts and amortization of premiums using the effective yield method. Dividend income is recorded on the ex-dividend date. Foreign dividend income is recorded on the ex-dividend date or as soon as possible after the Accounts determine the existence of a dividend declaration after exercising reasonable due diligence. Realized gains and losses on securities transactions are based upon the specific identification method. Distributions received on securities that represent a return of capital or capital gain are recorded as a reduction of cost of investments and/or as a
| 78 | 2013 Annual Report ■ College Retirement Equities Fund |
realized gain. The Accounts estimate the components of distributions received that may be considered return of capital distributions or capital gain distributions.
Foreign currency transactions and translation: Assets, including investments, and liabilities denominated in foreign currencies are translated into U.S. dollar values each day using exchange rates obtained from an independent third party. Purchases and sales of securities, income and expenses are translated into U.S. dollars at the prevailing exchange rate on the date of the transaction. The effect of changes in foreign currency exchange rates on realized and unrealized security gains and losses is reflected as a component of security gains and losses.
Income taxes: CREF is taxed as a life insurance company under Subchapter L of the Internal Revenue Code. CREF should incur no federal income tax liability. Under the rules of taxation applicable to life insurance companies, CREF’s Accumulation and Annuity Funds for participants will generally be treated as life insurance reserves; therefore, any increase in such reserves will be deductible. CREF files income tax returns in U.S. federal and applicable state jurisdictions. An account’s federal income tax returns are generally subject to examination for a period of three fiscal years after filed. State and local tax returns may be subject to examination for an additional period of time depending on the jurisdiction. Management has analyzed the Accounts’ tax positions taken for all open federal income tax years and has concluded that no provision for federal income tax is required in the Accounts’ financial statements.
Foreign taxes: The Accounts may be subject to foreign taxes on income, gains on investments or currency repatriation, a portion of which may be recoverable. The Accounts will accrue such taxes and recoveries as applicable, based upon the current interpretation of tax rules and regulations that exist in the markets in which the Accounts invest.
Trustee compensation: The members of the Board of Trustees (“Board”), all of whom are independent, receive certain remuneration for their services, plus travel and other expenses. Trustees may elect to participate in a deferred compensation plan and defer all or a portion of their compensation. In addition, trustees participate in a long-term compensation plan. Amounts deferred are retained by the Accounts until paid. The investment of deferred amounts and the offsetting payable to the trustees are included in other assets and other liabilities in the accompanying Statements of Assets and Liabilities.
New accounting pronouncement: In June 2013, the Financial Accounting Standards Board issued Accounting Standard Update No. 2013-08 Financial Services - Investment Companies (Topic 946): Amendments to the Scope, Measurement, and Disclosure Requirements (the “Update”). The Update modifies the criteria used in determining an investment company under U.S. GAAP and establishes certain measurement and disclosure requirements. The Update establishes that an entity regulated under the 1940 Act is automatically an investment company under U.S. GAAP. The Update is effective for interim and annual reporting periods beginning after December 15, 2013. The Accounts expect to adopt these new disclosure requirements for the June 30, 2014 semiannual report. Management has reviewed the new requirements and has determined the adoption of the Update will not have a material impact on the Accounts’ financial statements and notes disclosures.
| College Retirement Equities Fund ■ 2013 Annual Report | 79 |
Notes to financial statements
Note 2—valuation of investments
Portfolio investments are valued at fair value utilizing various valuation methods approved by the Board. U.S. GAAP establishes a hierarchy that prioritizes market inputs to valuation methods. The three levels of inputs are:
| • | Level 1 – quoted prices in active markets for identical securities |
| • | Level 2 – other significant observable inputs (including quoted prices for similar securities, interest rates, credit spreads, etc.) |
| • | Level 3 – significant unobservable inputs (including the Accounts’ own assumptions in determining the fair value of investments) |
The availability of observable inputs can vary from security to security and is affected by a wide variety of factors including, for example, the type of security, whether the security is new and not yet established in the marketplace, the liquidity of markets and other characteristics particular to the security. To the extent that valuation is based on models or inputs that are less observable or unobservable in the market, the determination of fair value requires more judgment. Accordingly, the degree of judgment exercised in determining fair value is greatest for instruments categorized in Level 3. The inputs or methodology used for valuing securities are not necessarily an indication of the risk associated with investing in those securities.
A description of the valuation techniques applied to the Accounts’ major categories of assets and liabilities measured at fair value follows:
Exchange-traded equity securities, common and preferred stock: Equity securities listed or traded on a national market or exchange are valued based on their sale price on such market or exchange at the close of business on the date of valuation, or at the mean of the closing bid and asked prices if no sale is reported. To the extent these securities are actively traded and valuation adjustments are not applied, they are categorized in Level 1 of the fair value hierarchy. Foreign investments are valued at the last sale price or official closing price reported on the exchange where traded and converted to U.S. dollars at the prevailing rates of exchange on the date of valuation. For events affecting the value of foreign securities between the time when the exchange on which they are traded closes and the time when the Accounts’ net assets are calculated, such securities will be valued at fair value in accordance with procedures adopted by the Board. Foreign securities are generally categorized in Level 2 of the fair value hierarchy.
Debt securities: Debt securities will generally be valued using prices provided by a pricing service that may employ various indications of value including but not limited to broker-dealer quotations. Certain debt securities, other than money market instruments, are valued based on the most recent bid price or the equivalent quoted yield for such securities (or those of comparable maturity, quality and type). Debt securities are generally categorized in Level 2 of the fair value hierarchy; in instances where prices, yields or any other key inputs are unobservable, they are categorized in Level 3 of the hierarchy.
| 80 | 2013 Annual Report ■ College Retirement Equities Fund |
continued
Short-term investments: Short-term investments, excluding investments in registered investment companies, with maturities of 60 days or less are valued at amortized cost. Short-term investments (other than those in the Money Market Account) with maturities in excess of 60 days are valued in the same manner as debt securities. Short-term investments in the Money Market Account are valued at amortized cost. Short-term investments are generally categorized in Level 2 of the fair value hierarchy.
Investments in registered investment companies: These investments are valued at their net asset value on the valuation date. These investments are categorized in Level 1 of the fair value hierarchy.
Futures contracts: Stock and bond index futures, which are traded on commodity exchanges, are valued at the last sale price as of the close of such commodity exchanges and are categorized in Level 1 of the fair value hierarchy.
Options: Purchased and written options listed or traded on a national market or exchange are valued at the last sale price as of the close of such exchange or at the mean of the closing bid and asked prices if no sale is reported. To the extent these securities are actively traded and valuation adjustments are not applied, they are categorized in Level 1 of the fair value hierarchy.
Credit default swap contracts: Credit default swap contracts are marked-to-market daily based upon a price supplied by a pricing service. Credit default swaps are generally categorized as Level 2 in the fair value hierarchy.
Any portfolio security for which market quotations are not readily available or for which the above valuation procedures are deemed not to reflect fair value is valued at fair value, as determined in good faith using procedures approved by the Board. To the extent the inputs are observable and timely, the values would be categorized in Level 2 of the fair value hierarchy; otherwise they would be categorized as Level 3.
Transfers between levels are recognized at the end of the reporting period. For the period ended December 31, 2013, there were no material transfers between levels by the Accounts.
As of December 31, 2013, 100% of the value of investments in the Inflation-Linked Bond and Money Market Accounts was valued based on Level 2 inputs.
| College Retirement Equities Fund ■ 2013 Annual Report | 81 |
Notes to financial statements
The following table summarizes the market value of the Accounts’ investments as of December 31, 2013, based on the inputs used to value them (dollar amounts are in thousands):
| Account | | Level 1 | | | Level 2 | | | Level 3 | | | Total | |
| Stock | | | | | | | | | | | | | | | | |
| Equity investments: | | | | | | | | | | | | | | | | |
| Consumer discretionary | | $ | 13,253,112 | | | $ | 5,214,980 | | | $ | 141 | | | $ | 18,468,233 | |
| Consumer staples | | | 6,637,318 | | | | 3,190,735 | | | | 4 | | | | 9,828,057 | |
| Energy | | | 8,043,611 | | | | 2,859,564 | | | | 367 | | | | 10,903,542 | |
| Financials | | | 14,826,298 | | | | 9,405,500 | | | | 311 | | | | 24,232,109 | |
| Health care | | | 11,550,012 | | | | 3,020,409 | | | | 1,643 | | | | 14,572,064 | |
| Industrials | | | 10,413,902 | | | | 4,731,280 | | | | 2 | | | | 15,145,184 | |
| Information technology | | | 16,128,000 | | | | 2,881,989 | | | | 2 | | | | 19,009,991 | |
| Materials | | | 3,522,670 | | | | 3,207,496 | | | | 158 | | | | 6,730,324 | |
| Telecommunication services | | | 1,650,182 | | | | 1,689,198 | | | | — | | | | 3,339,380 | |
| Utilities | | | 2,295,976 | | | | 1,136,081 | | | | — | | | | 3,432,057 | |
| Corporate bonds | | | — | | | | 19 | | | | 34 | | | | 53 | |
| Government bonds | | | — | | | | 277 | | | | — | | | | 277 | |
| Equity-linked notes | | | — | | | | 1,850 | | | | — | | | | 1,850 | |
| Short-term investments | | | — | | | | 5,389,942 | | | | — | | | | 5,389,942 | |
| Total | | $ | 88,321,081 | | | $ | 42,729,320 | | | $ | 2,662 | | | $ | 131,053,063 | |
| Global Equities | | | | | | | | | | | | | | | | |
| Equity investments: | | | | | | | | | | | | | | | | |
| Asia | | $ | — | | | $ | 1,805,047 | | | $ | — | | | $ | 1,805,047 | |
| Australia | | | — | | | | 394,899 | | | | — | | | | 394,899 | |
| Europe | | | 180,032 | | | | 4,094,498 | | | | — | | | | 4,274,530 | |
| North America | | | 10,067,232 | | | | 682,536 | | | | — | | | | 10,749,768 | |
| All other equity investments* | | | 120,837 | | | | 1,536,197 | | | | — | | | | 1,657,034 | |
| Short-term investments | | | — | | | | 639,006 | | | | — | | | | 639,006 | |
| Futures** | | | 3,325 | | | | — | | | | — | | | | 3,325 | |
| Total | | $ | 10,371,426 | | | $ | 9,152,183 | | | $ | — | | | $ | 19,523,609 | |
| Growth | | | | | | | | | | | | | | | | |
| Equity investments: | | | | | | | | | | | | | | | | |
| Consumer discretionary | | $ | 3,985,234 | | | $ | 176,470 | | | $ | — | | | $ | 4,161,704 | |
| Consumer staples | | | 1,343,224 | | | | 76,208 | | | | — | | | | 1,419,432 | |
| Financials | | | 1,367,982 | | | | 8,373 | | | | — | | | | 1,376,355 | |
| Health care | | | 2,639,902 | | | | 187,688 | | | | — | | | | 2,827,590 | |
| Industrials | | | 2,317,951 | | | | 40,648 | | | | — | | | | 2,358,599 | |
| Information technology | | | 5,350,610 | | | | 14,324 | | | | — | | | | 5,364,934 | |
| Materials | | | 825,931 | | | | 7,295 | | | | — | | | | 833,226 | |
| Telecommunication services | | | 170,580 | | | | 90,199 | | | | — | | | | 260,779 | |
| All other equity investments* | | | 614,318 | | | | — | | | | — | | | | 614,318 | |
| Short-term investments | | | 338,936 | | | | 168,920 | | | | — | | | | 507,856 | |
| Futures** | | | 4,157 | | | | — | | | | — | | | | 4,157 | |
| Total | | $ | 18,958,825 | | | $ | 770,125 | | | $ | — | | | $ | 19,728,950 | |
| 82 | 2013 Annual Report ■ College Retirement Equities Fund |
continued
| Account | | Level 1 | | | Level 2 | | | Level 3 | | | Total | |
| Equity Index | | | | | | | | | | | | | | | | |
| Equity investments: | | | | | | | | | | | | | | | | |
| Energy | | $ | 1,462,236 | | | $ | — | | | $ | 34 | | | $ | 1,462,270 | |
| Health care | | | 1,986,396 | | | | — | | | | 16 | | | | 1,986,412 | |
| All other equity investments* | | | 12,353,993 | | | | — | | | | — | | | | 12,353,993 | |
| Short-term investments | | | 536,110 | | | | 34,327 | | | | — | | | | 570,437 | |
| Futures** | | | 308 | | | | — | | | | — | | | | 308 | |
| Total | | $ | 16,339,043 | | | $ | 34,327 | | | $ | 50 | | | $ | 16,373,420 | |
| Bond Market | | | | | | | | | | | | | | | | |
| Bank loan obligations | | $ | — | | | $ | 21,000 | | | $ | — | | | $ | 21,000 | |
| Corporate bonds | | | — | | | | 4,167,707 | | | | — | | | | 4,167,707 | |
| Government bonds | | | — | | | | 6,876,524 | | | | — | | | | 6,876,524 | |
| Structured assets | | | — | | | | 1,717,573 | | | | — | | | | 1,717,573 | |
| Preferred stocks | | | 17,583 | | | | — | | | | — | | | | 17,583 | |
| Short-term investments | | | — | | | | 2,600,674 | | | | — | | | | 2,600,674 | |
| Swaps** | | | — | | | | (770 | ) | | | — | | | | (770 | ) |
| Total | | $ | 17,583 | | | $ | 15,382,708 | | | $ | — | | | $ | 15,400,291 | |
| Social Choice | | | | | | | | | | | | | | | | |
| Equity investments: | | | | | | | | | | | | | | | | |
| Consumer discretionary | | $ | 840,911 | | | $ | 186,786 | | | $ | — | | | $ | 1,027,697 | |
| Consumer staples | | | 497,898 | | | | 162,825 | | | | — | | | | 660,723 | |
| Energy | | | 639,229 | | | | 155,448 | | | | — | | | | 794,677 | |
| Financials | | | 1,300,659 | | | | 466,146 | | | | — | | | | 1,766,805 | |
| Health care | | | 701,723 | | | | 159,621 | | | | — | | | | 861,344 | |
| Industrials | | | 685,492 | | | | 237,004 | | | | — | | | | 922,496 | |
| Information technology | | | 1,030,433 | | | | 66,037 | | | | — | | | | 1,096,470 | |
| Materials | | | 310,797 | | | | 161,924 | | | | — | | | | 472,721 | |
| Telecommunication services | | | 84,129 | | | | 92,735 | | | | — | | | | 176,864 | |
| Utilities | | | 234,712 | | | | 58,222 | | | | — | | | | 292,934 | |
| Bank loan obligations | | | — | | | | 9,765 | | | | — | | | | 9,765 | |
| Corporate bonds | | | — | | | | 1,856,090 | | | | — | | | | 1,856,090 | |
| Government bonds | | | — | | | | 2,980,013 | | | | — | | | | 2,980,013 | |
| Structured assets | | | — | | | | 191,501 | | | | — | | | | 191,501 | |
| Short-term investments | | | — | | | | 1,357,559 | | | | — | | | | 1,357,559 | |
| Total | | $ | 6,325,983 | | | $ | 8,141,676 | | | $ | — | | | $ | 14,467,659 | |
| * | For detailed categories, see the accompanying Summary portfolio of investments. |
| ** | Derivative instruments are not reflected in the Summary portfolio of investments. |
Note 3—derivative instruments
As defined by U.S. GAAP, a derivative is a financial instrument whose value is derived from an underlying security price, foreign exchange rate, interest rate, index of prices or rates, or other variables. Derivatives require little or no initial investment and permit or require net settlement. The Accounts value derivatives at fair value.
| College Retirement Equities Fund ■ 2013 Annual Report | 83 |
Notes to financial statements
At December 31, 2013, the following Accounts have invested in derivative contracts which are reflected in the Statements of Assets and Liabilities (dollar amounts are in thousands):
| | | Asset derivatives | | Liabilities derivatives |
| Derivative contracts | | Location | | Fair value
amount | | | Location | | Fair value
amount | |
| Global Equities | | | | | | | | | | | | |
| Equity contracts | | Futures* | | $ | 3,325 | | | | | | | |
| Growth Account | | | | | | | | | | | | |
| Equity contracts | | Futures* | | | 4,157 | | | | | | | |
| Equity Index Account | | | | | | | | | | | | |
| Equity contracts | | Futures* | | | 308 | | | | | | | |
| Bond Market Account | | | | | | | | | | | | |
| Credit contracts | | | | | | | Unrealized
depreciation on
swap agreements | | $ | 473 | |
| Credit contracts | Swap premiums
paid | | | 30 | | Swap premiums
received | | | 327 | |
| Total | | | | | $30 | | | | | $ | 800 | |
| * | The fair value presented includes cumulative gain (loss) on open futures contracts; however, the value reflected on the accompanying Statements of Assets and Liabilities is only the receivable for variation margin on open futures contracts. |
For the year ended December 31, 2013, the effect of derivative contracts on the Accounts Statements of Operations was as follows (dollar amounts are in thousands):
| Derivative contracts | | Location | | Realized
gain (loss | ) | | Change in
unrealized
appreciation
(depreciation | ) |
| Stock Account | | | | | | | | | | |
| Equity contracts | | Written options | | $ | 47 | | | $ | — | |
| Global Equities Account | | | | | | | | | | |
| Equity contracts | | Futures transactions | | | 15,467 | | | | 3,357 | |
| Growth Account | | | | | | | | | | |
| Equity contracts | | Futures transactions | | | 18,902 | | | | 4,241 | |
| Equity Index Account | | | | | | | | | | |
| Equity contracts | | Futures transactions | | | 5,512 | | | | 284 | |
| Bond Market Account | | | | | | | | | | |
| Credit contracts | | Swap transactions | | | 12 | | | | (568 | ) |
Futures contracts: Certain Accounts are subject to equity price risk in the normal course of pursuing their investment objectives. The Accounts use futures contracts to manage exposure to the equity markets and for cash management purposes to remain highly invested in these markets while minimizing transaction costs. Buying futures contracts tends to increase exposure to the underlying instrument/index, while selling futures contracts tends to decrease exposure to the underlying instrument/index or
| 84 | 2013 Annual Report ■ College Retirement Equities Fund |
continued
hedge other investments. Initial margin deposits are made upon entering into a futures contract, and variation margin receipts or payments are settled daily reflecting changes in the value of the futures contracts. Daily changes in the value of such contracts are reflected in net unrealized gains and losses. Gains or losses are realized upon the expiration or closing of the futures contracts or if the counterparties do not perform in accordance with contractual provisions. With futures, there is minimal counterparty credit risk to the Accounts since futures are exchange-traded and the exchange’s clearinghouse, as counterparty to all exchange-traded funds, guarantees the futures against default. During the year ended December 31, 2013, the Global Equities Account, the Growth Account, and the Equity Index Account had exposure to futures contracts, based on underlying notional values, generally between 0% and 1% of net assets.
At December 31, 2013, the Accounts held the following open futures contracts (dollar amounts are in thousands):
| Account | | Futures | | Number of
contracts | | | Settlement
value | | | Expiration
date | | Unrealized
gain (loss | ) |
| Global Equities | | S&P 500 Index E-mini | | | 1,000 | | | $ | 92,055 | | | March 21, 2014 | | $ | 3,325 | |
| Growth | | S&P 500 Index E-mini | | | 1,250 | | | | 115,069 | | | March 21, 2014 | | | 4,157 | |
| Equity Index | | S&P 500 Index E-mini | | | 227 | | | | 20,896 | | | March 21, 2014 | | | 246 | |
| | | S&P Mid-Cap 400 Index E-mini | | | 20 | | | | 2,679 | | | March 21, 2014 | | | 31 | |
| | | Russell 2000 Mini Index | | | 19 | | | | 2,207 | | | March 21, 2014 | | | 31 | |
| Total | | | | | 266 | | | $ | 25,782 | | | | | $ | 308 | |
Options: Certain Accounts are subject to equity price risk in the normal course of pursuing their investment objectives. The Accounts use options contracts for hedging and cash management purposes and to seek to increase total return. Call and put options give the holder the right, in return for a premium paid, to purchase or sell, respectively, a security at a specified exercise price at any time during the period of the option. Written options are separately reflected as a liability in the Statements of Assets and Liabilities. Premiums on unexercised, expired options are recorded as realized gains or losses; premiums on exercised options are recorded as an adjustment to the proceeds from the sale or cost of the purchase. The difference between the premium and the amount received or paid in a closing transaction is also treated as a realized gain or loss. Risks related to the use of options include possible illiquidity of the options markets, price movements in underlying security values, and losses that may exceed amounts recognized on the Statements of Assets and Liabilities. During the year ended December 31, 2013, the Stock Account had exposure to options, based on underlying nominal values, generally between 0% and 1% of net assets.
There were no written options outstanding as of December 31, 2013.
| College Retirement Equities Fund ■ 2013 Annual Report | 85 |
Notes to financial statements
Transactions in written options and related premiums received during the year ended December 31, 2013, were as follows (dollar amounts are in thousands):
| | | | Number of contracts | | | Premiums | |
| Stock Account | | | | | | | | |
| Outstanding at beginning of year | | | — | | | $ | — | |
| Written | | | 1,020 | | | | 48 | |
| Purchased | | | (100 | ) | | | (3 | ) |
| Exercised | | | (75 | ) | | | (23 | ) |
| Expired | | | (845 | ) | | | (22 | ) |
| Outstanding at end of year | | | — | | | $ | — | |
Credit default swap contracts: Certain Accounts are subject to credit risk in the normal course of pursuing their investment objectives. A credit default swap is a contract between a buyer and a seller of protection against pre-defined credit events for the reference entity. As a seller in a credit default swap contract, the Account is required to pay an agreed-upon amount to the counterparty with the occurrence of a specified credit event, such as certain bankruptcies related to an underlying credit instrument, index, or issuer which would likely result in a loss to the Account. The agreed upon amount approximates the notional value of the swap and is estimated to be the maximum potential future payment that the Account could be required to make under the contract. In return, the Account receives from the counterparty a periodic stream of payments over the term of the contract provided that no credit event has occurred. If no credit event occurs, the Account keeps the stream of payments with no payment obligations. When the Account sells a credit default swap contract it will cover its commitment. This may be achieved by, among other methods, maintaining cash or liquid assets in a segregated account equal to the aggregate notional value of the reference entities for all outstanding credit default swap contracts sold by the Account.
The Account may also buy credit default swap contracts, in which case the Account functions as the counterparty referenced above. This involves the risk that the contract may expire worthless. It also involves counterparty risk that the seller may fail to satisfy its payment obligations to the Account with the occurrence of a credit event.
The value of a swap included in net assets is the unrealized gain or loss of the contract plus or minus any unamortized premiums paid or received, respectively. Appreciated swaps and premiums paid are reflected as assets while depreciated swaps and premiums received are reflected as liabilities on the Statements of Assets and Liabilities.
Under the terms of the credit default swap contracts, the Account receives or makes quarterly payments based on a payment rate on a fixed notional amount. These payments are recorded as a realized gain or loss in the Statements of Operations. Payments received or made as a result of a credit event or termination of the contract are recognized as realized gains or losses.
The Accounts (other than the Money Market Account) invest in credit default swaps to hedge or manage the risks associated with assets held in the Account and/or to facilitate the implementation of portfolio strategies to seek to increase the total
| 86 | 2013 Annual Report ■ College Retirement Equities Fund |
continued
return. During the year ended December 31, 2013, the Bond Market Account had exposure to credit default swap contracts, based on underlying notional values, generally between 0% and 1% of net assets.
At December 31, 2013, open credit default swaps purchased and sold by the Accounts were as follows (dollar amounts are in thousands):
Purchased
| Account | | Reference
entity | | Counterparty | | Maturity
date | | Fixed
payments
paid
by Account
per annum | | | Implied
credit
spread at
12/31/13 | (1) | | Notional
amount | (2) | | Upfront
premium
paid
(received | ) | | Unrealized
appreciation
(depreciation | ) |
| Bond Market | | Republic of Poland | | JP Morgan Chase Bank N.A. | | 9/20/18 | | 1.00% | | | 0.71% | | | $12,000 | | | $30 | | | $(263 | ) |
| Sold | | | | | | | | | | | | | | | | | | | | | |
| Account | | Reference
entity | | Counterparty | | Maturity
date | | Fixed
payments
received
by Account
per annum | | | Implied
credit
spread at
12/31/13 | (1) | | Notional
amount | (2) | | Upfront
premium
paid
(received | ) | | Unrealized
appreciation
(depreciation | ) |
| Bond Market | | Federative Republic of Brazil | | UBS AG | | 9/20/22 | | 1.00% | | | 2.33% | | | $5,500 | | | $(327 | ) | | $(210 | ) |
| (1) | Implied credit spreads, represented in absolute terms, utilized in determining the market value of credit default swap agreements on corporate issues, U.S. municipal issues or sovereign issues of an emerging country as of period end, serve as an indicator of the current status of the payment/performance risk and represent the likelihood or risk of default for the credit derivative. The implied credit spread of a particular referenced entity reflects the cost of buying/selling protection and may include upfront payments required to be made to enter into the agreement. Wider credit spreads represent a deterioration of the referenced entity’s credit soundness and a greater likelihood or risk of default or other credit event occurring as defined under the terms of the agreement. |
| (2) | The maximum potential amount the Account could be required to pay as a seller of credit protection or receive as a buyer of credit protection if a credit event occurs is defined under the terms of that particular swap agreement. |
Note 4—investment adviser and affiliates
Investment advisory services for the Accounts are provided by TIAA-CREF Investment Management, LLC (“TCIM”) in accordance with an Investment Management Services Agreement. TCIM is a registered investment adviser and a wholly owned subsidiary of Teachers Insurance and Annuity Association of America (“TIAA”), a companion organization of CREF.
Administrative services are provided to the Accounts by TIAA, pursuant to an Administrative Services Agreement with CREF. Distribution functions are provided to the Accounts by TIAA-CREF Individual & Institutional Services, LLC (“Services”), a wholly owned subsidiary of TIAA, pursuant to a Principal Underwriting and Distribution Services Agreement with CREF and the Rule 12b-1 plan. Teachers
| College Retirement Equities Fund ■ 2013 Annual Report | 87 |
Notes to financial statements
Personal Investors Services, Inc. (“TPIS”), a wholly owned subsidiary of TIAA, may also provide distribution functions for the Accounts on a limited basis.
The services provided by TCIM, Services, TPIS, and TIAA are provided to CREF at cost, and CREF also reimburses TCIM, Services, TPIS, and TIAA for certain third party expenses and trustee fees paid on its behalf. Payments from the CREF Accounts are made on a daily basis according to formulas established each year with the objective of keeping the estimated expenses as close as possible to each Account’s actual expenses. Any differences between actual expenses and the estimated expenses remitted are adjusted.
For the year ended December 31, 2013, TIAA withheld (“waived”) a portion of the distribution Rule 12b-1 and administrative expenses for the Money Market Account totaling $32,565,000. The withholding of expenses is voluntary in nature and can be discontinued at any time. Any expenses waived after October 1, 2010 are subject to possible recovery by TIAA from the Account for three years after the waiver. TIAA may recover from the Account a portion of the amounts waived at such time as the Account’s daily yield would be positive absent the effect of the waiver, and in such event the amount of recovery on any day will be approximately 25% of the Account’s
| 88 | 2013 Annual Report ■ College Retirement Equities Fund |
continued
yield (net of all expenses) on that day. As of December 31, 2013, the cumulative amount of expenses waived subject to recovery is $91,177,000. The amounts waived and reimbursed are disclosed on the Statements of Operations.
TIAA charges a mortality and expense charge to CREF in an amount equal to 0.005% of the net assets of each Account to guarantee that CREF participants transferring Accounts to TIAA for the immediate purchase of lifetime payout annuities will not be charged more than the rate stipulated in the CREF contract.
Amounts owed to Account affiliates for payment of Account expenses, payments for units purchased, and receipt for units sold are disclosed as due to/from affiliates on the Statements of Assets and Liabilities. Account expenses owed to affiliates are reflected in the Statements of Operations.
The Accounts may purchase or sell investment securities in transactions with affiliated entities under procedures adopted by the Board, pursuant to the 1940 Act. These transactions are effected at market rates without incurring broker commissions.
| College Retirement Equities Fund ■ 2013 Annual Report | 89 |
| Notes to financial statements | continued |
Companies in which an Account holds 5% or more of the outstanding voting shares are considered “affiliated companies” of the Account, pursuant to the 1940 Act. Information regarding transactions with affiliated companies is as follows (dollar amounts are in thousands):
| Issue | | Value at
December 31, 2012 | | Purchase
cost | | Sales
proceeds | | Realized
gain (loss | ) | Dividend
income | | Shares at
December 31, 2013 | | | Value at
December 31, 2013 | |
| Stock Account | | | | | | | | | | | | | | | | | | | | | | | |
| Allos Therapeutics, Inc | | $ | 12 | | $ | — | | $ | — | | $ | — | | $ | — | | | — | ** | | $ | — | |
| Hibernia REIT plc | | | * | | | 26,561 | | | — | | | — | | | — | | | 19,410,600 | | | | 31,243 | |
| Japan Asia Investment Co Ltd | | | 6,408 | | | — | | | 7,203 | | | 2,419 | | | — | | | — | ** | | | — | |
| MPM Bioventures II | | | 4,846 | | | — | | | — | | | — | | | — | | | — | ** | | | — | |
| Skyline Venture Fund II Ltd | | | 246 | | | — | | | — | | | — | | | — | | | — | ** | | | — | |
| | | $ | 11,512 | | $ | 26,561 | | $ | 7,203 | | $ | 2,419 | | $ | — | | | 19,410,600 | | | $ | 31,243 | |
| Growth Account | | | | | | | | | | | | | | | | | | | | | | | |
TIAA-CREF Short Term Lending Portfolio
of the State Street Navigator Securities Lending Trust | | $ | 327,923 | | $ | 512,236 | | $ | 501,223 | | $ | — | | $ | — | | | 338,935,715 | | | $ | 338,936 | |
| Equity Index Account | | | | | | | | | | | | | | | | | | | | | | | |
TIAA-CREF Short Term Lending Portfolio
of the State Street Navigator Securities Lending Trust | | $ | 303,938 | | $ | 348,532 | | $ | 116,360 | | $ | — | | $ | — | | | 536,110,401 | | | $ | 536,110 | |
| * | Not an affiliate investment as of December 31, 2012 |
| ** | Not an affiliate investment as of December 31, 2013 |
Note 5—investments
Securities lending: Certain Accounts may lend their securities to qualified institutional borrowers to earn additional income. An Account receives collateral (in the form of cash, Treasury securities, or other collateral permitted by applicable law) against the loaned securities and maintains collateral in an amount not less than 100% of the market value of loaned securities during the period of the loan; any additional collateral required due to changes in security values is delivered to the Account the next business day. Cash collateral received by the Account will generally be invested in high-quality short-term instruments or in one or more funds maintained by the securities lending agent for the purpose of investing cash collateral. The value of the loaned securities and the liability to return the cash collateral received are reflected in the Statements of Assets and Liabilities. Securities lending income recognized by the Accounts consists of earnings on invested collateral and lending fees, net of any rebates to the borrower and compensation to the lending agent. Such income is reflected separately in the Statements of Operations. In lending its securities, an Account bears the market risk with respect to the collateral investment as well as the securities loaned and also bears the risk that the counterparty may default on its obligations to the Account.
Repurchase agreements: Each Account may enter into repurchase agreements with banks or broker-dealers. Repurchase agreements involve the purchase of securities from an institution, subject to the seller’s agreement to repurchase and the Account’s agreement to resell such securities at a mutually agreed-upon price. Pursuant to the terms of the repurchase agreement, securities purchased subject to repurchase agreements must have an aggregate market value greater than or equal to the agreed-upon repurchase price plus accrued interest at all times. If the value of the underlying securities falls below the value of the repurchase price plus accrued interest, the Account will require the seller to deposit additional collateral by the next business day. If a request for additional collateral is not met, or if the seller defaults on its repurchase obligation, the Account maintains the right to sell the underlying securities at market value and pursue a claim for any remaining loss against the seller.
Securities purchased on a when-issued or delayed-delivery basis: The Accounts may purchase securities on a when-issued or delayed-delivery basis. Securities purchased or sold on a when-issued or delayed-delivery basis may be settled a month or more after trade date; interest income is not accrued until settlement date. At the time an Account enters into such transactions, it is required to have segregated assets with a current value at least equal to the amount of its when-issued or delayed-delivery purchase commitments.
| 90 | 2013 Annual Report ■ College Retirement Equities Fund | College Retirement Equities Fund ■ 2013 Annual Report | 91 |
Notes to financial statements
Treasury Inflation-Protected Securities: The Accounts (other than the Money Market Account) may invest in Treasury Inflation-Protected Securities, specially structured bonds in which the principal amount is adjusted periodically to keep pace with inflation, as measured by the U.S. Consumer Price Index.
Mortgage dollar rolls transactions: Some of the Accounts may enter into mortgage dollar rolls in which an Account sells mortgage securities for delivery in the current month, realizing a gain (loss), and simultaneously contracts to repurchase similar securities on a specified future date. During the roll period, an Account forgoes principal and interest paid on the securities. The Account is compensated by the interest earned on the cash proceeds of the initial sale and by the lower repurchase price at the future date. The difference between the sales proceeds and the lower repurchase price is recorded as a realized gain. The Account maintains a segregated account, the dollar value of which is at least equal to its obligations with respect to dollar rolls.
Restricted securities: Restricted securities held by the Accounts, if any, may not be sold except in exempt transactions or in a public offering registered under the Securities Act of 1933. The risk of investing in such securities is generally greater than the risk of investing in securities that are widely held and publicly traded.
Equity-linked notes: Equity-linked notes are debt securities issued by banks or broker-dealers and are designed to offer a return linked to an underlying security or market index. Equity-linked notes are structured with a defined maturity date. When the note matures, the issuer will pay to, or receive from the Account the difference between the nominal value of the underlying instrument at the time of purchase and that instrument’s value at maturity. The Account will record a realized gain or loss on the transaction. The note is valued daily and any change in the value of the note is reflected in net unrealized gains and losses. Investments in equity-linked notes involve the same risks associated with a direct investment in the underlying security or index that the notes seek to replicate. In addition, there is also counterparty risk associated with these investments because the Account is relying on the creditworthiness of such counterparty and has no rights under an equity-linked note against the issuer of the underlying security.
Net unrealized appreciation (depreciation): At December 31, 2013, net unrealized appreciation (depreciation) based on the aggregate cost of portfolio investments for federal income tax purposes, consisting of gross unrealized appreciation and gross unrealized depreciation, was as follows (dollar amounts are in thousands):
| Account | | Gross
unrealized
appreciation | | | Gross
unrealized
(depreciation | ) | | Net unrealized
appreciation
(depreciation | ) |
| Stock | | $ | 26,681,063 | | | $ | (1,792,248 | ) | | $ | 24,888,815 | |
| Global Equities | | | 4,079,268 | | | | (186,805 | ) | | | 3,892,463 | |
| Growth | | | 5,026,086 | | | | (60,902 | ) | | | 4,965,184 | |
| Equity Index | | | 7,200,741 | | | | (560,286 | ) | | | 6,640,455 | |
| Bond Market | | | 227,896 | | | | (233,083 | ) | | | (5,187 | ) |
| Inflation-Linked Bond | | | 466,009 | | | | (194,971 | ) | | | 271,038 | |
| Social Choice | | | 3,055,483 | | | | (214,295 | ) | | | 2,841,188 | |
| 92 | 2013 Annual Report ■ College Retirement Equities Fund |
continued
Purchases and sales: Purchases and sales of securities (other than short-term instruments) for all of the Accounts for the year ended December 31, 2013, were as follows (dollar amounts are in thousands):
| | | | | | | Stock Account | | | Global Equities
Account | | | Growth Account | |
| Purchases: | | | | | | | | | | | | | | | | |
| Non-Government | | | | | | $ | 68,300,278 | | | $ | 10,643,751 | | | $ | 10,599,395 | |
| Total Purchases | | | | | | $ | 68,300,278 | | | $ | 10,643,751 | | | $ | 10,599,395 | |
| Sales: | | | | | | | | | | | | | | | | |
| Non-Government | | | | | | $ | 74,681,587 | | | $ | 10,593,413 | | | $ | 10,939,287 | |
| Total Sales | | | | | | $ | 74,681,587 | | | $ | 10,593,413 | | | $ | 10,939,287 | |
| | | Equity Index
Account | | | Bond Market
Account | | | Inflation-Linked
Bond Account | | | Social Choice
Account | |
| Purchases: | | | | | | | | | | | | | | | | |
| Non-Government | | $ | 998,141 | | | $ | 5,666,514 | | | $ | — | | | $ | 2,895,694 | |
| Government | | | — | | | | 43,363,467 | | | | 1,226,705 | | | | 13,646,459 | |
| Total Purchases | | $ | 998,141 | | | $ | 49,029,981 | | | $ | 1,226,705 | | | $ | 16,542,153 | |
| Sales: | | | | | | | | | | | | | | | | |
| Non-Government | | $ | 706,064 | | | $ | 5,089,766 | | | $ | — | | | $ | 2,757,479 | |
| Government | | | — | | | | 44,268,201 | | | | 3,427,212 | | | | 13,376,076 | |
| Total Sales | | $ | 706,064 | | | $ | 49,357,967 | | | $ | 3,427,212 | | | $ | 16,133,555 | |
Note 6—line of credit
Each of the Accounts, except the Money Market Account, participates in a $1.5 billion unsecured revolving credit facility that can be used for temporary purposes, including, without limitation, the funding of participant withdrawals. This facility expired June 2013. A new facility was entered into on June 25, 2013 expiring June 24, 2014. Certain affiliated accounts and mutual funds, each of which is managed by TCIM, or an affiliate of TCIM, also participate in this facility. An annual commitment fee for the credit facility is borne by the participating accounts and mutual funds on a pro rata basis. Interest associated with any borrowing under the facility is charged to the borrowing accounts at a specified rate of interest. The Accounts are not liable for borrowings under the facility by other affiliated accounts or mutual funds. For the year ended December 31, 2013, there were no borrowings under this credit facility by the Accounts.
Note 7—indemnification
In the normal course of business, each Account enters into contracts that contain a variety of representations and warranties and that provide general indemnities. An Account’s maximum exposure under these arrangements is unknown, as this would involve future claims against the Account that have not yet occurred. Also, under the Accounts’ organizational documents, the trustees and officers of the Accounts are
| College Retirement Equities Fund ■ 2013 Annual Report | 93 |
| Notes to financial statements | concluded |
indemnified against certain liabilities that may arise out of their duties to the Accounts. However, based on experience, the Accounts expect the risk of loss due to these warranties and indemnities to be unlikely.
| 94 | 2013 Annual Report ■ College Retirement Equities Fund |
Report of independent registered public accounting firm
To the Board of Trustees and Participants of the College Retirement Equities Fund:
In our opinion, the accompanying statements of assets and liabilities, including the summary portfolios of investments, and the related statements of operations and of changes in net assets and the financial highlights present fairly, in all material respects, the financial position of the Stock Account, Global Equities Account, Growth Account, Equity Index Account, Bond Market Account, Inflation-Linked Bond Account, Social Choice Account, and Money Market Account (constituting the College Retirement Equities Fund, hereafter collectively referred to as the “Accounts”) at December 31, 2013, the results of each of their operations for the year then ended, the changes in each of their net assets for each of the two years in the period then ended and the financial highlights for each of the five years in the period then ended, in conformity with accounting principles generally accepted in the United States of America. These financial statements and financial highlights (hereafter referred to as “financial statements”) are the responsibility of the Accounts’ management; our responsibility is to express an opinion on these financial statements based on our audits. We conducted our audits of these financial statements in accordance with the standards of the Public Company Accounting Oversight Board (United States). Those standards require that we plan and perform the audit to obtain reasonable assurance about whether the financial statements are free of material misstatement. An audit includes examining, on a test basis, evidence supporting the amounts and disclosures in the financial statements, assessing the accounting principles used and significant estimates made by management, and evaluating the overall financial statement presentation. We believe that our audits, which included confirmation of securities at December 31, 2013 by correspondence with the custodian and brokers, provide a reasonable basis for our opinion.
/s/ PricewaterhouseCoopers LLP
Baltimore, Maryland
February 19, 2014
| College Retirement Equities Fund ■ 2013 Annual Report | 95 |
2013 annual meeting (unaudited)
College Retirement Equities Fund
Trustees
On July 16, 2013, at an annual meeting of CREF participants, the following persons were elected to serve on the Board of Trustees:
| Nominee | | Dollars for | | | Percent | | | Dollars against | | | Percent | | | Dollars abstain | | | Percent | |
| Forrest Berkley | | | 20,461,942,634.820 | | | | 92.392 | | | | 680,461,761.030 | | | | 3.072 | | | | 1,004,504,789.800 | | | | 4.536 | |
| Nancy A. Eckl | | | 20,552,439,381.170 | | | | 92.800 | | | | 635,204,710.350 | | | | 2.868 | | | | 959,265,094.130 | | | | 4.331 | |
| Michael A. Forrester | | | 20,334,602,375.120 | | | | 91.817 | | | | 735,337,265.720 | | | | 3.320 | | | | 1,076,969,544.810 | | | | 4.863 | |
| Howell E. Jackson | | | 20,504,596,600.060 | | | | 92.584 | | | | 667,762,618.930 | | | | 3.015 | | | | 974,549,966.660 | | | | 4.400 | |
| Nancy L. Jacob | | | 20,417,026,791.690 | | | | 92.189 | | | | 778,634,535.970 | | | | 3.516 | | | | 951,247,857.990 | | | | 4.295 | |
| Thomas J. Kenny | | | 20,240,219,357.640 | | | | 91.391 | | | | 872,802,417.160 | | | | 3.941 | | | | 1,033,887,410.850 | | | | 4.668 | |
| Bridget A. Macaskill | | | 20,505,020,796.840 | | | | 92.586 | | | | 669,334,519.730 | | | | 3.022 | | | | 972,553,869.080 | | | | 4.391 | |
| James M. Poterba | | | 20,616,630,196.390 | | | | 93.090 | | | | 587,601,924.840 | | | | 2.653 | | | | 942,677,064.420 | | | | 4.256 | |
| Maceo K. Sloan | | | 20,323,027,489.420 | | | | 91.765 | | | | 798,921,439.950 | | | | 3.607 | | | | 1,024,960,256.280 | | | | 4.628 | |
| Laura T. Starks | | | 20,677,472,228.410 | | | | 93.365 | | | | 553,467,962.050 | | | | 2.499 | | | | 915,968,995.190 | | | | 4.136 | |
Forrest Berkley, Nancy A. Eckl, Michael A. Forrester, Howell E. Jackson, Nancy L. Jacob, Thomas J. Kenny, Bridget A. Macaskill, James M. Poterba, Maceo K. Sloan and Laura T. Starks continued in office.
Independent registered public accounting firm
At that same meeting, CREF participants also ratified PricewaterhouseCoopers LLP to serve as the Accounts’ independent registered public accounting firm:
| Account | | Dollars for | | | Percent | | | Dollars against | | | Percent | | | Dollars abstain | | | Percent | |
| Overall CREF Accounts | | | 20,901,418,148.350 | | | | 94.376 | | | | 435,167,655.010 | | | | 1.965 | | | | 810,323,382.290 | | | | 3.659 | |
The results above were certified by ComputerShare Fund Services, Inc., independent tabulator for the College Retirement Equities Fund.
| 96 | 2013 Annual Report ■ College Retirement Equities Fund |
Trustees and officers (unaudited)
College Retirement Equities Fund ■ December 31, 2013
Trustees
Name, address and
date of birth (“DOB”) | | Position(s)
held with
CREF | | Term of
office and
length
of time
served | | Principal occupation(s) during past 5 years | | Number of
portfolios in
fund complex
overseen
by Trustee | | Other directorship(s) held by Trustee |
Forrest Berkley
c/o Corporate Secretary
730 Third Avenue
New York, NY 10017-3206
DOB: 4/25/54 | | Trustee | | One-year term. Trustee since 2006. | | Retired Partner (since 2006), Former Partner (1990–2005) and Head of Global Product Management (2003–2005), GMO (formerly, Grantham, Mayo, Van Otterloo & Co.) (investment management); and member of asset allocation portfolio management team, GMO (2003–2005). | | 78 | | Director of GMO; Director, the Maine Coast Heritage Trust; Investment Committee member, Maine Community Foundation and the Elmina B. Sewall Foundation, and Director of the Maine Chapter of the Nature Conservancy. |
Nancy A. Eckl
c/o Corporate Secretary
730 Third Avenue
New York, NY 10017-3206
DOB: 10/6/62 | | Trustee | | One year term. Trustee since 2007. | | Vice President (1990–2006), American Beacon Advisors, Inc., and Vice President of certain funds advised by American Beacon Advisors, Inc. | | 78 | | Independent Director, The Lazard Funds, Inc., Lazard Retirement Series, Inc., Lazard Global Total Return and Income Fund, Inc. and Lazard World Dividend & Income Fund, Inc.; Independent Member of the Boards of Lazard Alternative Strategies Fund, LLC and Lazard Alternative Strategies 1099 Fund. |
Michael A. Forrester
c/o Corporate Secretary
730 Third Avenue
New York, NY 10017-3206
DOB: 11/5/67 | | Trustee | | One year term. Trustee since 2007. | | Chief Operating Officer, Copper Rock Capital Partners, LLC (since 2007); Chief Operating Officer, DDJ Capital Management (2003–2006). | | 78 | | Director of Copper Rock Capital Partners, LLC (investment adviser). |
| College Retirement Equities Fund ■ 2013 Annual Report | 97 |
| Trustees and officers (unaudited) | continued |
College Retirement Equities Fund ■ December 31, 2013
Trustees — continued
Name, address and
date of birth (“DOB”) | | Position(s)
held with
CREF | | Term of
office and
length
of time
served | | Principal occupation(s) during past 5 years | | Number of
portfolios in
fund complex
overseen
by Trustee | | Other directorship(s) held by Trustee |
Howell E. Jackson
c/o Corporate Secretary
730 Third Avenue
New York, NY 10017-3206
DOB: 1/4/54 | | Chairman of the Board and Trustee | | One-year term. Trustee since 2005; Chairman for term ending December 31, 2015. Chairman since 2013. | | James S. Reid, Jr. Professor of Law (since 2004), Senior Advisor to the President and Provost (2010–2012), Acting Dean (2009), Vice Dean for Budget (2003–2006) and on the faculty (since 1989) of Harvard Law School. | | 78 | | Director, D2D Fund. |
Nancy L. Jacob
c/o Corporate Secretary
730 Third Avenue
New York, NY 10017-3206
DOB: 1/15/43 | | Trustee | | One-year term. Trustee since 1979. | | Principal, NL Jacob Consultant (economic and business consultant) (2012–present). President and Founder (2006–2012) of NLJ Advisors, Inc. (investment adviser); President and Managing Principal, Windermere Investment Associates (1997–2006). | | 78 | | None |
Thomas J. Kenny
c/o Corporate Secretary
730 Third Avenue
New York, NY 10017-3206
DOB: 3/27/63 | | Trustee | | One-year term. Trustee since 2011. | | Partner (2004–2010) and Managing Director (1999–2010), Goldman Sachs Asset Management. | | 78 | | Director, Sansum Clinic; Investment committee member, College of Mount Saint Vincent and Cottage Health System; Member, United States Olympics Paralympics Advisory Committee, University of California at Santa Barbara Arts and Lectures Advisory Council; Trustee and Treasurer, Crane County Day School. |
| 98 | 2013 Annual Report ■ College Retirement Equities Fund |
Bridget A. Macaskill
c/o Corporate Secretary
730 Third Avenue
New York, NY 10017-3206
DOB: 8/5/48 | | Trustee | | One-year term. Trustee since 2003. | | Chief Executive Officer (since 2010), President and Chief Operating Officer (since 2009), First Eagle Investment Management, LLC; Former Principal, BAM Consulting LLC (2003–2009); Former Independent Consultant for Merrill Lynch (2003–2009). | | 78 | | Director, Arnhold and S. Bleichroeder Holdings; First Eagle Investment Management, LLC; American Legacy Foundation (Investment Committee); University of Edinburgh (Campaign Board); the North Shore Land Alliance and Close Brothers Group plc. |
James M. Poterba
c/o Corporate Secretary
730 Third Avenue
New York, NY 10017-3206
DOB: 7/13/58 | | Trustee | | One-year term. Trustee since 2006. | | President and Chief Executive Officer, National Bureau of Economic Research (“NBER”) (since 2008); Mitsui Professor of Economics, Massachusetts Institute of Technology (“MIT”) (since 1996), Former Head (2006–2008) and Associate Head (1994–2000 and 2001–2006), Economics Department of MIT; and Former Program Director, NBER (1990–2008). | | 78 | | Director, The Alfred P. Sloan Foundation and National Bureau of Economic Research; Member, Congressional Budget Office Panel of Economic Advisers. |
Maceo K. Sloan
c/o Corporate Secretary
730 Third Avenue
New York, NY 10017-3206
DOB: 10/18/49 | | Trustee | | One-year term. Trustee since 1991. | | Chairman, President and Chief Executive Officer, Sloan Financial Group, Inc. (since 1991); Chairman and Chief Executive Officer (since 1991) and Chief Investment Officer (1991–2013), NCM Capital Management Group, Inc.; Chairman and Chief Executive Officer (since 2003) and Chief Investment Officer (2003–2013), NCM Capital Advisers Inc.; and Chairman, President and Principal Executive Officer, NCM Capital Investment Trust (2007–2012). | | 78 | | Director, SCANA Corporation (energy holding company); Member, Duke Children’s Hospital and Health Center National Board of Advisors. |
| College Retirement Equities Fund ■ 2013 Annual Report | 99 |
| Trustees and officers (unaudited) | continued |
College Retirement Equities Fund ■ December 31, 2013
Trustees — concluded
Name, address and
date of birth (“DOB”) | | Position(s)
held with
CREF | | Term of
office and
length
of time
served | | Principal occupation(s) during past 5 years | | Number of
portfolios in
fund complex
overseen
by Trustee | | Other directorship(s) held by Trustee |
Laura T. Starks
c/o Corporate Secretary
730 Third Avenue
New York, NY 10017-3206
DOB: 2/17/50 | | Trustee | | One-year term. Trustee since 2006. | | Associate Dean for Research (since 2011), McCombs School of Business, University of Texas at Austin (“McCombs”), and Director, AIM Investment Center at McCombs (since 2000). Charles E. and Sarah M. Seay Regents Chair in Finance (since 2002); Professor, University of Texas at Austin (since 1987). Chairman, Department of Finance, University of Texas at Austin (2002–2011). | | 78 | | Member of the Board of Governors of the Investment Company Institute, the Governing Council of Independent Directors Council (an association for mutual fund directors), and Investment Advisory Committee, Employees Retirement System of Texas. |
| 100 | 2013 Annual Report ■ College Retirement Equities Fund |
Officers
Name, address and
date of birth (“DOB”) | | Position(s)
held with
CREF | | Term of
office and
length
of time
served | | Principal occupation(s) during past 5 years |
Brandon Becker
TIAA-CREF
730 Third Avenue
New York, NY 10017-3206
DOB: 3/19/54 | | Executive Vice President and Chief Legal Officer | | One year term. Executive Vice President and Chief Legal Officer since 2009. | | Executive Vice President and Chief Legal Officer of Teachers Insurance and Annuity Association of America (“TIAA”), and College Retirement Equities Fund (“CREF”), TIAA Separate Account VA-1, TIAA-CREF Funds, and TIAA-CREF Life Funds (collectively, the “TIAA-CREF Fund Complex”) (since 2009). Partner, Wilmer Cutler Pickering Hale & Dorr LLP (1996–2009). |
Richard S. Biegen
TIAA-CREF
730 Third Avenue
New York, NY 10017-3206
DOB: 5/8/62 | | Chief Compliance Officer | | One-year term. Vice President and Chief Compliance Officer since 2008. | | Chief Compliance Officer of the TIAA-CREF Fund Complex and TIAA Separate Account VA-3 (since 2008). Vice President, Senior Compliance Officer (2008–2011) and Managing Director, Senior Compliance Officer (since 2011) of Asset Management Compliance of TIAA. Chief Compliance Officer of TIAA-CREF Investment Management, LLC (“Investment Management”) (since 2008). Chief Compliance Officer (2008), Vice President, Senior Compliance Officer (2008–2011) and Managing Director, Senior Compliance Officer (since 2011) of Teachers Advisors, Inc. (“Advisors”). Managing Director and Senior Compliance Officer of TIAA-CREF Alternatives Advisors, LLC (“TCAA”) (since 2011). Managing Director and Senior Compliance Officer of TIAA-CREF Alternatives Services, LLC (“TCAS”) (since 2011). Interim Chief Compliance Officer for TIAA-CREF Life Insurance Company Separate Accounts VA-1, VLI-I and VLI-2 (since 2013). Interim Chief Compliance Officer for Covariance Capital Management, Inc. (“Covariance”) (since 2013). |
Carol Deckbar
TIAA-CREF
730 Third Avenue
New York, NY 10017-3206
DOB: 9/13/62 | | Executive Vice President | | One-year term. Executive Vice President since 2013. | | Executive Vice President (since 2013), Chief Operating Officer (“COO”) of Asset Management (since 2012) of TIAA and Executive Vice President of the TIAA-CREF Fund Complex (since 2013). Interim Head of Asset Management, TIAA (2012–2013). Senior Vice President, Investment Products, TIAA (2009–2012). Managing Director, Mutual Fund Products, TIAA (2007–2009). Senior Managing Director, President, and COO of Advisors and Investment Management (since 2012). Director of Advisors (since 2008). Manager, President, and COO of TCAA and TCAS (since 2011). Director (since 2011) of TIAA-CREF Asset Management (“TCAM”). Manager of TIAA-CREF Individual and Institutional Services, LLC (since 2010). Director of Westchester Group Investment Management, Inc. (since 2011). Manager of Beaver Investment Holdings, LLC (since 2012). Director of GreenWood Resources, Inc. (since 2012). Director of TH RE Administration Ltd., TH RE FCACO Ltd., TH RE AIFM group Ltd, and TH RE Group Holdings Ltd. (since 2013). |
| College Retirement Equities Fund ■ 2013 Annual Report | 101 |
| Trustees and officers (unaudited) | continued |
College Retirement Equities Fund ■ December 31, 2013
Officers — continued
Name, address and
date of birth (“DOB”) | | Position(s)
held with
CREF | | Term of
office and
length
of time
served | | Principal occupation(s) during past 5 years |
Roger W. Ferguson, Jr.
TIAA-CREF
730 Third Avenue
New York, NY 10017-3206
DOB: 10/28/51 | | President and Chief Executive Officer | | One-year term. President and Chief Executive Officer since 2008. | | President and Chief Executive Officer of TIAA, CREF and TIAA Separate Account VA-1 (since 2008). Principal Executive Officer and President of the TIAA-CREF Funds and TIAA-CREF Life Funds (2012–2013). Director of Covariance Capital Management, Inc. (“Covariance”) (since 2010). Chairman, Head of Financial Services and Member of the Executive Committee, Swiss Re America Holding Corporation (2006–2008); Vice Chairman and Member of the Board of Governors of the United States Federal Reserve System (1997–2006). |
Phillip G. Goff
TIAA-CREF
730 Third Avenue
New York, NY 10017-3206
DOB: 11/22/63 | | Treasurer | | One-year term. Treasurer since 2008. | | Treasurer of CREF (since 2008); Principal Financial Officer, Principal Accounting Officer and Treasurer of the TIAA-CREF Funds and TIAA-CREF Life Funds (since 2007) and Chief Financial Officer and Principal Accounting Officer (since 2009) and Treasurer (since 2008) of TIAA Separate Account VA-1. Senior Vice President (since 2010) and Funds Treasurer (since 2006) of TIAA. Director of Advisors (since 2008). Director of TIAA-CREF Asset Management (“TCAM”) (since 2011). Senior Vice President (since 2010) and Funds Treasurer (since 2007) of Advisors and Investment Management. Assistant Treasurer of TIAA-CREF Life Insurance Company (“TC Life”) (since 2012). Director of TIAA-CREF Trust Company, FSB (“Trust”) (since 2008). Director, Senior Vice President and Funds Treasurer of TCAA (since 2011). Director, Senior Vice President and Funds Treasurer of TCAS (since 2011). |
Stephen Gruppo
TIAA-CREF
730 Third Avenue
New York, NY 10017-3206
DOB: 9/25/59 | | Executive Vice President | | One-year term. Executive Vice President since 2009. | | Executive Vice President, Chief Risk Officer (since 2013) of TIAA and Executive Vice President of the TIAA-CREF Fund Complex (since 2009). Executive Vice President, Head of Risk Management of TIAA (2009–2013). Executive Vice President, Risk Management (since 2009), Senior Managing Director of Advisors and Investment Management (2006–2009) and Head of Credit Risk Management of Advisors and Investment Management (2005–2006). Senior Managing Director, Acting Head of Risk Management of TIAA and Senior Managing Director of the TIAA-CREF Fund Complex (2008–2009). Executive Vice President, Risk Management of TCAA (since 2011). Executive Vice President, Risk Management of TCAS (since 2011). Senior Managing Director, Chief Credit Risk Officer (2004–2008) of TIAA. |
| 102 | 2013 Annual Report ■ College Retirement Equities Fund |
Robert G. Leary
TIAA-CREF
730 Third Avenue
New York, NY 10017-3206
DOB: 3/20/61 | | Executive Vice President | | One-year term. Executive Vice President since 2013. | | President and Principal Executive Officer of the TIAA-CREF Funds and TIAA-CREF Life Funds (since 2013). Executive Vice President and President of Asset Management (since 2013) of TIAA and Executive Vice President of CREF and VA-1 (since 2013). Director, President & CEO of Advisors (since 2013). Manager, President & CEO of Investment Management (since 2013). Director of TH RE Ltd (since 2013). Director, President & CEO of TPIS (since 2013). Director of TIAA International Holdings 1 Ltd, TIAA International Holdings 2 Ltd, and TIAA International Holdings 3 Ltd (since 2013). Director, President & CEO of TCAM, Inc. (since 2013). Former Executive Vice President of TIAA-CREF Funds and TIAA-CREF Life Funds (June-September 2013). Former Representative, Securities Research, Inc. (February-May 2013). President and Chief Operating Officer, U.S., ING Americas (2011–2012). Chief Executive Officer, ING Insurance US (2010–2011). Chairman and Chief Executive Officer, ING Investment Management, Americas (2007–2009). Executive Vice President, AIG Financial Products Corp. (1995–2007). |
Ronald R. Pressman
TIAA-CREF
730 Third Avenue
New York, NY 10017-3206
DOB: 4/11/58 | | Executive Vice President | | One-year term. Executive Vice President since 2012. | | Executive Vice President and Chief Operating Officer (since 2012) of TIAA, and Executive Vice President of the TIAA-CREF Funds Complex (since 2012). Director, Covariance (since 2012). Manager, TIAA-CREF Life Insurance Company (since 2012). Manager, Kaspick & Company, LLC (“Kaspick”) (since 2012). President and Chief Executive Officer of General Electric Capital Real Estate (2007–2011). |
Phillip T. Rollock
TIAA-CREF
730 Third Avenue
New York, NY 10017-3206
DOB: 3/31/62 | | Senior Managing Director and Corporate Secretary | | One-year term. Senior Managing Director and Corporate Secretary since 2012. | | Senior Managing Director and Corporate Secretary of TIAA and the TIAA-CREF Fund Complex (since 2012). Senior Vice President of TIAA and the TIAA-CREF Fund Complex (2012–2013). Managing Director, Retirement and Individual Financial Services (2010–2012) and Vice President, Product Development and Management, Institutional Client Services (2006–2010) of TIAA. |
Otha T. Spriggs, III
TIAA-CREF
730 Third Avenue
New York, NY 10017-3206
DOB: 2/16/51 | | Executive Vice President | | One-year term. Executive Vice President since 2012. | | Executive Vice President and Chief Human Resources Officer (since 2012) of TIAA and Executive Vice President of the TIAA-CREF Fund Complex (since 2012). Senior Vice President of Human Resources, Boston Scientific (2010–2012); President of Integrated People Solutions (2009–2010); Senior Vice President, Human Resources and various human resources leadership roles, CIGNA Corp. (2001–2009). |
| College Retirement Equities Fund ■ 2013 Annual Report | 103 |
| Trustees and officers (unaudited) | concluded |
College Retirement Equities Fund ■ December 31, 2013
Officers — concluded
Name, address and
date of birth (“DOB”) | | Position(s)
held with
CREF | | Term of
office and
length
of time
served | | Principal occupation(s) during past 5 years |
Edward D. Van Dolsen
TIAA-CREF
730 Third Avenue
New York, NY 10017-3206
DOB: 4/21/58 | | Executive Vice President | | One-year term. Executive Vice President since 2006. | | Executive Vice President, President of Retirement and Individual Financial Services (since 2011) of TIAA, and Executive Vice President (since 2008) of the TIAA-CREF Fund Complex. Chief Operating Officer (2010–2011), Executive Vice President, Product Development and Management (2009–2010), Executive Vice President, Institutional Client Services (2006–2009), Executive Vice President, Product Management (2005–2006),and Senior Vice President, Pension Products (2003–2005) of TIAA. Director of Covariance (since 2010). Director (since 2007), Chairman and President (since 2012) of TCT Holdings, Inc. Director (2007–2011) and Executive Vice President (2008–2010) of TCAM. Manager (since 2006), President and CEO (2006–2010) of Redwood. Director of Tuition Financing (2008–2009) and Executive Vice President of TC Life (2009–2010). |
Constance K. Weaver
TIAA-CREF
730 Third Avenue
New York, NY 10017-3206
DOB: 9/26/52 | | Executive Vice President | | One-year term. Executive Vice President since 2010. | | Executive Vice President, Chief Marketing Officer of TIAA and Executive Vice President of the TIAA-CREF Fund Complex (since 2010); Chief Communications Officer of TIAA (2010–2011). Senior Vice President, The Hartford Financial Services Group, Inc. (2008–2010). |
Virginia M. Wilson
TIAA-CREF
730 Third Avenue
New York, NY 10017-3206
DOB: 7/22/54 | | Executive Vice President, Chief Financial Officer and Principal Accounting Officer | | One-year term. Executive Vice President, Chief Financial Officer and Principal Accounting Officer since 2010. | | Executive Vice President, Chief Financial Officer of TIAA and Executive Vice President, Chief Financial Officer and Principal Accounting Officer of CREF (since 2010). Manager, Executive Vice President and Chief Financial Officer of Redwood (since 2010). Director, Executive Vice President and Chief Financial Officer of TCT Holdings, Inc. (since 2010) and Director of TCAM (2010–2011). Executive Vice President and Chief Financial Officer, Wyndham Worldwide Corporation 2006–2009); Executive Vice President and Chief Financial Officer, Cendant Corporation (2003–2006). |
Please note that CREF’s Statement of Additional Information (SAI) includes additional information about CREF’s trustees and is available, without charge, through our website, tiaa-cref.org, or by telephone at 877 518-9161.
| 104 | 2013 Annual Report ■ College Retirement Equities Fund |
Additional information about index providers (unaudited)
Russell Indexes
The Russell 3000® Index is a trademark/service mark of the Russell Investment Group. The Russell Investment Group is the owner of the copyrights relating to the Russell Indexes and is the source and owner of the data contained or reflected in the performance values relating to the Russell Indexes. The accounts are not promoted by, nor in any way affiliated with, the Russell Investment Group. The Russell Investment Group is not responsible for and has not reviewed the accounts nor any associated literature or publications and the Russell Investment Group makes no representation or warranty, express or implied, as to their accuracy, or completeness.
Russell reserves the right, at any time and without notice, to alter, amend, terminate or in any way change the Russell Indexes. Russell has no obligation to take the needs of any particular account or its participants or any other product or person into consideration in determining, composing or calculating any of the Russell Indexes.
Russell’s publication of the Russell Indexes in no way suggests or implies an opinion by Russell as to the attractiveness or appropriateness of investment in any or all securities upon which the Russell Indexes are based. RUSSELL MAKES NO REPRESENTATION, WARRANTY OR GUARANTEE REGARDING THE USE OR THE RESULTS OF USE OF THE RUSSELL INDEXES OR ANY DATA INCLUDED THEREIN, OR ANY SECURITIES (OR COMBINATION THEREOF) COMPRISING THE RUSSELL INDEXES. RUSSELL MAKES NO OTHER EXPRESS OR IMPLIED WARRANTY, AND EXPRESSLY DISCLAIMS ANY WARRANTY, OF ANY KIND, INCLUDING WITHOUT LIMITATION, ANY WARRANTY OF MERCHANTABILITY OR FITNESS FOR A PARTICULAR PURPOSE WITH RESPECT TO THE RUSSELL INDEX(ES) OR ANY DATA OR ANY SECURITY (OR COMBINATION THEREOF) INCLUDED THEREIN.
MSCI Indexes
The accounts are not sponsored, endorsed, sold or promoted by MSCI Inc. (“MSCI”), any of its affiliates, any of its information providers or any other third party involved in, or related to, compiling, computing or creating any MSCI index (collectively, the “MSCI Parties”). The MSCI indexes are the exclusive property of MSCI. MSCI and the MSCI index names are service mark(s) of MSCI or its affiliates and have been licensed for use for certain purposes by Teachers Advisors, Inc. None of the MSCI parties makes any representation or warranty, express or implied, to the issuer or owners of these accounts or any other person or entity regarding the advisability of investing in accounts generally or in these accounts particularly or the ability of any MSCI index to track corresponding stock market performance. MSCI or its affiliates are the licensors of certain trademarks, service marks and trade names and of the MSCI indexes which are determined, composed and calculated by MSCI without regard to these accounts or the issuer or owners of these accounts or any other person or entity. None of the MSCI parties has any obligation to take the needs of the issuer or owners of these accounts or any other person or entity into consideration in determining, composing or calculating the MSCI indexes. None of the MSCI parties is responsible for or has participated in the determination of the timing of, prices at, or quantities of these accounts to be issued or in the determination or calculation of the equation by or the
| College Retirement Equities Fund ■ 2013 Annual Report | 105 |
| Additional information about index providers (unaudited) | concluded |
consideration into which these accounts is redeemable. Further, none of the MSCI parties has any obligation or liability to the issuer or owners of these accounts or any other person or entity in connection with the administration, marketing or offering of these accounts.
ALTHOUGH MSCI SHALL OBTAIN INFORMATION FOR INCLUSION IN OR FOR USE IN THE CALCULATION OF THE MSCI INDEXES FROM SOURCES THAT MSCI CONSIDERS RELIABLE, NONE OF THE MSCI PARTIES WARRANTS OR GUARANTEES THE ORIGINALITY, ACCURACY AND/OR THE COMPLETENESS OF ANY MSCI INDEX OR ANY DATA INCLUDED THEREIN. NONE OF THE MSCI PARTIES MAKES ANY WARRANTY, EXPRESS OR IMPLIED, AS TO RESULTS TO BE OBTAINED BY THE ISSUER OF THESE ACCOUNTS, OWNERS OF THESE ACCOUNTS, OR ANY OTHER PERSON OR ENTITY, FROM THE USE OF ANY MSCI INDEX OR ANY DATA INCLUDED THEREIN. NONE OF THE MSCI PARTIES SHALL HAVE ANY LIABILITY FOR ANY ERRORS, OMISSIONS OR INTERRUPTIONS OF OR IN CONNECTION WITH ANY MSCI INDEX OR ANY DATA INCLUDED THEREIN. FURTHER, NONE OF THE MSCI PARTIES MAKES ANY EXPRESS OR IMPLIED WARRANTIES OF ANY KIND, AND THE MSCI PARTIES HEREBY EXPRESSLY DISCLAIM ALL WARRANTIES OF MERCHANTABILITY AND FITNESS FOR A PARTICULAR PURPOSE, WITH RESPECT TO EACH MSCI INDEX AND ANY DATA INCLUDED THEREIN. WITHOUT LIMITING ANY OF THE FOREGOING, IN NO EVENT SHALL ANY OF THE MSCI PARTIES HAVE ANY LIABILITY FOR ANY DIRECT, INDIRECT, SPECIAL, PUNITIVE, CONSEQUENTIAL OR ANY OTHER DAMAGES (INCLUDING LOST PROFITS) EVEN IF NOTIFIED OF THE POSSIBILITY OF SUCH DAMAGES.
No purchaser, seller or holder of these securities, products or accounts, or any other person or entity, should use or refer to any MSCI trade name, trademark or service mark to sponsor, endorse, market or promote these securities without first contacting MSCI to determine whether MSCI’s permission is required. Under no circumstances may any person or entity claim any affiliation with MSCI without the prior written permission of MSCI.
| 106 | 2013 Annual Report ■ College Retirement Equities Fund |
How to reach us
TIAA-CREF website
Account performance, personal account information and transactions, product descriptions, and information about investment choices and income options
tiaa-cref.org
24 hours a day, 7 days a week
Automated telephone service
Check account performance and accumulation balances, change allocations, transfer funds and verify credited premiums
800 842-2252
24 hours a day, 7 days a week
National contact center
Retirement saving and planning, income options and payments, beneficiary services and tax reporting
800 842-2252
8 a.m. to 10 p.m. (ET), Monday–Friday
9 a.m. to 6 p.m. (ET), Saturday
Planning and service center
TIAA-CREF mutual funds
800 223-1200
8 a.m. to 10 p.m. (ET), Monday–Friday
Insurance planning center
After-tax annuities and life insurance
For an existing policy or contract
800 223-1200
To apply for a new policy or contract
877 825-0411
8 a.m. to 8 p.m. (ET), Monday–Friday
For the hearing- or speech-impaired
800 842-2755
8 a.m. to 10 p.m. (ET), Monday–Friday
9 a.m. to 6 p.m. (ET), Saturday
TIAA-CREF brokerage services
Self-directed brokerage accounts for investing in stocks, bonds and mutual funds
800 927-3059
8 a.m. to 7 p.m. (ET), Monday–Friday
TIAA-CREF Trust Company, FSB
Asset management, trust administration, estate planning, planned giving and endowment management
888 842-9001
9 a.m. to 6 p.m. (ET), Monday–Friday
Advisor services
888 842-0318
8 a.m. to 7:30 p.m. (ET), Monday–Friday
You should carefully consider the investment objectives, risks, charges and expenses of any account before investing. For a prospectus that contains this and other important information, please visit tiaa-cref.org, or call 877 518-9161. Please read the prospectus carefully before investing. Investment, insurance and annuity products are not FDIC insured, are not bank guaranteed, are not bank deposits, are not insured by any federal government agency, are not a condition to any
banking service or activity, and may lose value. TIAA-CREF Brokerage Services is a division of TIAA-CREF Individual & Institutional Services, LLC. TIAA-CREF Individual & Institutional Services, LLC, and Teachers Personal Investors Services, Inc., members FINRA, distribute securities products. Insurance and annuity products are issued by TIAA-CREF Life Insurance Company, New York, NY. TIAA-CREF Trust Company, FSB provides trust services.
©2014 Teachers Insurance and Annuity Association of America—College Retirement Equities Fund (TIAA-CREF), 730 Third Avenue, New York, NY 10017-3206.
| 730 Third Avenue New York, NY 10017-3206 |

 | Printed on paper containing recycled fiber |
eDelivery will save trees, conserve paper and reduce mailbox clutter.
Sign up today at www.tiaa-cref.org/eDelivery
| 730 Third Avenue New York, NY 10017-3206 |
| Printed on paper containing recycled fiber |
| 730 Third Avenue New York, NY 10017-3206 |
Item 2. Code of Ethics.
2(a) The Board of Trustees of the College Retirement Equities Fund (the “Registrant”) has adopted a code of ethics for senior financial officers, including the Registrant’s principal executive officer, principal financial officer, principal accounting officer, or controller, and persons performing similar functions, in conformity with rules promulgated under the Sarbanes-Oxley Act of 2002.
2(b) No response required.
2(c) During the reporting period, there were no amendments to the code of ethics.
2(d) During the reporting period, there were no implicit or explicit waivers granted by the Registrant from any provision of the code of ethics.
2(e) Not applicable.
2(f) A copy of the current code of ethics is filed as an exhibit to this Form N-CSR.
Item 3. Audit Committee Financial Expert.
3(a)(1) The Registrant’s Board of Trustees has determined that the Registrant has at least one audit committee financial expert serving on its Audit and Compliance Committee.
3(a)(2) Nancy A. Eckl is the Registrant’s audit committee financial expert and is “independent” for purposes of Item 3 of Form N-CSR.
Item 4. Principal Accountant Fees and Services.
PricewaterhouseCoopers LLP (“PwC”) performs independent audits of the Registrant’s financial statements. To maintain auditor independence and avoid the appearance of conflicts of interest, the Registrant, as a policy, does not engage PwC for management advisory or consulting services.
4(a) Audit Fees.
For the fiscal years ended December 31, 2013 and December 31, 2012, PwC’s aggregate fees for the audit of the Registrant’s annual financial statements were $698,500 and $1,004,000, respectively.
4(b) Audit Related Fees.
For the fiscal years ended December 31, 2013 and December 31, 2012, PwC’s aggregate fees for services related to the performance of the audit of the Registrant’s annual financial statements were $0 and $0, respectively.
For the fiscal years ended December 31, 2013 and December 31, 2012, the Audit-Related Fees billed by PwC to Teachers Advisors, Inc. (“Advisors”) or to any entity controlling, controlled by or under common control with Advisors that provides ongoing services to the Registrant (collectively, “Fund Service Providers”) were $0 and $0, respectively.
4(c) Tax Fees.
For the fiscal years ended December 31, 2013 and December 31, 2012, PwC’s aggregate fees for tax services billed to the Registrant were $0 and $0, respectively.
For the fiscal years ended December 31, 2013 and December 31, 2012, PwC’s aggregate fees for tax services billed to the Fund Service Providers were $0 and $0, respectively.
4(d) All Other Fees.
For the fiscal years ended December 31, 2013 and December 31, 2012, PwC’s aggregate fees for all other services billed to the Registrant were $15,200 and $6,150, respectively.
For the fiscal years ended December 31, 2013 and December 31, 2012, PwC’s aggregate fees for all other services billed to the Fund Service Providers were $0 and $0, respectively.
4(e)(1) Preapproval Policy.
The Registrant’s audit and compliance committee (“Audit Committee”) has adopted a Preapproval Policy for External Audit Firm Services (the “Policy”). The Policy describes the types of services that may be provided by the independent auditor to the Registrant and certain of its affiliates without impairing the auditor’s independence. Under the Policy, the Audit Committee is required to preapprove all services to be performed by the Registrant’s independent auditor in order to ensure that such services do not impair the auditor’s independence.
The Policy requires the Audit Committee to: (i) appoint the independent auditor to perform the financial statements audit for the Registrant and certain of its affiliates, including approving the terms of the engagement, and (ii) preapprove the audit, audit-related, tax and other services to be provided by the independent auditor to the Registrant and certain of its affiliates and the fees to be charged for provision of such services from year to year.
4(e)(2) Services provided pursuant to paragraph (c)(7)(i)(C) of Rule 2-01 of Regulation S-X (the “de minimis exception”):
Audit-Related Fees:
There were no amounts that were approved by the Audit Committee pursuant to the de minimis exception for the fiscal years ended December 31, 2013 and December 31, 2012 on behalf of the Registrant.
There were no amounts that were approved by the Audit Committee pursuant to the de minimis exception for the fiscal years ended December 31, 2013 and December 31, 2012 on behalf of the Fund Service Providers that relate directly to the operations and financial reporting of the Registrant.
Tax Fees:
There were no amounts that were approved by the Audit Committee pursuant to the de minimis exception for the fiscal years ended December 31, 2013 and December 31, 2012 on behalf of the Registrant.
There were no amounts that were approved by the Audit Committee pursuant to the de minimis exception for the fiscal years ended December 31, 2013 and December 31, 2012 on behalf of the Fund Service Providers that relate directly to the operations and financial reporting of the Registrant.
All Other Fees:
There were no amounts that were approved by the Audit Committee pursuant to the de minimis exception for the fiscal years ended December 31, 2013 and December 31, 2012 on behalf of the Registrant.
There were no amounts that were approved by the Audit Committee pursuant to the de minimis exception for the fiscal years ended December 31, 2013 and December 31, 2012 on behalf of the Fund Service Providers that relate directly to the operations and financial reporting of the Registrant.
4(f) The percentage of hours expended by PwC’s engagement to audit the Registrant’s financial statements for the most recent fiscal year attributable to work performed by persons other than PwC’s full-time, permanent employees was less than 50%.
4(g) Non-Audit Fees for Related Entities.
For the fiscal years ended December 31, 2013 and December 31, 2012, aggregate non-audit fees billed to the Registrant and to its Fund Service Providers by PwC were $394,070 and $417,730, respectively.
4(h) The Registrant’s Audit Committee has considered whether the non-audit services that were rendered by PwC to the Registrant’s Fund Service Providers that were not pre-approved pursuant to paragraph (c)(7)(ii) of Rule 2-01 of Regulation S-X are compatible with maintaining PwC’s independence.
Item 5. Audit Committee of Listed Registrants.
Not Applicable.
Item 6. Schedule of Investments.
COLLEGE RETIREMENT EQUITIES FUND - Stock Account
COLLEGE RETIREMENT EQUITIES FUND
STOCK ACCOUNT
SCHEDULE OF INVESTMENTS
December 31, 2013
| | | | | | | | | | | MATURITY | | VALUE | |
| PRINCIPAL | | | | | ISSUER | | RATE | | DATE | | (000) | |
| BONDS - 0.0% | | | | | | | | | |
| | | | | | | | | | | | | | | | |
| CORPORATE BONDS - 0.0% | | | | | | | | | |
| | | | | | | | | | | | | | | | |
| CAPITAL GOODS - 0.0% | | | | | | | | | |
| $ | 31,135 | | | j,m | | PDG Realty S.A. Empreendimentos e Participacoes | | 0.000 | % | | 09/19/16 | | $ | 0 | ^ |
| | | | | | | TOTAL CAPITAL GOODS | | | | | | | | 0 | ^ |
| | | | | | | | | | | | | | | | |
| FOOD & STAPLES RETAILING - 0.0% | | | | | | | | | |
| | 800 | | | i,m | | Marfrig Alimentos S.A. | | 1.000 | | | 07/15/15 | | | 34 | |
| | | | | | | TOTAL FOOD & STAPLES RETAILING | | | | | | | | 34 | |
| | | | | | | | | | | | | | | | |
| REAL ESTATE - 0.0% | | | | | | | | | |
| | 22,147 | | | | | Kiwi Income Property Trust | | 8.950 | | | 12/20/14 | | | 19 | |
| | | | | | | TOTAL REAL ESTATE | | | | | | | | 19 | |
| | | | | | | | | | | | | | | | |
| | | | | | | TOTAL CORPORATE BONDS | | | | | | | | 53 | |
| | | | | | | (Cost $70) | | | | | | | | | |
| | | | | | | | | | | | | | | | |
| GOVERNMENT BONDS - 0.0% | | | | | | | | | |
| | | | | | | | | | | | | | | | |
| U.S. TREASURY SECURITIES - 0.0% | | | | | | | | | |
| | 300,000 | | | | | United States Treasury Note | | 1.750 | | | 05/15/22 | | | 277 | |
| | | | | | | TOTAL U.S. TREASURY SECURITIES | | | | | | | | 277 | |
| | | | | | | | | | | | | | | | |
| | | | | | | TOTAL GOVERNMENT BONDS | | | | | | | | 277 | |
| | | | | | | (Cost $303) | | | | | | | | | |
| | | | | | | | | | | | | | | | |
| | | | | | | TOTAL BONDS | | | | | | | | 330 | |
| | | | | | | (Cost $373) | | | | | | | | | |
| | | | | | | | | | | | | | | | |
| EQUITY-LINKED NOTES - 0.0% | | | | | | | | | |
| | | | | | | | | | | | | | | | |
| DIVERSIFIED FINANCIALS - 0.0% | | | | | | | | | |
| | 1,064,698 | | | * | | Deutsche Bank, John Keells | | 0.000 | | | 07/05/19 | | | 1,850 | |
| | | | | | | TOTAL DIVERSIFIED FINANCIALS | | | | | | | | 1,850 | |
| | | | | | | | | | | | | | | | |
| | | | | | | TOTAL EQUITY-LINKED NOTES | | | | | | | | 1,850 | |
| | | | | | | (Cost $1,904) | | | | | | | | | |
COLLEGE RETIREMENT EQUITIES FUND - Stock Account
| | | | | | | | VALUE | |
| SHARES | | | | | COMPANY | | (000) | |
| COMMON STOCKS - 99.5% | | | | |
| | | | | | | | | | | |
| AUTOMOBILES & COMPONENTS - 2.3% | | | | |
| | 104,085 | | | | | Actron Technology Corp | | $ | 386 | |
| | 72,500 | | | | | Aisan Industry Co Ltd | | | 698 | |
| | 480,155 | | | | | Aisin Seiki Co Ltd | | | 19,521 | |
| | 351,100 | | | e | | Akebono Brake Industry Co Ltd | | | 1,565 | |
| | 104,380 | | | | | Allison Transmission Holdings, Inc | | | 2,882 | |
| | 707,895 | | | * | | American Axle & Manufacturing Holdings, Inc | | | 14,476 | |
| | 211,675 | | | * | | Amtek Auto Ltd | | | 256 | |
| | 404,706 | | | * | | Amtek India Ltd | | | 421 | |
| | 604,335 | | | | | Apollo Tyres Ltd | | | 1,050 | |
| | 62,397 | | | | | ARB Corp Ltd | | | 654 | |
| | 17,561 | | | | | AtlasBX Co Ltd | | | 670 | |
| | 142,000 | | | e | | Autoliv, Inc | | | 13,036 | |
| | 71,600 | | | | | Autometal S.A. | | | 528 | |
| | 11,695 | | | | | Autoneum Holding AG. | | | 1,795 | |
| | 128,961 | | | | | Bajaj Holdings and Investment Ltd | | | 3,989 | |
| | 238,766 | | | | | Bayerische Motoren Werke AG. | | | 28,039 | |
| | 2,482 | | | | | Bayerische Motoren Werke AG. (Preference) | | | 212 | |
| | 800,093 | | | | | Bharat Forge Ltd | | | 4,250 | |
| | 497,989 | | | | | BorgWarner, Inc | | | 27,843 | |
| | 130,493 | | | | | Brembo S.p.A. | | | 3,510 | |
| | 939,838 | | | | | Bridgestone Corp | | | 35,608 | |
| | 3,635,900 | | | | | Brilliance China Automotive Holdings Ltd | | | 5,939 | |
| | 567,000 | | | *,e | | Byd Co Ltd | | | 2,787 | |
| | 408,000 | | | | | Calsonic Kansei Corp | | | 2,108 | |
| | 2,031,000 | | | e | | Chaowei Power Holdings Ltd | | | 1,071 | |
| | 1,671,734 | | | | | Cheng Shin Rubber Industry Co Ltd | | | 4,379 | |
| | 371,100 | | | | | China Motor Corp | | | 359 | |
| | 895,925 | | | | | Chongqing Changan Automobile Co Ltd | | | 1,768 | |
| | 80,668 | | | | | Cie Automotive S.A. | | | 888 | |
| | 171,045 | | | | | Compagnie Plastic-Omnium S.A. | | | 4,785 | |
| | 187,123 | | | | | Continental AG. | | | 41,109 | |
| | 239,893 | | | | | Cooper Tire & Rubber Co | | | 5,767 | |
| | 57,080 | | | | | Dae Won Kang Up Co Ltd | | | 404 | |
| | 28,000 | | | | | Daido Metal Co Ltd | | | 280 | |
| | 216,464 | | | | | Daihatsu Motor Co Ltd | | | 3,672 | |
| | 1,999,894 | | | | | Daimler AG. (Registered) | | | 173,560 | |
| | 829,491 | | | | | Dana Holding Corp | | | 16,275 | |
| | 4,393,538 | | | | | Delphi Automotive plc | | | 264,183 | |
| | 993,453 | | | | | Denso Corp | | | 52,483 | |
| | 396,000 | | | | | Depo Auto Parts Ind Co Ltd | | | 1,565 | |
| | 5,760 | | | | | Dong Ah Tire & Rubber Co Ltd | | | 104 | |
| | 6,318,700 | | | | | Dongfeng Motor Group Co Ltd | | | 9,923 | |
| | 87,800 | | | | | Dongyang Mechatronics Corp | | | 938 | |
| | 81,651 | | | * | | Dorman Products, Inc | | | 4,578 | |
COLLEGE RETIREMENT EQUITIES FUND - Stock Account
| | | | | | | | VALUE | |
| SHARES | | | | | COMPANY | | (000) | |
| | 698,900 | | | | | Double Coin Holdings Ltd | | $ | 504 | |
| | 1,038,300 | | | | | Drb-Hicom BHD | | | 895 | |
| | 150,849 | | | * | | Drew Industries, Inc | | | 7,723 | |
| | 49,000 | | | | | Eagle Industry Co Ltd | | | 816 | |
| | 37,221 | | | | | ElringKlinger AG. | | | 1,516 | |
| | 44,182 | | | | | Exedy Corp | | | 1,294 | |
| | 503,364 | | | *,e | | Faurecia | | | 19,204 | |
| | 105,700 | | | | | FCC Co Ltd | | | 2,108 | |
| | 886,945 | | | | | Federal Corp | | | 698 | |
| | 121,416 | | | * | | Federal Mogul Corp (Class A) | | | 2,389 | |
| | 793,441 | | | * | | Fiat S.p.A. | | | 6,494 | |
| | 6,405,234 | | | | | Ford Motor Co | | | 98,833 | |
| | 70,213 | | | | | Ford Otomotiv Sanayi AS | | | 742 | |
| | 25,819 | | | *,e | | Fox Factory Holding Corp | | | 455 | |
| | 51,413 | | | * | | Fuel Systems Solutions, Inc | | | 713 | |
| | 875,853 | | | | | Fuji Heavy Industries Ltd | | | 25,171 | |
| | 67,797 | | | * | | Futaba Industrial Co Ltd | | | 261 | |
| | 5,358,900 | | | e | | Geely Automobile Holdings Ltd | | | 2,602 | |
| | 722,689 | | | *,e,m | | General Motors Co | | | 0 | ^ |
| | 8,874,956 | | | * | | General Motors Co | | | 362,719 | |
| | 4,230,271 | | | *,e,m | | General Motors Co | | | 0 | ^ |
| | 35,983,677 | | | *,m | | General Motors Co | | | 0 | ^ |
| | 24,057,000 | | | *,m | | General Motors Co | | | 0 | ^ |
| | 26,439,191 | | | *,m | | General Motors Co | | | 0 | ^ |
| | 6,062,000 | | | *,m | | General Motors Co | | | 0 | ^ |
| | 40,684,487 | | | *,m | | General Motors Co | | | 0 | ^ |
| | 7,950,000 | | | *,m | | General Motors Co | | | 0 | ^ |
| | 85,268,000 | | | *,e,m | | General Motors Co | | | 0 | ^ |
| | 18,507,434 | | | *,m | | General Motors Co | | | 0 | ^ |
| | 821,314 | | | | | Gentex Corp | | | 27,095 | |
| | 104,207 | | | * | | Gentherm, Inc | | | 2,794 | |
| | 3,892,328 | | | | | GKN plc | | | 24,120 | |
| | 9,064 | | | | | Global & Yuasa Battery Co Ltd | | | 471 | |
| | 4,267 | | | | | Goodyear Lastikleri Turk AS. | | | 99 | |
| | 1,044,653 | | | | | Goodyear Tire & Rubber Co | | | 24,915 | |
| | 37,340 | | | | | Grammer AG. | | | 1,785 | |
| | 3,213,300 | | | e | | Great Wall Motor Co Ltd | | | 17,803 | |
| | 9,000 | | | | | G-Tekt Corp | | | 307 | |
| | 2,579,066 | | | e | | Guangzhou Automobile Group Co Ltd | | | 2,830 | |
| | 39,190 | | | | | Halla Climate Control Corp | | | 1,443 | |
| | 19,290 | | | | | Hanil E-Wha Co Ltd | | | 313 | |
| | 75,413 | | | | | Hankook Tire Co Ltd | | | 4,345 | |
| | 421,382 | | | | | Harley-Davidson, Inc | | | 29,176 | |
| | 95,821 | | | | | Hero Honda Motors Ltd | | | 3,218 | |
| | 1,962,997 | | | | | Honda Motor Co Ltd | | | 81,027 | |
| | 743,140 | | | | | Hota Industrial Manufacturing Co Ltd | | | 1,150 | |
| | 79,199 | | | | | Hu Lane Associate, Inc | | | 240 | |
| | 21,260 | | | | | Hwa Shin Co Ltd | | | 230 | |
COLLEGE RETIREMENT EQUITIES FUND - Stock Account
| | | | | | | | VALUE | |
| SHARES | | | | | COMPANY | | (000) | |
| | 94,536 | | | | | Hyundai Mobis | | $ | 26,319 | |
| | 331,479 | | | | | Hyundai Motor Co | | | 74,406 | |
| | 43,398 | | | | | Hyundai Motor Co Ltd (2nd Preference) | | | 5,375 | |
| | 37,606 | | | | | Hyundai Motor Co Ltd (Preference) | | | 4,461 | |
| | 32,336 | | | | | Hyundai Wia Corp | | | 5,836 | |
| | 46,900 | | | | | Icahn Enterprises LP | | | 5,131 | |
| | 250,133 | | | * | | IMMSI S.p.A. | | | 161 | |
| | 1,346,792 | | | | | Isuzu Motors Ltd | | | 8,400 | |
| | 1,724,841 | | | | | Johnson Controls, Inc | | | 88,484 | |
| | 172,896 | | | | | Kayaba Industry Co Ltd | | | 911 | |
| | 212,403 | | | | | Keihin Corp | | | 3,298 | |
| | 1,259,128 | | | | | Kenda Rubber Industrial Co Ltd | | | 2,809 | |
| | 722,911 | | | | | Kia Motors Corp | | | 38,496 | |
| | 58,000 | | | | | Kinugawa Rubber Industrial Co Ltd | | | 288 | |
| | 108,989 | | | | | Koito Manufacturing Co Ltd | | | 2,083 | |
| | 157,810 | | | * | | Kumho Tire Co, Inc | | | 1,723 | |
| | 952,356 | | | | | Lear Corp | | | 77,112 | |
| | 40,554 | | | | | Leoni AG. | | | 3,038 | |
| | 108,330 | | | | | Linamar Corp | | | 4,507 | |
| | 101,500 | | | | | Magna International, Inc - Class A (NY) | | | 8,329 | |
| | 443,138 | | | | | Magna International, Inc (Class A) | | | 36,335 | |
| | 396,859 | | | | | Mahindra & Mahindra Ltd | | | 6,065 | |
| | 141,700 | | | | | Mahle-Metal Leve S.A. Industria e Comercio | | | 1,646 | |
| | 36,039 | | | | | Mando Corp | | | 4,277 | |
| | 104,582 | | | e | | Martinrea International, Inc | | | 768 | |
| | 13,214,142 | | | * | | Mazda Motor Corp | | | 68,476 | |
| | 160,194 | | | | | Metair Investments Ltd | | | 605 | |
| | 257,641 | | | | | Michelin (C.G.D.E.) (Class B) | | | 27,413 | |
| | 1,272,000 | | | | | Minth Group Ltd | | | 2,647 | |
| | 36,400 | | | | | Mitsuba Corp | | | 592 | |
| | 596,796 | | | *,e | | Mitsubishi Motors Corp | | | 6,421 | |
| | 187,133 | | | * | | Modine Manufacturing Co | | | 2,399 | |
| | 21,254 | | | | | Montupet | | | 940 | |
| | 401,157 | | | | | Motherson Sumi Systems Ltd | | | 1,185 | |
| | 37,940 | | | | | Motonic Corp | | | 392 | |
| | 5,745 | | | | | MRF Ltd | | | 1,801 | |
| | 23,000 | | | | | Musashi Seimitsu Industry Co Ltd | | | 498 | |
| | 385,948 | | | * | | Nan Kang Rubber Tire Co Ltd | | | 479 | |
| | 1,317 | | | | | Nexen Corp | | | 97 | |
| | 41,427 | | | | | Nexen Tire Corp | | | 573 | |
| | 162,724 | | | | | NGK Spark Plug Co Ltd | | | 3,857 | |
| | 290,854 | | | | | NHK Spring Co Ltd | | | 3,286 | |
| | 99,451 | | | | | Nifco, Inc | | | 2,638 | |
| | 46,000 | | | | | Nippon Seiki Co Ltd | | | 891 | |
| | 3,942,104 | | | | | Nissan Motor Co Ltd | | | 33,035 | |
| | 102,941 | | | | | Nissan Shatai Co Ltd | | | 1,497 | |
| | 66,600 | | | | | Nissin Kogyo Co Ltd | | | 1,412 | |
| | 267,335 | | | | | NOK Corp | | | 4,379 | |
COLLEGE RETIREMENT EQUITIES FUND - Stock Account
| | | | | | | | VALUE | |
| SHARES | | | | | COMPANY | | (000) | |
| | 12,568 | | | | | Nokian Renkaat Oyj | | $ | 603 | |
| | 848,000 | | | *,m | | Norstar Founders Group Ltd | | | 0 | ^ |
| | 149,100 | | | | | Oriental Holdings BHD | | | 387 | |
| | 13,594 | | | | | Otokar Otobus Karoseri Sanayi AS | | | 348 | |
| | 84,100 | | | | | Pacific Industrial Co Ltd | | | 586 | |
| | 319,689 | | | *,e | | Peugeot S.A. | | | 4,160 | |
| | 180,127 | | | e | | Piaggio & C S.p.A. | | | 598 | |
| | 8,800 | | | * | | Piolax Inc | | | 347 | |
| | 51,412 | | | | | Pirelli & C S.p.A. | | | 889 | |
| | 54,728 | | | | | Porsche AG. | | | 5,713 | |
| | 212,436 | | | e | | Press Kogyo Co Ltd | | | 882 | |
| | 20,715,700 | | | | | PT Astra International Tbk | | | 11,602 | |
| | 4,602,500 | | | | | PT Gajah Tunggal Tbk | | | 637 | |
| | 39,963 | | | | | Pyeong Hwa Automotive Co Ltd | | | 814 | |
| | 9,498,000 | | | | | Qingling Motors Co Ltd | | | 2,846 | |
| | 54,725 | | | | | Remy International, Inc | | | 1,276 | |
| | 1,456,483 | | | | | Renault S.A. | | | 117,212 | |
| | 109,000 | | | | | Riken Corp | | | 475 | |
| | 32,910 | | | | | S&T Daewoo Co Ltd | | | 852 | |
| | 131,305 | | | * | | SAF-Holland S.A. | | | 1,958 | |
| | 142,000 | | | | | Sanden Corp | | | 675 | |
| | 51,300 | | | | | Sanoh Industrial Co Ltd | | | 358 | |
| | 777,920 | | | | | Sanyang Industry Co Ltd | | | 1,276 | |
| | 29,010 | | | | | Sejong Industrial Co Ltd | | | 419 | |
| | 24,433 | | | * | | Shiloh Industries, Inc | | | 476 | |
| | 52,500 | | | | | Showa Corp | | | 847 | |
| | 39,230 | | | | | SL Corp | | | 609 | |
| | 7,139 | | | * | | Societe Fonciere Financiere et de Participations FFP | | | 415 | |
| | 194,617 | | | | | Sogefi S.p.A. | | | 1,170 | |
| | 1,054,625 | | | | | Somboon Advance Technology PCL | | | 464 | |
| | 129,503 | | | | | Spartan Motors, Inc | | | 868 | |
| | 1,939,500 | | | | | Sri Trang Agro-Industry PCL (Foreign) | | | 770 | |
| | 48,450 | | | * | | Ssangyong Motor Co | | | 347 | |
| | 88,552 | | | | | Standard Motor Products, Inc | | | 3,259 | |
| | 280,053 | | | | | Stanley Electric Co Ltd | | | 6,420 | |
| | 152,619 | | | * | | Stoneridge, Inc | | | 1,946 | |
| | 195,152 | | | | | Sumitomo Rubber Industries, Inc | | | 2,778 | |
| | 26,745 | | | | | Sungwoo Hitech Co Ltd | | | 391 | |
| | 108,805 | | | | | Superior Industries International, Inc | | | 2,245 | |
| | 225,019 | | | | | Suzuki Motor Corp | | | 6,063 | |
| | 2,189,653 | | | | | T RAD Co Ltd | | | 5,959 | |
| | 24,000 | | | | | Tachi-S Co Ltd | | | 332 | |
| | 33,900 | | | | | Taiho Kogyo Co Ltd | | | 396 | |
| | 42,300 | | | | | Takata Corp | | | 1,214 | |
| | 247,400 | | | | | TAN Chong Motor Holdings BHD | | | 468 | |
| | 2,037,224 | | | | | Tata Motors Ltd | | | 12,460 | |
| | 22,200 | | | | | Teikoku Piston Ring Co Ltd | | | 377 | |
| | 426,549 | | | * | | Tenneco, Inc | | | 24,130 | |
COLLEGE RETIREMENT EQUITIES FUND - Stock Account
| | | | | | | | VALUE | |
| SHARES | | | | | COMPANY | | (000) | |
| | 207,831 | | | *,e | | Tesla Motors, Inc | | $ | 31,254 | |
| | 128,500 | | | | | Thai Stanley Electric PCL (ADR) | | | 815 | |
| | 69,635 | | | e | | Thor Industries, Inc | | | 3,846 | |
| | 2,606,000 | | | | | Tianneng Power International Ltd | | | 960 | |
| | 281,492 | | | | | Tofas Turk Otomobil Fabrik | | | 1,757 | |
| | 199,963 | | | | | Tokai Rika Co Ltd | | | 3,981 | |
| | 40,600 | | | | | Tokai Rubber Industries, Inc | | | 397 | |
| | 617,699 | | | | | Tong Yang Industry Co Ltd | | | 927 | |
| | 77,200 | | | | | Topre Corp | | | 1,144 | |
| | 112,990 | | | * | | Tower International, Inc | | | 2,418 | |
| | 325,000 | | | | | Toyo Tire & Rubber Co Ltd | | | 1,855 | |
| | 95,177 | | | | | Toyoda Gosei Co Ltd | | | 2,217 | |
| | 48,444 | | | | | Toyota Boshoku Corp | | | 606 | |
| | 168,021 | | | | | Toyota Industries Corp | | | 7,595 | |
| | 6,264,637 | | | | | Toyota Motor Corp | | | 381,987 | |
| | 502,094 | | | * | | TRW Automotive Holdings Corp | | | 37,351 | |
| | 118,600 | | | | | TS Tech Co Ltd | | | 4,003 | |
| | 14,700 | | | | | Tube Investments Of India | | | 37 | |
| | 155,089 | | | | | Tung Thih Electronic Co Ltd | | | 475 | |
| | 522,066 | | | | | TVS Motor Co Ltd | | | 641 | |
| | 526,682 | | | | | UMW Holdings BHD | | | 1,942 | |
| | 50,200 | | | | | Unipres Corp | | | 941 | |
| | 194,115 | | | | | Valeo S.A. | | | 21,512 | |
| | 124,495 | | | * | | Visteon Corp | | | 10,195 | |
| | 157,824 | | | | | Volkswagen AG. | | | 42,852 | |
| | 181,287 | | | | | Volkswagen AG. (Preference) | | | 51,018 | |
| | 129,033 | | | * | | Winnebago Industries, Inc | | | 3,542 | |
| | 2,145,400 | | | *,e | | Xinchen China Power Holdings Ltd | | | 1,443 | |
| | 1,112,000 | | | e | | Xingda International Holdings Ltd | | | 665 | |
| | 8,442,785 | | | e | | Xinyi Glass Holdings Co Ltd | | | 7,469 | |
| | 108,710 | | | | | Yamaha Motor Co Ltd | | | 1,634 | |
| | 301,000 | | | | | Yokohama Rubber Co Ltd | | | 2,960 | |
| | 247,300 | | | | | Yorozu Corp | | | 4,527 | |
| | 801,558 | | | | | Yulon Motor Co Ltd | | | 1,454 | |
| | | | | | | TOTAL AUTOMOBILES & COMPONENTS | | | 2,960,320 | |
| | | | | | | |
| BANKS - 5.9% | |
| | 64,210 | | | | | 1st Source Corp | | | 2,051 | |
| | 115,513 | | | e | | 1st United Bancorp, Inc | | | 879 | |
| | 997,030 | | | | | 77 Bank Ltd | | | 4,829 | |
| | 61,233 | | | * | | Aareal Bank AG. | | | 2,430 | |
| | 26,182 | | | | | Access National Corp | | | 391 | |
| | 57,082,000 | | | | | Agricultural Bank of China | | | 28,158 | |
| | 8,600 | | | | | Aichi Bank Ltd | | | 411 | |
| | 2,125,711 | | | | | Akbank TAS | | | 6,634 | |
| | 590,880 | | | * | | Albaraka Turk Katilim Bankasi AS | | | 424 | |
| | 78,152 | | | * | | Alior Bank S.A. | | | 2,109 | |
| | 11,900 | | | * | | Alior Bank S.A. (Allotment Certificate) | | | 319 | |
COLLEGE RETIREMENT EQUITIES FUND - Stock Account
| | | | | | | | VALUE | |
| SHARES | | | | | COMPANY | | (000) | |
| | 377,883 | | | * | | Allahabad Bank | | $ | 582 | |
| | 958,700 | | | | | Alliance Financial Group BHD | | | 1,394 | |
| | 1,748,739 | | | * | | Alpha Bank S.A. | | | 1,520 | |
| | 315,270 | | | *,m | | Amagerbanken AS | | | 0 | ^ |
| | 31,218 | | | | | American National Bankshares, Inc | | | 819 | |
| | 92,442 | | | * | | Ameris Bancorp | | | 1,951 | |
| | 35,465 | | | | | Ames National Corp | | | 794 | |
| | 180,854 | | | | | Andhra Bank | | | 184 | |
| | 10,440,576 | | | | | Aozora Bank Ltd | | | 29,587 | |
| | 126,670 | | | | | Apollo Residential Mortgage | | | 1,872 | |
| | 43,733 | | | e | | Arrow Financial Corp | | | 1,162 | |
| | 90,645 | | | | | Associated Banc-Corp | | | 1,577 | |
| | 341,156 | | | | | Astoria Financial Corp | | | 4,718 | |
| | 514,415 | | | * | | Asya Katilim Bankasi AS | | | 347 | |
| | 3,532,972 | | | | | Australia & New Zealand Banking Group Ltd | | | 101,991 | |
| | 390,721 | | | | | Awa Bank Ltd | | | 1,959 | |
| | 58,882 | | | e | | Banc of California, Inc | | | 790 | |
| | 1,140,734 | | | *,e | | Banca Carige S.p.A. | | | 697 | |
| | 11,206,752 | | | | | Banca Intesa S.p.A. | | | 27,565 | |
| | 1,332,465 | | | *,e | | Banca Monte dei Paschi di Siena S.p.A. | | | 321 | |
| | 433,288 | | | * | | Banca Popolare dell’Emilia Romagna Scrl | | | 4,134 | |
| | 8,154,507 | | | *,e | | Banca Popolare di Milano | | | 5,025 | |
| | 413,832 | | | | | Banca Popolare di Sondrio SCARL | | | 2,384 | |
| | 31,081 | | | | | Bancfirst Corp | | | 1,742 | |
| | 95,624 | | | | | Banche Popolari Unite Scpa | | | 648 | |
| | 66,697 | | | | | Banco ABC Brasil S.A. | | | 356 | |
| | 3,361,438 | | | | | Banco Bilbao Vizcaya Argentaria S.A. | | | 41,583 | |
| | 460,851 | | | *,e | | Banco BPI S.A. | | | 771 | |
| | 740,260 | | | | | Banco Bradesco S.A. | | | 10,025 | |
| | 3,220,086 | | | | | Banco Bradesco S.A. (Preference) | | | 39,815 | |
| | 16,714,098 | | | *,e | | Banco Comercial Portugues S.A. | | | 3,834 | |
| | 83,574 | | | | | Banco Davivienda S.A. | | | 1,025 | |
| | 43,500 | | | | | Banco Daycoval S.A. | | | 148 | |
| | 37,818,859 | | | | | Banco de Chile | | | 5,492 | |
| | 45,625 | | | | | Banco de Credito e Inversiones | | | 2,532 | |
| | 4,045,972 | | | | | Banco de Oro Universal Bank | | | 6,277 | |
| | 514,200 | | | e | | Banco de Sabadell S.A. | | | 1,343 | |
| | 881,222 | | | | | Banco do Brasil S.A. | | | 9,132 | |
| | 265,681 | | | | | Banco do Estado do Rio Grande do Sul | | | 1,419 | |
| | 4,769,536 | | | * | | Banco Espirito Santo S.A. | | | 6,811 | |
| | 157,300 | | | | | Banco Industrial e Comercial S.A. | | | 493 | |
| | 4,646,220 | | | | | Banco Itau Holding Financeira S.A. | | | 61,921 | |
| | 112,995 | | | | | Banco Latinoamericano de Exportaciones S.A. (Class E) | | | 3,166 | |
| | 114,800 | | | * | | Banco Panamericano S.A. | | | 223 | |
| | 61,700 | | | | | Banco Pine S.A. | | | 275 | |
| | 8,023,929 | | | * | | Banco Popolare Scarl | | | 15,367 | |
| | 1,755,730 | | | * | | Banco Popular Espanol S.A. | | | 10,605 | |
| | 1,409,144 | | | | | Banco Santander Brasil S.A. | | | 8,350 | |
COLLEGE RETIREMENT EQUITIES FUND - Stock Account
| | | | | | | | VALUE | |
| SHARES | | | | | COMPANY | | (000) | |
| | 4,220,651 | | | | | Banco Santander Central Hispano S.A. | | $ | 37,954 | |
| | 133,513,867 | | | | | Banco Santander Chile S.A. | | | 7,740 | |
| | 333,312 | | | | | BanColombia S.A. | | | 4,114 | |
| | 52,200 | | | e | | BanColombia S.A. (ADR) | | | 2,559 | |
| | 494,505 | | | | | BanColombia S.A. (Preference) | | | 6,006 | |
| | 370,886 | | | e | | Bancorpsouth, Inc | | | 9,428 | |
| | 92,900 | | | | | Bangkok Bank PCL | | | 506 | |
| | 362,600 | | | | | Bangkok Bank PCL (ADR) | | | 1,975 | |
| | 2,249,400 | | | | | Bangkok Bank PCL (Foreign) | | | 12,242 | |
| | 60,123 | | | | | Bank Handlowy w Warszawie S.A. | | | 2,083 | |
| | 1,128,849 | | | | | Bank Hapoalim Ltd | | | 6,325 | |
| | 176,946 | | | * | | Bank Leumi Le-Israel | | | 723 | |
| | 348,589 | | | * | | Bank Millennium S.A. | | | 826 | |
| | 180,152 | | | | | Bank Mutual Corp | | | 1,263 | |
| | 152,554 | | | | | Bank of Baroda | | | 1,597 | |
| | 126,510,000 | | | | | Bank of China Ltd | | | 58,400 | |
| | 20,501,472 | | | | | Bank of Communications Co Ltd | | | 14,508 | |
| | 4,349,184 | | | *,m | | Bank of Cyprus Public Co Ltd | | | 60 | |
| | 984,150 | | | | | Bank of East Asia Ltd | | | 4,178 | |
| | 98,150 | | | | | Bank of Georgia Holdings plc | | | 3,894 | |
| | 23,262 | | | | | Bank of Hawaii Corp | | | 1,376 | |
| | 4,659 | | | | | Bank of India | | | 18 | |
| | 34,027,165 | | | * | | Bank of Ireland | | | 11,859 | |
| | 17,500 | | | * | | Bank of Iwate Ltd | | | 879 | |
| | 794,226 | | | | | Bank of Kaohsiung | | | 254 | |
| | 26,822 | | | | | Bank of Kentucky Financial Corp | | | 990 | |
| | 415,505 | | | | | Bank of Kyoto Ltd | | | 3,474 | |
| | 26,261 | | | | | Bank of Marin Bancorp | | | 1,139 | |
| | 895,499 | | | e | | Bank of Montreal (Toronto) | | | 59,694 | |
| | 202,000 | | | | | Bank of Nagoya Ltd | | | 684 | |
| | 1,822,177 | | | | | Bank of Nova Scotia | | | 113,954 | |
| | 24,000 | | | | | Bank of Okinawa Ltd | | | 953 | |
| | 243,076 | | | | | Bank of Queensland Ltd | | | 2,646 | |
| | 169,541 | | | | | Bank of Saga Ltd | | | 364 | |
| | 107,129 | | | | | Bank of the Ozarks, Inc | | | 6,062 | |
| | 907,021 | | | | | Bank of the Philippine Islands | | | 1,741 | |
| | 134,700 | | | | | Bank of the Ryukyus Ltd | | | 1,762 | |
| | 1,410,763 | | | | | Bank of Yokohama Ltd | | | 7,871 | |
| | 152,049 | | | | | Bank Pekao S.A. | | | 9,033 | |
| | 31,510,000 | | | | | Bank Rakyat Indonesia | | | 18,834 | |
| | 27,628 | | | | | Bank Zachodni WBK S.A. | | | 3,552 | |
| | 81,474 | | | | | BankFinancial Corp | | | 746 | |
| | 1,505,780 | | | *,e | | Bankia S.A. | | | 2,556 | |
| | 1,554,181 | | | | | Bankinter S.A. | | | 10,680 | |
| | 690,921 | | | | | BankUnited | | | 22,745 | |
| | 78,451 | | | | | Banner Corp | | | 3,516 | |
| | 3,991 | | | | | Banque Cantonale Vaudoise | | | 2,182 | |
| | 428,800 | | | e | | Banregio Grupo Financiero SAB de C.V. | | | 2,549 | |
COLLEGE RETIREMENT EQUITIES FUND - Stock Account
| | | | | | | | VALUE | |
| SHARES | | | | | COMPANY | | (000) | |
| | 15,681 | | | | | Bar Harbor Bankshares | | $ | 627 | |
| | 388,117 | | | | | Barclays Africa Group Ltd | | | 4,900 | |
| | 37,384,877 | | | | | Barclays plc | | | 169,050 | |
| | 851,624 | | | | | BB&T Corp | | | 31,783 | |
| | 316,178 | | | | | BBCN Bancorp, Inc | | | 5,245 | |
| | 25,082 | | | *,e | | BBX Capital Corp | | | 391 | |
| | 215,912 | | | | | Bendigo Bank Ltd | | | 2,270 | |
| | 148,330 | | | * | | Beneficial Mutual Bancorp, Inc | | | 1,620 | |
| | 109,146 | | | | | Berkshire Hills Bancorp, Inc | | | 2,976 | |
| | 1,217,060 | | | | | BIMB Holdings BHD | | | 1,689 | |
| | 73,613 | | | e | | BNC Bancorp | | | 1,262 | |
| | 2,775,772 | | | | | BNP Paribas | | | 216,530 | |
| | 5,946,037 | | | | | BOC Hong Kong Holdings Ltd | | | 19,097 | |
| | 38,488 | | | * | | BofI Holding, Inc | | | 3,019 | |
| | 25,090 | | | | | BOK Financial Corp | | | 1,664 | |
| | 322,281 | | | | | Boston Private Financial Holdings, Inc | | | 4,067 | |
| | 14,501 | | | | | BRE Bank S.A. | | | 2,404 | |
| | 39,126 | | | | | Bridge Bancorp, Inc | | | 1,017 | |
| | 37,018 | | | * | | Bridge Capital Holdings | | | 760 | |
| | 324,015 | | | | | Brookline Bancorp, Inc | | | 3,101 | |
| | 52,327 | | | | | Bryn Mawr Bank Corp | | | 1,579 | |
| | 473,377 | | | | | BS Financial Group | | | 7,192 | |
| | 5,460,213 | | | | | Bumiputra-Commerce Holdings BHD | | | 12,727 | |
| | 13,612 | | | | | C&F Financial Corp | | | 622 | |
| | 30,066 | | | | | Camden National Corp | | | 1,269 | |
| | 780,081 | | | e | | Canadian Imperial Bank of Commerce/Canada | | | 66,622 | |
| | 113,732 | | | e | | Canadian Western Bank | | | 4,139 | |
| | 3,601 | | | * | | Canara Bank | | | 16 | |
| | 93,181 | | | * | | Capital Bank Financial Corp | | | 2,120 | |
| | 46,791 | | | * | | Capital City Bank Group, Inc | | | 551 | |
| | 508,662 | | | | | CapitalSource, Inc | | | 7,309 | |
| | 686,266 | | | | | Capitol Federal Financial | | | 8,311 | |
| | 142,542 | | | | | Cardinal Financial Corp | | | 2,566 | |
| | 14,093 | | | *,e | | Cascade Bancorp | | | 74 | |
| | 350,961 | | | | | Cathay General Bancorp | | | 9,381 | |
| | 47,312 | | | | | Center Bancorp, Inc | | | 888 | |
| | 112,316 | | | | | Centerstate Banks of Florida, Inc | | | 1,140 | |
| | 200,000 | | | | | Central Bank Of India | | | 166 | |
| | 100,686 | | | e | | Central Pacific Financial Corp | | | 2,022 | |
| | 14,233 | | | | | Century Bancorp, Inc | | | 473 | |
| | 5,393,559 | | | | | Chang Hwa Commercial Bank | | | 3,327 | |
| | 92,325 | | | | | Charter Financial Corp | | | 994 | |
| | 110,638 | | | | | Chemical Financial Corp | | | 3,504 | |
| | 13,340 | | | e | | Chemung Financial Corp | | | 456 | |
| | 743,189 | | | | | Chiba Bank Ltd | | | 5,016 | |
| | 44,000 | | | * | | Chiba Kogyo Bank Ltd | | | 325 | |
| | 10,923,000 | | | e | | China Citic Bank | | | 5,948 | |
| | 122,507,831 | | | | | China Construction Bank | | | 92,752 | |
COLLEGE RETIREMENT EQUITIES FUND - Stock Account
| | | | | | | | VALUE | |
| SHARES | | | | | COMPANY | | (000) | |
| | 15,584,770 | | | | | China Development Financial Holding Corp | | $ | 4,719 | |
| | 8,710,122 | | | | | China Merchants Bank Co Ltd | | | 18,627 | |
| | 10,203,100 | | | e | | China Minsheng Banking Corp Ltd | | | 11,372 | |
| | 33,282,705 | | | | | Chinatrust Financial Holding Co | | | 22,775 | |
| | 14,977,500 | | | e | | Chongqing Rural Commercial Bank | | | 7,287 | |
| | 58,628 | | | | | Chugoku Bank Ltd | | | 745 | |
| | 714,327 | | | | | CIT Group, Inc | | | 37,238 | |
| | 47,483 | | | e | | Citizens & Northern Corp | | | 980 | |
| | 61,831 | | | e | | City Holding Co | | | 2,865 | |
| | 47,361 | | | | | City National Corp | | | 3,752 | |
| | 34,339 | | | | | Clifton Savings Bancorp, Inc | | | 440 | |
| | 49,490 | | | | | CNB Financial Corp | | | 940 | |
| | 139,479 | | | e | | CoBiz, Inc | | | 1,668 | |
| | 201,966 | | | | | Columbia Banking System, Inc | | | 5,556 | |
| | 75,619 | | | | | Comdirect Bank AG. | | | 865 | |
| | 247,350 | | | e | | Comerica, Inc | | | 11,759 | |
| | 95,942 | | | | | Commerce Bancshares, Inc | | | 4,309 | |
| | 1,003,459 | | | | | Commercial International Bank | | | 4,755 | |
| | 908,572 | | | * | | Commerzbank AG. | | | 14,667 | |
| | 1,561,254 | | | | | Commonwealth Bank of Australia | | | 108,784 | |
| | 157,067 | | | | | Community Bank System, Inc | | | 6,232 | |
| | 55,196 | | | | | Community Trust Bancorp, Inc | | | 2,493 | |
| | 32,798 | | | *,e | | CommunityOne Bancorp | | | 418 | |
| | 5,405 | | | * | | ConnectOne Bancorp, Inc | | | 214 | |
| | 20,000 | | | | | Corp Bank | | | 85 | |
| | 157,888,075 | | | | | CorpBanca S.A. | | | 2,178 | |
| | 105,439 | | | | | Credicorp Ltd (NY) | | | 13,995 | |
| | 606,320 | | | * | | Credit Agricole S.A. | | | 7,772 | |
| | 198,691 | | | | | Credito Emiliano S.p.A. | | | 1,585 | |
| | 5,199,344 | | | | | Criteria Caixacorp S.A. | | | 27,082 | |
| | 35,891 | | | *,e | | CU Bancorp | | | 627 | |
| | 68,592 | | | e | | Cullen/Frost Bankers, Inc | | | 5,105 | |
| | 90,735 | | | * | | Customers Bancorp, Inc | | | 1,856 | |
| | 363,273 | | | e | | CVB Financial Corp | | | 6,201 | |
| | 1,219,982 | | | | | Dah Sing Banking Group Ltd | | | 2,148 | |
| | 371,056 | | | | | Dah Sing Financial Holdings Ltd | | | 2,129 | |
| | 499,000 | | | | | Daishi Bank Ltd | | | 1,723 | |
| | 1,217,972 | | | * | | Danske Bank AS | | | 27,979 | |
| | 3,002,803 | | | | | DBS Group Holdings Ltd | | | 40,807 | |
| | 4,022,608 | | | * | | Development Credit Bank Ltd | | | 3,546 | |
| | 38,445 | | | * | | Dewan Housing Finance Corp Ltd | | | 133 | |
| | 149,340 | | | | | DGB Financial Group Co Ltd | | | 2,340 | |
| | 1,940,892 | | | * | | Dhanalakshmi Bank Ltd | | | 1,280 | |
| | 145,937 | | | | | Dime Community Bancshares | | | 2,469 | |
| | 2,208,900 | | | | | DNB NOR Holding ASA | | | 39,646 | |
| | 29,194 | | | * | | Doral Financial Corp | | | 457 | |
| | 5,410,154 | | | | | E.Sun Financial Holding Co Ltd | | | 3,602 | |
| | 99,363 | | | * | | Eagle Bancorp, Inc | | | 3,043 | |
COLLEGE RETIREMENT EQUITIES FUND - Stock Account
| | | | | | | | VALUE | |
| SHARES | | | | | COMPANY | | (000) | |
| | 1,327,450 | | | | | East West Bancorp, Inc | | $ | 46,421 | |
| | 410,000 | | | * | | EastWest Banking Corp | | | 225 | |
| | 327,000 | | | | | Eighteenth Bank Ltd | | | 744 | |
| | 27,603 | | | | | Enterprise Bancorp, Inc | | | 584 | |
| | 72,480 | | | | | Enterprise Financial Services Corp | | | 1,480 | |
| | 228,000 | | | | | Entie Commercial Bank | | | 114 | |
| | 859,133 | | | | | Erste Bank der Oesterreichischen Sparkassen AG. | | | 29,950 | |
| | 49,778 | | | | | ESB Financial Corp | | | 707 | |
| | 31,234 | | | | | ESSA Bancorp, Inc | | | 361 | |
| | 720,855 | | | *,e | | Essent Group Ltd | | | 17,344 | |
| | 311,181 | | | e | | EverBank Financial Corp | | | 5,707 | |
| | 2,238,566 | | | | | Far Eastern International Bank | | | 937 | |
| | 30,775 | | | * | | Farmers Capital Bank Corp | | | 669 | |
| | 37,869 | | | | | Federal Agricultural Mortgage Corp (Class C) | | | 1,297 | |
| | 1,800,000 | | | * | | Federal Bank Ltd | | | 2,451 | |
| | 59,760 | | | | | Fidelity Southern Corp | | | 993 | |
| | 2,235,022 | | | | | Fifth Third Bancorp | | | 47,003 | |
| | 54,639 | | | | | Financial Institutions, Inc | | | 1,350 | |
| | 75,851 | | | | | First Bancorp (NC) | | | 1,261 | |
| | 329,983 | | | *,e | | First Bancorp (Puerto Rico) | | | 2,043 | |
| | 34,712 | | | | | First Bancorp, Inc | | | 605 | |
| | 283,888 | | | | | First Busey Corp | | | 1,647 | |
| | 5,608 | | | | | First Citizens Bancshares, Inc (Class A) | | | 1,249 | |
| | 402,445 | | | | | First Commonwealth Financial Corp | | | 3,550 | |
| | 78,627 | | | | | First Community Bancshares, Inc | | | 1,313 | |
| | 62,493 | | | | | First Connecticut Bancorp | | | 1,007 | |
| | 39,367 | | | | | First Defiance Financial Corp | | | 1,022 | |
| | 9,104 | | | *,e | | First Federal Bancshares of Arkansas, Inc | | | 79 | |
| | 225,509 | | | | | First Financial Bancorp | | | 3,931 | |
| | 113,681 | | | e | | First Financial Bankshares, Inc | | | 7,539 | |
| | 43,505 | | | | | First Financial Corp | | | 1,591 | |
| | 7,992,427 | | | | | First Financial Holding Co Ltd | | | 4,977 | |
| | 91,344 | | | | | First Financial Holdings, Inc | | | 6,075 | |
| | 68,799 | | | | | First Financial Northwest, Inc | | | 713 | |
| | 412,256 | | | | | First Gulf Bank PJSC | | | 2,114 | |
| | 129,267 | | | | | First Horizon National Corp | | | 1,506 | |
| | 21,640 | | | | | First International Bank Of Israel Ltd | | | 359 | |
| | 74,355 | | | | | First Interstate Bancsystem, Inc | | | 2,109 | |
| | 131,055 | | | | | First Merchants Corp | | | 2,983 | |
| | 299,744 | | | | | First Midwest Bancorp, Inc | | | 5,255 | |
| | 14,405 | | | * | | First NBC Bank Holding Co | | | 465 | |
| | 187,554 | | | | | First Niagara Financial Group, Inc | | | 1,992 | |
| | 34,543 | | | | | First of Long Island Corp | | | 1,481 | |
| | 259,919 | | | | | First Republic Bank | | | 13,607 | |
| | 254,449 | | | * | | First Security Group, Inc | | | 585 | |
| | 646,210 | | | | | FirstMerit Corp | | | 14,365 | |
| | 116,775 | | | * | | Flagstar Bancorp, Inc | | | 2,291 | |
| | 125,022 | | | | | Flushing Financial Corp | | | 2,588 | |
COLLEGE RETIREMENT EQUITIES FUND - Stock Account
| | | | | | | | VALUE | |
| SHARES | | | | | COMPANY | | (000) | |
| | 584,799 | | | | | FNB Corp | | $ | 7,380 | |
| | 49,319 | | | | | Fox Chase Bancorp, Inc | | | 857 | |
| | 41,469 | | | * | | Franklin Financial Corp | | | 820 | |
| | 1,851,540 | | | | | Fukuoka Financial Group, Inc | | | 8,127 | |
| | 103,325 | | | | | Fulton Financial Corp | | | 1,351 | |
| | 109,040 | | | | | Genworth MI Canada, Inc | | | 3,760 | |
| | 50,398 | | | e | | German American Bancorp, Inc | | | 1,436 | |
| | 1,359,147 | | | * | | Get Bank S.A. | | | 1,199 | |
| | 695,591 | | | | | Getin Holding S.A. | | | 869 | |
| | 288,055 | | | | | Glacier Bancorp, Inc | | | 8,581 | |
| | 41,338 | | | | | Great Southern Bancorp, Inc | | | 1,257 | |
| | 30,620 | | | * | | Gruh Finance Ltd | | | 126 | |
| | 1,173,925 | | | | | Grupo Aval Acciones y Valores | | | 776 | |
| | 4,153,789 | | | | | Grupo Financiero Banorte S.A. de C.V. | | | 29,065 | |
| | 5,143,532 | | | | | Grupo Financiero Inbursa S.A. | | | 14,548 | |
| | 4,216,300 | | | e | | Grupo Financiero Santander Mexico SAB de C.V. | | | 11,464 | |
| | 59,729 | | | | | Guaranty Bancorp | | | 839 | |
| | 384,218 | | | | | Gunma Bank Ltd | | | 2,147 | |
| | 263,116 | | | | | Hachijuni Bank Ltd | | | 1,536 | |
| | 123,689 | | | *,e | | Hampton Roads Bankshares, Inc | | | 216 | |
| | 319,133 | | | | | Hana Financial Group, Inc | | | 13,297 | |
| | 329,845 | | | | | Hancock Holding Co | | | 12,099 | |
| | 1,458,088 | | | e | | Hang Seng Bank Ltd | | | 23,682 | |
| | 121,687 | | | | | Hanmi Financial Corp | | | 2,664 | |
| | 2,209,155 | | | | | HDFC Bank Ltd | | | 23,831 | |
| | 57,928 | | | | | Heartland Financial USA, Inc | | | 1,668 | |
| | 85,722 | | | | | Heritage Commerce Corp | | | 706 | |
| | 62,515 | | | e | | Heritage Financial Corp | | | 1,070 | |
| | 77,469 | | | * | | Heritage Oaks Bancorp | | | 581 | |
| | 169,000 | | | | | Higashi-Nippon Bank Ltd | | | 395 | |
| | 213,331 | | | | | Higo Bank Ltd | | | 1,172 | |
| | 4,389 | | | | | Hingham Institution for Savings | | | 344 | |
| | 98,809 | | | | | Hiroshima Bank Ltd | | | 409 | |
| | 419,000 | | | | | Hokkoku Bank Ltd | | | 1,503 | |
| | 484,000 | | | | | Hokuetsu Bank Ltd | | | 981 | |
| | 147,000 | | | | | Hokuhoku Financial Group, Inc | | | 294 | |
| | 27,209 | | | * | | Home Bancorp, Inc | | | 513 | |
| | 170,011 | | | | | Home Bancshares, Inc | | | 6,350 | |
| | 77,124 | | | | | Home Capital Group, Inc | | | 5,876 | |
| | 59,255 | | | | | Home Federal Bancorp, Inc | | | 883 | |
| | 274,200 | | | | | Home Loan Servicing Solutions Ltd | | | 6,298 | |
| | 47,432 | | | e | | HomeStreet, Inc | | | 949 | |
| | 83,196 | | | * | | HomeTrust Bancshares, Inc | | | 1,330 | |
| | 536,240 | | | | | Hong Leong Bank BHD | | | 2,360 | |
| | 122,412 | | | | | Hong Leong Credit BHD | | | 579 | |
| | 32,850 | | | | | Horizon Bancorp | | | 832 | |
| | 2,104,477 | | | | | Housing Development Finance Corp | | | 27,096 | |
| | 27,896,104 | | | | | HSBC Holdings plc | | | 306,136 | |
COLLEGE RETIREMENT EQUITIES FUND - Stock Account
| | | | | | | | VALUE | |
| SHARES | | | | | COMPANY | | (000) | |
| | 6,060,596 | | | | | Hua Nan Financial Holdings Co Ltd | | $ | 3,544 | |
| | 3,448,566 | | | | | Hudson City Bancorp, Inc | | | 32,520 | |
| | 69,922 | | | e | | Hudson Valley Holding Corp | | | 1,423 | |
| | 7,533,364 | | | | | Huntington Bancshares, Inc | | | 72,697 | |
| | 344,692 | | | | | Hyakugo Bank Ltd | | | 1,380 | |
| | 579,000 | | | | | Hyakujushi Bank Ltd | | | 2,016 | |
| | 114,543 | | | | | IBERIABANK Corp | | | 7,199 | |
| | 241,424 | | | | | ICICI Bank Ltd | | | 4,316 | |
| | 21,469 | | | | | ICICI Bank Ltd (ADR) | | | 798 | |
| | 89,051 | | | | | Independent Bank Corp | | | 3,490 | |
| | 15,648 | | | | | Independent Bank Group, Inc | | | 777 | |
| | 134,930,366 | | | | | Industrial & Commercial Bank of China | | | 91,498 | |
| | 505,390 | | | | | Industrial Bank of Korea | | | 5,829 | |
| | 214,103 | | | | | ING Vysya Bank Ltd | | | 2,120 | |
| | 217,691 | | | | | International Bancshares Corp | | | 5,745 | |
| | 68,837 | | | * | | Intervest Bancshares Corp | | | 517 | |
| | 218,768 | | | | | Investors Bancorp, Inc | | | 5,596 | |
| | 541,290 | | | *,m | | Irish Bank Resolution Corp Ltd | | | 0 | ^ |
| | 1,015,998 | | | * | | Israel Discount Bank Ltd | | | 1,940 | |
| | 44,140 | | | | | Iyo Bank Ltd | | | 433 | |
| | 15,922 | | | | | Jammu & Kashmir Bank Ltd | | | 370 | |
| | 77,574 | | | * | | JB Financial Group Co Ltd | | | 468 | |
| | 201,800 | | | | | Jimoto Holdings Inc | | | 411 | |
| | 446,485 | | | | | Joyo Bank Ltd | | | 2,283 | |
| | 427,555 | | | | | Juroku Bank Ltd | | | 1,570 | |
| | 165,470 | | | * | | Jyske Bank | | | 8,947 | |
| | 317,000 | | | | | Kagoshima Bank Ltd | | | 2,015 | |
| | 346,535 | | | | | Kansai Urban Banking Corp | | | 402 | |
| | 104,000 | | | | | Kanto Tsukuba Bank Ltd | | | 364 | |
| | 750,757 | | | | | Karnataka Bank Ltd | | | 1,354 | |
| | 22,505 | | | * | | Karur Vysya Bank Ltd | | | 127 | |
| | 501,100 | | | | | Kasikornbank PCL | | | 2,395 | |
| | 1,542,600 | | | | | Kasikornbank PCL (Foreign) | | | 7,487 | |
| | 695,674 | | | | | KB Financial Group, Inc | | | 28,119 | |
| | 316,385 | | | | | KBC Groep NV | | | 17,988 | |
| | 57,931 | | | * | | Kearny Financial Corp | | | 674 | |
| | 779,000 | | | | | Keiyo Bank Ltd | | | 3,751 | |
| | 9,210,532 | | | | | Keycorp | | | 123,605 | |
| | 696,432 | | | | | Kiatnakin Bank PCL | | | 794 | |
| | 1,218,000 | | | | | King’s Town Bank | | | 1,163 | |
| | 78,000 | | | * | | Kiyo Bank Ltd | | | 1,039 | |
| | 53,851 | | | | | Komercni Banka AS | | | 12,011 | |
| | 4,367,100 | | | | | Krung Thai Bank PCL | | | 2,207 | |
| | 130,300 | | | e | | Lakeland Bancorp, Inc | | | 1,612 | |
| | 72,407 | | | | | Lakeland Financial Corp | | | 2,824 | |
| | 33,052 | | | | | Laurentian Bank of Canada | | | 1,460 | |
| | 23,470 | | | e | | LCNB Corp | | | 419 | |
COLLEGE RETIREMENT EQUITIES FUND - Stock Account
| | | | | | | | VALUE | |
| SHARES | | | | | COMPANY | | (000) | |
| | 5,251,200 | | | | | LH Financial Group PCL | | $ | 197 | |
| | 501,641 | | | * | | Liberbank S.A. | | | 497 | |
| | 785,247 | | | * | | LIC Housing Finance Ltd | | | 2,790 | |
| | 95,484,118 | | | * | | Lloyds TSB Group plc | | | 125,293 | |
| | 68,029 | | | e | | M&T Bank Corp | | | 7,920 | |
| | 97,484 | | | *,e | | Macatawa Bank Corp | | | 487 | |
| | 84,292 | | | | | MainSource Financial Group, Inc | | | 1,520 | |
| | 5,823,876 | | | | | Malayan Banking BHD | | | 17,700 | |
| | 845,900 | | | | | Malaysia Building Society | | | 571 | |
| | 5,646,074 | | | *,m | | Marfin Popular Bank Public Co Ltd | | | 78 | |
| | 217,847 | | | | | MB Financial, Inc | | | 6,991 | |
| | 24,583,968 | | | | | Mega Financial Holding Co Ltd | | | 20,728 | |
| | 35,093 | | | e | | Mercantile Bank Corp | | | 757 | |
| | 23,240 | | | | | Merchants Bancshares, Inc | | | 779 | |
| | 33,257 | | | * | | Meridian Interstate Bancorp, Inc | | | 751 | |
| | 21,991 | | | | | Meta Financial Group, Inc | | | 887 | |
| | 63,113 | | | | | MetroCorp Bancshares, Inc | | | 951 | |
| | 2,065,150 | | | | | Metropolitan Bank & Trust | | | 3,530 | |
| | 1,137,678 | | | *,e | | MGIC Investment Corp | | | 9,602 | |
| | 17,430 | | | | | Middleburg Financial Corp | | | 314 | |
| | 33,904 | | | | | Midsouth Bancorp, Inc | | | 606 | |
| | 26,810 | | | | | MidWestOne Financial Group, Inc | | | 729 | |
| | 244,000 | | | | | Mie Bank Ltd | | | 527 | |
| | 281,000 | | | | | Minato Bank Ltd | | | 467 | |
| | 17,540,864 | | | | | Mitsubishi UFJ Financial Group, Inc | | | 116,461 | |
| | 5,486,494 | | | | | Mitsui Trust Holdings, Inc | | | 29,030 | |
| | 253,000 | | | | | Miyazaki Bank Ltd | | | 708 | |
| | 134,365 | | | | | Mizrahi Tefahot Bank Ltd | | | 1,759 | |
| | 49,038,952 | | | | | Mizuho Financial Group, Inc | | | 106,465 | |
| | 71,568 | | | | | Musashino Bank Ltd | | | 2,399 | |
| | 326,928 | | | | | Nanto Bank Ltd | | | 1,222 | |
| | 13,108 | | | *,e | | NASB Financial, Inc | | | 396 | |
| | 1,951,977 | | | | | National Australia Bank Ltd | | | 60,925 | |
| | 175,738 | | | | | National Bank Holdings Corp | | | 3,761 | |
| | 488,986 | | | e | | National Bank of Canada | | | 40,689 | |
| | 3,666,548 | | | * | | National Bank of Greece S.A. | | | 19,684 | |
| | 28,487 | | | e | | National Bankshares, Inc | | | 1,051 | |
| | 465,177 | | | | | National Penn Bancshares, Inc | | | 5,270 | |
| | 160,345 | | | *,e | | Nationstar Mortgage Holdings, Inc | | | 5,926 | |
| | 1,716,125 | | | | | Natixis | | | 10,096 | |
| | 170,562 | | | | | NBT Bancorp, Inc | | | 4,418 | |
| | 233,715 | | | e | | Nedbank Group Ltd | | | 4,686 | |
| | 230,824 | | | e | | New York Community Bancorp, Inc | | | 3,889 | |
| | 98,613 | | | *,e | | NewBridge Bancorp | | | 740 | |
| | 110,225 | | | | | Nishi-Nippon City Bank Ltd | | | 297 | |
| | 27,175 | | | * | | NOMOS-BANK (GDR) | | | 394 | |
| | 5,437,831 | | | | | Nordea Bank AB | | | 73,317 | |
| | 417,800 | | | | | North Pacific Bank Ltd | | | 1,701 | |
COLLEGE RETIREMENT EQUITIES FUND - Stock Account
| | | | | | | | VALUE | |
| SHARES | | | | | COMPANY | | (000) | |
| | 243,307 | | | | | Northfield Bancorp, Inc | | $ | 3,212 | |
| | 25,863 | | | | | Northrim BanCorp, Inc | | | 679 | |
| | 368,611 | | | | | Northwest Bancshares, Inc | | | 5,448 | |
| | 55,077 | | | | | OceanFirst Financial Corp | | | 943 | |
| | 1,106,527 | | | * | | Ocwen Financial Corp | | | 61,357 | |
| | 181,880 | | | e | | OFG Bancorp | | | 3,154 | |
| | 753,000 | | | | | Ogaki Kyoritsu Bank Ltd | | | 2,070 | |
| | 342,000 | | | | | Oita Bank Ltd | | | 1,268 | |
| | 402,749 | | | | | Old National Bancorp | | | 6,190 | |
| | 54,093 | | | * | | OmniAmerican Bancorp, Inc | | | 1,157 | |
| | 180,097 | | | | | Oriental Bank of Commerce | | | 668 | |
| | 188,544 | | | | | Oritani Financial Corp | | | 3,026 | |
| | 552,050 | | | | | OTP Bank | | | 10,489 | |
| | 1,426,551 | | | e | | Oversea-Chinese Banking Corp | | | 11,563 | |
| | 72,080 | | | | | Pacific Continental Corp | | | 1,149 | |
| | 69,638 | | | * | | Pacific Premier Bancorp, Inc | | | 1,096 | |
| | 150,566 | | | e | | PacWest Bancorp | | | 6,357 | |
| | 10,894 | | | * | | Palmetto Bancshares, Inc | | | 141 | |
| | 361,448 | | | | | Paragon Group of Cos plc | | | 2,224 | |
| | 44,293 | | | e | | Park National Corp | | | 3,768 | |
| | 173,284 | | | | | Park Sterling Bank | | | 1,237 | |
| | 40,529 | | | e | | Peapack Gladstone Financial Corp | | | 774 | |
| | 16,842 | | | | | Penns Woods Bancorp, Inc | | | 859 | |
| | 56,601 | | | * | | Pennsylvania Commerce Bancorp, Inc | | | 1,219 | |
| | 48,595 | | | *,e | | PennyMac Financial Services, Inc | | | 853 | |
| | 42,489 | | | | | Peoples Bancorp, Inc | | | 956 | |
| | 164,324 | | | e | | People’s United Financial, Inc | | | 2,485 | |
| | 429,240 | | | * | | Philippine National Bank | | | 836 | |
| | 709,059 | | | * | | Piccolo Credito Valtellinese Scarl | | | 1,333 | |
| | 136,886 | | | | | Pinnacle Financial Partners, Inc | | | 4,453 | |
| | 14,571,783 | | | * | | Piraeus Bank S.A. | | | 30,809 | |
| | 1,052,036 | | | | | PNC Financial Services Group, Inc | | | 81,617 | |
| | 56,584 | | | * | | Popular, Inc | | | 1,626 | |
| | 1,309,012 | | | | | Powszechna Kasa Oszczednosci Bank Polski S.A. | | | 17,067 | |
| | 45,737 | | | * | | Preferred Bank | | | 917 | |
| | 258,537 | | | | | PrivateBancorp, Inc | | | 7,479 | |
| | 232,427 | | | | | Prosperity Bancshares, Inc | | | 14,734 | |
| | 36,305 | | | | | Provident Financial Holdings, Inc | | | 545 | |
| | 235,720 | | | | | Provident Financial Services, Inc | | | 4,554 | |
| | 17,786,000 | | | | | PT Bank Bukopin Tbk | | | 907 | |
| | 12,581,100 | | | | | PT Bank Central Asia Tbk | | | 9,952 | |
| | 3,875,935 | | | | | PT Bank Danamon Indonesia Tbk | | | 1,204 | |
| | 8,714,500 | | | | | PT Bank Jabar Banten Tbk | | | 639 | |
| | 9,590,148 | | | | | PT Bank Mandiri Persero Tbk | | | 6,207 | |
| | 21,761,050 | | | | | PT Bank Negara Indonesia | | | 7,088 | |
| | 21,000,000 | | | * | | PT Bank Pan Indonesia Tbk | | | 1,141 | |
| | 7,641,500 | | | | | PT Bank Pembangunan Daerah Jawa Timur Tbk | | | 236 | |
| | 13,825,194 | | | | | PT Bank Tabungan Negara Tbk | | | 990 | |
COLLEGE RETIREMENT EQUITIES FUND - Stock Account
| | | | | | | | VALUE | |
| SHARES | | | | | COMPANY | | (000) | |
| | 78,946 | | | | | Public Bank BHD | | $ | 468 | |
| | 1,459,311 | | | | | Public Bank BHD (Foreign) | | | 8,706 | |
| | 641,669 | | | e | | Radian Group, Inc | | | 9,060 | |
| | 5,623 | | | e | | Raiffeisen International Bank Holding AG. | | | 199 | |
| | 7,446,457 | | | | | Regions Financial Corp | | | 73,645 | |
| | 115,767 | | | e | | Renasant Corp | | | 3,642 | |
| | 39,510 | | | | | Republic Bancorp, Inc (Class A) | | | 970 | |
| | 3,938,340 | | | | | Resona Holdings, Inc | | | 20,095 | |
| | 801,323 | | | | | RHB Capital BHD | | | 1,935 | |
| | 335,000 | | | | | Rizal Commercial Banking Corp | | | 322 | |
| | 108,802 | | | e | | Rockville Financial, Inc | | | 1,546 | |
| | 5,200 | | | *,m | | Roskilde Bank | | | 0 | ^ |
| | 135,601 | | | e | | Royal Bank of Canada | | | 9,116 | |
| | 2,428,162 | | | e | | Royal Bank of Canada (Toronto) | | | 163,234 | |
| | 969,104 | | | * | | Royal Bank of Scotland Group plc | | | 5,458 | |
| | 118,908 | | | | | S&T Bancorp, Inc | | | 3,010 | |
| | 62,344 | | | e | | S.Y. Bancorp, Inc | | | 1,990 | |
| | 108,287 | | | | | Sandy Spring Bancorp, Inc | | | 3,053 | |
| | 356,000 | | | | | San-In Godo Bank Ltd | | | 2,554 | |
| | 5,136,887 | | | | | Sberbank of Russian Federation (ADR) | | | 64,810 | |
| | 59,571 | | | * | | Seacoast Banking Corp of Florida | | | 727 | |
| | 465,036 | | | * | | Sekerbank TAS | | | 451 | |
| | 236,380 | | | | | Senshu Ikeda Holdings, Inc | | | 1,101 | |
| | 238,846 | | | | | Seven Bank Ltd | | | 934 | |
| | 276,000 | | | | | Shiga Bank Ltd | | | 1,450 | |
| | 987,352 | | | | | Shinhan Financial Group Co Ltd | | | 44,327 | |
| | 1,761,823 | | | | | Shinsei Bank Ltd | | | 4,313 | |
| | 698,559 | | | | | Shizuoka Bank Ltd | | | 7,462 | |
| | 3,061,100 | | | | | Siam Commercial Bank PCL | | | 13,455 | |
| | 47,941 | | | | | Sierra Bancorp | | | 771 | |
| | 287,643 | | | * | | Signature Bank | | | 30,899 | |
| | 67,625 | | | | | Simmons First National Corp (Class A) | | | 2,512 | |
| | 7,705,454 | | | | | SinoPac Financial Holdings Co Ltd | | | 3,849 | |
| | 4,482,533 | | | | | Skandinaviska Enskilda Banken AB (Class A) | | | 59,220 | |
| | 1,824,746 | | | | | Societe Generale | | | 106,110 | |
| | 70,299 | | | e | | Southside Bancshares, Inc | | | 1,922 | |
| | 74,448 | | | * | | Southwest Bancorp, Inc | | | 1,185 | |
| | 247,496 | | | | | Sparebanken Midt-Norge | | | 2,250 | |
| | 3,641 | | | | | St Galler Kantonalbank | | | 1,420 | |
| | 1,852,829 | | | e | | Standard Bank Group Ltd | | | 22,894 | |
| | 2,892,764 | | | | | Standard Chartered plc | | | 65,339 | |
| | 127,995 | | | | | State Bank & Trust Co | | | 2,328 | |
| | 7,332 | | | * | | State Bank of Bikaner & Jaip | | | 38 | |
| | 62,568 | | | | | State Bank of India Ltd | | | 1,791 | |
| | 104,419 | | | | | State Bank of India Ltd (GDR) | | | 5,993 | |
| | 2,543 | | | | | State Bank of Travancore | | | 17 | |
| | 88,953 | | | | | StellarOne Corp | | | 2,141 | |
| | 364,345 | | | | | Sterling Bancorp/DE | | | 4,871 | |
COLLEGE RETIREMENT EQUITIES FUND - Stock Account
| | | | | | | | VALUE | |
| SHARES | | | | | COMPANY | | (000) | |
| | 138,697 | | | | | Sterling Financial Corp | | $ | 4,727 | |
| | 21,584 | | | *,e | | Stonegate Mortgage Corp | | | 357 | |
| | 44,411 | | | * | | Suffolk Bancorp | | | 924 | |
| | 3,314,571 | | | | | Sumitomo Mitsui Financial Group, Inc | | | 172,369 | |
| | 154,095 | | | *,e | | Sun Bancorp, Inc | | | 542 | |
| | 615,904 | | | | | SunTrust Banks, Inc | | | 22,671 | |
| | 332,789 | | | | | Suruga Bank Ltd | | | 5,976 | |
| | 749,284 | | | | | Susquehanna Bancshares, Inc | | | 9,621 | |
| | 100,948 | | | * | | SVB Financial Group | | | 10,585 | |
| | 119,862 | | | | | Svenska Handelsbanken (A Shares) | | | 5,893 | |
| | 1,477,295 | | | | | Swedbank AB (A Shares) | | | 41,614 | |
| | 115,835 | | | * | | Sydbank AS | | | 3,080 | |
| | 250,579 | | | | | Syndicate Bank | | | 384 | |
| | 4,922,417 | | | | | Synovus Financial Corp | | | 17,721 | |
| | 2,345,059 | | | * | | Ta Chong Bank Co Ltd | | | 855 | |
| | 2,280,794 | | | | | Taichung Commercial Bank | | | 839 | |
| | 7,419,463 | | | | | Taishin Financial Holdings Co Ltd | | | 3,654 | |
| | 2,045,769 | | | * | | Taiwan Business Bank | | | 624 | |
| | 6,556,091 | | | | | Taiwan Cooperative Financial Holding | | | 3,590 | |
| | 66,476 | | | *,e | | Taylor Capital Group, Inc | | | 1,767 | |
| | 4,693,006 | | | | | TCF Financial Corp | | | 76,261 | |
| | 618,784 | | | * | | TCS Group Holding plc (ADR) | | | 9,251 | |
| | 245,901 | | | * | | TCS Group Holding plc (ADR) Registered | | | 3,861 | |
| | 43,907 | | | | | Territorial Bancorp, Inc | | | 1,019 | |
| | 208,609 | | | *,e | | Texas Capital Bancshares, Inc | | | 12,975 | |
| | 92,671 | | | * | | TFS Financial Corp | | | 1,123 | |
| | 1,848,300 | | | | | Thanachart Capital PCL | | | 1,824 | |
| | 124,004 | | | * | | The Bancorp, Inc | | | 2,221 | |
| | 1,434,900 | | | | | Tisco Bank PCL | | | 1,689 | |
| | 10,544,900 | | | | | TMB Bank PCL | | | 665 | |
| | 126,000 | | | | | Tochigi Bank Ltd | | | 488 | |
| | 332,000 | | | | | Toho Bank Ltd | | | 1,036 | |
| | 78,000 | | | | | Tokyo Tomin Bank Ltd | | | 810 | |
| | 349,600 | | | | | Tomony Holdings, Inc | | | 1,415 | |
| | 62,039 | | | | | Tompkins Trustco, Inc | | | 3,188 | |
| | 1,459,611 | | | | | Toronto-Dominion Bank | | | 137,559 | |
| | 391,000 | | | | | Towa Bank Ltd | | | 349 | |
| | 104,571 | | | e | | TowneBank | | | 1,609 | |
| | 22,590 | | | *,e | | Tree.com, Inc | | | 742 | |
| | 64,713 | | | e | | Trico Bancshares | | | 1,836 | |
| | 22,258 | | | *,e | | Tristate Capital Holdings, Inc | | | 264 | |
| | 367,997 | | | | | Trustco Bank Corp NY | | | 2,642 | |
| | 260,963 | | | | | Trustmark Corp | | | 7,004 | |
| | 2,720,246 | | | | | Turkiye Garanti Bankasi AS | | | 8,818 | |
| | 1,416,337 | | | | | Turkiye Halk Bankasi AS | | | 8,013 | |
| | 2,861,142 | | | | | Turkiye Is Bankasi (Series C) | | | 6,195 | |
| | 1,753,623 | | | | | Turkiye Sinai Kalkinma Bankasi AS | | | 1,494 | |
| | 1,825,907 | | | | | Turkiye Vakiflar Bankasi Tao | | | 3,249 | |
COLLEGE RETIREMENT EQUITIES FUND - Stock Account
| | | | | | | | VALUE | |
| SHARES | | | | | COMPANY | | (000) | |
| | 837,448 | | | | | UCO Bank | | $ | 1,026 | |
| | 168,120 | | | | | UMB Financial Corp | | | 10,807 | |
| | 449,919 | | | e | | Umpqua Holdings Corp | | | 8,611 | |
| | 5,750,809 | | | | | UniCredit S.p.A | | | 42,422 | |
| | 1,867,049 | | | * | | Union Bank Of Taiwan | | | 687 | |
| | 78,299 | | | e | | Union Bankshares Corp | | | 1,943 | |
| | 199,293 | | | e | | United Bankshares, Inc | | | 6,268 | |
| | 174,181 | | | * | | United Community Banks, Inc | | | 3,092 | |
| | 163,572 | | | * | | United Community Financial Corp | | | 584 | |
| | 74,541 | | | e | | United Financial Bancorp, Inc | | | 1,408 | |
| | 1,081,679 | | | e | | United Overseas Bank Ltd | | | 18,266 | |
| | 72,762 | | | | | Univest Corp of Pennsylvania | | | 1,505 | |
| | 5,063,881 | | | | | US Bancorp | | | 204,581 | |
| | 14,770 | | | | | UTI Bank Ltd | | | 311 | |
| | 21,152 | | | | | Valiant Holding | | | 1,893 | |
| | 103,605 | | | e | | Valley National Bancorp | | | 1,048 | |
| | 34,991 | | | *,e | | VantageSouth Bancshares, Inc | | | 184 | |
| | 182,688 | | | | | ViewPoint Financial Group | | | 5,015 | |
| | 436,660 | | | * | | Vijaya Bank | | | 278 | |
| | 106,160 | | | * | | Virginia Commerce Bancorp | | | 1,804 | |
| | 2,565,411 | | | e | | VTB Bank OJSC (GDR) | | | 7,706 | |
| | 90,078 | | | * | | Walker & Dunlop, Inc | | | 1,457 | |
| | 68,628 | | | | | Washington Banking Co | | | 1,217 | |
| | 55,285 | | | | | Washington Federal, Inc | | | 1,288 | |
| | 61,481 | | | | | Washington Trust Bancorp, Inc | | | 2,288 | |
| | 25,230 | | | * | | Waterstone Financial, Inc | | | 280 | |
| | 383,532 | | | | | Webster Financial Corp | | | 11,959 | |
| | 26,769,342 | | | | | Wells Fargo & Co | | | 1,215,328 | |
| | 103,546 | | | | | WesBanco, Inc | | | 3,313 | |
| | 59,260 | | | | | West Bancorporation, Inc | | | 938 | |
| | 109,866 | | | e | | Westamerica Bancorporation | | | 6,203 | |
| | 291,330 | | | * | | Western Alliance Bancorp | | | 6,951 | |
| | 78,389 | | | | | Westfield Financial, Inc | | | 585 | |
| | 3,824,103 | | | | | Westpac Banking Corp | | | 110,856 | |
| | 253,682 | | | e | | Wilshire Bancorp, Inc | | | 2,773 | |
| | 342,659 | | | | | Wing Hang Bank Ltd | | | 5,176 | |
| | 145,804 | | | | | Wintrust Financial Corp | | | 6,724 | |
| | 589,890 | | | | | Woori Finance Holdings Co Ltd | | | 7,452 | |
| | 30,068 | | | | | WSFS Financial Corp | | | 2,331 | |
| | 34,100 | | | | | Yachiyo Bank Ltd | | | 889 | |
| | 57,119 | | | * | | Yadkin Financial Corp | | | 973 | |
| | 307,000 | | | | | Yamagata Bank Ltd | | | 1,266 | |
| | 62,492 | | | | | Yamaguchi Financial Group, Inc | | | 580 | |
| | 330,000 | | | | | Yamanashi Chuo Bank Ltd | | | 1,437 | |
| | 1,536,946 | | | | | Yapi ve Kredi Bankasi | | | 2,663 | |
| | 1,449,875 | | | | | Yes Bank Ltd | | | 8,710 | |
| | 98,271 | | | | | Zions Bancorporation | | | 2,944 | |
| | | | | | | TOTAL BANKS | | | 7,510,280 | |
COLLEGE RETIREMENT EQUITIES FUND - Stock Account
| | | | | | | | VALUE | |
| SHARES | | | | | COMPANY | | (000) | |
| CAPITAL GOODS - 8.3% | | | | |
| | 2,901,229 | | | | | 3M Co | | $ | 406,898 | |
| | 340,131 | | | | | A.O. Smith Corp | | | 18,347 | |
| | 176,737 | | | | | Aalberts Industries NV | | | 5,641 | |
| | 90,512 | | | | | Aaon, Inc | | | 2,892 | |
| | 162,997 | | | | | AAR Corp | | | 4,566 | |
| | 1,658,444 | | | | | ABB Ltd | | | 43,849 | |
| | 307,193 | | | e | | Abengoa S.A. | | | 1,022 | |
| | 219,180 | | | | | Abengoa S.A. (B Shares) | | | 657 | |
| | 3,481,762 | | | | | Aboitiz Equity Ventures, Inc | | | 4,288 | |
| | 1,468,000 | | | | | AcBel Polytech, Inc | | | 1,514 | |
| | 120,992 | | | *,e | | Accuride Corp | | | 451 | |
| | 104,467 | | | | | Aceto Corp | | | 2,613 | |
| | 130,842 | | | | | ACS Actividades Cons y Servicios S.A. | | | 4,510 | |
| | 86,970 | | | | | Acter Co Ltd | | | 351 | |
| | 288,996 | | | | | Actuant Corp (Class A) | | | 10,589 | |
| | 178,335 | | | e | | Acuity Brands, Inc | | | 19,496 | |
| | 166,467 | | | | | Adani Enterprises Ltd | | | 708 | |
| | 35,518 | | | * | | Aditya Birla Nuvo Ltd | | | 714 | |
| | 139,500 | | | | | Advan Co Ltd | | | 1,610 | |
| | 49,000 | | | | | Advanced Ceramic X Corp | | | 265 | |
| | 234,486 | | | * | | Aecom Technology Corp | | | 6,901 | |
| | 190,755 | | | | | Aecon Group, Inc | | | 2,889 | |
| | 154,925 | | | * | | Aegion Corp | | | 3,391 | |
| | 75,147 | | | *,e | | Aerovironment, Inc | | | 2,189 | |
| | 19,137 | | | * | | AFG Arbonia-Forster Hldg | | | 675 | |
| | 32,900 | | | e | | AG Growth International Inc | | | 1,383 | |
| | 635,677 | | | | | AGCO Corp | | | 37,626 | |
| | 60,299 | | | | | Aica Kogyo Co Ltd | | | 1,193 | |
| | 40,500 | | | | | Aichi Corp | | | 185 | |
| | 180,300 | | | | | Aida Engineering Ltd | | | 1,954 | |
| | 155,610 | | | | | Air Lease Corp | | | 4,836 | |
| | 247,315 | | | | | Aircastle Ltd | | | 4,739 | |
| | 474,508 | | | | | Airtac International Group | | | 3,859 | |
| | 136,146 | | | | | Akfen Holding AS. | | | 269 | |
| | 25,885 | | | | | Alamo Group, Inc | | | 1,571 | |
| | 142,467 | | | | | Alarko Holding AS | | | 310 | |
| | 122,681 | | | | | Albany International Corp (Class A) | | | 4,408 | |
| | 35,412 | | | | | Alfa Laval AB | | | 910 | |
| | 4,862,540 | | | | | Alfa S.A. de C.V. (Class A) | | | 13,638 | |
| | 710,673 | | | * | | Allegion plc | | | 31,405 | |
| | 12,555,500 | | | | | Alliance Global Group, Inc | | | 7,328 | |
| | 246,030 | | | | | Alliant Techsystems, Inc | | | 29,937 | |
| | 127,979 | | | | | Allied Electronics Corp Ltd (Preference) | | | 293 | |
| | 24,862 | | | | | Alstom Projects India Ltd | | | 151 | |
| | 32,955 | | | | | Alstom RGPT | | | 1,202 | |
| | 87,571 | | | | | Altra Holdings, Inc | | | 2,997 | |
COLLEGE RETIREMENT EQUITIES FUND - Stock Account
| | | | | | | | VALUE | |
| SHARES | | | | | COMPANY | | (000) | |
| | 485,723 | | | | | Amada Co Ltd | | $ | 4,290 | |
| | 77,500 | | | | | Amano Corp | | | 712 | |
| | 124,208 | | | | | Amara Raja Batteries Ltd | | | 675 | |
| | 71,045 | | | * | | Ameresco, Inc | | | 686 | |
| | 40,944 | | | e | | American Railcar Industries, Inc | | | 1,873 | |
| | 41,950 | | | | | American Science & Engineering, Inc | | | 3,017 | |
| | 159,542 | | | *,e | | American Superconductor Corp | | | 262 | |
| | 51,788 | | | * | | American Woodmark Corp | | | 2,047 | |
| | 657,149 | | | | | Ametek, Inc | | | 34,612 | |
| | 34,395 | | | | | Ampco-Pittsburgh Corp | | | 669 | |
| | 34,000 | | | *,m | | Amrep Corp | | | 0 | ^ |
| | 8,337 | | | | | Andritz AG. | | | 522 | |
| | 15,000 | | | | | Antarchile S.A. | | | 203 | |
| | 98,887 | | | *,e | | API Technologies Corp | | | 337 | |
| | 99,920 | | | | | Apogee Enterprises, Inc | | | 3,588 | |
| | 154,307 | | | | | Applied Industrial Technologies, Inc | | | 7,575 | |
| | 70,506 | | | | | Arcadis NV | | | 2,486 | |
| | 79,522 | | | * | | Arcam AB | | | 11,868 | |
| | 64,802 | | | | | Argan, Inc | | | 1,786 | |
| | 24,006 | | | * | | Armstrong World Industries, Inc | | | 1,383 | |
| | 391,937 | | | * | | ArvinMeritor, Inc | | | 4,088 | |
| | 57,600 | | | | | Asahi Diamond Industrial Co Ltd | | | 592 | |
| | 468,042 | | | e | | Asahi Glass Co Ltd | | | 2,914 | |
| | 1,385,608 | | | | | Ashok Leyland Ltd | | | 387 | |
| | 3,132,461 | | | | | Ashtead Group plc | | | 39,515 | |
| | 702,005 | | | | | Assa Abloy AB (Class B) | | | 37,167 | |
| | 160,581 | | | e | | Astaldi S.p.A. | | | 1,690 | |
| | 79,312 | | | | | Astec Industries, Inc | | | 3,064 | |
| | 49,161 | | | * | | Astronics Corp | | | 2,507 | |
| | 1,410 | | | * | | Astronics Corp (Class B) | | | 72 | |
| | 693,016 | | | | | Asunaro Aoki Construction Co Ltd | | | 3,936 | |
| | 230,546 | | | | | Atlas Copco AB (A Shares) | | | 6,401 | |
| | 220,449 | | | | | Atlas Copco AB (B Shares) | | | 5,604 | |
| | 108,119 | | | * | | ATS Automation Tooling Systems, Inc | | | 1,384 | |
| | 335,067 | | | | | Ausdrill Ltd | | | 310 | |
| | 1,892,675 | | | * | | Austal Ltd | | | 1,470 | |
| | 45,233 | | | e | | Austin Engineering Ltd | | | 150 | |
| | 553,397 | | | * | | Aveng Ltd | | | 1,395 | |
| | 6,524,000 | | | * | | AVIC International Holding HK Ltd | | | 291 | |
| | 2,673,300 | | | e | | AviChina Industry & Technology Co | | | 1,559 | |
| | 106,573 | | | | | AZZ, Inc | | | 5,207 | |
| | 46,156 | | | | | B&B Tools AB | | | 845 | |
| | 85,726 | | | e | | Babcock & Wilcox Co | | | 2,931 | |
| | 33,100 | | | | | Badger Daylighting Ltd | | | 2,656 | |
| | 5,978,677 | | | | | BAE Systems plc | | | 43,135 | |
| | 815,236 | | | | | Balfour Beatty plc | | | 3,884 | |
| | 168,000 | | | | | Bando Chemical Industries Ltd | | | 662 | |
| | 524,000 | | | | | Baoye Group Co Ltd | | | 347 | |
COLLEGE RETIREMENT EQUITIES FUND - Stock Account
| | | | | | | | VALUE | |
| SHARES | | | | | COMPANY | | (000) | |
| | 252,768 | | | | | Barloworld Ltd | | $ | 2,412 | |
| | 212,008 | | | | | Barnes Group, Inc | | | 8,122 | |
| | 13,791 | | | | | Bauer AG. | | | 357 | |
| | 36,329 | | | | | BayWa AG. | | | 1,891 | |
| | 553,257 | | | * | | BE Aerospace, Inc | | | 48,150 | |
| | 57 | | | * | | Beacon Power Corp | | | 0 | ^ |
| | 153,003 | | | * | | Beacon Roofing Supply, Inc | | | 6,163 | |
| | 976,800 | | | e | | Beijing Enterprises Holdings Ltd | | | 9,703 | |
| | 242,800 | | | | | Benalec Holdings BHD | | | 63 | |
| | 2,180,700 | | | | | Berjaya Corp BHD | | | 393 | |
| | 801,000 | | | | | BES Engineering Corp | | | 242 | |
| | 528,759 | | | | | Besalco S.A. | | | 567 | |
| | 1,202,884 | | | | | Bharat Heavy Electricals | | | 3,449 | |
| | 8,821 | | | | | BHI Co Ltd | | | 129 | |
| | 350,695 | | | | | Bidvest Group Ltd | | | 8,984 | |
| | 92,570 | | | e | | Bird Construction Income Fund | | | 1,133 | |
| | 153,993 | | | * | | Blount International, Inc | | | 2,228 | |
| | 104,676 | | | *,e | | Bluelinx Holdings, Inc | | | 204 | |
| | 416,703 | | | | | Bodycote plc | | | 4,623 | |
| | 4,152,384 | | | | | Boeing Co | | | 566,759 | |
| | 598,000 | | | | | Boer Power Holdings Ltd | | | 550 | |
| | 2,042,000 | | | | | Bolina Holding Co Ltd | | | 877 | |
| | 2,250,761 | | | e | | Bombardier, Inc | | | 9,768 | |
| | 20,610 | | | | | Boskalis Westminster | | | 1,090 | |
| | 5,593 | | | | | Bossard Holding AG. | | | 1,298 | |
| | 960,073 | | | e | | Bouygues S.A. | | | 36,306 | |
| | 227,222 | | | e | | Bradken Ltd | | | 1,227 | |
| | 180,728 | | | | | Brady Corp (Class A) | | | 5,590 | |
| | 41,708 | | | | | Brenntag AG. | | | 7,741 | |
| | 193,218 | | | | | Briggs & Stratton Corp | | | 4,204 | |
| | 11,696 | | | | | Bucher Industries AG. | | | 3,399 | |
| | 18,806 | | | | | Budimex S.A. | | | 822 | |
| | 196,257 | | | * | | Builders FirstSource, Inc | | | 1,401 | |
| | 166,000 | | | | | Bunka Shutter Co Ltd | | | 1,010 | |
| | 286,910 | | | | | Bunzl plc | | | 6,895 | |
| | 50,756 | | | | | Burckhardt Compression Holding AG. | | | 22,247 | |
| | 332,455 | | | | | CAE, Inc | | | 4,228 | |
| | 163,900 | | | | | Cahya Mata Sarawak BHD | | | 344 | |
| | 60,229 | | | * | | CAI International, Inc | | | 1,420 | |
| | 906,349 | | | *,e | | Capstone Turbine Corp | | | 1,169 | |
| | 13,795 | | | | | Carbone Lorraine | | | 478 | |
| | 186,758 | | | e | | Cardno Ltd | | | 1,154 | |
| | 41,771 | | | | | Cargotec Corp (B Shares) | | | 1,555 | |
| | 507,532 | | | e | | Carillion plc | | | 2,783 | |
| | 246,625 | | | | | Carlisle Cos, Inc | | | 19,582 | |
| | 1,297,658 | | | | | Caterpillar, Inc | | | 117,840 | |
| | 267,900 | | | | | CB Industrial Product Holding BHD | | | 263 | |
COLLEGE RETIREMENT EQUITIES FUND - Stock Account
| | | | | | | | VALUE | |
| SHARES | | | | | COMPANY | | (000) | |
| | 1,072,327 | | | | | Central Glass Co Ltd | | $ | 3,570 | |
| | 22,652 | | | | | CENTROTEC Sustainable AG. | | | 582 | |
| | 370,551 | | | * | | Cersanit Krasnystaw S.A. | | | 254 | |
| | 97,000 | | | * | | Champion Building Materials Co Ltd | | | 43 | |
| | 218,500 | | | | | Changchai Co Ltd | | | 130 | |
| | 1,695,440 | | | e | | Changsha Zoomlion Heavy Industry Science and Technology Development Co Ltd | | | 1,589 | |
| | 2,898,000 | | | *,e | | Charisma Energy Services Ltd | | | 189 | |
| | 99,879 | | | * | | Chart Industries, Inc | | | 9,552 | |
| | 227,615 | | | | | Chemring Group plc | | | 847 | |
| | 712,000 | | | * | | Chengdu Putian Telecom Cable Co Ltd | | | 94 | |
| | 588,644 | | | | | Chicago Bridge & Iron Co NV | | | 48,940 | |
| | 574,050 | | | | | Chien Kuo Construction Co Ltd | | | 268 | |
| | 10,819,000 | | | | | China Automation Group Ltd | | | 2,464 | |
| | 13,741,700 | | | | | China Communications Construction Co Ltd | | | 11,120 | |
| | 51,000 | | | | | China Ecotek Corp | | | 136 | |
| | 570,000 | | | | | China Electric Manufacturing Corp | | | 274 | |
| | 3,854,000 | | | * | | China Energine International Holdings Ltd | | | 349 | |
| | 531,050 | | | | | China Fangda Group Co Ltd | | | 207 | |
| | 882,000 | | | * | | China Glass Holdings Ltd | | | 100 | |
| | 1,566,000 | | | *,e | | China High Speed Transmission Equipment Group Co Ltd | | | 853 | |
| | 557,170 | | | | | China International Marine Containers Group Co Ltd | | | 1,189 | |
| | 2,786,000 | | | e | | China National Materials Co Ltd | | | 602 | |
| | 7,653,700 | | | e | | China Railway Construction Corp | | | 7,641 | |
| | 13,657,100 | | | | | China Railway Group Ltd | | | 7,071 | |
| | 1,353,400 | | | | | China Singyes Solar Technologies Holdings Ltd | | | 1,366 | |
| | 6,037,028 | | | e | | China South Locomotive and Rolling Stock Corp | | | 4,965 | |
| | 3,032,000 | | | | | China State Construction International Holdings Ltd | | | 5,450 | |
| | 308,000 | | | | | China Steel Structure Co Ltd | | | 364 | |
| | 494,000 | | | | | Chip Eng Seng Corp Ltd | | | 282 | |
| | 202,939 | | | | | Chiyoda Corp | | | 2,946 | |
| | 36,100 | | | | | Chiyoda Integre Co Ltd | | | 598 | |
| | 16,942,000 | | | | | Chongqing Machinery & Electric Co Ltd | | | 2,169 | |
| | 65,100 | | | | | Chudenko Corp | | | 1,183 | |
| | 94,989 | | | | | Chugai Ro Co Ltd | | | 235 | |
| | 1,172,000 | | | | | Chung Hsin Electric & Machinery Manufacturing Corp | | | 890 | |
| | 544,630 | | | | | Cintra Concesiones de Infraestructuras de Transporte S.A. | | | 10,550 | |
| | 548,239 | | | * | | CIR-Compagnie Industriali Riunite S.p.A. | | | 863 | |
| | 95,777 | | | | | CIRCOR International, Inc | | | 7,737 | |
| | 1,808,814 | | | e | | Citic Pacific Ltd | | | 2,774 | |
| | 5,487,000 | | | * | | Citic Resources Holdings Ltd | | | 731 | |
| | 183,000 | | | e | | Civmec Ltd | | | 114 | |
| | 17,282 | | | | | CJ Corp | | | 1,911 | |
| | 58,800 | | | | | CKD Corp | | | 639 | |
| | 223,921 | | | | | Clarcor, Inc | | | 14,409 | |
| | 734,477 | | | * | | CNH Industrial NV | | | 8,371 | |
| | 403,866 | | | | | Coastal Contracts BHD | | | 423 | |
| | 227,063 | | | | | Cobham plc | | | 1,034 | |
COLLEGE RETIREMENT EQUITIES FUND - Stock Account
| | | | | | | | VALUE | |
| SHARES | | | | | COMPANY | | (000) | |
| | 459,368 | | | * | | Cofide S.p.A. | | $ | 355 | |
| | 40,454 | | | | | Coleman Cable, Inc | | | 1,061 | |
| | 424,846 | | | *,e | | Colfax Corp | | | 27,058 | |
| | 73,500 | | | * | | Columbus McKinnon Corp | | | 1,995 | |
| | 173,287 | | | | | Comfort Systems USA, Inc | | | 3,360 | |
| | 80,309 | | | * | | Commercial Vehicle Group, Inc | | | 584 | |
| | 2,481,697 | | | | | Compagnie de Saint-Gobain | | | 136,709 | |
| | 7,985 | | | | | Compagnie d’Entreprises CFE | | | 711 | |
| | 263,300 | | | | | COMSYS Holdings Corp | | | 4,140 | |
| | 83,681 | | | | | Concentric AB | | | 947 | |
| | 2,263 | | | | | Construcciones y Auxiliar de Ferrocarriles S.A. | | | 1,197 | |
| | 827,000 | | | | | Continental Engineering Corp | | | 298 | |
| | 1,190,000 | | | e | | Cosco Corp Singapore Ltd | | | 714 | |
| | 1,452,000 | | | e | | Cosco International Holdings Ltd | | | 619 | |
| | 23,385 | | | | | Cosel Co Ltd | | | 271 | |
| | 84,657 | | | e | | Costain Group plc | | | 388 | |
| | 89,299 | | | | | Cramo Oyj (Series B) | | | 1,890 | |
| | 215,469 | | | | | Crane Co | | | 14,490 | |
| | 751,886 | | | | | Crompton Greaves Ltd | | | 1,567 | |
| | 1,084,590 | | | | | CSBC Corp Taiwan | | | 699 | |
| | 712,300 | | | | | CTCI Corp | | | 1,156 | |
| | 77,509 | | | | | Cubic Corp | | | 4,082 | |
| | 628,946 | | | | | Cummins, Inc | | | 88,663 | |
| | 185,165 | | | | | Curtiss-Wright Corp | | | 11,523 | |
| | 556,000 | | | | | DA CIN Construction Co Ltd | | | 525 | |
| | 68,007 | | | | | Daelim Industrial Co | | | 6,076 | |
| | 19,970 | | | | | Daesang Holdings Co Ltd | | | 157 | |
| | 16,634 | | | | | Daetwyler Holding AG. | | | 2,304 | |
| | 105,215 | | | * | | Daewoo Engineering & Construction Co Ltd | | | 735 | |
| | 52,038 | | | | | Daewoo International Corp | | | 2,041 | |
| | 113,311 | | | | | Daewoo Shipbuilding & Marine Engineering Co Ltd | | | 3,769 | |
| | 98,500 | | | | | Daifuku Co Ltd | | | 1,261 | |
| | 206,641 | | | | | Daihen Corp | | | 959 | |
| | 52,000 | | | | | Daiichi Jitsugyo Co Ltd | | | 233 | |
| | 309,278 | | | | | Daikin Industries Ltd | | | 19,300 | |
| | 45,000 | | | | | Daiwa Industries Ltd | | | 305 | |
| | 190,200 | | | | | Dalian Refrigeration Co Ltd | | | 181 | |
| | 2,480,687 | | | | | Danaher Corp | | | 191,509 | |
| | 13,791 | | | | | Danieli & Co S.p.A. | | | 471 | |
| | 45,871 | | | | | Danieli & Co S.p.A. (RSP) | | | 1,023 | |
| | 189,581 | | | | | DCC plc | | | 9,321 | |
| | 376,831 | | | e | | Decmil Group Ltd | | | 838 | |
| | 324,419 | | | | | Deere & Co | | | 29,629 | |
| | 12,900 | | | | | Denyo Co Ltd | | | 183 | |
| | 105,282 | | | * | | Deutz AG. | | | 942 | |
| | 812,000 | | | | | Dialog Group BHD | | | 889 | |
| | 286,493 | | | * | | DigitalGlobe, Inc | | | 11,789 | |
| | 97,729 | | | * | | Discount Investment Corp | | | 712 | |
COLLEGE RETIREMENT EQUITIES FUND - Stock Account
| | | | | | | | VALUE | |
| SHARES | | | | | COMPANY | | (000) | |
| | 876,910 | | | | | DMCI Holdings, Inc | | $ | 1,108 | |
| | 738,308 | | | * | | Dogan Sirketler Grubu Holdings | | | 248 | |
| | 119,814 | | | | | Donaldson Co, Inc | | | 5,207 | |
| | 19,100 | | | e | | Dongfang Electric Co Ltd | | | 34 | |
| | 26,169 | | | | | Dongkuk Structures & Construction Co Ltd | | | 108 | |
| | 31,563 | | | | | Doosan Corp | | | 4,176 | |
| | 114,330 | | | * | | Doosan Engine Co Ltd | | | 961 | |
| | 56,103 | | | | | Doosan Heavy Industries and Construction Co Ltd | | | 1,887 | |
| | 108,060 | | | * | | Doosan Infracore Co Ltd | | | 1,294 | |
| | 76,573 | | | | | Douglas Dynamics, Inc | | | 1,288 | |
| | 476,928 | | | | | Dover Corp | | | 46,043 | |
| | 39,338 | | | * | | Ducommun, Inc | | | 1,173 | |
| | 80,746 | | | | | Duerr AG. | | | 7,215 | |
| | 70,881 | | | e | | Duro Felguera S.A. | | | 478 | |
| | 37,999 | | | * | | DXP Enterprises, Inc | | | 4,377 | |
| | 123,840 | | | * | | Dycom Industries, Inc | | | 3,442 | |
| | 56,081 | | | e | | Dynamic Materials Corp | | | 1,219 | |
| | 416,000 | | | | | Dynapack International Technology Corp | | | 1,160 | |
| | 423,900 | | | | | Dynasty Ceramic PCL | | | 630 | |
| | 1,804,046 | | | | | Eaton Corp | | | 137,324 | |
| | 581,828 | | | | | Ebara Corp | | | 3,745 | |
| | 44,697 | | | | | Eczacibasi Yatirim Holding | | | 108 | |
| | 863,100 | | | | | EEI Corp | | | 186 | |
| | 3,287 | | | | | Eicher Motors Ltd | | | 264 | |
| | 45,931 | | | | | Eiffage S.A. | | | 2,647 | |
| | 56,227 | | | | | Elbit Systems Ltd | | | 3,396 | |
| | 3,196 | | | | | Electra Israel Ltd | | | 474 | |
| | 303,012 | | | | | EMCOR Group, Inc | | | 12,860 | |
| | 1,065,920 | | | | | Emerson Electric Co | | | 74,806 | |
| | 718,982 | | | | | Empresa Brasileira de Aeronautica S.A. | | | 5,757 | |
| | 809,500 | | | *,e | | Empresas ICA Sociedad Controladora S.A. de C.V. | | | 1,671 | |
| | 82,218 | | | | | Encore Wire Corp | | | 4,456 | |
| | 10,400 | | | e | | Endo Lighting Corp | | | 207 | |
| | 163,502 | | | *,e | | Energy Recovery, Inc | | | 909 | |
| | 222,970 | | | | | EnerSys | | | 15,628 | |
| | 67,410 | | | * | | Engility Holdings, Inc | | | 2,251 | |
| | 468,493 | | | | | Enka Insaat ve Sanayi AS | | | 1,314 | |
| | 52,251 | | | *,e | | Enphase Energy, Inc | | | 331 | |
| | 75,045 | | | *,e | | EnPro Industries, Inc | | | 4,326 | |
| | 722,000 | | | | | Enric Energy Equipment Holdings Ltd | | | 1,167 | |
| | 19,501 | | | *,e | | Erickson Air-Crane, Inc | | | 405 | |
| | 110,098 | | | | | ESCO Technologies, Inc | | | 3,772 | |
| | 182,023 | | | * | | Esterline Technologies Corp | | | 18,559 | |
| | 1,790,670 | | | | | European Aeronautic Defence and Space Co | | | 137,470 | |
| | 1,292,000 | | | | | EVA Precision Industrial Holdings Ltd | | | 182 | |
| | 721,800 | | | | | Eversendai Corp BHD | | | 229 | |
| | 818,494 | | | | | Exelis, Inc | | | 15,600 | |
| | 7,419 | | | | | Faiveley S.A. | | | 535 | |
| | 127,688 | | | | | Fanuc Ltd | | | 23,398 | |
COLLEGE RETIREMENT EQUITIES FUND - Stock Account
| | | | | | | | VALUE | |
| SHARES | | | | | COMPANY | | (000) | |
| | 3,302,000 | | | e | | Far East Global Group Ltd | | $ | 734 | |
| | 3,646,949 | | | | | Far Eastern Textile Co Ltd | | | 4,217 | |
| | 654,496 | | | e | | Fastenal Co | | | 31,095 | |
| | 226,814 | | | * | | Federal Signal Corp | | | 3,323 | |
| | 227,099 | | | | | Fenner plc | | | 1,829 | |
| | 2,337,236 | | | | | Ferreyros S.A. | | | 1,613 | |
| | 79,523 | | | * | | Finmeccanica S.p.A. | | | 604 | |
| | 484,053 | | | e | | Finning International, Inc | | | 12,372 | |
| | 1,516,000 | | | e | | First Tractor Co | | | 1,192 | |
| | 191,722 | | | *,e | | Flow International Corp | | | 775 | |
| | 292,355 | | | | | Flowserve Corp | | | 23,046 | |
| | 71,207 | | | e | | FLSmidth & Co AS | | | 3,894 | |
| | 1,226,221 | | | | | Fluor Corp | | | 98,453 | |
| | 51,961 | | | *,e | | Fomento de Construcciones y Contratas S.A. | | | 1,159 | |
| | 111,919 | | | | | Forge Group Ltd | | | 175 | |
| | 319,700 | | | | | Forjas Taurus S.A. (Preference) | | | 309 | |
| | 1,957,265 | | | | | Fortune Brands Home & Security, Inc | | | 89,447 | |
| | 567,100 | | | | | Foshan Electrical and Lighting Co Ltd | | | 409 | |
| | 1,219,336 | | | * | | Foster Wheeler AG. | | | 40,262 | |
| | 179,045 | | | | | Franklin Electric Co, Inc | | | 7,993 | |
| | 385,000 | | | e | | Fraser and Neave Ltd | | | 1,068 | |
| | 46,153 | | | | | Freightcar America, Inc | | | 1,229 | |
| | 16,394 | | | * | | Frigoglass S.A. | | | 115 | |
| | 401,942 | | | | | FSP Technology, Inc | | | 367 | |
| | 183,200 | | | * | | Fudo Tetra Corp | | | 319 | |
| | 470,519 | | | *,e | | FuelCell Energy, Inc | | | 663 | |
| | 2,074,587 | | | | | Fuji Electric Holdings Co Ltd | | | 9,720 | |
| | 81,692 | | | | | Fuji Machine Manufacturing Co Ltd | | | 678 | |
| | 1,149,978 | | | | | Fujikura Ltd | | | 5,398 | |
| | 81,000 | | | | | Fujitec Co Ltd | | | 1,053 | |
| | 114,386 | | | * | | Furmanite Corp | | | 1,215 | |
| | 379,000 | | | | | Furukawa Co Ltd | | | 751 | |
| | 1,677,000 | | | | | Furukawa Electric Co Ltd | | | 4,216 | |
| | 36,419 | | | | | Futaba Corp/Chiba | | | 476 | |
| | 209,786 | | | | | Galliford Try plc | | | 4,061 | |
| | 243,690 | | | *,e | | Gamesa Corp Tecnologica S.A. | | | 2,544 | |
| | 1,983,625 | | | | | Gamuda BHD | | | 2,910 | |
| | 88,346 | | | | | GATX Corp | | | 4,609 | |
| | 97,017 | | | | | GEA Group AG. | | | 4,626 | |
| | 24,046 | | | | | Geberit AG. | | | 7,295 | |
| | 207,578 | | | *,e | | GenCorp, Inc | | | 3,741 | |
| | 248,720 | | | | | Generac Holdings, Inc | | | 14,087 | |
| | 187,698 | | | | | General Cable Corp | | | 5,520 | |
| | 1,229,404 | | | | | General Dynamics Corp | | | 117,470 | |
| | 41,884,029 | | | | | General Electric Co | | | 1,174,009 | |
| | 10,741 | | | | | Georg Fischer AG. | | | 7,562 | |
| | 3,226 | | | | | Gesco AG. | | | 311 | |
| | 121,593 | | | * | | Gibraltar Industries, Inc | | | 2,260 | |
| | 212,221 | | | | | Giken Seisakusho Co, Inc | | | 1,651 | |
COLLEGE RETIREMENT EQUITIES FUND - Stock Account
| | | | | | | | VALUE | |
| SHARES | | | | | COMPANY | | (000) | |
| | 147,545 | | | | | Gildemeister AG. | | $ | 4,708 | |
| | 45,675 | | | | | Global Brass & Copper Holdings, Inc | | | 756 | |
| | 70,037 | | | | | Global Power Equipment Group, Inc | | | 1,371 | |
| | 86,456 | | | | | Glory Ltd | | | 2,244 | |
| | 960,000 | | | * | | GMR Infrastructure Ltd | | | 386 | |
| | 70,936 | | | | | Gorman-Rupp Co | | | 2,371 | |
| | 155,399 | | | | | Graco, Inc | | | 12,140 | |
| | 456,185 | | | *,e | | GrafTech International Ltd | | | 5,123 | |
| | 1,825,419 | | | | | Grafton Group plc | | | 19,558 | |
| | 33,667 | | | | | Graham Corp | | | 1,222 | |
| | 69,163 | | | | | Grana y Montero S.A. | | | 294 | |
| | 108,688 | | | * | | Grana y Montero S.A. (ADR) | | | 2,307 | |
| | 149,664 | | | | | Granite Construction, Inc | | | 5,235 | |
| | 9,950 | | | | | Graphite India Ltd | | | 13 | |
| | 223,933 | | | * | | Great Lakes Dredge & Dock Corp | | | 2,060 | |
| | 22,415 | | | | | Greaves Cotton Ltd | | | 24 | |
| | 95,002 | | | * | | Greenbrier Cos, Inc | | | 3,120 | |
| | 194,421 | | | | | Griffon Corp | | | 2,568 | |
| | 58,821 | | | * | | Grontmij (ADR) | | | 292 | |
| | 197,536 | | | | | Group Five Ltd | | | 763 | |
| | 1,097,137 | | | e | | Grupo Carso S.A. de C.V. (Series A1) | | | 5,836 | |
| | 37,009 | | | | | GS Engineering & Construction Corp | | | 1,072 | |
| | 10,060 | | | | | GS Global Corp | | | 85 | |
| | 425,000 | | | | | GS Yuasa Corp | | | 2,445 | |
| | 224,800 | | | | | Guangzhou Shipyard International Co Ltd | | | 459 | |
| | 284,209 | | | | | GWA International Ltd | | | 773 | |
| | 95,139 | | | * | | H&E Equipment Services, Inc | | | 2,819 | |
| | 338,000 | | | | | Haitian International Holdings Ltd | | | 764 | |
| | 41,692 | | | | | Haldex AB | | | 389 | |
| | 6,670 | | | | | Halla Engineering & Construction Corp | | | 33 | |
| | 835,580 | | | | | Hangzhou Steam Turbine Co | | | 1,190 | |
| | 53,291 | | | * | | Hanjin Heavy Industries & Construction Co Ltd | | | 610 | |
| | 695,395 | | | | | Hanwa Co Ltd | | | 3,726 | |
| | 1,373,600 | | | | | HAP Seng Consolidated BHD | | | 1,262 | |
| | 2,466,000 | | | | | Harbin Power Equipment | | | 1,600 | |
| | 47,734 | | | | | Hardinge, Inc | | | 691 | |
| | 46,990 | | | | | Harsco Corp | | | 1,317 | |
| | 226,417 | | | | | Havells India Ltd | | | 2,901 | |
| | 804,600 | | | | | Hazama Ando Corp | | | 2,876 | |
| | 130,306 | | | * | | HD Supply Holdings, Inc | | | 3,129 | |
| | 215,607 | | | e | | Heico Corp | | | 12,494 | |
| | 259,276 | | | *,e | | Heidelberger Druckmaschinen | | | 922 | |
| | 146,000 | | | * | | Hellenic Technodomiki Tev S.A. | | | 639 | |
| | 2,804,000 | | | | | Henderson Investment Ltd | | | 225 | |
| | 238,865 | | | * | | Hexcel Corp | | | 10,675 | |
| | 21,400 | | | | | Hibiya Engineering Ltd | | | 263 | |
| | 575,886 | | | | | Hills Industries Ltd | | | 897 | |
| | 1,148,981 | | | | | Hino Motors Ltd | | | 18,100 | |
COLLEGE RETIREMENT EQUITIES FUND - Stock Account
| | | | | | | | VALUE | |
| SHARES | | | | | COMPANY | | (000) | |
| | 19,000 | | | | | Hisaka Works Ltd | | $ | 179 | |
| | 28,591 | | | | | Hitachi Construction Machinery Co Ltd | | | 612 | |
| | 55,000 | | | | | Hitachi Koki Co Ltd | | | 403 | |
| | 176,900 | | | | | Hitachi Zosen Corp | | | 1,356 | |
| | 216,935 | | | | | Hiwin Technologies Corp | | | 1,833 | |
| | 4,838,000 | | | *,e | | HKC Holdings Ltd | | | 163 | |
| | 44,609 | | | | | Hochtief AG. | | | 3,818 | |
| | 446,735 | | | | | Hock Seng Lee BHD | | | 255 | |
| | 17,322 | | | | | Homag Group AG. | | | 456 | |
| | 6,105,717 | | | | | Honeywell International, Inc | | | 557,879 | |
| | 159,000 | | | | | Hong Leong Asia Ltd | | | 168 | |
| | 709,331 | | | | | Hopewell Holdings | | | 2,405 | |
| | 43,000 | | | | | Hoshizaki Electric Co Ltd | | | 1,529 | |
| | 72,707 | | | | | Hosken Consolidated Investments Ltd | | | 970 | |
| | 30,000 | | | | | Hosokawa Micron Corp | | | 198 | |
| | 67,709 | | | | | Houston Wire & Cable Co | | | 906 | |
| | 2,370,000 | | | | | Hsin Chong Construction Group Ltd | | | 368 | |
| | 911,000 | | | | | HUA ENG Wire & Cable | | | 355 | |
| | 44,734 | | | | | Hubbell, Inc (Class B) | | | 4,872 | |
| | 19,599 | | | | | Huber & Suhner AG. | | | 1,030 | |
| | 17,797 | | | | | Hudaco Industries Ltd | | | 178 | |
| | 151,852 | | | | | Huntington Ingalls | | | 13,668 | |
| | 25,575 | | | | | Hurco Cos, Inc | | | 640 | |
| | 3,282,961 | | | | | Hutchison Whampoa Ltd | | | 44,733 | |
| | 17,644 | | | | | Hy-Lok Corp | | | 448 | |
| | 34,098 | | | | | Hyster-Yale Materials Handling, Inc | | | 3,177 | |
| | 40,020 | | | | | Hyundai Corp | | | 1,344 | |
| | 64,846 | | | | | Hyundai Development Co | | | 1,429 | |
| | 85,778 | | | | | Hyundai Engineering & Construction Co Ltd | | | 4,945 | |
| | 63,035 | | | | | Hyundai Heavy Industries | | | 15,393 | |
| | 10,837 | | | | | Hyundai Mipo Dockyard | | | 1,833 | |
| | 26,700 | | | | | Idec Corp | | | 235 | |
| | 305,307 | | | | | IDEX Corp | | | 22,547 | |
| | 669,019 | | | * | | Ihlas Holding | | | 131 | |
| | 200,920 | | | * | | II-VI, Inc | | | 3,536 | |
| | 1,303,307 | | | | | IJM Corp BHD | | | 2,342 | |
| | 793,429 | | | | | Illinois Tool Works, Inc | | | 66,712 | |
| | 55,470 | | | | | IMARKETKOREA,Inc | | | 1,355 | |
| | 382,032 | | | | | IMI plc | | | 9,675 | |
| | 35,033 | | | | | Implenia AG. | | | 2,559 | |
| | 26,422 | | | | | IMS-Intl Metal Service | | | 474 | |
| | 417,195 | | | e | | Imtech NV | | | 1,225 | |
| | 63,010 | | | | | Inaba Denki Sangyo Co Ltd | | | 1,965 | |
| | 119,684 | | | | | Inabata & Co Ltd | | | 1,312 | |
| | 45,480 | | | | | Indus Holding AG. | | | 1,828 | |
| | 52,828 | | | | | Industria Macchine Automatiche S.p.A. | | | 2,035 | |
| | 39,000 | | | * | | Industrias Romi S.A. | | | 98 | |
| | 26,123 | | | | | Indutrade AB | | | 1,091 | |
COLLEGE RETIREMENT EQUITIES FUND - Stock Account
| | | | | | | | VALUE | |
| SHARES | | | | | COMPANY | | (000) | |
| | 2,383,786 | | | | | Ingersoll-Rand plc | | $ | 146,841 | |
| | 40,422 | | | *,e | | Innovative Solutions & Support, Inc | | | 295 | |
| | 86,827 | | | | | Insteel Industries, Inc | | | 1,974 | |
| | 5,360,000 | | | * | | Interchina Holdings Co | | | 346 | |
| | 190,654 | | | | | Interpump Group S.p.A. | | | 2,288 | |
| | 310,224 | | | | | Interserve plc | | | 3,201 | |
| | 2,537,174 | | | | | Invensys plc | | | 21,446 | |
| | 23,564 | | | | | Invicta Holdings Ltd | | | 279 | |
| | 315,100 | | | | | Iochpe-Maxion S.A. | | | 3,483 | |
| | 537,231 | | | | | IRB Infrastructure Developers Ltd | | | 807 | |
| | 12,320 | | | * | | IS Dongseo Co Ltd | | | 186 | |
| | 225,000 | | | e | | Iseki & Co Ltd | | | 673 | |
| | 181,000 | | | | | I-Sheng Electric Wire & Cable Co Ltd | | | 257 | |
| | 4,911,417 | | | | | Ishikawajima-Harima Heavy Industries Co Ltd | | | 21,240 | |
| | 1,912,350 | | | * | | Italian-Thai Development PCL | | | 228 | |
| | 2,741,572 | | | | | Itochu Corp | | | 33,893 | |
| | 630,831 | | | | | ITT Corp | | | 27,391 | |
| | 64,128 | | | * | | IVRCL Infrastructures & Projects Ltd | | | 17 | |
| | 446,000 | | | | | Iwatani International Corp | | | 2,265 | |
| | 275,502 | | | * | | Jacobs Engineering Group, Inc | | | 17,354 | |
| | 263,792 | | | * | | Jain Irrigation Systems Ltd | | | 310 | |
| | 1,205,815 | | | | | Jaiprakash Associates Ltd | | | 1,065 | |
| | 125,500 | | | *,e | | Japan Bridge Corp | | | 239 | |
| | 172,604 | | | | | Japan Pulp & Paper Co Ltd | | | 541 | |
| | 157,823 | | | | | Japan Steel Works Ltd | | | 884 | |
| | 1,699,400 | | | | | JG Summit Holdings (Series B) | | | 1,478 | |
| | 179,481 | | | | | JGC Corp | | | 7,044 | |
| | 7,060,000 | | | *,e | | Jia Sheng Holdings Ltd | | | 320 | |
| | 4,279,000 | | | *,e | | Jiangsu Rongsheng Heavy Industry Group Co Ltd | | | 669 | |
| | 326,000 | | | m | | Jingwei Textile Machinery | | | 255 | |
| | 140,500 | | | | | John Bean Technologies Corp | | | 4,121 | |
| | 3,435,500 | | | | | Johnson Electric Holdings Ltd | | | 3,326 | |
| | 1,329,875 | | | e | | Joy Global, Inc | | | 77,784 | |
| | 638,854 | | | | | JTEKT Corp | | | 10,901 | |
| | 179,000 | | | * | | Juki Corp | | | 390 | |
| | 33,285 | | | | | Jungheinrich AG. | | | 2,168 | |
| | 7,506 | | | * | | JVM Co Ltd | | | 350 | |
| | 41,590 | | | | | Kadant, Inc | | | 1,685 | |
| | 181,941 | | | | | Kajima Corp | | | 684 | |
| | 94,593 | | | | | Kaman Corp | | | 3,758 | |
| | 26,000 | | | | | Kamei Corp | | | 205 | |
| | 29,000 | | | | | Kanamoto Co Ltd | | | 738 | |
| | 363,000 | | | | | Kandenko Co Ltd | | | 2,047 | |
| | 580,000 | | | | | Kanematsu Corp | | | 955 | |
| | 23,600 | | | | | Katakura Industries Co Ltd | | | 269 | |
| | 56,000 | | | | | Kato Works Co Ltd | | | 360 | |
| | 1,105,640 | | | | | Kawasaki Heavy Industries Ltd | | | 4,643 | |
| | 1,588,528 | | | | | KBR, Inc | | | 50,658 | |
COLLEGE RETIREMENT EQUITIES FUND - Stock Account
| | | | | | | | VALUE | |
| SHARES | | | | | COMPANY | | (000) | |
| | 19,006 | | | | | KCC Corp | | $ | 8,451 | |
| | 55,785 | | | | | KCI Konecranes Oyj | | | 1,979 | |
| | 153,417 | | | | | Keller Group plc | | | 2,919 | |
| | 10,657 | | | | | Kendrion NV | | | 350 | |
| | 1,654,861 | | | | | Kennametal, Inc | | | 86,169 | |
| | 286,642 | | | | | Kentz Corp Ltd | | | 3,000 | |
| | 126,300 | | | | | Kepler Weber S.A. | | | 2,195 | |
| | 2,699,707 | | | e | | Keppel Corp Ltd | | | 23,981 | |
| | 109,885 | | | *,e | | KEYW Holding Corp | | | 1,477 | |
| | 46,099 | | | | | KHD Humboldt Wedag International AG. | | | 410 | |
| | 72,825 | | | | | Kier Group plc | | | 2,213 | |
| | 93,730 | | | | | Kinden Corp | | | 981 | |
| | 157,000 | | | | | King Slide Works Co Ltd | | | 1,774 | |
| | 200,574 | | | | | Kingspan Group plc | | | 3,587 | |
| | 49,000 | | | | | Kinik Co | | | 121 | |
| | 50,000 | | | | | Kinki Sharyo Co Ltd | | | 156 | |
| | 38,119 | | | * | | KION Group AG. | | | 1,611 | |
| | 112,600 | | | | | Kitz Corp | | | 566 | |
| | 126,891 | | | * | | Kloeckner & Co AG. | | | 1,741 | |
| | 1,638,517 | | | | | KOC Holding AS | | | 6,718 | |
| | 19,790 | | | * | | Kolon Engineering & Construction Co Ltd | | | 59 | |
| | 1,309,967 | | | | | Komatsu Ltd | | | 26,895 | |
| | 3,954 | | | | | Komax Holding AG. | | | 600 | |
| | 203,060 | | | * | | Kombassan Holdings AS | | | 227 | |
| | 63,390 | | | | | Komori Corp | | | 1,081 | |
| | 515,254 | | | | | Kone Oyj (Class B) | | | 23,237 | |
| | 269,445 | | | e | | Koninklijke BAM Groep NV | | | 1,405 | |
| | 829,819 | | | | | Koninklijke Philips Electronics NV | | | 30,555 | |
| | 12,764 | | | * | | Koor Industries Ltd | | | 248 | |
| | 72,525 | | | | | Kopex S.A. | | | 253 | |
| | 48,040 | | | | | Korea Aerospace Industries Ltd | | | 1,322 | |
| | 21,090 | | | | | Korea Electric Terminal Co Ltd | | | 831 | |
| | 154,122 | | | *,e | | Kratos Defense & Security Solutions, Inc | | | 1,184 | |
| | 15,652 | | | | | Krones AG. | | | 1,345 | |
| | 1,200,863 | | | | | Kubota Corp | | | 19,919 | |
| | 31,211 | | | e | | KUKA AG. | | | 1,465 | |
| | 170,000 | | | *,e | | Kumagai Gumi Co Ltd | | | 497 | |
| | 5,000 | | | | | Kumho Electric Co Ltd | | | 124 | |
| | 7,795 | | | * | | Kumho Industrial Co Ltd | | | 87 | |
| | 60,198 | | | | | Kurita Water Industries Ltd | | | 1,249 | |
| | 101,679 | | | | | Kuroda Electric Co Ltd | | | 1,526 | |
| | 28,400 | | | | | Kyokuto Kaihatsu Kogyo Co Ltd | | | 366 | |
| | 117,000 | | | | | Kyosan Electric Manufacturing Co Ltd | | | 386 | |
| | 298,300 | | | | | Kyowa Exeo Corp | | | 3,945 | |
| | 109,000 | | | | | Kyudenko Corp | | | 740 | |
| | 395,293 | | | | | L-3 Communications Holdings, Inc | | | 42,241 | |
| | 1,074 | | | * | | Lakshmi Machine Works Ltd | | | 48 | |
| | 1,161,918 | | | * | | Lanco Infratech Ltd | | | 144 | |
COLLEGE RETIREMENT EQUITIES FUND - Stock Account
| | | | | | | | VALUE | |
| SHARES | | | | | COMPANY | | (000) | |
| | 550,011 | | | | | Larsen & Toubro Ltd | | $ | 9,539 | |
| | 75,719 | | | *,e | | Layne Christensen Co | | | 1,293 | |
| | 43,721 | | | | | LB Foster Co (Class A) | | | 2,068 | |
| | 165,475 | | | | | Legrand S.A. | | | 9,120 | |
| | 908,398 | | | e | | Leighton Holdings Ltd | | | 13,119 | |
| | 250,218 | | | | | Lennox International, Inc | | | 21,284 | |
| | 111,954 | | | | | LG Corp | | | 6,800 | |
| | 16,573 | | | | | LG Hausys Ltd | | | 2,226 | |
| | 79,170 | | | | | LG International Corp | | | 2,162 | |
| | 263,421 | | | | | Lincoln Electric Holdings, Inc | | | 18,792 | |
| | 67,733 | | | *,e | | Lindab International AB | | | 668 | |
| | 44,024 | | | e | | Lindsay Manufacturing Co | | | 3,643 | |
| | 7,127 | | | e | | LISI | | | 1,057 | |
| | 722,591 | | | | | LIXIL Group Corp | | | 19,837 | |
| | 46,497 | | | *,e | | LMI Aerospace, Inc | | | 685 | |
| | 311,516 | | | | | Lockheed Martin Corp | | | 46,310 | |
| | 3,040,000 | | | *,e | | Lonking Holdings Ltd | | | 594 | |
| | 20,588 | | | | | LS Cable Ltd | | | 1,581 | |
| | 16,942 | | | | | LS Industrial Systems Co Ltd | | | 1,056 | |
| | 79,907 | | | | | LSI Industries, Inc | | | 693 | |
| | 78,157 | | | * | | Lydall, Inc | | | 1,377 | |
| | 13,518 | | | | | Mabuchi Motor Co Ltd | | | 804 | |
| | 284,114 | | | | | MACA Ltd | | | 667 | |
| | 48,797 | | | | | MacDonald Dettwiler & Associates Ltd | | | 3,781 | |
| | 141,000 | | | | | Maeda Corp | | | 934 | |
| | 15,600 | | | | | Maeda Kosen Co Ltd | | | 184 | |
| | 84,541 | | | | | Maeda Road Construction Co Ltd | | | 1,389 | |
| | 126,640 | | | *,e | | Maire Tecnimont S.p.A | | | 284 | |
| | 110,748 | | | | | Makino Milling Machine Co Ltd | | | 956 | |
| | 57,699 | | | | | Makita Corp | | | 3,035 | |
| | 24,900 | | | | | Malaysia Marine and Heavy Engineering Sdn BHD | | | 27 | |
| | 2,224,300 | | | | | Malaysian Resources Corp BHD | | | 878 | |
| | 6,974 | | | | | MAN AG. | | | 856 | |
| | 44,944 | | | * | | Manitex International, Inc | | | 714 | |
| | 10,434 | | | | | Manitou BF S.A. | | | 198 | |
| | 157,445 | | | | | Manitowoc Co, Inc | | | 3,672 | |
| | 467,700 | | | | | Marcopolo S.A. | | | 1,011 | |
| | 3,270,632 | | | | | Marubeni Corp | | | 23,546 | |
| | 4,114,996 | | | | | Masco Corp | | | 93,698 | |
| | 188,396 | | | * | | Mastec, Inc | | | 6,164 | |
| | 37,000 | | | | | Max Co Ltd | | | 406 | |
| | 137,165 | | | | | MAX India Ltd | | | 479 | |
| | 325,451 | | | | | Meggitt plc | | | 2,849 | |
| | 223,000 | | | | | Meidensha Corp | | | 833 | |
| | 1,020,863 | | | | | Melrose Industries plc | | | 5,179 | |
| | 12,491 | | | | | Metka S.A. | | | 197 | |
| | 14,365 | | | | | Metso Oyj | | | 614 | |
| | 99,654 | | | * | | Meyer Burger Technology AG. | | | 1,191 | |
COLLEGE RETIREMENT EQUITIES FUND - Stock Account
| | | | | | | | VALUE | |
| SHARES | | | | | COMPANY | | (000) | |
| | 66,003 | | | | | Micron Machinery Co Ltd | | $ | 1,570 | |
| | 63,412 | | | * | | Middleby Corp | | | 15,217 | |
| | 45,228 | | | | | Miller Industries, Inc | | | 843 | |
| | 391,900 | | | | | Mills Estruturas e Servicos de | | | 5,482 | |
| | 1,299,000 | | | | | Minebea Co Ltd | | | 9,517 | |
| | 190,900 | | | | | Miraito Holdings Corp | | | 1,699 | |
| | 102,300 | | | | | MISUMI Group, Inc | | | 3,216 | |
| | 2,748,943 | | | | | Mitsubishi Corp | | | 52,774 | |
| | 1,459,874 | | | | | Mitsubishi Electric Corp | | | 18,357 | |
| | 3,725,696 | | | | | Mitsubishi Heavy Industries Ltd | | | 23,075 | |
| | 31,000 | | | e | | Mitsubishi Nichiyu Forklift Co Ltd | | | 224 | |
| | 109,700 | | | | | Mitsuboshi Belting Co Ltd | | | 628 | |
| | 3,413,865 | | | | | Mitsui & Co Ltd | | | 47,593 | |
| | 1,298,300 | | | | | Mitsui Engineering & Shipbuilding Co Ltd | | | 2,682 | |
| | 183,000 | | | | | Mitsui Matsushima Co Ltd | | | 285 | |
| | 31,600 | | | | | Miura Co Ltd | | | 789 | |
| | 3,849,674 | | | | | MMC Corp BHD | | | 3,385 | |
| | 265,068 | | | e | | Monadelphous Group Ltd | | | 4,414 | |
| | 57,500 | | | e | | MonotaRO Co Ltd | | | 1,171 | |
| | 182,915 | | | * | | Moog, Inc (Class A) | | | 12,427 | |
| | 367,620 | | | | | Morgan Crucible Co plc | | | 1,939 | |
| | 46,384 | | | | | Morgan Sindall plc | | | 581 | |
| | 117,800 | | | | | Mori Seiki Co Ltd | | | 2,123 | |
| | 36,000 | | | | | Morita Holdings Corp | | | 302 | |
| | 82,398 | | | | | Mota Engil SGPS S.A. | | | 490 | |
| | 639,307 | | | * | | MRC Global, Inc | | | 20,624 | |
| | 202,070 | | | | | MSC Industrial Direct Co (Class A) | | | 16,341 | |
| | 79,492 | | | | | MTU Aero Engines Holding AG. | | | 7,812 | |
| | 766,166 | | | | | Mudajaya Group BHD | | | 679 | |
| | 123,883 | | | | | Mueller Industries, Inc | | | 7,806 | |
| | 845,701 | | | | | Mueller Water Products, Inc (Class A) | | | 7,924 | |
| | 267,700 | | | | | Muhibbah Engineering M BHD | | | 187 | |
| | 648,379 | | | *,e | | Murray & Roberts Holdings Ltd | | | 1,657 | |
| | 78,701 | | | * | | MYR Group, Inc | | | 1,974 | |
| | 33,640 | | | | | Nabtesco Corp | | | 776 | |
| | 209,332 | | | | | Nachi-Fujikoshi Corp | | | 1,182 | |
| | 252,200 | | | | | Nagase & Co Ltd | | | 3,058 | |
| | 154,200 | | | | | Namura Shipbuilding Co Ltd | | | 2,085 | |
| | 20,097 | | | *,e | | National Presto Industries, Inc | | | 1,618 | |
| | 355,976 | | | *,e | | Navistar International Corp | | | 13,595 | |
| | 13,053 | | | | | NCC AB | | | 425 | |
| | 230,811 | | | e | | NCC AB (B Shares) | | | 7,538 | |
| | 72,403 | | | * | | NCI Building Systems, Inc | | | 1,270 | |
| | 23,700 | | | | | NEC Capital Solutions Ltd | | | 652 | |
| | 454,351 | | | * | | Neo-Neon Holdings Ltd | | | 103 | |
| | 34,812 | | | e | | Nexans S.A. | | | 1,767 | |
| | 493,954 | | | | | NGK Insulators Ltd | | | 9,400 | |
| | 163,014 | | | | | Nibe Industrier AB (Series B) | | | 3,675 | |
COLLEGE RETIREMENT EQUITIES FUND - Stock Account
| | | | | | | | VALUE | |
| SHARES | | | | | COMPANY | | (000) | |
| | 123,000 | | | | | Nichias Corp | | $ | 842 | |
| | 6,700 | | | | | Nichiden Corp | | | 142 | |
| | 50,600 | | | | | Nichiha Corp | | | 695 | |
| | 55,584 | | | e | | Nidec Corp | | | 5,476 | |
| | 5,100 | | | * | | Nihon Trim Co Ltd | | | 394 | |
| | 133,000 | | | | | Nippo Corp | | | 2,211 | |
| | 155,000 | | | | | Nippon Carbon Co Ltd | | | 292 | |
| | 95,000 | | | | | Nippon Densetsu Kogyo Co Ltd | | | 1,294 | |
| | 186,000 | | | | | Nippon Koei Co Ltd | | | 783 | |
| | 248,000 | | | | | Nippon Road Co Ltd | | | 1,399 | |
| | 323,730 | | | e | | Nippon Sharyo Ltd | | | 1,611 | |
| | 1,099,000 | | | * | | Nippon Sheet Glass Co Ltd | | | 1,433 | |
| | 143,845 | | | | | Nippon Signal Co Ltd | | | 1,217 | |
| | 224,450 | | | | | Nippon Steel Trading Co Ltd | | | 840 | |
| | 75,000 | | | | | Nippon Thompson Co Ltd | | | 416 | |
| | 862,000 | | | | | Nishimatsu Construction Co Ltd | | | 2,742 | |
| | 38,500 | | | | | Nishio Rent All Co Ltd | | | 975 | |
| | 352,000 | | | | | Nisshinbo Industries, Inc | | | 3,390 | |
| | 252,000 | | | | | Nissin Electric Co Ltd | | | 1,541 | |
| | 20,400 | | | | | Nitta Corp | | | 449 | |
| | 212,000 | | | | | Nitto Boseki Co Ltd | | | 1,121 | |
| | 77,447 | | | | | Nitto Kogyo Corp | | | 1,313 | |
| | 11,573 | | | | | Nitto Kohki Co Ltd | | | 208 | |
| | 69,782 | | | | | NKT Holding AS | | | 3,443 | |
| | 67,395 | | | | | NN, Inc | | | 1,361 | |
| | 2,822,071 | | | e | | Noble Group Ltd | | | 2,403 | |
| | 19,446 | | | * | | Norcraft Cos, Inc | | | 382 | |
| | 126,035 | | | * | | Nordex AG. | | | 1,671 | |
| | 250,538 | | | | | Nordson Corp | | | 18,615 | |
| | 134,919 | | | | | Noritake Co Ltd | | | 331 | |
| | 43,900 | | | | | Noritz Corp | | | 940 | |
| | 85,035 | | | | | NORMA Group | | | 4,227 | |
| | 34,821 | | | *,e | | Nortek, Inc | | | 2,598 | |
| | 659,075 | | | | | Northrop Grumman Corp | | | 75,537 | |
| | 36,583 | | | * | | Northwest Pipe Co | | | 1,381 | |
| | 1,281,632 | | | | | NRW Holdings Ltd | | | 1,574 | |
| | 311,974 | | | | | NSK Ltd | | | 3,888 | |
| | 704,000 | | | * | | NTN Corp | | | 3,202 | |
| | 2,778,807 | | | | | NWS Holdings Ltd | | | 4,241 | |
| | 13,300 | | | | | Obara Corp | | | 417 | |
| | 1,048,888 | | | | | Obayashi Corp | | | 5,983 | |
| | 131,873 | | | e | | Obrascon Huarte Lain S.A. | | | 5,350 | |
| | 481,148 | | | | | OC Oerlikon Corp AG. | | | 7,208 | |
| | 71,180 | | | * | | OCI | | | 3,205 | |
| | 14,700 | | | | | Odelic Co Ltd | | | 450 | |
| | 10,302 | | | | | OHB AG. | | | 249 | |
| | 122,500 | | | | | Oiles Corp | | | 2,477 | |
| | 68,300 | | | | | Okabe Co Ltd | | | 806 | |
COLLEGE RETIREMENT EQUITIES FUND - Stock Account
| | | | | | | | VALUE | |
| SHARES | | | | | COMPANY | | (000) | |
| | 159,641 | | | | | Okuma Holdings, Inc | | $ | 1,763 | |
| | 209,000 | | | | | Okumura Corp | | | 967 | |
| | 6,456 | | | *,e | | Omega Flex, Inc | | | 132 | |
| | 30,800 | | | | | Onoken Co Ltd | | | 388 | |
| | 235,850 | | | * | | Orbital Sciences Corp | | | 5,495 | |
| | 52,000 | | | | | Organo Corp | | | 233 | |
| | 104,596 | | | * | | Orion Marine Group, Inc | | | 1,258 | |
| | 64,681 | | | | | Ormat Industries | | | 444 | |
| | 82,400 | | | | | OSG Corp | | | 1,399 | |
| | 307,924 | | | | | Oshkosh Truck Corp | | | 15,513 | |
| | 691,815 | | | * | | Osram Licht AG. | | | 39,021 | |
| | 279,056 | | | e | | Outotec Oyj | | | 2,928 | |
| | 2,758,262 | | | * | | Owens Corning, Inc | | | 112,316 | |
| | 645,587 | | | | | Paccar, Inc | | | 38,199 | |
| | 14,733 | | | | | Palfinger AG. | | | 587 | |
| | 289,789 | | | | | Pall Corp | | | 24,733 | |
| | 401,488 | | | | | Parker Hannifin Corp | | | 51,647 | |
| | 31,162 | | | * | | Patrick Industries, Inc | | | 902 | |
| | 215,189 | | | | | Peab AB (Series B) | | | 1,317 | |
| | 649,661 | | | | | Pentair Ltd | | | 50,459 | |
| | 340,500 | | | | | Penta-Ocean Construction Co Ltd | | | 1,196 | |
| | 145,517 | | | * | | Perini Corp | | | 3,827 | |
| | 21,440 | | | | | Pfeiffer Vacuum Technology AG. | | | 2,919 | |
| | 291,945 | | | *,e | | Pgt, Inc | | | 2,954 | |
| | 107,000 | | | | | Phihong Technology Co Ltd | | | 68 | |
| | 124,691 | | | * | | Pike Electric Corp | | | 1,318 | |
| | 15,495 | | | * | | Pinguely-Haulotte | | | 234 | |
| | 46,589 | | | | | Pkc Group Oyj | | | 1,551 | |
| | 4,743 | | | | | Plasson | | | 164 | |
| | 53,993 | | | *,e | | Ply Gem Holdings, Inc | | | 973 | |
| | 84,153 | | | *,e | | PMFG, Inc | | | 762 | |
| | 112,300 | | | | | Polyplex PCL | | | 32 | |
| | 319,913 | | | *,e | | Polypore International, Inc | | | 12,445 | |
| | 37,089 | | | | | Powell Industries, Inc | | | 2,485 | |
| | 6,772 | | | * | | Power Solutions International, Inc | | | 509 | |
| | 66,945 | | | * | | PowerSecure International, Inc | | | 1,149 | |
| | 642,592 | | | | | Precision Castparts Corp | | | 173,050 | |
| | 11,366 | | | | | Preformed Line Products Co | | | 832 | |
| | 167,424 | | | | | Primoris Services Corp | | | 5,212 | |
| | 546,700 | | | * | | Promotora y Operadora de Infraestructura SAB de C.V. | | | 6,533 | |
| | 147,040 | | | *,e | | Proto Labs, Inc | | | 10,466 | |
| | 137,150 | | | | | Prysmian S.p.A. | | | 3,531 | |
| | 1,290,000 | | | | | PT Adhi Karya Persero Tbk | | | 161 | |
| | 3,899,000 | | | | | PT AKR Corporindo Tbk | | | 1,405 | |
| | 8,114,000 | | | | | PT Arwana Citramulia Tbk | | | 547 | |
| | 564,500 | | | | | PT Hexindo Adiperkasa Tbk | | | 150 | |
| | 4,416,500 | | | | | PT Pembangunan Perumahan Tbk | | | 423 | |
| | 4,778,500 | | | | | PT Surya Semesta Internusa Tbk | | | 221 | |
COLLEGE RETIREMENT EQUITIES FUND - Stock Account
| | | | | | | | VALUE | |
| SHARES | | | | | COMPANY | | (000) | |
| | 1,914,500 | | | | | PT Total Bangun Persada Tbk | | $ | 79 | |
| | 2,771,384 | | | | | PT United Tractors Tbk | | | 4,338 | |
| | 18,626,500 | | | | | PT Waskita Karya Persero Tbk | | | 622 | |
| | 4,093,000 | | | | | PT Wijaya Karya | | | 533 | |
| | 830,974 | | | | | QinetiQ plc | | | 2,989 | |
| | 146,550 | | | | | Quanex Building Products Corp | | | 2,919 | |
| | 259,699 | | | * | | Quanta Services, Inc | | | 8,196 | |
| | 5,869 | | | | | R Stahl AG. | | | 303 | |
| | 54,800 | | | | | Raito Kogyo Co Ltd | | | 403 | |
| | 151,292 | | | | | Ramirent Oyj | | | 1,906 | |
| | 657,900 | | | | | Randon Participacoes S.A. | | | 3,204 | |
| | 7,276 | | | | | Rational AG. | | | 2,414 | |
| | 357,464 | | | | | Raubex Group Ltd | | | 741 | |
| | 115,441 | | | | | Raven Industries, Inc | | | 4,749 | |
| | 727,200 | | | | | Raytheon Co | | | 65,957 | |
| | 76,772 | | | * | | RBC Bearings, Inc | | | 5,432 | |
| | 404,489 | | | | | RCR Tomlinson Ltd | | | 1,327 | |
| | 49,172 | | | | | Rechi Precision Co Ltd | | | 53 | |
| | 107,823 | | | | | Regal-Beloit Corp | | | 7,949 | |
| | 179,453 | | | | | Reunert Ltd | | | 1,172 | |
| | 100,771 | | | *,e | | Revolution Lighting Technologies, Inc | | | 345 | |
| | 1,936,916 | | | | | Rexel S.A. | | | 50,832 | |
| | 135,432 | | | *,e | | Rexnord Corp | | | 3,658 | |
| | 105,466 | | | | | Rheinmetall AG. | | | 6,507 | |
| | 334,583 | | | | | Rich Development Co Ltd | | | 150 | |
| | 3,773 | | | | | Rieter Holding AG. | | | 890 | |
| | 963,105 | | | | | Rockwell Automation, Inc | | | 113,800 | |
| | 678,397 | | | | | Rockwell Collins, Inc | | | 50,147 | |
| | 17,278 | | | | | Rockwool International AS (B Shares) | | | 3,060 | |
| | 2,362,669 | | | | | Rolls-Royce Group plc | | | 49,974 | |
| | 1,194,813 | | | | | Roper Industries, Inc | | | 165,697 | |
| | 591,000 | | | | | Rotary Engineering Ltd | | | 310 | |
| | 189,414 | | | | | Rotork plc | | | 9,016 | |
| | 123,319 | | | * | | Rush Enterprises, Inc (Class A) | | | 3,656 | |
| | 79,933 | | | e | | Russel Metals, Inc | | | 2,362 | |
| | 529,000 | | | | | Ryobi Ltd | | | 2,130 | |
| | 63,820 | | | | | S&T Dynamics Co Ltd | | | 772 | |
| | 75,407 | | | | | Saab AB (Class B) | | | 2,023 | |
| | 164,053 | | | *,e | | Sacyr Vallehermoso S.A. | | | 852 | |
| | 1,063,397 | | | | | Safran S.A. | | | 73,936 | |
| | 29,132 | | | | | Saft Groupe S.A. | | | 1,002 | |
| | 813,199 | | | | | Salfacorp S.A. | | | 760 | |
| | 12,880 | | | | | Sam Yung Trading Co Ltd | | | 192 | |
| | 144,860 | | | | | Samsung Corp | | | 8,335 | |
| | 30,421 | | | | | Samsung Engineering Co Ltd | | | 1,906 | |
| | 320,376 | | | | | Samsung Heavy Industries Co Ltd | | | 11,579 | |
| | 39,333 | | | | | Samsung Techwin Co Ltd | | | 2,031 | |
| | 24,860 | | | | | San Miguel Corp | | | 35 | |
COLLEGE RETIREMENT EQUITIES FUND - Stock Account
| | | | | | | | VALUE | |
| SHARES | | | | | COMPANY | | (000) | |
| | 198,220 | | | | | San Shing Fastech Corp | | $ | 465 | |
| | 1,661,405 | | | | | Sandvik AB | | | 23,449 | |
| | 70,000 | | | | | Sanki Engineering Co Ltd | | | 440 | |
| | 66,700 | | | | | Sankyo Tateyama, Inc | | | 1,326 | |
| | 373,000 | | | | | Sanwa Shutter Corp | | | 2,530 | |
| | 1,348,000 | | | e | | Sany Heavy Equipment International | | | 424 | |
| | 90,000 | | | | | Sanyo Denki Co Ltd | | | 561 | |
| | 59,688 | | | | | Scania AB (B Shares) | | | 1,170 | |
| | 10,085 | | | | | Schindler Holding AG. | | | 1,485 | |
| | 7,108 | | | | | Schindler Holding AG. (Reg) | | | 1,049 | |
| | 473,329 | | | | | Schneider Electric S.A. | | | 41,294 | |
| | 1,656 | | | | | Schweiter Technologies AG. | | | 1,257 | |
| | 131,000 | | | | | Sekisui Jushi Corp | | | 1,861 | |
| | 2,066,701 | | | e | | SembCorp Industries Ltd | | | 9,016 | |
| | 1,863,780 | | | e | | SembCorp Marine Ltd | | | 6,590 | |
| | 20,039 | | | | | Semperit AG. Holding | | | 997 | |
| | 840,581 | | | | | Senior plc | | | 4,288 | |
| | 37,412 | | | e | | SGL Carbon AG. | | | 1,483 | |
| | 385,308 | | | * | | SGSB Group Co Ltd | | | 222 | |
| | 144,200 | | | * | | Shanghai Automation Instrumentation Co Ltd | | | 93 | |
| | 754,880 | | | | | Shanghai Diesel Engine Co Ltd | | | 595 | |
| | 10,646,500 | | | | | Shanghai Electric Group Co Ltd | | | 3,880 | |
| | 746,600 | | | | | Shanghai Erfangji Co Ltd | | | 478 | |
| | 605,800 | | | | | Shanghai Highly Group Co Ltd | | | 348 | |
| | 1,621,000 | | | | | Shanghai Industrial Holdings Ltd | | | 5,941 | |
| | 218,200 | | | * | | Shanghai Lingyun Industries Development Co Ltd | | | 132 | |
| | 646,020 | | | | | Shanghai Mechanical and Electrical Industry Co Ltd | | | 1,115 | |
| | 584,000 | | | | | Shihlin Electric & Engineering Corp | | | 745 | |
| | 455,722 | | | | | Shikun & Binui Ltd | | | 1,116 | |
| | 34,600 | | | | | Shima Seiki Manufacturing Ltd | | | 651 | |
| | 886,536 | | | | | Shimizu Corp | | | 4,480 | |
| | 184,000 | | | | | Shin Zu Shing Co Ltd | | | 460 | |
| | 124,000 | | | | | Shinko Electric Co Ltd | | | 199 | |
| | 478,590 | | | | | Shinmaywa Industries Ltd | | | 4,155 | |
| | 26,300 | | | | | SHO-BOND Holdings Co Ltd | | | 1,208 | |
| | 20,000 | | | | | Showa Aircraft Industry Co Ltd | | | 236 | |
| | 630,900 | | | | | Siam Future Development PCL | | | 109 | |
| | 625,282 | | | | | Siemens AG. | | | 85,738 | |
| | 55,163 | | | | | Siemens India Ltd | | | 592 | |
| | 764,587 | | | | | SIG plc | | | 2,686 | |
| | 2,959,771 | | | | | Sime Darby BHD | | | 8,610 | |
| | 160,474 | | | | | Simpson Manufacturing Co, Inc | | | 5,894 | |
| | 1,834,000 | | | | | Singamas Container Holdings Ltd | | | 432 | |
| | 251,987 | | | | | Singapore Technologies Engineering Ltd | | | 793 | |
| | 1,526,557 | | | | | Sino Thai Engineering & Construction PCL | | | 617 | |
| | 1,907,000 | | | e | | Sinopec Engineering Group Co Ltd | | | 2,859 | |
| | 652,500 | | | | | Sinotruk Hong Kong Ltd | | | 367 | |
| | 120,300 | | | | | Sintokogio Ltd | | | 903 | |
COLLEGE RETIREMENT EQUITIES FUND - Stock Account
| | | | | | | | VALUE | |
| SHARES | | | | | COMPANY | | (000) | |
| | 27,037 | | | | | SK Corp | | $ | 4,902 | |
| | 289,110 | | | | | SK Networks Co Ltd | | | 2,075 | |
| | 143,571 | | | | | Skanska AB (B Shares) | | | 2,937 | |
| | 2,299,132 | | | | | SKF AB (B Shares) | | | 60,296 | |
| | 6,197 | | | * | | SKF India Ltd | | | 67 | |
| | 211,540 | | | | | SM Investments Corp | | | 3,399 | |
| | 37,877 | | | | | SMC Corp | | | 9,560 | |
| | 833,820 | | | | | Smiths Group plc | | | 20,475 | |
| | 212,240 | | | | | Snap-On, Inc | | | 23,245 | |
| | 132,345 | | | | | SNC-Lavalin Group, Inc | | | 5,954 | |
| | 366,016 | | | | | SOCAM Development Ltd | | | 425 | |
| | 137,600 | | | | | Sodick Co Ltd | | | 612 | |
| | 5,198,733 | | | | | Sojitz Holdings Corp | | | 9,256 | |
| | 8,107 | | | | | Solar Holdings AS (B Shares) | | | 505 | |
| | 93,582 | | | *,e | | SolarCity Corp | | | 5,317 | |
| | 38,137 | | | * | | Sparton Corp | | | 1,066 | |
| | 691,329 | | | | | Speedy Hire plc | | | 733 | |
| | 109,216 | | | | | Spirax-Sarco Engineering plc | | | 5,420 | |
| | 905,172 | | | * | | Spirit Aerosystems Holdings, Inc (Class A) | | | 30,848 | |
| | 355,838 | | | | | SPX Corp | | | 35,445 | |
| | 53,163 | | | | | Standex International Corp | | | 3,343 | |
| | 324,100 | | | | | Stanley Works | | | 26,152 | |
| | 40,300 | | | | | Star Micronics Co Ltd | | | 470 | |
| | 76,723 | | | * | | Stefanutti Stocks Holdings Ltd | | | 76 | |
| | 62,605 | | | * | | Sterling Construction Co, Inc | | | 734 | |
| | 20,475 | | | *,e | | Stock Building Supply Holdings, Inc | | | 373 | |
| | 349,200 | | | | | STP & I PCL | | | 168 | |
| | 706,000 | | | *,e | | STX OSV Holdings Ltd | | | 458 | |
| | 19,583 | | | * | | STX Shipbuilding Co Ltd | | | 125 | |
| | 4,593 | | | | | Sulzer AG. | | | 742 | |
| | 1,783,120 | | | | | Sumitomo Corp | | | 22,410 | |
| | 31,100 | | | | | Sumitomo Densetsu Co Ltd | | | 449 | |
| | 708,804 | | | | | Sumitomo Electric Industries Ltd | | | 11,848 | |
| | 2,373,913 | | | | | Sumitomo Heavy Industries Ltd | | | 10,939 | |
| | 730,300 | | | *,e | | Sumitomo Mitsui Construction C | | | 891 | |
| | 43,000 | | | | | Sumitomo Precision Products Co Ltd | | | 185 | |
| | 78,361 | | | | | Sun Hydraulics Corp | | | 3,199 | |
| | 28,990 | | | * | | Sung Jin Geotec Co Ltd | | | 191 | |
| | 22,330 | | | | | Sung Kwang Bend Co Ltd | | | 566 | |
| | 148,000 | | | | | Sunspring Metal Corp | | | 403 | |
| | 648,661 | | | * | | Suzlon Energy Ltd | | | 108 | |
| | 329,000 | | | *,e | | SWCC Showa Holdings Co Ltd | | | 335 | |
| | 285,995 | | | | | Swisslog Holding AG. | | | 365 | |
| | 199,000 | | | | | Syncmold Enterprise Corp | | | 333 | |
| | 126,000 | | | | | Tadano Ltd | | | 1,693 | |
| | 10,658 | | | * | | Taewoong Co Ltd | | | 286 | |
| | 74,270 | | | | | Taeyoung Engineering & Construction | | | 392 | |
| | 87,929 | | | * | | Taihan Electric Wire Co Ltd | | | 200 | |
COLLEGE RETIREMENT EQUITIES FUND - Stock Account
| | | | | | | | VALUE | |
| SHARES | | | | | COMPANY | | (000) | |
| | 40,000 | | | | | Taihei Dengyo Kaisha Ltd | | $ | 250 | |
| | 60,000 | | | | | Taihei Kogyo Co Ltd | | | 250 | |
| | 31,800 | | | | | Taikisha Ltd | | | 706 | |
| | 1,310,561 | | | e | | Taisei Corp | | | 5,964 | |
| | 804,872 | | | | | Taiwan Glass Industrial Corp | | | 896 | |
| | 33,900 | | | | | Takaoka Toko Holdings Co Ltd | | | 632 | |
| | 95,929 | | | | | Takara Standard Co Ltd | | | 723 | |
| | 74,300 | | | | | Takasago Thermal Engineering Co Ltd | | | 628 | |
| | 33,600 | | | | | Takeuchi Manufacturing Co Ltd | | | 755 | |
| | 82,000 | | | | | Takuma Co Ltd | | | 719 | |
| | 121,283 | | | e | | TAL International Group, Inc | | | 6,956 | |
| | 499,771 | | | * | | Taser International, Inc | | | 7,936 | |
| | 326,000 | | | e | | Tat Hong Holdings Ltd | | | 233 | |
| | 46,000 | | | | | Tatsuta Electric Wire and Cable Co Ltd | | | 278 | |
| | 300,600 | | | * | | Tebrau Teguh BHD | | | 119 | |
| | 2,029,133 | | | | | Teco Electric and Machinery Co Ltd | | | 2,331 | |
| | 74,384 | | | *,e | | Tecumseh Products Co (Class A) | | | 673 | |
| | 614,090 | | | | | Tekfen Holding AS | | | 1,433 | |
| | 130,000 | | | *,e | | Tekken Corp | | | 401 | |
| | 329,962 | | | * | | Teledyne Technologies, Inc | | | 30,310 | |
| | 98,595 | | | | | Tennant Co | | | 6,686 | |
| | 287,860 | | | | | Terex Corp | | | 12,087 | |
| | 77,561 | | | e | | Textainer Group Holdings Ltd | | | 3,120 | |
| | 3,429,582 | | | | | Textron, Inc | | | 126,071 | |
| | 232,409 | | | | | Thales S.A. | | | 14,977 | |
| | 21,899 | | | *,e | | The ExOne Company | | | 1,324 | |
| | 22,707 | | | * | | Thermax Ltd | | | 261 | |
| | 161,438 | | | * | | Thermon Group Holdings | | | 4,412 | |
| | 103,061 | | | | | THK Co Ltd | | | 2,574 | |
| | 918,000 | | | * | | Tianjin Development Hldgs | | | 699 | |
| | 73,902 | | | | | Timken Co | | | 4,070 | |
| | 184,154 | | | e | | Titan International, Inc | | | 3,311 | |
| | 66,407 | | | *,e | | Titan Machinery, Inc | | | 1,183 | |
| | 24,093 | | | * | | TK Corp | | | 504 | |
| | 38,322 | | | | | TKH Group NV | | | 1,340 | |
| | 712,000 | | | * | | Toa Corp/Tokyo | | | 1,702 | |
| | 14,000 | | | | | Tocalo Co Ltd | | | 218 | |
| | 255,000 | | | | | Toda Corp | | | 885 | |
| | 79,000 | | | | | Toenec Corp | | | 473 | |
| | 108,900 | | | | | Tokai Corp | | | 366 | |
| | 84,760 | | | *,e | | Tokyu Construction Co Ltd | | | 430 | |
| | 55,057 | | | | | Tong-Tai Machine & Tool Co Ltd | | | 50 | |
| | 18,500 | | | | | Torishima Pump Manufacturing Co Ltd | | | 185 | |
| | 52,741 | | | | | Toro Co | | | 3,354 | |
| | 164,342 | | | | | Toromont Industries Ltd | | | 4,123 | |
| | 8,269,371 | | | | | Toshiba Corp | | | 34,812 | |
| | 138,964 | | | | | Toshiba Machine Co Ltd | | | 804 | |
| | 45,000 | | | | | Toshiba Plant Systems & Services Corp | | | 672 | |
| | 25,400 | | | | | Totetsu Kogyo Co Ltd | | | 478 | |
COLLEGE RETIREMENT EQUITIES FUND - Stock Account
| | | | | | | | VALUE | |
| SHARES | | | | | COMPANY | | (000) | |
| | 745,677 | | | | | Toto Ltd | | $ | 11,827 | |
| | 76,000 | | | | | Toyo Construction Co Ltd | | | 269 | |
| | 152,000 | | | | | Toyo Engineering Corp | | | 619 | |
| | 15,900 | | | e | | Toyo Tanso Co Ltd | | | 303 | |
| | 213,701 | | | | | Toyota Tsusho Corp | | | 5,300 | |
| | 342,618 | | | | | Trakya Cam Sanayi AS | | | 405 | |
| | 58,690 | | | | | TransDigm Group, Inc | | | 9,450 | |
| | 1,860,418 | | | | | Travis Perkins plc | | | 57,792 | |
| | 1,186,007 | | | | | Trelleborg AB (B Shares) | | | 23,619 | |
| | 39,981 | | | | | Trevi Finanziaria S.p.A. | | | 346 | |
| | 98,542 | | | * | | Trex Co, Inc | | | 7,837 | |
| | 860,000 | | | | | Trigiant Group Ltd | | | 292 | |
| | 210,059 | | | * | | Trimas Corp | | | 8,379 | |
| | 282,120 | | | | | Trinity Industries, Inc | | | 15,381 | |
| | 101,706 | | | | | Triumph Group, Inc | | | 7,737 | |
| | 39,962 | | | | | Trusco Nakayama Corp | | | 941 | |
| | 168,000 | | | | | Tsubakimoto Chain Co | | | 1,282 | |
| | 70,000 | | | | | Tsugami Corp | | | 420 | |
| | 43,000 | | | | | Tsukishima Kikai Co Ltd | | | 443 | |
| | 702,880 | | | e | | Tuan Sing Holdings Ltd | | | 167 | |
| | 541,212 | | | | | Turk Sise ve Cam Fabrikalari AS | | | 685 | |
| | 31,477 | | | e | | Twin Disc, Inc | | | 815 | |
| | 121,277 | | | | | Ultra Electronics Holdings | | | 3,884 | |
| | 380,000 | | | | | Union Mosaic Industry PCL | | | 77 | |
| | 11,700 | | | | | Union Tool Co | | | 269 | |
| | 21,172 | | | * | | Unison Co Ltd | | | 51 | |
| | 462,000 | | | e | | United Engineers Ltd | | | 658 | |
| | 510,132 | | | e | | United Group Ltd | | | 3,335 | |
| | 504,000 | | | | | United Integrated Services Co Ltd | | | 626 | |
| | 288,586 | | | *,e | | United Rentals, Inc | | | 22,495 | |
| | 1,197,742 | | | | | United Technologies Corp | | | 136,303 | |
| | 94,090 | | | | | Universal Forest Products, Inc | | | 4,906 | |
| | 105,811 | | | | | Uponor Oyj | | | 2,066 | |
| | 182,530 | | | | | URS Corp | | | 9,672 | |
| | 4,273,203 | | | *,e | | USG Corp | | | 121,274 | |
| | 940,100 | | | | | Ushio, Inc | | | 12,496 | |
| | 12,347 | | | | | Vallourec | | | 674 | |
| | 58,892 | | | e | | Valmont Industries, Inc | | | 8,782 | |
| | 304,004 | | | * | | Vestas Wind Systems AS | | | 9,002 | |
| | 1,304,020 | | | | | Vesuvius plc | | | 11,026 | |
| | 73,337 | | | * | | Vicor Corp | | | 984 | |
| | 982,161 | | | | | Vinci S.A. | | | 64,559 | |
| | 229,975 | | | | | Voltas Ltd | | | 432 | |
| | 2,863,762 | | | | | Volvo AB (B Shares) | | | 37,682 | |
| | 91,793 | | | * | | Von Roll Holding AG. | | | 143 | |
| | 5,291 | | | | | Vossloh AG. | | | 529 | |
| | 249,127 | | | | | W.W. Grainger, Inc | | | 63,632 | |
| | 265,363 | | | * | | Wabash National Corp | | | 3,277 | |
COLLEGE RETIREMENT EQUITIES FUND - Stock Account
| | | | | | | | VALUE | |
| SHARES | | | | | COMPANY | | (000) | |
| | 656,076 | | | * | | WABCO Holdings, Inc | | $ | 61,284 | |
| | 27,660 | | | | | Wacker Construction Equipment AG. | | | 438 | |
| | 19,238 | | | e | | Wajax Income Fund | | | 661 | |
| | 79,000 | | | | | Wakita & Co Ltd | | | 930 | |
| | 3,487,250 | | | * | | Walsin Lihwa Corp | | | 1,121 | |
| | 6,338 | | | | | Walter Meier AG. | | | 410 | |
| | 47,868 | | | | | Wartsila Oyj (B Shares) | | | 2,360 | |
| | 118,165 | | | | | Watsco, Inc | | | 11,351 | |
| | 110,897 | | | | | Watts Water Technologies, Inc (Class A) | | | 6,861 | |
| | 1,423,700 | | | | | WCT Berhad | | | 892 | |
| | 226,500 | | | | | Weg S.A. | | | 2,999 | |
| | 668,900 | | | e | | Weichai Power Co Ltd | | | 2,706 | |
| | 32,688 | | | | | Weir Group plc | | | 1,157 | |
| | 199,520 | | | | | Well Shin Technology Co Ltd | | | 329 | |
| | 83,646 | | | *,e | | WESCO International, Inc | | | 7,618 | |
| | 553,441 | | | | | Westinghouse Air Brake Technologies Corp | | | 41,104 | |
| | 75,749 | | | *,e | | Westport Innovations, Inc | | | 1,483 | |
| | 2,628,444 | | | e | | Wienerberger AG. | | | 41,687 | |
| | 131,496 | | | | | Wilson Bayly Holmes-Ovcon Ltd | | | 1,830 | |
| | 383,089 | | | | | Wolseley plc | | | 21,780 | |
| | 282,284 | | | | | Woodward Governor Co | | | 12,875 | |
| | 50,926 | | | * | | Xerium Technologies, Inc | | | 840 | |
| | 127,137 | | | | | Xxentria Technology Materials Corp | | | 267 | |
| | 101,336 | | | | | Xylem, Inc | | | 3,506 | |
| | 11,360 | | | | | Y G-1 Co Ltd | | | 128 | |
| | 36,000 | | | | | Yahagi Construction Co Ltd | | | 313 | |
| | 25,800 | | | | | YAMABIKO Corp | | | 789 | |
| | 62,700 | | | | | Yamazen Corp | | | 385 | |
| | 8,474,449 | | | e | | Yangzijiang Shipbuilding | | | 7,976 | |
| | 89,858 | | | | | Yazicilar Holding AS | | | 784 | |
| | 132,404 | | | e | | YIT Oyj | | | 1,851 | |
| | 34,000 | | | | | Yokogawa Bridge Holdings Corp | | | 499 | |
| | 717,000 | | | e | | Yoma Strategic Holdings Ltd | | | 427 | |
| | 2,164,000 | | | | | Yuanda China Holdings Ltd | | | 190 | |
| | 585,000 | | | | | Yuasa Trading Co Ltd | | | 1,197 | |
| | 861,000 | | | | | Yungtay Engineering Co Ltd | | | 2,471 | |
| | 53,000 | | | | | Yurtec Corp | | | 171 | |
| | 10,300 | | | | | Yushin Precision Equipment Co Ltd | | | 224 | |
| | 53,701 | | | e | | Zardoya Otis S.A. | | | 972 | |
| | 11,053 | | | e | | Zehnder Group AG. | | | 508 | |
| | 3,992,000 | | | e | | Zhuzhou CSR Times Electric Co Ltd | | | 14,399 | |
| | 43,541 | | | | | Zodiac S.A. | | | 7,716 | |
| | 13,400 | | | | | Zuiko Corp | | | 809 | |
| | 388,455 | | | | | Zumtobel AG. | | | 6,066 | |
| | | | | | | TOTAL CAPITAL GOODS | | | 10,469,779 | |
COLLEGE RETIREMENT EQUITIES FUND - Stock Account
| | | | | | | | VALUE | |
| SHARES | | | | | COMPANY | | (000) | |
| COMMERCIAL & PROFESSIONAL SERVICES - 1.3% | | | | |
| | 16,000 | | | *,e | | 51job, Inc (ADR) | | $ | 1,246 | |
| | 59,084 | | | | | Aangpanneforeningen AB (B Shares) | | | 2,067 | |
| | 214,893 | | | | | ABM Industries, Inc | | | 6,144 | |
| | 192,630 | | | e | | Acacia Research (Acacia Technologies) | | | 2,801 | |
| | 441,541 | | | * | | ACCO Brands Corp | | | 2,967 | |
| | 70,708 | | | e | | Acorn Energy, Inc | | | 288 | |
| | 3,193 | | | | | Adcorp Holdings Ltd | | | 10 | |
| | 1,242,653 | | | | | Adecco S.A. | | | 98,650 | |
| | 101,055 | | | | | Administaff, Inc | | | 3,651 | |
| | 1,815,398 | | | e | | ADT Corp | | | 73,469 | |
| | 123,287 | | | * | | Advisory Board Co | | | 7,850 | |
| | 22,200 | | | | | Aeon Delight Co Ltd | | | 426 | |
| | 44,353 | | | | | Aggreko plc | | | 1,258 | |
| | 7,084 | | | | | Akka Technologies S.A. | | | 228 | |
| | 358,266 | | | | | ALS Ltd | | | 2,827 | |
| | 10,614 | | | | | Amadeus Fire AG | | | 798 | |
| | 154,425 | | | | | American Banknote S.A. | | | 2,099 | |
| | 89,093 | | | | | American Ecology Corp | | | 3,313 | |
| | 159,755 | | | * | | ARC Document Solutions, Inc | | | 1,313 | |
| | 25,343 | | | | | Assystem | | | 702 | |
| | 227,423 | | | | | Atkins WS plc | | | 5,342 | |
| | 502,265 | | | | | Babcock International Group | | | 11,286 | |
| | 42,083 | | | | | Barrett Business Services, Inc | | | 3,903 | |
| | 21,000 | | | | | Benefit One, Inc | | | 190 | |
| | 6,803 | | | | | Bertrandt AG. | | | 1,039 | |
| | 162,050 | | | e | | BFI Canada Ltd | | | 4,008 | |
| | 66,335 | | | | | Bilfinger Berger AG. | | | 7,451 | |
| | 49,200 | | | e | | Black Diamond Group Ltd | | | 1,390 | |
| | 314,229 | | | | | Blue Label Telecoms Ltd | | | 255 | |
| | 986,000 | | | *,e | | Blumont Group Ltd | | | 67 | |
| | 1,959,305 | | | | | Brambles Ltd | | | 16,052 | |
| | 251,192 | | | | | Brink’s Co | | | 8,576 | |
| | 12,231 | | | | | Brunel International | | | 750 | |
| | 166,701 | | | | | Bureau Veritas S.A. | | | 4,867 | |
| | 129,512 | | | e | | Cabcharge Australia Ltd | | | 463 | |
| | 138,366 | | | | | Cape plc | | | 638 | |
| | 1,290,886 | | | | | Capita Group plc | | | 22,220 | |
| | 132,657 | | | * | | Casella Waste Systems, Inc (Class A) | | | 769 | |
| | 131,141 | | | * | | Caverion Corp | | | 1,606 | |
| | 141,601 | | | *,e | | CBIZ, Inc | | | 1,291 | |
| | 57,250 | | | | | CDI Corp | | | 1,061 | |
| | 56,751 | | | e | | Ceco Environmental Corp | | | 918 | |
| | 154,331 | | | *,e | | Cenveo, Inc | | | 531 | |
| | 12,195 | | | | | Cewe Color Holding AG. | | | 718 | |
COLLEGE RETIREMENT EQUITIES FUND - Stock Account
| | | | | | | | VALUE | |
| SHARES | | | | | COMPANY | | (000) | |
| | 9,846,200 | | | e | | China Everbright International Ltd | | $ | 13,228 | |
| | 205,420 | | | | | Cintas Corp | | | 12,241 | |
| | 93,892 | | | *,e | | Clean Harbors, Inc | | | 5,630 | |
| | 70,000 | | | | | Cleanaway Co Ltd | | | 457 | |
| | 549,349 | | | *,e | | CNH Industrial NV (NYSE) | | | 6,235 | |
| | 2,271 | | | | | Compx International, Inc | | | 32 | |
| | 27,423 | | | * | | Consolidated Graphics, Inc | | | 1,849 | |
| | 246,365 | | | * | | Copart, Inc | | | 9,029 | |
| | 147,506 | | | | | Corporate Executive Board Co | | | 11,421 | |
| | 424,811 | | | | | Corrections Corp of America | | | 13,624 | |
| | 46,012 | | | | | Courier Corp | | | 832 | |
| | 197,881 | | | | | Covanta Holding Corp | | | 3,512 | |
| | 42,409 | | | * | | CRA International, Inc | | | 840 | |
| | 95,642 | | | | | Credit Corp Group Ltd | | | 825 | |
| | 501,740 | | | | | Dai Nippon Printing Co Ltd | | | 5,330 | |
| | 41,500 | | | | | Daiseki Co Ltd | | | 813 | |
| | 387,575 | | | | | Davis Service Group plc | | | 6,015 | |
| | 125,679 | | | | | De La Rue plc | | | 1,814 | |
| | 175,066 | | | | | Deluxe Corp | | | 9,137 | |
| | 114,315 | | | * | | Derichebourg | | | 382 | |
| | 38,800 | | | e | | DirectCash Payments, Inc | | | 665 | |
| | 1,239,463 | | | | | Downer EDI Ltd | | | 5,401 | |
| | 87,050 | | | | | Dun & Bradstreet Corp | | | 10,685 | |
| | 52,898 | | | | | Duskin Co Ltd | | | 1,002 | |
| | 1,139,755 | | | * | | Eastern Media International Corp | | | 582 | |
| | 2,472,000 | | | | | Edenred | | | 82,769 | |
| | 133,580 | | | * | | EnerNOC, Inc | | | 2,299 | |
| | 49,700 | | | e | | en-japan, Inc | | | 1,060 | |
| | 103,384 | | | | | Ennis, Inc | | | 1,830 | |
| | 279,803 | | | | | Equifax, Inc | | | 19,332 | |
| | 789,204 | | | | | Experian Group Ltd | | | 14,578 | |
| | 70,440 | | | | | Exponent, Inc | | | 5,455 | |
| | 30,928 | | | * | | Franklin Covey Co | | | 615 | |
| | 158,056 | | | * | | FTI Consulting, Inc | | | 6,502 | |
| | 15,463,000 | | | * | | Fung Choi Media Group Ltd | | | 1,299 | |
| | 74,687 | | | | | G & K Services, Inc (Class A) | | | 4,648 | |
| | 32,982 | | | * | | Gategroup Holding AG. | | | 895 | |
| | 60,000 | | | e | | Genivar Income Fund | | | 1,782 | |
| | 274,546 | | | | | Geo Group, Inc | | | 8,846 | |
| | 9,568 | | | | | GL Events | | | 230 | |
| | 47,307 | | | * | | GP Strategies Corp | | | 1,409 | |
| | 1,154,426 | | | | | Group 4 Securicor plc | | | 5,023 | |
| | 108,545 | | | e | | Gunnebo AB | | | 675 | |
| | 3,704,158 | | | | | Hays plc | | | 7,979 | |
| | 224,588 | | | | | Healthcare Services Group | | | 6,372 | |
| | 71,165 | | | | | Heidrick & Struggles International, Inc | | | 1,433 | |
| | 29,222 | | | * | | Heritage-Crystal Clean, Inc | | | 599 | |
COLLEGE RETIREMENT EQUITIES FUND - Stock Account
| | | | | | | | VALUE | |
| SHARES | | | | | COMPANY | | (000) | |
| | 188,117 | | | | | Herman Miller, Inc | | $ | 5,553 | |
| | 165,294 | | | | | HNI Corp | | | 6,418 | |
| | 420,356 | | | | | Homeserve plc | | | 1,921 | |
| | 121,100 | | | e | | Horizon North Logistics, Inc | | | 1,134 | |
| | 98,944 | | | * | | Huron Consulting Group, Inc | | | 6,206 | |
| | 78,046 | | | * | | ICF International, Inc | | | 2,709 | |
| | 648,664 | | | * | | ICO Global Communications Holdings Ltd | | | 1,304 | |
| | 144,898 | | | * | | IHS, Inc (Class A) | | | 17,344 | |
| | 148,918 | | | *,e | | Innerworkings, Inc | | | 1,160 | |
| | 1,158,000 | | | *,e,m | | Integrated Waste Solutions Group Holdings Ltd | | | 1 | |
| | 191,388 | | | | | Interface, Inc | | | 4,203 | |
| | 39,665 | | | | | Intersections, Inc | | | 309 | |
| | 128,959 | | | | | Intertek Group plc | | | 6,731 | |
| | 337,565 | | | | | Intrum Justitia AB | | | 9,450 | |
| | 370,561 | | | | | Iron Mountain, Inc | | | 11,247 | |
| | 503,942 | | | | | ITE Group plc | | | 2,563 | |
| | 35,900 | | | | | Itoki Corp | | | 204 | |
| | 3,721 | | | | | Kaba Holding AG. | | | 1,808 | |
| | 85,885 | | | | | KAR Auction Services, Inc | | | 2,538 | |
| | 28,000 | | | | | KD Holding Corp | | | 183 | |
| | 104,220 | | | | | Kelly Services, Inc (Class A) | | | 2,599 | |
| | 19,358 | | | | | KEPCO Plant Service & Engineering Co Ltd | | | 1,006 | |
| | 96,349 | | | | | Kforce, Inc | | | 1,971 | |
| | 486,800 | | | e | | K-Green Trust | | | 403 | |
| | 149,948 | | | | | Kimball International, Inc (Class B) | | | 2,254 | |
| | 179,858 | | | | | Knoll, Inc | | | 3,293 | |
| | 198,600 | | | e | | Kokuyo Co Ltd | | | 1,456 | |
| | 191,878 | | | * | | Korn/Ferry International | | | 5,012 | |
| | 176,000 | | | | | Kyodo Printing Co Ltd | | | 486 | |
| | 487,000 | | | | | L&K Engineering Co Ltd | | | 466 | |
| | 135,133 | | | | | Loomis AB | | | 3,204 | |
| | 323,295 | | | | | Manpower, Inc | | | 27,758 | |
| | 30,062 | | | | | Matsuda Sangyo Co Ltd | | | 403 | |
| | 90,347 | | | | | McGrath RentCorp | | | 3,596 | |
| | 83,588 | | | | | McMillan Shakespeare Ltd | | | 883 | |
| | 131,075 | | | | | Mears Group plc | | | 1,032 | |
| | 75,500 | | | | | Meitec Corp | | | 2,047 | |
| | 335,263 | | | | | Michael Page International plc | | | 2,714 | |
| | 135,979 | | | | | Mine Safety Appliances Co | | | 6,963 | |
| | 215,905 | | | | | Mineral Resources Ltd | | | 2,297 | |
| | 65,005 | | | * | | Mistras Group, Inc | | | 1,357 | |
| | 434,752 | | | | | Mitie Group | | | 2,293 | |
| | 20,072 | | | | | Mitsubishi Pencil Co Ltd | | | 446 | |
| | 149,365 | | | * | | Mobile Mini, Inc | | | 6,151 | |
| | 138,091 | | | *,e | | Moleskine S.p.A | | | 304 | |
| | 73,660 | | | e | | Morneau Sobeco Income Fund | | | 1,069 | |
| | 48,500 | | | | | Moshi Moshi Hotline, Inc | | | 520 | |
| | 43,165 | | | | | Multi-Color Corp | | | 1,629 | |
COLLEGE RETIREMENT EQUITIES FUND - Stock Account
| | | | | | | | VALUE | |
| SHARES | | | | | COMPANY | | (000) | |
| | 203,135 | | | * | | Navigant Consulting, Inc | | $ | 3,900 | |
| | 57,207 | | | | | Newalta, Inc | | | 938 | |
| | 1,001,260 | | | | | Nielsen Holdings NV | | | 45,948 | |
| | 13,300 | | | | | Nihon M&A Center, Inc | | | 899 | |
| | 4,700 | | | | | Nippon Kanzai Co Ltd | | | 88 | |
| | 35,560 | | | *,e | | Nissha Printing Co Ltd | | | 566 | |
| | 24,718 | | | e | | NL Industries, Inc | | | 276 | |
| | 42,600 | | | * | | Nomura Co Ltd | | | 355 | |
| | 259,114 | | | *,e | | Odyssey Marine Exploration, Inc | | | 523 | |
| | 75,000 | | | | | Okamura Corp | | | 638 | |
| | 239,584 | | | * | | On Assignment, Inc | | | 8,366 | |
| | 19,968 | | | | | Oyo Corp | | | 305 | |
| | 78,100 | | | | | Park24 Co Ltd | | | 1,473 | |
| | 74,400 | | | | | Pasona Group, Inc | | | 523 | |
| | 43,800 | | | | | PayPoint plc | | | 733 | |
| | 174,115 | | | * | | Performant Financial Corp | | | 1,793 | |
| | 17,600 | | | | | Pilot Corp | | | 605 | |
| | 1,513,917 | | | e | | Pitney Bowes, Inc | | | 35,274 | |
| | 49,138 | | | * | | Poyry Oyj | | | 275 | |
| | 79,293 | | | | | Proffice AB | | | 324 | |
| | 335,368 | | | | | Programmed Maintenance Services Ltd | | | 1,048 | |
| | 79,900 | | | | | PRONEXUS, Inc | | | 513 | |
| | 236,814 | | | e | | Prosegur Cia de Seguridad S.A. | | | 1,625 | |
| | 6,670,500 | | | * | | PT Hanson International Tbk | | | 313 | |
| | 98,682 | | | e | | Quad | | | 2,687 | |
| | 1,341,535 | | | e | | R.R. Donnelley & Sons Co | | | 27,206 | |
| | 287,937 | | | | | Randstad Holdings NV | | | 18,685 | |
| | 847,868 | | | | | Regus plc | | | 3,056 | |
| | 2,242,410 | | | | | Rentokil Initial plc | | | 4,307 | |
| | 361,394 | | | | | Republic Services, Inc | | | 11,998 | |
| | 164,258 | | | | | Resources Connection, Inc | | | 2,354 | |
| | 124,500 | | | e | | Ritchie Bros Auctioneers, Inc | | | 2,855 | |
| | 813,809 | | | | | Robert Half International, Inc | | | 34,172 | |
| | 254,131 | | | | | Rollins, Inc | | | 7,698 | |
| | 358,418 | | | | | RPS Group plc | | | 1,994 | |
| | 225,891 | | | * | | RPX Corp | | | 3,818 | |
| | 17,158 | | | | | S1 Corp (Korea) | | | 1,217 | |
| | 275,831 | | | | | SAI Global Ltd (New) | | | 958 | |
| | 29,000 | | | *,e | | Sanix, Inc | | | 237 | |
| | 51,352 | | | e | | Sato Corp | | | 1,165 | |
| | 52,502 | | | | | Schawk, Inc (Class A) | | | 781 | |
| | 3,453 | | | | | Seche Environnement S.A. | | | 133 | |
| | 323,024 | | | | | Secom Co Ltd | | | 19,490 | |
| | 289,750 | | | | | Securitas AB (B Shares) | | | 3,083 | |
| | 540,696 | | | | | Seek Ltd | | | 6,500 | |
| | 1,519,384 | | | | | Serco Group plc | | | 12,560 | |
| | 4,311 | | | | | SGS S.A. | | | 9,925 | |
| | 289,500 | | | * | | Shanghai Youngsun Investment C | | | 321 | |
COLLEGE RETIREMENT EQUITIES FUND - Stock Account
| | | | | | | | VALUE | |
| SHARES | | | | | COMPANY | | (000) | |
| | 525,715 | | | | | Shanks Group plc | | $ | 944 | |
| | 26,700 | | | e | | Shenzhen Dongjiang Environmental Co Ltd | | | 89 | |
| | 535,896 | | | | | Skilled Group Ltd | | | 1,633 | |
| | 31,231 | | | | | Societe BIC S.A. | | | 3,827 | |
| | 148,094 | | | | | Sohgo Security Services Co Ltd | | | 2,950 | |
| | 58,050 | | | * | | SP Plus Corp | | | 1,512 | |
| | 152,752 | | | | | Sporton International, Inc | | | 706 | |
| | 102,293 | | | e | | Stantec, Inc | | | 6,342 | |
| | 387,308 | | | | | Steelcase, Inc (Class A) | | | 6,143 | |
| | 637,051 | | | * | | Stericycle, Inc | | | 74,006 | |
| | 453,080 | | | *,e | | Swisher Hygiene, Inc | | | 233 | |
| | 245,000 | | | | | Taiwan Secom Co Ltd | | | 615 | |
| | 238,000 | | | | | Taiwan-Sogo Shinkong Security Corp | | | 305 | |
| | 64,454 | | | * | | Team, Inc | | | 2,729 | |
| | 265,171 | | | | | Teleperformance | | | 16,172 | |
| | 48,100 | | | e | | Temp Holdings Co Ltd | | | 1,281 | |
| | 253,273 | | | * | | Tetra Tech, Inc | | | 7,087 | |
| | 486,000 | | | | | Tianjin Capital Environmental Protection Group Co Ltd | | | 247 | |
| | 225,147 | | | e | | Tomra Systems ASA | | | 2,097 | |
| | 59,400 | | | | | Toppan Forms Co Ltd | | | 545 | |
| | 424,829 | | | | | Toppan Printing Co Ltd | | | 3,401 | |
| | 123,783 | | | * | | Towers Watson & Co | | | 15,796 | |
| | 149,096 | | | | | Tox Free Solutions Ltd | | | 466 | |
| | 199,030 | | | e | | Transcontinental, Inc | | | 2,739 | |
| | 813,983 | | | | | Transfield Services Ltd | | | 653 | |
| | 1,869,502 | | | * | | Transpacific Industries Group Ltd | | | 1,960 | |
| | 53,213 | | | * | | TRC Cos, Inc | | | 380 | |
| | 236,640 | | | * | | TrueBlue, Inc | | | 6,101 | |
| | 3,111,945 | | | | | Tyco International Ltd | | | 127,714 | |
| | 62,182 | | | | | Unifirst Corp | | | 6,653 | |
| | 387,000 | | | e | | United Envirotech Ltd | | | 278 | |
| | 160,150 | | | | | United Stationers, Inc | | | 7,349 | |
| | 74,489 | | | | | USG People NV | | | 994 | |
| | 1,154,456 | | | * | | Verisk Analytics, Inc | | | 75,871 | |
| | 82,279 | | | | | Viad Corp | | | 2,286 | |
| | 17,594 | | | | | VSE Corp | | | 845 | |
| | 136,576 | | | * | | WageWorks, Inc | | | 8,118 | |
| | 171,586 | | | | | Waste Connections, Inc | | | 7,486 | |
| | 1,016,553 | | | | | Waste Management, Inc | | | 45,613 | |
| | 5,200 | | | e | | Weathernews, Inc | | | 119 | |
| | 77,064 | | | | | West Corp | | | 1,981 | |
| | 896,624 | | | | | Yem Chio Co Ltd | | | 670 | |
| | 22,100 | | | | | Yumeshin Holdings Co Ltd | | | 240 | |
| | | | | | | TOTAL COMMERCIAL & PROFESSIONAL SERVICES | | | 1,502,984 | |
| | | | | | | |
| CONSUMER DURABLES & APPAREL - 2.3% | | | | |
| | 1,492,000 | | | | | 361 Degrees International Ltd | | | 395 | |
| | 816,000 | | | | | Ability Enterprise Co Ltd | | | 515 | |
COLLEGE RETIREMENT EQUITIES FUND - Stock Account
| | | | | | | | VALUE | |
| SHARES | | | | | COMPANY | | (000) | |
| | 20,879 | | | * | | Accell Group NV | | $ | 385 | |
| | 161,505 | | | | | Adidas-Salomon AG. | | | 20,595 | |
| | 213,574 | | | | | Aksa Akrilik Kimya Sanayii | | | 798 | |
| | 1,845,735 | | | | | Alok Industries Ltd | | | 253 | |
| | 160,300 | | | | | Alpine Electronics, Inc | | | 2,246 | |
| | 592,940 | | | | | Altek Corp | | | 417 | |
| | 141,345 | | | | | Amer Sports Oyj (A Shares) | | | 2,939 | |
| | 239,117 | | | *,e | | American Apparel, Inc | | | 294 | |
| | 1,889,949 | | | | | AmTRAN Technology Co Ltd | | | 1,282 | |
| | 4,018,900 | | | e | | Anta Sports Products Ltd | | | 4,987 | |
| | 524,904 | | | | | Arcelik AS | | | 2,969 | |
| | 58,883 | | | | | Arctic Cat, Inc | | | 3,355 | |
| | 68,600 | | | | | Arezzo Industria e Comercio S.A. | | | 865 | |
| | 218,700 | | | e | | Aruze Corp | | | 4,051 | |
| | 769,450 | | | * | | Arvind Ltd | | | 1,703 | |
| | 135,000 | | | * | | Asia Optical Co, Inc | | | 134 | |
| | 19,251 | | | | | Asics Corp | | | 329 | |
| | 216,000 | | | | | Atsugi Co Ltd | | | 249 | |
| | 2,601,741 | | | | | Avermedia Technologies | | | 1,142 | |
| | 39,460 | | | *,e | | Bang & Olufsen AS (B Shares) | | | 333 | |
| | 1,395,545 | | | | | Barratt Developments plc | | | 8,078 | |
| | 9,040 | | | * | | Basic House Co Ltd | | | 202 | |
| | 43,437 | | | e | | Bassett Furniture Industries, Inc | | | 664 | |
| | 72,290 | | | | | Bata India Ltd | | | 1,233 | |
| | 86,130 | | | *,e | | Beazer Homes USA, Inc | | | 2,103 | |
| | 159,251 | | | | | Bellway plc | | | 4,148 | |
| | 44,433 | | | * | | Beneteau S.A. | | | 830 | |
| | 273,702 | | | | | Berkeley Group Holdings plc | | | 12,067 | |
| | 4,797 | | | | | Bijou Brigitte AG. | | | 486 | |
| | 529,000 | | | e | | Billion Industrial Holdings Ltd | | | 292 | |
| | 57,000 | | | | | Bizlink Holdings Inc | | | 244 | |
| | 78,679 | | | *,e | | Black Diamond, Inc | | | 1,049 | |
| | 31,771 | | | e | | Blyth, Inc | | | 346 | |
| | 289,945 | | | | | Bombay Dyeing & Manufacturing Co Ltd | | | 357 | |
| | 3,107,300 | | | e | | Bosideng International Holdings Ltd | | | 586 | |
| | 167,313 | | | | | Bovis Homes Group plc | | | 2,198 | |
| | 405,192 | | | * | | Brookfield Incorporacoes S.A. | | | 196 | |
| | 21,200 | | | * | | BRP, Inc | | | 602 | |
| | 69,348 | | | e | | Brunello Cucinelli S.p.A | | | 2,465 | |
| | 307,773 | | | | | Brunswick Corp | | | 14,176 | |
| | 314,840 | | | | | Burberry Group plc | | | 7,932 | |
| | 88,650 | | | * | | BWG Homes ASA | | | 168 | |
| | 279,783 | | | e | | Callaway Golf Co | | | 2,359 | |
| | 350,141 | | | | | Carter’s, Inc | | | 25,137 | |
| | 420,119 | | | | | Casio Computer Co Ltd | | | 5,148 | |
| | 22,361 | | | * | | Cavco Industries, Inc | | | 1,536 | |
| | 380,200 | | | * | | Chengde Nanjiang Co Ltd | | | 145 | |
| | 2,296,000 | | | * | | Chigo Holding Ltd | | | 54 | |
| | 3,160,400 | | | e | | China Dongxiang Group Co | | | 539 | |
COLLEGE RETIREMENT EQUITIES FUND - Stock Account
| | | | | | | | VALUE | |
| SHARES | | | | | COMPANY | | (000) | |
| | 3,848,000 | | | *,e | | China Haidian Holdings Ltd | | $ | 378 | |
| | 1,466,000 | | | | | China Lilang Ltd | | | 905 | |
| | 20,400 | | | | | Chofu Seisakusho Co Ltd | | | 482 | |
| | 86,765 | | | | | Christian Dior S.A. | | | 16,423 | |
| | 22,600 | | | | | Cia Providencia Industria e Comercio S.A. | | | 76 | |
| | 1,072,069 | | | | | Cie Financiere Richemont S.A. | | | 107,097 | |
| | 165,000 | | | *,e | | Clarion Co Ltd | | | 249 | |
| | 48,000 | | | | | Cleanup Corp | | | 434 | |
| | 1,360,640 | | | | | Coach, Inc | | | 76,373 | |
| | 59,253 | | | e | | Columbia Sportswear Co | | | 4,666 | |
| | 1,134,700 | | | *,e | | Consorcio ARA, S.A. de C.V. | | | 444 | |
| | 12,000 | | | | | Corona Corp | | | 129 | |
| | 654,100 | | | *,e,m | | Corp GEO S.A. de C.V. (Series B) | | | 62 | |
| | 32,188 | | | * | | Costa, Inc | | | 699 | |
| | 444,051 | | | * | | Crest Nicholson Holdings plc | | | 2,685 | |
| | 521,008 | | | * | | CROCS, Inc | | | 8,294 | |
| | 39,322 | | | | | CSS Industries, Inc | | | 1,128 | |
| | 28,108 | | | | | Culp, Inc | | | 575 | |
| | 1,657,481 | | | | | Cyrela Brazil Realty S.A. | | | 10,075 | |
| | 30,200 | | | | | Daidoh Ltd | | | 192 | |
| | 6,800 | | | | | Daikoku Denki Co Ltd | | | 139 | |
| | 198,126 | | | *,e | | Deckers Outdoor Corp | | | 16,734 | |
| | 81,812 | | | | | De’Longhi S.p.A. | | | 1,333 | |
| | 54,590 | | | | | Descente Ltd | | | 370 | |
| | 247,600 | | | | | Direcional Engenharia S.A. | | | 1,259 | |
| | 50,233 | | | | | Dorel Industries, Inc (Class B) | | | 1,913 | |
| | 2,837,681 | | | * | | DR Horton, Inc | | | 63,337 | |
| | 434,940 | | | | | Eclat Textile Co Ltd | | | 4,911 | |
| | 1,468,952 | | | | | Electrolux AB (Series B) | | | 38,387 | |
| | 248,000 | | | | | Embry Holdings Ltd | | | 172 | |
| | 81,010 | | | e | | Ethan Allen Interiors, Inc | | | 2,464 | |
| | 355,600 | | | | | Even Construtora e Incorporadora S.A. | | | 1,224 | |
| | 434,000 | | | | | Evergreen International Holdin | | | 81 | |
| | 32,198 | | | *,e | | EveryWare Global, Inc | | | 267 | |
| | 96,900 | | | | | Ez Tec Empreendimentos e Participacoes S.A. | | | 1,193 | |
| | 292,271 | | | | | Feng TAY Enterprise Co Ltd | | | 702 | |
| | 69,200 | | | | | Fields Corp | | | 1,338 | |
| | 476,816 | | | * | | Fifth & Pacific Cos, Inc | | | 15,291 | |
| | 12,823 | | | | | Fila Korea Ltd | | | 961 | |
| | 55,300 | | | | | Fiyta Holdings Ltd | | | 47 | |
| | 16,736 | | | | | Flexsteel Industries, Inc | | | 514 | |
| | 4,950 | | | | | Forbo Holding AG. | | | 4,228 | |
| | 529,020 | | | | | Formosa Taffeta Co Ltd | | | 640 | |
| | 81,034 | | | | | Forus S.A. | | | 410 | |
| | 227,735 | | | * | | Fossil Group, Inc | | | 27,315 | |
| | 123,610 | | | | | Foster Electric Co Ltd | | | 2,283 | |
| | 160,000 | | | | | France Bed Holdings Co Ltd | | | 311 | |
COLLEGE RETIREMENT EQUITIES FUND - Stock Account
| | | | | | | | VALUE | |
| SHARES | | | | | COMPANY | | (000) | |
| | 94,000 | | | | | Fujibo Holdings Inc | | $ | 203 | |
| | 66,000 | | | | | Fujitsu General Ltd | | | 705 | |
| | 24,800 | | | | | Funai Electric Co Ltd | | | 323 | |
| | 580,000 | | | * | | Gafisa S.A. | | | 868 | |
| | 161,606 | | | e | | Garmin Ltd | | | 7,469 | |
| | 70,909 | | | | | Genius Electronic Optical Co Ltd | | | 216 | |
| | 113,353 | | | e | | Geox S.p.A. | | | 410 | |
| | 29,496 | | | | | Gerry Weber International AG. | | | 1,254 | |
| | 273,949 | | | | | Giant Manufacturing Co Ltd | | | 1,887 | |
| | 58,366 | | | * | | G-III Apparel Group Ltd | | | 4,307 | |
| | 157,227 | | | | | Gildan Activewear, Inc | | | 8,379 | |
| | 32,000 | | | | | Goldwin, Inc | | | 145 | |
| | 98,272 | | | e | | GUD Holdings Ltd | | | 506 | |
| | 1,008,000 | | | | | Gunze Ltd | | | 2,530 | |
| | 1,042,000 | | | | | Haier Electronics Group Co Ltd | | | 3,028 | |
| | 18,240 | | | | | Handsome Co Ltd | | | 546 | |
| | 877,385 | | | | | Hanesbrands, Inc | | | 61,654 | |
| | 22,499 | | | | | Hansae Co Ltd | | | 414 | |
| | 31,650 | | | | | Hanssem Co Ltd | | | 1,510 | |
| | 225,135 | | | | | Harman International Industries, Inc | | | 18,427 | |
| | 2,577,250 | | | e | | Hasbro, Inc | | | 141,775 | |
| | 1,488,600 | | | * | | Haseko Corp | | | 11,342 | |
| | 15,264 | | | | | Hefei Meiling Co Ltd | | | 9 | |
| | 52,500 | | | | | Heiwa Corp | | | 850 | |
| | 388,050 | | | | | Helbor Empreendimentos S.A. | | | 1,283 | |
| | 125,141 | | | * | | Helen of Troy Ltd | | | 6,196 | |
| | 36,000 | | | | | Higashi Nihon House Co Ltd | | | 180 | |
| | 1,320,000 | | | * | | Hisense Kelon Electrical Holdings Co Ltd | | | 2,005 | |
| | 43,983 | | | | | Hooker Furniture Corp | | | 734 | |
| | 25,700 | | | e | | Hoosiers Holdings Co Ltd | | | 185 | |
| | 880,000 | | | | | Hosa International Ltd | | | 301 | |
| | 485,533 | | | *,e | | Hovnanian Enterprises, Inc (Class A) | | | 3,214 | |
| | 77,203 | | | | | Hugo Boss AG. | | | 10,996 | |
| | 301,800 | | | | | Husqvarna AB (B Shares) | | | 1,817 | |
| | 84,270 | | | | | Huvis Corp | | | 840 | |
| | 8,644 | | | | | IC Companys AS | | | 249 | |
| | 189,601 | | | *,e | | Iconix Brand Group, Inc | | | 7,527 | |
| | 215,282 | | | * | | Iida Group Holdings Co Ltd | | | 4,297 | |
| | 47,239 | | | | | Indesit Co S.p.A. | | | 623 | |
| | 910,000 | | | | | International Taifeng Holdings Ltd | | | 210 | |
| | 97,024 | | | * | | iRobot Corp | | | 3,374 | |
| | 79,700 | | | e | | Jakks Pacific, Inc | | | 536 | |
| | 98,000 | | | | | Japan Vilene Co Ltd | | | 552 | |
| | 88,000 | | | | | Japan Wool Textile Co Ltd | | | 639 | |
| | 3,093,271 | | | * | | Jarden Corp | | | 189,772 | |
| | 203,699 | | | * | | Jinshan Development & Construction Co Ltd | | | 126 | |
| | 208,556 | | | | | JM AB | | | 5,892 | |
| | 78,680 | | | | | Johnson Health Tech Co Ltd | | | 206 | |
COLLEGE RETIREMENT EQUITIES FUND - Stock Account
| | | | | | | | VALUE | |
| SHARES | | | | | COMPANY | | (000) | |
| | 20,817 | | | | | Johnson Outdoors, Inc | | $ | 561 | |
| | 309,796 | | | | | Jones Apparel Group, Inc | | | 4,635 | |
| | 197,200 | | | | | JVC KENWOOD Holdings, Inc | | | 390 | |
| | 262,044 | | | e | | KB Home | | | 4,790 | |
| | 118,000 | | | | | Kinko Optical Co Ltd | | | 117 | |
| | 4,131,000 | | | | | Kinpo Electronics | | | 1,519 | |
| | 563,500 | | | | | Konka Group Co Ltd | | | 201 | |
| | 254,000 | | | | | Kurabo Industries Ltd | | | 449 | |
| | 472,800 | | | | | Kwong Fong Industries | | | 310 | |
| | 2,052 | | | * | | Kyungbang Ltd | | | 212 | |
| | 514,820 | | | | | Lao Feng Xiang Co Ltd | | | 1,261 | |
| | 196,183 | | | | | La-Z-Boy, Inc | | | 6,082 | |
| | 864,000 | | | | | Le Saunda Holdings | | | 411 | |
| | 1,023,112 | | | | | Lealea Enterprise Co Ltd | | | 382 | |
| | 245,731 | | | *,e | | Leapfrog Enterprises, Inc | | | 1,951 | |
| | 76,245 | | | e | | Leggett & Platt, Inc | | | 2,359 | |
| | 160,538 | | | e | | Lennar Corp (Class A) | | | 6,351 | |
| | 110,533 | | | | | LG Electronics, Inc | | | 7,147 | |
| | 28,760 | | | | | LG Fashion Corp | | | 920 | |
| | 23,985 | | | *,e | | LGI Homes, Inc | | | 427 | |
| | 1,467,750 | | | *,e | | Li Ning Co Ltd | | | 1,162 | |
| | 381,356 | | | * | | Li Peng Enterprise Co Ltd | | | 186 | |
| | 65,465 | | | * | | Libbey, Inc | | | 1,375 | |
| | 39,051 | | | | | Lifetime Brands, Inc | | | 614 | |
| | 3,232,000 | | | * | | Lung Cheong International Holdings Ltd | | | 410 | |
| | 691,000 | | | | | Luthai Textile Co Ltd | | | 966 | |
| | 673,551 | | | | | Luxottica Group S.p.A. | | | 36,097 | |
| | 481,198 | | | | | LVMH Moet Hennessy Louis Vuitton S.A. | | | 87,912 | |
| | 86,068 | | | * | | M/I Homes, Inc | | | 2,190 | |
| | 4,054 | | | | | Maisons France Confort | | | 160 | |
| | 339,000 | | | | | Makalot Industrial Co Ltd | | | 1,834 | |
| | 1,244,000 | | | | | Man Wah Holdings Ltd | | | 1,951 | |
| | 6,442 | | | *,m | | Mariella Burani S.p.A. | | | 0 | ^ |
| | 31,557 | | | e | | Marine Products Corp | | | 317 | |
| | 8,300 | | | e | | Mars Engineering Corp | | | 154 | |
| | 2,683,247 | | | | | Matsushita Electric Industrial Co Ltd | | | 31,279 | |
| | 349,325 | | | | | Mattel, Inc | | | 16,621 | |
| | 424,400 | | | | | MC Group PCL | | | 150 | |
| | 2,054,700 | | | | | MC Group PCL (ADR) | | | 727 | |
| | 148,763 | | | * | | MDC Holdings, Inc | | | 4,796 | |
| | 38,000 | | | * | | Mega Brands, Inc | | | 544 | |
| | 3,241,000 | | | * | | Megawide Construction Corp | | | 1,024 | |
| | 813,500 | | | | | Merida Industry Co Ltd | | | 5,910 | |
| | 120,451 | | | * | | Meritage Homes Corp | | | 5,780 | |
| | 179,882 | | | | | Merry Electronics Co Ltd | | | 1,054 | |
| | 1,142,541 | | | * | | Michael Kors Holdings Ltd | | | 92,763 | |
| | 28,500 | | | | | Misawa Homes Co Ltd | | | 438 | |
| | 80,000 | | | | | Mitsui Home Co Ltd | | | 392 | |
COLLEGE RETIREMENT EQUITIES FUND - Stock Account
| | | | | | | | VALUE | |
| SHARES | | | | | COMPANY | | (000) | |
| | 126,000 | | | e | | Mizuno Corp | | $ | 640 | |
| | 414,999 | | | * | | Mohawk Industries, Inc | | | 61,793 | |
| | 35,936 | | | * | | Moncler S.p.A | | | 781 | |
| | 105,131 | | | | | Movado Group, Inc | | | 4,627 | |
| | 345,398 | | | | | MRV Engenharia e Participacoes S.A. | | | 1,228 | |
| | 43,909 | | | e | | Mulberry Group plc | | | 694 | |
| | 18,354 | | | | | Nacco Industries, Inc (Class A) | | | 1,141 | |
| | 5,200 | | | | | Nagawa Co Ltd | | | 102 | |
| | 845,522 | | | | | Namco Bandai Holdings, Inc | | | 18,773 | |
| | 52,000 | | | | | Nan Liu Enterprise Co Ltd | | | 287 | |
| | 88,519 | | | * | | Nautilus, Inc | | | 746 | |
| | 54,573 | | | | | New Wave Group AB (B Shares) | | | 279 | |
| | 2,921,925 | | | | | Newell Rubbermaid, Inc | | | 94,700 | |
| | 77,660 | | | | | Nexity | | | 2,931 | |
| | 478,129 | | | | | Nien Hsing Textile Co Ltd | | | 493 | |
| | 2,489,356 | | | | | Nike, Inc (Class B) | | | 195,763 | |
| | 165,235 | | | | | Nikon Corp | | | 3,158 | |
| | 248,857 | | | | | Nobia AB | | | 2,109 | |
| | 51,580 | | | * | | NVR, Inc | | | 52,922 | |
| | 806,531 | | | | | Onward Kashiyama Co Ltd | | | 6,115 | |
| | 29,362 | | | | | Oriental Weavers | | | 146 | |
| | 43,782 | | | | | Oxford Industries, Inc | | | 3,532 | |
| | 1,118,637 | | | | | Pacific Textile Holdings Ltd | | | 1,711 | |
| | 185,000 | | | | | PanaHome Corp | | | 1,363 | |
| | 237,101 | | | | | Pandora AS | | | 12,888 | |
| | 1,823,198 | | | * | | PDG Realty S.A. | | | 1,390 | |
| | 402,000 | | | *,m | | Peace Mark Holdings Ltd | | | 0 | ^ |
| | 1,569,000 | | | e | | Peak Sport Products Co Ltd | | | 383 | |
| | 15,000 | | | | | Pegas Nonwovens S.A. | | | 447 | |
| | 51,046 | | | * | | Perry Ellis International, Inc | | | 806 | |
| | 298,700 | | | | | Persimmon plc | | | 6,141 | |
| | 418,017 | | | | | Phillips-Van Heusen Corp | | | 56,859 | |
| | 200,000 | | | * | | PIK Group (GDR) | | | 464 | |
| | 356,300 | | | *,e | | Pioneer Corp | | | 746 | |
| | 9,054,857 | | | | | Playmates Holdings Ltd | | | 12,057 | |
| | 556,000 | | | * | | Playmates Toys Ltd | | | 261 | |
| | 288,026 | | | | | Polaris Industries, Inc | | | 41,948 | |
| | 71,428 | | | * | | Poltrona Frau S.p.A. | | | 232 | |
| | 151,303 | | | | | Pool Corp | | | 8,797 | |
| | 661,000 | | | | | Ports Design Ltd | | | 512 | |
| | 5,505,170 | | | | | Pou Chen Corp | | | 8,242 | |
| | 6,100 | | | | | Pressance Corp | | | 179 | |
| | 1,210,200 | | | e | | Prime Success International Group Ltd | | | 546 | |
| | 7,930,000 | | | * | | PT Sri Rejeki Isman Tbk | | | 160 | |
| | 8,044,262 | | | | | Pulte Homes, Inc | | | 163,862 | |
| | 469,578 | | | *,e | | Quiksilver, Inc | | | 4,118 | |
| | 267,001 | | | * | | Rajesh Exports Ltd | | | 334 | |
| | 66,820 | | | | | Ralph Lauren Corp | | | 11,798 | |
COLLEGE RETIREMENT EQUITIES FUND - Stock Account
| | | | | | | | VALUE | |
| SHARES | | | | | COMPANY | | (000) | |
| | 130,103 | | | | | Raymond Ltd | | $ | 594 | |
| | 299,256 | | | | | Redrow plc | | | 1,552 | |
| | 155,700 | | | | | Restoque Comercio e Confeccoes de Roupas S.A. | | | 396 | |
| | 38,512 | | | | | RG Barry Corp | | | 743 | |
| | 24,166 | | | | | Rinnai Corp | | | 1,883 | |
| | 30,800 | | | | | Rodobens Negocios Imobiliarios S.A. | | | 171 | |
| | 22,400 | | | | | Roland Corp | | | 304 | |
| | 344,556 | | | * | | Rossi Residencial S.A. | | | 299 | |
| | 750,217 | | | | | Ruentex Industries Ltd | | | 1,930 | |
| | 176,884 | | | | | Ryland Group, Inc | | | 7,679 | |
| | 40,054 | | | * | | Safilo Group S.p.A. | | | 933 | |
| | 49,421 | | | | | Salvatore Ferragamo Italia S.p.A | | | 1,880 | |
| | 1,045,000 | | | | | Sampo Corp | | | 416 | |
| | 1,227,000 | | | | | Samson Holding Ltd | | | 168 | |
| | 1,108,400 | | | e | | Samsonite International | | | 3,381 | |
| | 32,976 | | | | | Sangetsu Co Ltd | | | 822 | |
| | 88,421 | | | | | Sankyo Co Ltd | | | 4,078 | |
| | 122,400 | | | | | Sanyo Electric Taiwan Co Ltd | | | 172 | |
| | 257,000 | | | e | | Sanyo Shokai Ltd | | | 696 | |
| | 26,614 | | | | | SEB S.A. | | | 2,407 | |
| | 686,621 | | | | | Sega Sammy Holdings, Inc | | | 17,499 | |
| | 423,000 | | | | | Seiko Holdings Corp | | | 2,086 | |
| | 1,172,330 | | | | | Seiren Co Ltd | | | 9,322 | |
| | 917,469 | | | | | Sekisui Chemical Co Ltd | | | 11,259 | |
| | 1,626,171 | | | | | Sekisui House Ltd | | | 22,755 | |
| | 481,900 | | | * | | Shanghai Haixin Group Co | | | 260 | |
| | 274,202 | | | * | | Sharp Corp | | | 873 | |
| | 698,000 | | | | | Shenzhou International Group Holdings Ltd | | | 2,625 | |
| | 20,591 | | | | | Shimano, Inc | | | 1,768 | |
| | 221,000 | | | | | Shinkong Textile Co Ltd | | | 297 | |
| | 401,000 | | | | | Sitoy Group Holdings Ltd | | | 231 | |
| | 155,228 | | | * | | Skechers U.S.A., Inc (Class A) | | | 5,143 | |
| | 60,394 | | | * | | Skullcandy, Inc | | | 435 | |
| | 2,557,702 | | | | | Skyworth Digital Holdings Ltd | | | 1,414 | |
| | 311,065 | | | *,e | | Smith & Wesson Holding Corp | | | 4,196 | |
| | 876,666 | | | | | Socovesa S.A. | | | 213 | |
| | 177,549 | | | *,e | | SodaStream International Ltd | | | 8,814 | |
| | 2,849,904 | | | e | | Sony Corp | | | 49,127 | |
| | 164,000 | | | e | | Sony Corp (ADR) | | | 2,836 | |
| | 13,300 | | | | | SRI Sports Ltd | | | 159 | |
| | 595,576 | | | *,e | | Standard-Pacific Corp | | | 5,390 | |
| | 47,000 | | | | | Starts Corp, Inc | | | 673 | |
| | 3,994,347 | | | e | | Steinhoff International Holdings Ltd | | | 17,210 | |
| | 726,500 | | | | | Stella International Holdings Ltd | | | 1,851 | |
| | 306,826 | | | * | | Steven Madden Ltd | | | 11,227 | |
| | 66,464 | | | e | | Sturm Ruger & Co, Inc | | | 4,858 | |
| | 272,354 | | | | | Sumitomo Forestry Co Ltd | | | 3,171 | |
| | 35,000 | | | e | | Sun Corp | | | 444 | |
COLLEGE RETIREMENT EQUITIES FUND - Stock Account
| | | | | | | | VALUE | |
| SHARES | | | | | COMPANY | | (000) | |
| | 39,353 | | | | | Swatch Group AG. | | $ | 26,083 | |
| | 148,609 | | | | | Swatch Group AG. Reg | | | 16,752 | |
| | 121,000 | | | *,e | | Sxl | | | 160 | |
| | 97,000 | | | | | Tainan Enterprises Co Ltd | | | 102 | |
| | 727,755 | | | | | Tainan Spinning Co Ltd | | | 515 | |
| | 192,600 | | | | | Taiwan Paiho Ltd | | | 233 | |
| | 20,400 | | | | | Taiwan Sakura Corp | | | 14 | |
| | 133,393 | | | e | | Takamatsu Corp | | | 2,398 | |
| | 16,000 | | | | | Tama Home Co Ltd | | | 149 | |
| | 18,500 | | | e | | Tamron Co Ltd | | | 449 | |
| | 1,787,298 | | | * | | Tatung Co Ltd | | | 497 | |
| | 38,916 | | | * | | Taylor Morrison Home Corp | | | 874 | |
| | 6,994,674 | | | | | Taylor Woodrow plc | | | 12,954 | |
| | 792,000 | | | | | TCL Multimedia Technology Holdings Ltd | | | 369 | |
| | 39,000 | | | | | Technos S.A. | | | 268 | |
| | 3,255,617 | | | e | | Techtronic Industries Co | | | 9,273 | |
| | 151,800 | | | * | | Tecnisa S.A. | | | 576 | |
| | 232,061 | | | * | | Tempur-Pedic International, Inc | | | 12,522 | |
| | 668,000 | | | e | | Texhong Textile Group Ltd | | | 869 | |
| | 800,000 | | | | | Texwinca Holdings Ltd | | | 843 | |
| | 332,161 | | | * | | Thomson | | | 1,760 | |
| | 2,340,000 | | | | | Time Watch Investments Ltd | | | 327 | |
| | 8,665 | | | | | Titan Industries Ltd | | | 32 | |
| | 14,445 | | | | | Tod’s S.p.A. | | | 2,412 | |
| | 13,770 | | | | | Token Corp | | | 662 | |
| | 90,171 | | | * | | Toll Brothers, Inc | | | 3,336 | |
| | 149,426 | | | * | | TomTom NV | | | 1,061 | |
| | 72,168 | | | | | Tomy Co Ltd | | | 322 | |
| | 74,000 | | | | | Toung Loong Textile Manufacturing | | | 270 | |
| | 655,520 | | | *,e | | TRI Pointe Homes, Inc | | | 13,064 | |
| | 20,390 | | | * | | Trigano S.A. | | | 444 | |
| | 1,198,000 | | | e | | Trinity Ltd | | | 403 | |
| | 171,700 | | | | | TSI Holdings Co Ltd | | | 1,150 | |
| | 17,056 | | | | | TTK Prestige Ltd | | | 960 | |
| | 307,578 | | | * | | Tumi Holdings, Inc | | | 6,936 | |
| | 666,807 | | | | | Tupperware Corp | | | 63,033 | |
| | 21,233 | | | * | | UCP, Inc (Class A) | | | 311 | |
| | 70,613 | | | *,e | | Under Armour, Inc (Class A) | | | 6,164 | |
| | 65,300 | | | | | UNICASA Industria de Moveis S.A. | | | 158 | |
| | 55,291 | | | * | | Unifi, Inc | | | 1,506 | |
| | 624,000 | | | * | | Unitika Ltd | | | 380 | |
| | 61,412 | | | * | | Universal Electronics, Inc | | | 2,340 | |
| | 591,479 | | | *,e,m | | Urbi Desarrollos Urbanos S.A. de C.V | | | 53 | |
| | 1,476 | | | * | | Vardhman Textiles Ltd | | | 9 | |
| | 68,386 | | | *,e | | Vera Bradley, Inc | | | 1,644 | |
| | 201,118 | | | * | | Vestel Beyaz Esya Sanayi ve Ticaret AS | | | 284 | |
| | 179,066 | | | * | | Vestel Elektronik Sanayi | | | 129 | |
| | 1,468,714 | | | | | VF Corp | | | 91,560 | |
| | 36,082 | | | * | | Vince Holding Corp | | | 1,107 | |
COLLEGE RETIREMENT EQUITIES FUND - Stock Account
| | | | | | | | VALUE | |
| SHARES | | | | | COMPANY | | (000) | |
| | 178,627 | | | | | Wacoal Holdings Corp | | $ | 1,819 | |
| | 39,085 | | | * | | WCI Communities, Inc | | | 746 | |
| | 131,500 | | | e | | Weiqiao Textile Co | | | 81 | |
| | 3,378,000 | | | | | Welling Holding Ltd | | | 1,094 | |
| | 16,200 | | | | | West Holdings Corp | | | 208 | |
| | 26,235 | | | | | Weyco Group, Inc | | | 772 | |
| | 510,995 | | | | | Whirlpool Corp | | | 80,155 | |
| | 28,254 | | | * | | Whirlpool of India Ltd | | | 97 | |
| | 70,909 | | | * | | William Lyon Homes, Inc | | | 1,570 | |
| | 858,972 | | | | | Wolverine World Wide, Inc | | | 29,171 | |
| | 26,618 | | | * | | Woongjin Chemical Co Ltd | | | 276 | |
| | 184,910 | | | | | Woongjin Coway Co Ltd | | | 11,649 | |
| | 296,131 | | | | | Wuxi Little Swan Co Ltd | | | 362 | |
| | 2,228,500 | | | e | | XTEP International Holdings | | | 1,152 | |
| | 111,388 | | | | | Yamaha Corp | | | 1,771 | |
| | 83,000 | | | | | YGM Trading Ltd | | | 188 | |
| | 20,800 | | | | | Yondoshi Holdings, Inc | | | 315 | |
| | 44,000 | | | | | Young Optics, Inc | | | 90 | |
| | 31,260 | | | | | Youngone Corp | | | 1,261 | |
| | 10,670 | | | | | Youngone Holdings Co Ltd | | | 798 | |
| | 1,920,907 | | | | | Yue Yuen Industrial Holdings | | | 6,423 | |
| | 134,012 | | | *,e | | Zagg, Inc | | | 583 | |
| | 46,764 | | | | | Zeng Hsing Industrial Co Ltd | | | 259 | |
| | 11,000 | | | | | Zhonglu Co Ltd | | | 9 | |
| | 250,596 | | | * | | Zig Sheng Industrial Co Ltd | | | 87 | |
| | | | | | | TOTAL CONSUMER DURABLES & APPAREL | | | 2,847,055 | |
| | | | | | | | | | | |
| CONSUMER SERVICES - 2.3% | | | | |
| | 482,856 | | | | | 888 Holdings plc | | | 1,380 | |
| | 39,300 | | | | | Abril Educacao S.A. | | | 556 | |
| | 3,080,145 | | | | | Accor S.A. | | | 145,475 | |
| | 226,100 | | | | | Accordia Golf Co Ltd | | | 2,852 | |
| | 262,926 | | | | | Advtech Ltd | | | 165 | |
| | 5,100 | | | | | Aeon Fantasy Co Ltd | | | 78 | |
| | 126,688 | | | * | | AFC Enterprises | | | 4,877 | |
| | 264,359 | | | | | Ainsworth Game Technology Ltd | | | 1,038 | |
| | 711,000 | | | e | | Ajisen China Holdings Ltd | | | 737 | |
| | 1,114,702 | | | e | | Alsea SAB de C.V. | | | 3,482 | |
| | 255,000 | | | | | Ambassador Hotel | | | 255 | |
| | 56,518 | | | *,e | | American Public Education, Inc | | | 2,457 | |
| | 708,100 | | | | | Anhanguera Educacional Participacoes S.A. | | | 4,472 | |
| | 434,149 | | | * | | Apollo Group, Inc (Class A) | | | 11,861 | |
| | 790,697 | | | *,e | | ARAMARK Holdings Corp | | | 20,732 | |
| | 1,257,962 | | | e | | Aristocrat Leisure Ltd | | | 5,285 | |
| | 55,473 | | | * | | Ascent Media Corp (Series A) | | | 4,746 | |
| | 58,300 | | | e | | Atom Corp | | | 293 | |
| | 147,266 | | | * | | Autogrill S.p.A. | | | 1,244 | |
| | 353,234 | | | * | | Bally Technologies, Inc | | | 27,711 | |
COLLEGE RETIREMENT EQUITIES FUND - Stock Account
| | | | | | | | VALUE | |
| SHARES | | | | | COMPANY | | (000) | |
| | 72,868 | | | | | Benesse Corp | | $ | 2,927 | |
| | 572,951 | | | | | Berjaya Sports Toto BHD | | | 708 | |
| | 17,800 | | | e | | Best Bridal Inc | | | 112 | |
| | 79,306 | | | | | BETFAIR Group Ltd | | | 1,418 | |
| | 44,851 | | | | | Betsson AB | | | 1,423 | |
| | 261,334 | | | * | | BHG S.A.-Brazil Hospitality Group | | | 1,524 | |
| | 85,684 | | | * | | BJ’s Restaurants, Inc | | | 2,661 | |
| | 14,030,800 | | | * | | Bloomberry Resorts Corp | | | 2,731 | |
| | 278,933 | | | *,e | | Bloomin’ Brands, Inc | | | 6,697 | |
| | 105,504 | | | | | Bob Evans Farms, Inc | | | 5,337 | |
| | 228,723 | | | *,e | | Boyd Gaming Corp | | | 2,575 | |
| | 62,490 | | | * | | Bravo Brio Restaurant Group, Inc | | | 1,017 | |
| | 69,597 | | | *,e | | Bridgepoint Education, Inc | | | 1,233 | |
| | 55,357 | | | * | | Bright Horizons Family Solutions | | | 2,034 | |
| | 374,682 | | | | | Brinker International, Inc | | | 17,363 | |
| | 61,522 | | | * | | Buffalo Wild Wings, Inc | | | 9,056 | |
| | 429,705 | | | e | | Burger King Worldwide, Inc | | | 9,823 | |
| | 132,114 | | | *,e | | Caesars Entertainment Corp | | | 2,846 | |
| | 744,000 | | | | | Cafe de Coral Holdings Ltd | | | 2,401 | |
| | 80,594 | | | * | | Capella Education Co | | | 5,355 | |
| | 202,125 | | | * | | Career Education Corp | | | 1,152 | |
| | 3,030,469 | | | | | Carnival Corp | | | 121,734 | |
| | 84,716 | | | | | Carnival plc | | | 3,507 | |
| | 48,036 | | | | | Carriage Services, Inc | | | 938 | |
| | 96,100 | | | * | | Carrols Restaurant Group, Inc | | | 635 | |
| | 87,230 | | | | | CBRL Group, Inc | | | 9,601 | |
| | 59,029 | | | | | CEC Entertainment, Inc | | | 2,614 | |
| | 1,107,900 | | | | | Central Plaza Hotel PCL | | | 933 | |
| | 1,514,040 | | | | | Century City International | | | 117 | |
| | 187,401 | | | | | Cheesecake Factory | | | 9,046 | |
| | 5,310,000 | | | | | China Travel International Inv HK | | | 1,118 | |
| | 159,531 | | | * | | Chipotle Mexican Grill, Inc (Class A) | | | 84,995 | |
| | 13,438 | | | e | | Choice Hotels International, Inc | | | 660 | |
| | 43,478 | | | * | | Churchill Downs, Inc | | | 3,898 | |
| | 515,878 | | | * | | Chuy’s Holdings, Inc | | | 18,582 | |
| | 11,133 | | | | | Cie des Alpes | | | 245 | |
| | 66,425 | | | e | | City Lodge Hotels Ltd | | | 884 | |
| | 31,761 | | | * | | Club Mediterranee S.A. | | | 760 | |
| | 63,248 | | | * | | ClubCorp Holdings, Inc | | | 1,122 | |
| | 70,000 | | | e | | Colowide Co Ltd | | | 704 | |
| | 549,838 | | | | | Compass Group plc | | | 8,828 | |
| | 131,525 | | | e | | Consumers’ Waterheater Income Fund | | | 1,234 | |
| | 322,665 | | | *,e | | Corinthian Colleges, Inc | | | 574 | |
| | 77,087 | | | | | Corporate Travel Management Lt | | | 383 | |
| | 63,279 | | | | | Cox & Kings India Ltd | | | 118 | |
| | 2,888 | | | | | Credu Corp | | | 124 | |
| | 377,912 | | | | | Crown Ltd | | | 5,702 | |
COLLEGE RETIREMENT EQUITIES FUND - Stock Account
| | | | | | | | VALUE | |
| SHARES | | | | | COMPANY | | (000) | |
| | 9,000 | | | | | Daisyo Corp | | $ | 113 | |
| | 1,627,763 | | | e | | Darden Restaurants, Inc | | | 88,501 | |
| | 715,318 | | | * | | Del Frisco’s Restaurant Group, Inc | | | 16,860 | |
| | 472,142 | | | * | | Denny’s Corp | | | 3,395 | |
| | 119,279 | | | e | | DeVry, Inc | | | 4,234 | |
| | 77,355 | | | * | | Diamond Resorts International, Inc | | | 1,428 | |
| | 76,663 | | | | | Dignity plc | | | 1,828 | |
| | 77,681 | | | | | DineEquity, Inc | | | 6,490 | |
| | 35,277 | | | * | | Diversified Restaurant Holdings, Inc | | | 168 | |
| | 76,259 | | | | | Domino’s Pizza Enterprises Ltd | | | 1,102 | |
| | 322,274 | | | | | Domino’s Pizza UK & IRL plc | | | 2,742 | |
| | 280,194 | | | | | Domino’s Pizza, Inc | | | 19,516 | |
| | 33,400 | | | | | Doutor Nichires Holdings Co Ltd | | | 557 | |
| | 124,852 | | | | | Dunkin Brands Group, Inc | | | 6,018 | |
| | 3,535,400 | | | | | Dynam Japan Holdings Co Ltd | | | 12,398 | |
| | 15,406,752 | | | | | Echo Entertainment Group Ltd | | | 33,938 | |
| | 85,127 | | | *,e | | Education Management Corp | | | 859 | |
| | 67,227 | | | | | EIH Ltd | | | 68 | |
| | 27,000 | | | | | Einstein Noah Restaurant Group, Inc | | | 392 | |
| | 1,445,000 | | | | | Emperor Entertainment Hotel Ltd | | | 747 | |
| | 1,950,848 | | | | | Enjoy S.A. | | | 286 | |
| | 619,582 | | | * | | Enterprise Inns plc | | | 1,583 | |
| | 1,474,000 | | | | | Erawan Group PCL | | | 148 | |
| | 266,500 | | | | | Estacio Participacoes S.A. | | | 2,306 | |
| | 31,247 | | | * | | Euro Disney SCA | | | 181 | |
| | 2,900,096 | | | * | | Extended Stay America, Inc | | | 76,157 | |
| | 97,333 | | | | | Famous Brands Ltd | | | 889 | |
| | 100,300 | | | * | | Fiesta Restaurant Group, Inc | | | 5,240 | |
| | 367,633 | | | | | First Hotel | | | 237 | |
| | 127,108 | | | e | | Flight Centre Ltd | | | 5,413 | |
| | 119,037 | | | | | Formosa International Hotels Corp | | | 1,360 | |
| | 69,000 | | | | | Fortuna Entertainment Group NV | | | 411 | |
| | 78,000 | | | e | | Fuji Kyuko Co Ltd | | | 640 | |
| | 69,000 | | | | | Fujita Kanko, Inc | | | 264 | |
| | 836,738 | | | | | G8 Education Ltd | | | 2,368 | |
| | 3,344,155 | | | * | | Galaxy Entertainment Group Ltd | | | 30,108 | |
| | 4,078,605 | | | | | Genting BHD | | | 12,793 | |
| | 19,915,000 | | | *,e | | Genting Hong Kong Ltd | | | 8,575 | |
| | 80,347,928 | | | | | Genting International plc | | | 95,549 | |
| | 372,000 | | | | | Gourmet Master Co Ltd | | | 2,516 | |
| | 16,403 | | | * | | Graham Holdings Co | | | 10,880 | |
| | 144,145 | | | * | | Grand Canyon Education, Inc | | | 6,285 | |
| | 53,500 | | | | | Grand Korea Leisure Co Ltd | | | 2,052 | |
| | 97,157 | | | * | | Great Canadian Gaming Corp | | | 1,339 | |
| | 319,472 | | | | | Greene King plc | | | 4,667 | |
| | 663,000 | | | e | | GuocoLeisure Ltd | | | 453 | |
| | 1,276,356 | | | | | H&R Block, Inc | | | 37,065 | |
| | 12,020 | | | | | Hana Tour Service, Inc | | | 738 | |
COLLEGE RETIREMENT EQUITIES FUND - Stock Account
| | | | | | | | VALUE | |
| SHARES | | | | | COMPANY | | (000) | |
| | 223,607 | | | | | Hillenbrand, Inc | | $ | 6,579 | |
| | 460,292 | | | *,e | | Hilton Worldwide Holdings, Inc | | | 10,241 | |
| | 26,500 | | | e | | Hiramatsu Inc | | | 166 | |
| | 188,197 | | | | | HIS Co Ltd | | | 9,403 | |
| | 456,000 | | | | | Hotel Properties Ltd | | | 1,125 | |
| | 48,006 | | | | | Hotel Shilla Co Ltd | | | 3,026 | |
| | 61,699 | | | * | | Houghton Mifflin Harcourt Co | | | 1,046 | |
| | 254,050 | | | | | Huangshan Tourism Development Co Ltd | | | 313 | |
| | 104,118 | | | * | | Hyatt Hotels Corp | | | 5,150 | |
| | 7,700 | | | | | Ichibanya Co Ltd | | | 283 | |
| | 23,767 | | | *,e | | Ignite Restaurant Group, Inc | | | 297 | |
| | 245,919 | | | | | Indian Hotels Co Ltd | | | 246 | |
| | 58,670 | | | | | InterContinental Hotels Group plc | | | 1,957 | |
| | 940,397 | | | | | International Game Technology | | | 17,078 | |
| | 72,000 | | | * | | International Meal Co Holdings S.A. | | | 557 | |
| | 107,225 | | | | | International Speedway Corp (Class A) | | | 3,805 | |
| | 627,056 | | | | | Interval Leisure Group, Inc | | | 19,376 | |
| | 112,262 | | | | | Intralot S.A.-Integrated Lottery Systems & Services | | | 284 | |
| | 122,071 | | | | | Invocare Ltd | | | 1,205 | |
| | 84,486 | | | * | | Isle of Capri Casinos, Inc | | | 760 | |
| | 84,189 | | | *,e | | ITT Educational Services, Inc | | | 2,827 | |
| | 224,490 | | | * | | Jack in the Box, Inc | | | 11,229 | |
| | 73,829 | | | * | | Jamba, Inc | | | 918 | |
| | 400,170 | | | | | Jollibee Foods Corp | | | 1,564 | |
| | 54,500 | | | e | | JP-Holdings Inc/Japan | | | 214 | |
| | 16,541 | | | *,e | | JTH Holding, Inc | | | 402 | |
| | 61,771 | | | * | | Jubilant Foodworks Ltd | | | 1,273 | |
| | 87,276 | | | *,e | | K12, Inc | | | 1,898 | |
| | 100,980 | | | | | Kangwon Land, Inc | | | 2,965 | |
| | 15,650 | | | *,e | | Kappa Create Co Ltd | | | 296 | |
| | 23,300 | | | e | | Kisoji Co Ltd | | | 412 | |
| | 13,900 | | | | | Koshidaka Holdings Co Ltd | | | 390 | |
| | 805,000 | | | | | Kosmopolito Hotels International Ltd | | | 169 | |
| | 336,623 | | | * | | Krispy Kreme Doughnuts, Inc | | | 6,493 | |
| | 363,000 | | | | | Kroton Educacional S.A. | | | 6,041 | |
| | 4,016 | | | | | Kuoni Reisen Holding | | | 1,812 | |
| | 12,400 | | | | | Kura Corp | | | 187 | |
| | 32,400 | | | e | | Kyoritsu Maintenance Co Ltd | | | 1,166 | |
| | 4,816,175 | | | | | Ladbrokes plc | | | 14,313 | |
| | 356,500 | | | * | | Landmarks BHD | | | 117 | |
| | 3,261,228 | | | | | Las Vegas Sands Corp | | | 257,213 | |
| | 151,165 | | | *,e | | Life Time Fitness, Inc | | | 7,105 | |
| | 234,743 | | | * | | LifeLock, Inc | | | 3,852 | |
| | 78,617 | | | | | Lincoln Educational Services Corp | | | 392 | |
| | 452,521 | | | | | Lottomatica S.p.A. | | | 13,791 | |
| | 81,055 | | | * | | Luby’s, Inc | | | 626 | |
| | 2,776,000 | | | *,e | | Macau Legend Development Ltd | | | 2,924 | |
| | 46,840 | | | | | Mac-Gray Corp | | | 994 | |
COLLEGE RETIREMENT EQUITIES FUND - Stock Account
| | | | | | | | VALUE | |
| SHARES | | | | | COMPANY | | (000) | |
| | 1,192,875 | | | e | | Macquarie Leisure Trust Group | | $ | 2,145 | |
| | 76,281 | | | | | Marcus Corp | | | 1,025 | |
| | 1,279,123 | | | | | Marriott International, Inc (Class A) | | | 63,138 | |
| | 114,957 | | | * | | Marriott Vacations Worldwide Corp | | | 6,065 | |
| | 726,257 | | | | | Marston’s plc | | | 1,730 | |
| | 8,700 | | | e | | Matsuya Foods Co Ltd | | | 143 | |
| | 96,278 | | | | | Matthews International Corp (Class A) | | | 4,102 | |
| | 1,924,804 | | | | | McDonald’s Corp | | | 186,764 | |
| | 7,864 | | | e | | McDonald’s Holdings Co Japan Ltd | | | 201 | |
| | 7,858 | | | | | MegaStudy Co Ltd | | | 581 | |
| | 15,400 | | | | | Meiko Network Japan Co Ltd | | | 164 | |
| | 7,889,600 | | | * | | Melco Crown Philippines Resorts Corp | | | 2,437 | |
| | 1,059,000 | | | | | Melco International Development | | | 3,906 | |
| | 73,894 | | | * | | Melco PBL Entertainment Macau Ltd (ADR) | | | 2,898 | |
| | 1,130,000 | | | *,g | | Merlin Entertainments plc | | | 6,690 | |
| | 2,271,600 | | | | | MGM China Holdings Ltd | | | 9,722 | |
| | 332,972 | | | * | | MGM Mirage | | | 7,832 | |
| | 216,027 | | | | | Millennium & Copthorne Hotels plc | | | 2,153 | |
| | 4,908,790 | | | | | Minor International PCL (Foreign) | | | 3,104 | |
| | 244,500 | | | * | | Mitchells & Butlers plc | | | 1,711 | |
| | 381,000 | | | * | | MK Restaurants Group PCL | | | 595 | |
| | 9,783 | | | | | Modetour Network, Inc | | | 213 | |
| | 39,939 | | | * | | Monarch Casino & Resort, Inc | | | 802 | |
| | 106,834 | | | * | | Morgans Hotel Group Co | | | 869 | |
| | 32,000 | | | | | MOS Food Services, Inc | | | 607 | |
| | 224,027 | | | * | | Multimedia Games, Inc | | | 7,025 | |
| | 2,172,000 | | | e | | NagaCorp Ltd | | | 2,294 | |
| | 9,232 | | | * | | Nathan’s Famous, Inc | | | 465 | |
| | 244,709 | | | | | Navitas Ltd | | | 1,408 | |
| | 302,771 | | | | | NET Holding AS | | | 344 | |
| | 105,012 | | | *,e | | NH Hoteles S.A. | | | 620 | |
| | 19,759 | | | *,e | | Noodles & Co | | | 710 | |
| | 60,865 | | | * | | Norwegian Cruise Line Holdings Ltd | | | 2,159 | |
| | 34,000 | | | e | | Ohsho Food Service Corp | | | 1,040 | |
| | 660,381 | | | | | OPAP S.A. | | | 8,793 | |
| | 11,582 | | | * | | Orascom Development Holding AG. | | | 189 | |
| | 179,681 | | | | | Oriental Land Co Ltd | | | 25,913 | |
| | 2,271,778 | | | * | | Orient-Express Hotels Ltd (Class A) | | | 34,327 | |
| | 362,000 | | | e | | Overseas Union Enterprise Ltd | | | 718 | |
| | 24,500 | | | e | | Pacific Golf Group International Holdings KK | | | 231 | |
| | 120,059 | | | | | Paddy Power plc | | | 10,252 | |
| | 506,436 | | | | | Paliburg Holdings Ltd | | | 165 | |
| | 44,449 | | | * | | Panera Bread Co (Class A) | | | 7,854 | |
| | 182,560 | | | | | Papa John’s International, Inc | | | 8,288 | |
| | 52,500 | | | | | Paradise Co Ltd | | | 1,317 | |
| | 822,625 | | | e | | PartyGaming plc | | | 1,681 | |
| | 1,405,729 | | | *,e | | Penn National Gaming, Inc | | | 20,144 | |
| | 657,720 | | | | | Philweb Corp | | | 133 | |
COLLEGE RETIREMENT EQUITIES FUND - Stock Account
| | | | | | | | VALUE | |
| SHARES | | | | | COMPANY | | (000) | |
| | 190,334 | | | * | | Pinnacle Entertainment, Inc | | $ | 4,947 | |
| | 77,400 | | | | | Plenus Co Ltd | | | 1,731 | |
| | 22,860 | | | *,e | | Potbelly Corp | | | 555 | |
| | 952,398 | | | e | | Raffles Education Corp Ltd | | | 219 | |
| | 48,000 | | | * | | Red Robin Gourmet Burgers, Inc | | | 3,530 | |
| | 621,000 | | | | | Regal Hotels International Holdings Ltd | | | 389 | |
| | 186,826 | | | | | Regis Corp | | | 2,711 | |
| | 3,149,500 | | | | | Resorts World BHD | | | 4,216 | |
| | 78,800 | | | | | Resorttrust, Inc | | | 1,437 | |
| | 429,943 | | | | | Restaurant Group plc | | | 4,218 | |
| | 118,308 | | | | | Retail Food Group Ltd | | | 486 | |
| | 25,714,566 | | | e | | Rexcapital Financial Holdings Ltd | | | 3,487 | |
| | 100,634 | | | * | | Rezidor Hotel Group AB | | | 626 | |
| | 19,200 | | | e | | Ringer Hut Co Ltd | | | 271 | |
| | 23,344 | | | e | | Riso Kyoiku Co Ltd | | | 115 | |
| | 201,100 | | | | | Round One Corp | | | 1,615 | |
| | 538,377 | | | | | Royal Caribbean Cruises Ltd | | | 25,530 | |
| | 33,700 | | | e | | Royal Holdings Co Ltd | | | 505 | |
| | 230,127 | | | * | | Ruby Tuesday, Inc | | | 1,595 | |
| | 175,954 | | | | | Ruth’s Chris Steak House, Inc | | | 2,500 | |
| | 32,200 | | | e | | Saizeriya Co Ltd | | | 394 | |
| | 4,805,179 | | | | | Sands China Ltd | | | 39,380 | |
| | 303,648 | | | * | | Scientific Games Corp (Class A) | | | 5,141 | |
| | 69,107 | | | | | SeaWorld Entertainment, Inc | | | 1,988 | |
| | 961,500 | | | | | Service Corp International | | | 17,432 | |
| | 224,984 | | | | | Shanghai Jinjiang International Hotels Development Co Ltd | | | 358 | |
| | 2,168,000 | | | | | Shanghai Jinjiang International Hotels Group Co Ltd | | | 740 | |
| | 107,249 | | | | | Shanghai Jinjiang International Travel Co Ltd | | | 189 | |
| | 178,120 | | | | | Shangri-La Asia Ltd | | | 348 | |
| | 2,859 | | | | | Shinsegae Food Co Ltd | | | 232 | |
| | 887,367 | | | | | Six Flags Entertainment Corp | | | 32,673 | |
| | 3,832,813 | | | | | SJM Holdings Ltd | | | 12,884 | |
| | 24,771 | | | | | SkiStar AB (Series B) | | | 305 | |
| | 686,914 | | | | | Sky City Entertainment Group Ltd | | | 2,108 | |
| | 30,012 | | | * | | SM Culture & Contents Co Ltd | | | 82 | |
| | 12,012 | | | | | Sodexho Alliance S.A. | | | 1,218 | |
| | 53,463 | | | e | | Sol Melia S.A. | | | 687 | |
| | 330,075 | | | * | | Sonic Corp | | | 6,664 | |
| | 320,287 | | | | | Sotheby’s (Class A) | | | 17,039 | |
| | 45,860 | | | | | Speedway Motorsports, Inc | | | 910 | |
| | 1,012,112 | | | | | Spirit Pub Co plc | | | 1,286 | |
| | 8,200 | | | | | St Marc Holdings Co Ltd | | | 392 | |
| | 674,000 | | | e | | Stamford Land Corp Ltd | | | 310 | |
| | 97,600 | | | e | | Starbucks Coffee Japan Ltd | | | 1,082 | |
| | 3,713,619 | | | | | Starbucks Corp | | | 291,111 | |
| | 1,298,618 | | | | | Starwood Hotels & Resorts Worldwide, Inc | | | 103,175 | |
| | 5,778 | | | * | | Steak N Shake Co | | | 2,927 | |
| | 61,251 | | | * | | Steiner Leisure Ltd | | | 3,013 | |
COLLEGE RETIREMENT EQUITIES FUND - Stock Account
| | | | | | | | VALUE | |
| SHARES | | | | | COMPANY | | (000) | |
| | 36,071 | | | *,e | | Strayer Education, Inc | | $ | 1,243 | |
| | 160,417 | | | | | Sun International Ltd | | | 1,457 | |
| | 1,506,300 | | | | | Ta Enterprise BHD | | | 359 | |
| | 88,606 | | | | | Tabcorp Holdings Ltd | | | 288 | |
| | 170,227 | | | | | Tattersall’s Ltd | | | 472 | |
| | 200,217 | | | | | Texas Roadhouse, Inc (Class A) | | | 5,566 | |
| | 1,940,502 | | | * | | Thomas Cook Group plc | | | 5,386 | |
| | 232,209 | | | | | Tim Hortons, Inc (Toronto) | | | 13,551 | |
| | 6,502 | | | * | | Tipp24 SE | | | 435 | |
| | 215,000 | | | | | Tokyo Dome Corp | | | 1,426 | |
| | 169,000 | | | e | | Tokyotokeiba Co Ltd | | | 685 | |
| | 18,100 | | | e | | Toridoll.corp | | | 163 | |
| | 90,690 | | | | | Town Sports International Holdings, Inc | | | 1,339 | |
| | 1,600,000 | | | e | | Tsui Wah Holdings Ltd | | | 1,125 | |
| | 395,023 | | | * | | TUI AG. | | | 6,517 | |
| | 441,378 | | | | | TUI Travel plc | | | 3,025 | |
| | 36,549 | | | | | Unibet Group plc (ADR) | | | 1,764 | |
| | 85,143 | | | | | Universal Technical Institute, Inc | | | 1,184 | |
| | 114,877 | | | | | Vail Resorts, Inc | | | 8,642 | |
| | 23,700 | | | *,e | | Watami Co Ltd | | | 311 | |
| | 55,895 | | | e | | Weight Watchers International, Inc | | | 1,841 | |
| | 151,908 | | | e | | Wendy’s | | | 1,325 | |
| | 133,299 | | | | | Wetherspoon (J.D.) plc | | | 1,681 | |
| | 36,000 | | | | | Whistler Blackcomb Holdings, Inc | | | 564 | |
| | 542,389 | | | | | Whitbread plc | | | 33,755 | |
| | 2,033,463 | | | | | William Hill plc | | | 13,556 | |
| | 86,000 | | | | | Wowprime Corp | | | 1,430 | |
| | 773,326 | | | | | Wyndham Worldwide Corp | | | 56,986 | |
| | 3,053,890 | | | e | | Wynn Macau Ltd | | | 13,882 | |
| | 77,477 | | | | | Wynn Resorts Ltd | | | 15,047 | |
| | 325,000 | | | | | YBM Sisa.com, Inc | | | 1,172 | |
| | 108,000 | | | e | | Yomiuri Land Co Ltd | | | 775 | |
| | 138,700 | | | e | | Yoshinoya D&C Co Ltd | | | 1,697 | |
| | 1,017,040 | | | | | Yum! Brands, Inc | | | 76,898 | |
| | 78,600 | | | e | | Zensho Co Ltd | | | 843 | |
| | | | | | | TOTAL CONSUMER SERVICES | | | 2,862,290 | |
| | | | | | | | | | | |
| DIVERSIFIED FINANCIALS - 5.7% | | | | |
| | 426,214 | | | | | 3i Group plc | | | 2,723 | |
| | 33,714 | | | e | | ABC Arbitrage | | | 219 | |
| | 3,924,805 | | | | | Aberdeen Asset Management plc | | | 32,637 | |
| | 30,064 | | | | | Ackermans & Van Haaren | | | 3,523 | |
| | 240,400 | | | * | | Acom Co Ltd | | | 819 | |
| | 50,790 | | | | | Aeon Credit Service Co Ltd | | | 1,362 | |
| | 20,000 | | | | | Aeon Credit Service M BHD | | | 90 | |
| | 883,265 | | | * | | Affiliated Managers Group, Inc | | | 191,562 | |
| | 730,825 | | | | | AFP Habitat S.A. | | | 968 | |
| | 1,759,278 | | | e | | African Bank Investments Ltd | | | 2,021 | |
COLLEGE RETIREMENT EQUITIES FUND - Stock Account
| | | | | | | | VALUE | |
| SHARES | | | | | COMPANY | | (000) | |
| | 180,769 | | | e | | AGF Management Ltd | | $ | 2,258 | |
| | 394,100 | | | * | | Aiful Corp | | | 1,651 | |
| | 35,056 | | | | | Aker ASA (A Shares) | | | 1,285 | |
| | 68,925 | | | e | | Alaris Royalty Corp | | | 1,938 | |
| | 62,458 | | | | | Altamir Amboise | | | 887 | |
| | 575,098 | | | * | | American Capital Ltd | | | 8,995 | |
| | 2,888,091 | | | | | American Express Co | | | 262,036 | |
| | 1,692,160 | | | | | Ameriprise Financial, Inc | | | 194,683 | |
| | 4,860,805 | | | | | AMMB Holdings BHD | | | 10,757 | |
| | 882,116 | | | | | Apollo Investment Corp | | | 7,480 | |
| | 364,280 | | | | | Apollo Management LP | | | 11,515 | |
| | 715,649 | | | | | ARA Asset Management Ltd | | | 1,056 | |
| | 510,307 | | | | | Ares Capital Corp | | | 9,068 | |
| | 53,350 | | | | | Artisan Partners Asset Management, Inc | | | 3,478 | |
| | 417,704 | | | | | Ashmore Group plc | | | 2,782 | |
| | 12,981 | | | *,m | | Asia Pacific Investment Partners Limited | | | 92 | |
| | 1,387,200 | | | | | Asia Plus Securities PCL | | | 147 | |
| | 6,685,000 | | | | | Asian Pay Television Trust | | | 3,927 | |
| | 134,200 | | | | | Asset Managers Co Ltd | | | 503 | |
| | 62,021 | | | | | Aurelius AG. | | | 2,520 | |
| | 194,549 | | | | | Australian Stock Exchange Ltd | | | 6,398 | |
| | 24,694 | | | | | Avanza AB | | | 802 | |
| | 277,287 | | | | | Ayala Corp | | | 3,245 | |
| | 2,215 | | | m | | Ayala Corp Preferred | | | 0 | ^ |
| | 336,101 | | | | | Azimut Holding S.p.A. | | | 9,170 | |
| | 5,332 | | | | | Bajaj Auto Finance Ltd | | | 136 | |
| | 189,787 | | | | | Banca Generali S.p.A | | | 5,873 | |
| | 75,306 | | | | | Banca IFIS S.p.A. | | | 1,339 | |
| | 319,925 | | | | | Banca Profilo S.p.A. | | | 88 | |
| | 35,786,417 | | | | | Bank of America Corp | | | 557,194 | |
| | 1,865,127 | | | | | Bank of New York Mellon Corp | | | 65,168 | |
| | 583,727 | | | | | BGC Partners, Inc (Class A) | | | 3,537 | |
| | 60,986 | | | | | BinckBank NV | | | 647 | |
| | 292,250 | | | | | BlackRock Kelso Capital Corp | | | 2,727 | |
| | 159,458 | | | | | BlackRock, Inc | | | 50,464 | |
| | 1,629,980 | | | | | Blackstone Group LP | | | 51,344 | |
| | 2,140,111 | | | | | BM&F Bovespa S.A. | | | 10,038 | |
| | 17,844,073 | | | | | Bolsa de Valores de Colombia | | | 207 | |
| | 612,700 | | | e | | Bolsa Mexicana de Valores S.A. de C.V. | | | 1,405 | |
| | 90,213 | | | e | | Bolsas y Mercados Espanoles | | | 3,435 | |
| | 31,677 | | | * | | Boursorama | | | 355 | |
| | 721,587 | | | * | | Brait S.A. | | | 3,607 | |
| | 392,846 | | | | | Brewin Dolphin Holdings plc | | | 1,984 | |
| | 192,560 | | | | | BT Investment Management Ltd | | | 992 | |
| | 85,021 | | | | | Bure Equity AB | | | 344 | |
| | 287,000 | | | | | Bursa Malaysia BHD | | | 722 | |
| | 101,031 | | | | | Calamos Asset Management, Inc (Class A) | | | 1,196 | |
| | 5,804 | | | | | California First National Bancorp | | | 88 | |
COLLEGE RETIREMENT EQUITIES FUND - Stock Account
| | | | | | | | VALUE | |
| SHARES | | | | | COMPANY | | (000) | |
| | 99,782 | | | e | | Canaccord Financial, Inc | | $ | 653 | |
| | 891,447 | | | | | Capital One Financial Corp | | | 68,294 | |
| | 1,293,300 | | | | | Capital Securities Corp | | | 481 | |
| | 56,206 | | | | | Capital Southwest Corp | | | 1,960 | |
| | 8,881 | | | e | | Capitala Finance Corp | | | 177 | |
| | 113,935 | | | e | | Cash America International, Inc | | | 4,364 | |
| | 113,793 | | | | | CBOE Holdings, Inc | | | 5,913 | |
| | 167,699 | | | * | | Cembra Money Bank AG. | | | 11,007 | |
| | 84,001 | | | | | Century Leasing System, Inc | | | 2,774 | |
| | 222,007 | | | | | CETIP S.A.-Balcao Organizado de Ativos e Derivativos | | | 2,277 | |
| | 868,070 | | | | | Chailease Holding Co Ltd | | | 2,292 | |
| | 1,500,119 | | | | | Challenger Financial Services Group Ltd | | | 8,331 | |
| | 2,924,805 | | | | | Charles Schwab Corp | | | 76,045 | |
| | 1,130,000 | | | | | China Bills Finance Corp | | | 444 | |
| | 3,291,285 | | | * | | China Cinda Asset Management Co Ltd | | | 2,054 | |
| | 1,233,200 | | | | | China Everbright Ltd | | | 1,956 | |
| | 3,700,000 | | | *,e | | China Galaxy Securities Co Ltd | | | 3,233 | |
| | 144,665 | | | e | | China Merchants China Direct Investments Ltd | | | 204 | |
| | 3,236 | | | * | | Cholamandalam DBS Finance Ltd | | | 13 | |
| | 209,627 | | | e | | CI Financial Corp | | | 6,976 | |
| | 731,895 | | | * | | Citadel Capital Corp | | | 369 | |
| | 1,657,200 | | | e | | CITIC Securities Co Ltd | | | 4,538 | |
| | 16,578,197 | | | | | Citigroup, Inc | | | 863,890 | |
| | 368,000 | | | | | Close Brothers Group plc | | | 8,380 | |
| | 257,490 | | | | | CME Group, Inc | | | 20,203 | |
| | 61,080 | | | e | | Cohen & Steers, Inc | | | 2,447 | |
| | 4,093,600 | | | e | | Compartamos SAB de C.V. | | | 7,656 | |
| | 961,275 | | | * | | Concord Securities Corp | | | 272 | |
| | 61,146 | | | * | | Consumer Portfolio Services, Inc | | | 574 | |
| | 540,310 | | | | | Coronation Fund Managers Ltd | | | 4,124 | |
| | 25,734 | | | | | Corp Financiera Alba | | | 1,505 | |
| | 79,240 | | | | | Corp Financiera Colombiana S.A. | | | 1,626 | |
| | 359,935 | | | * | | Cowen Group, Inc | | | 1,407 | |
| | 36,865 | | | * | | Credit Acceptance Corp | | | 4,792 | |
| | 1,953,600 | | | | | Credit China Holdings Ltd | | | 169 | |
| | 70,468 | | | | | Credit Saison Co Ltd | | | 1,858 | |
| | 2,850,702 | | | | | Credit Suisse Group | | | 87,982 | |
| | 905,000 | | | | | Credito Real SAB de C.V. | | | 1,395 | |
| | 187,631 | | | | | Daewoo Securities Co Ltd | | | 1,587 | |
| | 64,400 | | | | | Daishin Securities Co Ltd | | | 480 | |
| | 42,120 | | | | | Daishin Securities Co Ltd PF | | | 223 | |
| | 3,596,135 | | | | | Daiwa Securities Group, Inc | | | 36,017 | |
| | 130,557 | | | * | | DeA Capital S.p.A. | | | 228 | |
| | 18,353 | | | | | Deerfield Capital Corp | | | 143 | |
| | 1,585,790 | | | | | Deutsche Bank AG. | | | 76,184 | |
| | 20,800 | | | * | | Deutsche Beteiligungs AG. | | | 593 | |
| | 157,404 | | | | | Deutsche Boerse AG. | | | 13,045 | |
COLLEGE RETIREMENT EQUITIES FUND - Stock Account
| | | | | | | | VALUE | |
| SHARES | | | | | COMPANY | | (000) | |
| | 10,700 | | | e | | Diamond Hill Investment Group, Inc | | $ | 1,266 | |
| | 3,025,984 | | | | | Discover Financial Services | | | 169,304 | |
| | 152,734 | | | * | | Dollar Financial Corp | | | 1,749 | |
| | 48,713 | | | * | | Dundee Corp | | | 857 | |
| | 483,785 | | | * | | E*Trade Financial Corp | | | 9,502 | |
| | 30,650 | | | * | | East Capital Explorer AB | | | 297 | |
| | 323,623 | | | | | Eaton Vance Corp | | | 13,848 | |
| | 3,322 | | | | | EFG Financial Products Holding AG. | | | 398 | |
| | 74,481 | | | | | EFG International | | | 1,065 | |
| | 382,917 | | | | | Egypt Kuwait Holding Co | | | 351 | |
| | 804,992 | | | * | | Egyptian Financial Group-Hermes Holding | | | 1,024 | |
| | 199,700 | | | * | | Element Financial Corp | | | 2,632 | |
| | 85,630 | | | *,e | | Encore Capital Group, Inc | | | 4,304 | |
| | 48,655 | | | | | Eurazeo | | | 3,816 | |
| | 164,603 | | | | | Evercore Partners, Inc (Class A) | | | 9,840 | |
| | 273,345 | | | | | Exor S.p.A. | | | 10,864 | |
| | 203,791 | | | * | | Ezcorp, Inc (Class A) | | | 2,382 | |
| | 507,342 | | | | | F&C Asset Management plc | | | 773 | |
| | 1,989,200 | | | | | Far East Horizon Ltd | | | 1,703 | |
| | 40,055 | | | * | | FBR & Co | | | 1,057 | |
| | 95,314 | | | e | | Federated Investors, Inc (Class B) | | | 2,745 | |
| | 49,993 | | | e | | Fidus Investment Corp | | | 1,087 | |
| | 531,659 | | | | | Fifth Street Finance Corp | | | 4,918 | |
| | 266,406 | | | | | Financial Engines, Inc | | | 18,510 | |
| | 14,200 | | | e | | Financial Products Group Co Ltd | | | 143 | |
| | 104,861 | | | * | | First Cash Financial Services, Inc | | | 6,485 | |
| | 29,631 | | | *,e | | First Marblehead Corp | | | 219 | |
| | 2,802,785 | | | e | | First Pacific Co | | | 3,196 | |
| | 34,049 | | | | | Firsthand Technology Value Fund, Inc | | | 789 | |
| | 5,987,363 | | | | | FirstRand Ltd | | | 20,518 | |
| | 256,583 | | | | | FlexiGroup Ltd | | | 1,027 | |
| | 133,250 | | | | | Fonterra Shareholders’ Fund | | | 636 | |
| | 459,493 | | | | | Franklin Resources, Inc | | | 26,527 | |
| | 62,785 | | | | | Friedman Billings Ramsey Group, Inc (Class A) | | | 1,657 | |
| | 11,073,834 | | | | | Fubon Financial Holding Co Ltd | | | 16,241 | |
| | 21,548,634 | | | | | Fuhwa Financial Holdings Co Ltd | | | 12,898 | |
| | 39,200 | | | | | Fuyo General Lease Co Ltd | | | 1,534 | |
| | 121,189 | | | e | | FXCM, Inc | | | 2,162 | |
| | 40,888 | | | | | Gain Capital Holdings, Inc | | | 307 | |
| | 25,053 | | | | | GAMCO Investors, Inc (Class A) | | | 2,179 | |
| | 19,828 | | | e | | Garrison Capital, Inc | | | 275 | |
| | 11,700 | | | | | GCA Savvian Group Corp | | | 113 | |
| | 277,809 | | | | | GFI Group, Inc | | | 1,086 | |
| | 26,398 | | | | | Gimv NV | | | 1,380 | |
| | 96,628 | | | | | Gladstone Capital Corp | | | 928 | |
| | 101,890 | | | | | Gladstone Investment Corp | | | 821 | |
| | 188,722 | | | * | | Global Infratech & Finance Ltd | | | 281 | |
| | 72,195 | | | | | Gluskin Sheff + Associates, Inc | | | 1,747 | |
COLLEGE RETIREMENT EQUITIES FUND - Stock Account
| | | | | | | | VALUE | |
| SHARES | | | | | COMPANY | | (000) | |
| | 72,466 | | | | | GMP Capital, Inc | | $ | 479 | |
| | 2,745,432 | | | | | Goldman Sachs Group, Inc | | | 486,655 | |
| | 135,921 | | | e | | Golub Capital BDC, Inc | | | 2,597 | |
| | 104,781 | | | * | | Green Dot Corp | | | 2,635 | |
| | 98,407 | | | | | Greenhill & Co, Inc | | | 5,702 | |
| | 70,545 | | | | | Groupe Bruxelles Lambert S.A. | | | 6,480 | |
| | 883 | | | *,m | | Groupe Bruxelles Lambert S.A. (Strip VVPR) | | | 0 | ^ |
| | 12,109 | | | | | Grupo de Inversiones Suramericana S.A. | | | 219 | |
| | 72,474 | | | *,e | | GSV Capital Corp | | | 876 | |
| | 185,540 | | | | | GT Capital Holdings, Inc | | | 3,230 | |
| | 568,000 | | | e | | Guotai Junan International Hol | | | 290 | |
| | 1,374,116 | | | | | Haci Omer Sabanci Holding AS | | | 5,529 | |
| | 3,316,400 | | | e | | Haitong Securities Co Ltd | | | 5,800 | |
| | 6,863 | | | | | Hankook Tire Worldwide Co Ltd | | | 144 | |
| | 84,290 | | | * | | Hanwha Securities Co | | | 272 | |
| | 410,872 | | | | | Hargreaves Lansdown plc | | | 9,229 | |
| | 104,233 | | | | | Hellenic Exchanges S.A. | | | 1,148 | |
| | 2,373,754 | | | | | Henderson Group plc | | | 9,020 | |
| | 243,288 | | | e | | Hercules Technology Growth Capital, Inc | | | 3,990 | |
| | 209,694 | | | * | | HFF, Inc (Class A) | | | 5,630 | |
| | 144,100 | | | | | Hitachi Capital Corp | | | 4,203 | |
| | 8,930 | | | | | HMC Investment Securities Co Ltd | | | 83 | |
| | 858,686 | | | | | Hong Kong Exchanges and Clearing Ltd | | | 14,353 | |
| | 33,366 | | | | | Horizon Technology Finance Corp | | | 474 | |
| | 112,767 | | | | | Hyundai Securities Co | | | 626 | |
| | 79,400 | | | | | IBJ Leasing Co Ltd | | | 2,308 | |
| | 125,719 | | | | | ICAP plc | | | 942 | |
| | 143,300 | | | | | Ichiyoshi Securities Co Ltd | | | 2,399 | |
| | 1,922,586 | | | * | | IFCI Ltd | | | 801 | |
| | 862,507 | | | | | IG Group Holdings plc | | | 8,812 | |
| | 241,253 | | | e | | IGM Financial, Inc | | | 12,739 | |
| | 105,440 | | | | | IMF Australia Ltd | | | 165 | |
| | 68,224 | | | *,e | | Imperial Holdings, Inc | | | 446 | |
| | 167,436 | | | | | India Infoline Ltd | | | 169 | |
| | 365,437 | | | | | Indiabulls Housing Finance Ltd | | | 1,409 | |
| | 18,736 | | | | | Indiabulls Securities Ltd | | | 6 | |
| | 28,635 | | | | | Industrivarden AB | | | 545 | |
| | 128,704 | | | | | Infrastructure Development Finance Co Ltd | | | 229 | |
| | 15,488,947 | | | * | | ING Groep NV | | | 216,358 | |
| | 543,000 | | | *,e | | ING Groep NV (ADR) | | | 7,607 | |
| | 249,498 | | | | | ING US, Inc | | | 8,770 | |
| | 95,030 | | | | | Interactive Brokers Group, Inc (Class A) | | | 2,313 | |
| | 179,983 | | | *,m | | Interbolsa S.A. | | | 0 | ^ |
| | 515,895 | | | | | IntercontinentalExchange Group, Inc | | | 116,035 | |
| | 940,863 | | | | | Intermediate Capital Group plc | | | 6,560 | |
| | 54,438 | | | *,e | | International Assets Holding Corp | | | 1,009 | |
| | 324,249 | | | | | International Personal Finance plc | | | 2,682 | |
| | 148,165 | | | * | | Internet Capital Group, Inc | | | 2,760 | |
| | 101,596 | | | | | Inversiones La Construccion S.A. | | | 1,435 | |
COLLEGE RETIREMENT EQUITIES FUND - Stock Account
| | | | | | | | VALUE | |
| SHARES | | | | | COMPANY | | (000) | |
| | 1,516,362 | | | | | Invesco Ltd | | $ | 55,196 | |
| | 268,564 | | | | | Investec Ltd | | | 1,911 | |
| | 143,803 | | | | | Investec plc | | | 1,044 | |
| | 147,873 | | | * | | Investment Technology Group, Inc | | | 3,040 | |
| | 701,691 | | | | | Investor AB (B Shares) | | | 24,183 | |
| | 269,921 | | | | | IOOF Holdings Ltd | | | 2,165 | |
| | 14,984 | | | * | | Is Finansal Kiralama AS. | | | 7 | |
| | 180,117 | | | | | Is Yatirim Menkul Degerler AS | | | 107 | |
| | 47,319 | | | e | | iShares China Large-Cap ETF | | | 1,815 | |
| | 515,222 | | | e | | iShares MSCI Canada Index Fund | | | 15,024 | |
| | 1,020,783 | | | | | iShares MSCI EAFE Index Fund | | | 68,454 | |
| | 469,687 | | | | | iShares MSCI Emerging Markets | | | 19,619 | |
| | 152,915 | | | e | | iShares Russell 2000 Index Fund | | | 17,633 | |
| | 19,300 | | | * | | Iwai Securities Co Ltd | | | 273 | |
| | 74,000 | | | e | | J Trust Co Ltd | | | 1,058 | |
| | 160,000 | | | | | Jaccs Co Ltd | | | 767 | |
| | 88,817 | | | | | Jafco Co Ltd | | | 4,848 | |
| | 589,266 | | | e | | Janus Capital Group, Inc | | | 7,289 | |
| | 1,261,200 | | | | | Japan Securities Finance Co Ltd | | | 9,821 | |
| | 25,896 | | | * | | JGWPT Holdings, Inc | | | 450 | |
| | 2,324,930 | | | | | Jih Sun Financial Holdings Co Ltd | | | 676 | |
| | 54,833 | | | | | JMP Group, Inc | | | 406 | |
| | 14,500,269 | | | | | JPMorgan Chase & Co | | | 847,976 | |
| | 236,561 | | | | | JSE Ltd | | | 2,023 | |
| | 142,510 | | | | | Julius Baer Group Ltd | | | 6,848 | |
| | 266,296 | | | | | Julius Baer Holding AG. | | | 5,185 | |
| | 665,958 | | | | | Jupiter Investment Management Group Ltd | | | 4,253 | |
| | 1,938,000 | | | e | | K1 Ventures Ltd | | | 297 | |
| | 93,800 | | | | | kabu.com Securities Co Ltd | | | 545 | |
| | 9,920,000 | | | * | | Kai Yuan Holdings Ltd | | | 257 | |
| | 507,397 | | | * | | Kailash Auto Finance Ltd | | | 324 | |
| | 41,429 | | | * | | KBC Ancora | | | 1,499 | |
| | 103,211 | | | e | | KCAP Financial, Inc | | | 833 | |
| | 251,369 | | | * | | KCG Holdings, Inc | | | 3,006 | |
| | 494,092 | | | | | Kinnevik Investment AB (Series B) | | | 22,907 | |
| | 20,933 | | | | | KIWOOM Securities Co Ltd | | | 1,004 | |
| | 43,840 | | | | | Korea Investment Holdings Co Ltd | | | 1,697 | |
| | 297,000 | | | e | | Kosei Securities Co Ltd | | | 843 | |
| | 463,480 | | | * | | Kotak Mahindra Bank Ltd | | | 5,471 | |
| | 48,900 | | | | | Krungthai Card Pcl | | | 44 | |
| | 82,410 | | | * | | KTB Securities Co Ltd | | | 170 | |
| | 47,580 | | | | | Kyobo Securities Co | | | 199 | |
| | 21,900 | | | | | Kyokuto Securities Co Ltd | | | 445 | |
| | 323,895 | | | * | | Ladenburg Thalmann Financial Services, Inc | | | 1,014 | |
| | 255,643 | | | | | Lazard Ltd (Class A) | | | 11,586 | |
| | 876,004 | | | e | | Legg Mason, Inc | | | 38,089 | |
| | 572,895 | | | | | Leucadia National Corp | | | 16,236 | |
| | 54,186 | | | | | London Stock Exchange Group plc | | | 1,559 | |
COLLEGE RETIREMENT EQUITIES FUND - Stock Account
| | | | | | | | VALUE | |
| SHARES | | | | | COMPANY | | (000) | |
| | 121,147 | | | e | | LPL Financial Holdings, Inc | | $ | 5,698 | |
| | 47,919 | | | | | Lundbergs AB (B Shares) | | | 2,032 | |
| | 297,238 | | | | | Macquarie Group Ltd | | | 14,589 | |
| | 118,269 | | | | | Magellan Financial Group Ltd | | | 1,141 | |
| | 221,607 | | | | | Mahindra & Mahindra Financial Services Ltd | | | 1,152 | |
| | 147,385 | | | e | | Main Street Capital Corp | | | 4,818 | |
| | 13,700,516 | | | | | Man Group plc | | | 19,354 | |
| | 441,436 | | | | | Manappuram General Finance & Leasing Ltd | | | 112 | |
| | 60,706 | | | | | Manning & Napier, Inc | | | 1,071 | |
| | 18,509 | | | * | | Marcus & Millichap, Inc | | | 276 | |
| | 238,000 | | | * | | Marfin Investment Group S.A | | | 125 | |
| | 190,420 | | | | | MarketAxess Holdings, Inc | | | 12,733 | |
| | 32,761 | | | | | Marlin Business Services Corp | | | 826 | |
| | 210,600 | | | | | Marusan Securities Co Ltd | | | 1,967 | |
| | 1,973,000 | | | | | Masterlink Securities Corp | | | 686 | |
| | 1,434,300 | | | | | Matsui Securities Co Ltd | | | 18,422 | |
| | 283,770 | | | | | MCG Capital Corp | | | 1,249 | |
| | 74,424 | | | | | Medallion Financial Corp | | | 1,068 | |
| | 5,273,228 | | | * | | Mediobanca S.p.A. | | | 46,113 | |
| | 144,694 | | | | | Medley Capital Corp | | | 2,004 | |
| | 149,004 | | | | | Meritz finance Holdings Co Ltd | | | 959 | |
| | 619,540 | | | | | Meritz Securities Co Ltd | | | 1,029 | |
| | 11,039,000 | | | | | Metro Pacific Investments Corp | | | 1,078 | |
| | 26,251 | | | | | Mirae Asset Securities Co Ltd | | | 957 | |
| | 258,000 | | | | | Mito Securities Co Ltd | | | 1,265 | |
| | 762,260 | | | | | Mitsubishi UFJ Lease & Finance Co Ltd | | | 4,686 | |
| | 67,199 | | | | | MLP AG. | | | 482 | |
| | 697,200 | | | | | Monex Beans Holdings, Inc | | | 3,130 | |
| | 1,174,657 | | | | | Moody’s Corp | | | 92,175 | |
| | 6,392,074 | | | | | Morgan Stanley | | | 200,455 | |
| | 326,500 | | | * | | MPHB Capital BHD | | | 167 | |
| | 243,780 | | | * | | MSCI, Inc (Class A) | | | 10,658 | |
| | 1,531,700 | | | * | | Mulpha International BHD | | | 192 | |
| | 1,164,600 | | | | | Multi-Purpose Holdings BHD | | | 1,124 | |
| | 96,728 | | | | | MVC Capital, Inc | | | 1,306 | |
| | 251,553 | | | | | Nasdaq Stock Market, Inc | | | 10,012 | |
| | 89,888 | | | | | Nelnet, Inc (Class A) | | | 3,788 | |
| | 160,737 | | | e | | New Mountain Finance Corp | | | 2,417 | |
| | 104,214 | | | * | | NewStar Financial, Inc | | | 1,852 | |
| | 86,053 | | | | | NGP Capital Resources Co | | | 643 | |
| | 76,683 | | | | | NH Investment & Securities Co Ltd | | | 362 | |
| | 4,010 | | | | | NICE Holdings Co Ltd | | | 45 | |
| | 40,312 | | | | | Nicholas Financial, Inc | | | 634 | |
| | 3,149,172 | | | | | Nomura Holdings, Inc | | | 24,336 | |
| | 156,375 | | | e | | Nordnet AB (Series B) | | | 632 | |
| | 185,576 | | | | | Northern Trust Corp | | | 11,485 | |
| | 4,867,866 | | | | | NZX Ltd | | | 4,969 | |
| | 36,341 | | | | | Oaktree Capital Group LLC | | | 2,138 | |
| | 364,638 | | | | | Okasan Holdings, Inc | | | 3,727 | |
COLLEGE RETIREMENT EQUITIES FUND - Stock Account
| | | | | | | | VALUE | |
| SHARES | | | | | COMPANY | | (000) | |
| | 94,420 | | | | | OKO Bank (Class A) | | $ | 1,893 | |
| | 91,641 | | | | | Onex Corp | | | 4,948 | |
| | 40,528 | | | | | Oppenheimer Holdings, Inc | | | 1,004 | |
| | 18,269 | | | * | | Oresund Investment AB | | | 373 | |
| | 351,000 | | | * | | Orient Corp | | | 824 | |
| | 4,431,100 | | | * | | ORIX Corp | | | 77,863 | |
| | 234,800 | | | e | | Osaka Securities Exchange Co Ltd | | | 6,674 | |
| | 720,575 | | | | | OSK Holdings BHD | | | 363 | |
| | 9,568 | | | | | Pargesa Holding S.A. | | | 771 | |
| | 3,559 | | | | | Partners Group | | | 949 | |
| | 54,754 | | | | | PennantPark Floating Rate Capital Ltd | | | 752 | |
| | 262,507 | | | | | PennantPark Investment Corp | | | 3,045 | |
| | 517,000 | | | *,m | | Peregrine Investment Holdings | | | 0 | ^ |
| | 111,258 | | | | | Perpetual Trustees Australia Ltd | | | 4,811 | |
| | 223,552 | | | * | | PHH Corp | | | 5,443 | |
| | 75,264 | | | | | Philippine Stock Exchange, Inc | | | 509 | |
| | 102,149 | | | * | | Pico Holdings, Inc | | | 2,361 | |
| | 378,585 | | | * | | Pioneers Holding | | | 289 | |
| | 67,295 | | | *,e | | Piper Jaffray Cos | | | 2,661 | |
| | 249,887 | | | | | Platinum Asset Mangement Ltd | | | 1,543 | |
| | 18,600 | | | | | Pocket Card Co Ltd | | | 153 | |
| | 167,106 | | | * | | Portfolio Recovery Associates, Inc | | | 8,830 | |
| | 557,613 | | | | | Power Finance Corp Ltd | | | 1,508 | |
| | 66,000 | | | e | | PowerShares QQQ Trust Series | | | 5,805 | |
| | 1,686,509 | | | | | President Securities Corp | | | 1,003 | |
| | 1,084,680 | | | e | | Prospect Capital Corp | | | 12,170 | |
| | 201,954 | | | | | Provident Financial plc | | | 5,442 | |
| | 45,802 | | | e | | Pzena Investment Management, Inc (Class A) | | | 539 | |
| | 5,134 | | | | | Rathbone Brothers | | | 137 | |
| | 226,916 | | | e | | Ratos AB (B Shares) | | | 2,052 | |
| | 721,072 | | | | | Raymond James Financial, Inc | | | 37,633 | |
| | 2,324 | | | e | | RCS Capital Corp (Class A) | | | 43 | |
| | 38,949 | | | * | | Regional Management Corp | | | 1,322 | |
| | 322,221 | | | * | | Reliance Capital Ltd | | | 1,889 | |
| | 564,519 | | | | | Remgro Ltd | | | 11,198 | |
| | 38,266 | | | | | Resource America, Inc (Class A) | | | 358 | |
| | 99,247 | | | * | | RHJ International | | | 504 | |
| | 17,700 | | | | | Ricoh Leasing Co Ltd | | | 524 | |
| | 789,846 | | | | | RMB Holdings Ltd | | | 3,648 | |
| | 560,939 | | | | | Rural Electrification Corp Ltd | | | 2,004 | |
| | 81,413 | | | *,e | | Safeguard Scientifics, Inc | | | 1,636 | |
| | 132,589 | | | | | Samsung Card Co | | | 4,703 | |
| | 71,791 | | | | | Samsung Securities Co Ltd | | | 3,002 | |
| | 300,100 | | | e | | Sawada Holdings Co Ltd | | | 3,670 | |
| | 105,127 | | | | | SBI Holdings, Inc | | | 1,596 | |
| | 203,938 | | | | | Schroders plc | | | 8,796 | |
| | 26,309 | | | * | | SE Investments Ltd | | | 166 | |
| | 679,298 | | | | | SEI Investments Co | | | 23,592 | |
COLLEGE RETIREMENT EQUITIES FUND - Stock Account
| | | | | | | | VALUE | |
| SHARES | | | | | COMPANY | | (000) | |
| | 5 | | | *,m | | SFCG Co Ltd | | $ | 0 | ^ |
| | 199,739 | | | | | Shriram Transport Finance Co Ltd | | | 2,175 | |
| | 15,989 | | | | | Silvercrest Asset Management Group, Inc | | | 273 | |
| | 1,898,356 | | | | | Singapore Exchange Ltd | | | 10,947 | |
| | 126,570 | | | * | | SK Securities Co Ltd | | | 85 | |
| | 80,955 | | | * | | SKS Microfinance Pvt Ltd | | | 249 | |
| | 1,459,181 | | | | | SLM Corp | | | 38,347 | |
| | 768,475 | | | *,e,m | | SNS Reaal | | | 11 | |
| | 172,074 | | | | | Solar Capital Ltd | | | 3,880 | |
| | 49,608 | | | | | Solar Senior Capital Ltd | | | 904 | |
| | 124,900 | | | *,e | | Sparx Group Co Ltd | | | 356 | |
| | 91,693 | | | | | SPDR S&P MidCap 400 ETF Trust | | | 22,391 | |
| | 972,221 | | | | | SPDR Trust Series 1 | | | 179,540 | |
| | 83,712 | | | *,e | | Springleaf Holdings, Inc | | | 2,116 | |
| | 185,087 | | | | | Sprott, Inc | | | 456 | |
| | 409,246 | | | | | SREI Infrastructure Finance Ltd | | | 157 | |
| | 4,332,451 | | | | | State Street Corp | | | 317,959 | |
| | 48,263 | | | e | | Stellus Capital Investment Corp | | | 722 | |
| | 252,742 | | | * | | Stifel Financial Corp | | | 12,111 | |
| | 5,354 | | | | | Sundaram Finance Ltd | | | 54 | |
| | 546,623 | | | | | Suramericana de Inversiones S.A. | | | 9,545 | |
| | 10,731 | | | | | Swissquote Group Holding S.A. | | | 471 | |
| | 118,880 | | | * | | SWS Group, Inc | | | 723 | |
| | 1,267,090 | | | | | T Rowe Price Group, Inc | | | 106,144 | |
| | 451,088 | | | e | | Tai Fook Securities Group Ltd | | | 232 | |
| | 416,000 | | | | | Taiwan Acceptance Corp | | | 1,090 | |
| | 170,000 | | | | | Takagi Securities Co Ltd | | | 665 | |
| | 124,321 | | | | | TCP Capital Corp | | | 2,086 | |
| | 383,144 | | | | | TD Ameritrade Holding Corp | | | 11,740 | |
| | 239,511 | | | | | Tetragon Financial Group Ltd | | | 2,397 | |
| | 126,645 | | | | | THL Credit, Inc | | | 2,088 | |
| | 208,081 | | | e | | TICC Capital Corp | | | 2,152 | |
| | 22,000 | | | e | | TMX Group Ltd | | | 1,057 | |
| | 426,380 | | | | | Tokai Tokyo Securities Co Ltd | | | 4,125 | |
| | 61,642 | | | | | Tong Yang Investment Bank | | | 147 | |
| | 272,000 | | | | | Toyo Securities Co Ltd | | | 988 | |
| | 125,333 | | | | | Transpac Industrial Holdings Ltd | | | 171 | |
| | 107,010 | | | | | Triangle Capital Corp | | | 2,959 | |
| | 90,800 | | | | | Tricon Capital Group, Inc | | | 659 | |
| | 286,765 | | | | | Tullett Prebon plc | | | 1,792 | |
| | 10,274,465 | | | | | UBS AG. | | | 196,729 | |
| | 957,565 | | | | | UOB-Kay Hian Holdings Ltd | | | 1,256 | |
| | 142,337 | | | *,e | | Uranium Participation Corp | | | 757 | |
| | 897,000 | | | e | | Value Partners Group Ltd | | | 696 | |
| | 37,298 | | | * | | Virtus Investment Partners, Inc | | | 7,461 | |
| | 30,606 | | | | | Vontobel Holding AG. | | | 1,268 | |
| | 217,782 | | | *,e | | Vostok Nafta Investment Ltd (ADR) | | | 1,820 | |
| | 182,992 | | | | | Waddell & Reed Financial, Inc (Class A) | | | 11,916 | |
| | 142,675 | | | * | | Walter Investment Management Corp | | | 5,045 | |
COLLEGE RETIREMENT EQUITIES FUND - Stock Account
| | | | | | | | VALUE | |
| SHARES | | | | | COMPANY | | (000) | |
| | 56,492 | | | | | Warsaw Stock Exchange | | $ | 774 | |
| | 3,677,611 | | | | | Waterland Financial Holdings | | | 1,234 | |
| | 69,334 | | | | | Wendel | | | 10,106 | |
| | 25,607 | | | | | Westwood Holdings Group, Inc | | | 1,585 | |
| | 23,888 | | | e | | WhiteHorse Finance, Inc | | | 361 | |
| | 602,158 | | | * | | WisdomTree Investments, Inc | | | 10,664 | |
| | 115,000 | | | e | | WisdomTree Japan Hedged Equity Fund | | | 5,847 | |
| | 16,707 | | | | | Woori Financial Co Ltd | | | 355 | |
| | 143,363 | | | | | Woori Investment & Securities Co Ltd | | | 1,306 | |
| | 29,331 | | | *,e | | World Acceptance Corp | | | 2,567 | |
| | 618,554 | | | | | Zeder Investments Ltd | | | 254 | |
| | 53,000 | | | | | Zenkoku Hosho Co Ltd | | | 2,326 | |
| | | | | | | TOTAL DIVERSIFIED FINANCIALS | | | 7,221,751 | |
| | | | | | | | | | | |
| ENERGY - 8.6% | | | | |
| | 264,204 | | | *,e | | Abraxas Petroleum Corp | | | 867 | |
| | 1,563,845 | | | | | Acergy S.A. | | | 29,980 | |
| | 9,772 | | | | | Adams Resources & Energy, Inc | | | 669 | |
| | 17,211,727 | | | | | Adaro Energy Tbk | | | 1,546 | |
| | 255,207 | | | * | | Advantage Oil & Gas Ltd | | | 1,108 | |
| | 9,304,150 | | | * | | Afren plc | | | 26,098 | |
| | 19,542 | | | | | Aker Kvaerner ASA | | | 350 | |
| | 273,100 | | | | | Alam Maritim Resources BHD | | | 131 | |
| | 118,021 | | | | | Alliance Holdings GP LP | | | 6,877 | |
| | 132,735 | | | e | | Alon USA Energy, Inc | | | 2,195 | |
| | 977,318 | | | *,e | | Alpha Natural Resources, Inc | | | 6,978 | |
| | 149,885 | | | e | | AltaGas Income Trust | | | 5,753 | |
| | 170,800 | | | * | | Alvopetro Energy Ltd | | | 198 | |
| | 170,056 | | | | | AMEC plc | | | 3,070 | |
| | 2,054,149 | | | *,e | | Amerisur Resources plc | | | 2,031 | |
| | 89,406 | | | *,e | | Amyris Biotechnologies, Inc | | | 473 | |
| | 2,771,369 | | | | | Anadarko Petroleum Corp | | | 219,825 | |
| | 237,594 | | | | | Anglo Pacific Group plc | | | 725 | |
| | 500,803 | | | * | | Antero Resources Corp | | | 31,771 | |
| | 1,276,000 | | | e | | Anton Oilfield Services Group | | | 779 | |
| | 143,600 | | | | | AOC Holdings, Inc | | | 459 | |
| | 844,969 | | | | | Apache Corp | | | 72,617 | |
| | 28,703 | | | *,e | | APCO Argentina, Inc | | | 447 | |
| | 124,466 | | | *,e | | Approach Resources, Inc | | | 2,401 | |
| | 236,538 | | | *,e | | Aquila Resources Ltd | | | 488 | |
| | 1,465,807 | | | e | | ARC Energy Trust | | | 40,804 | |
| | 838,400 | | | e | | Arch Coal, Inc | | | 3,731 | |
| | 803,023 | | | *,e | | Archer Ltd | | | 662 | |
| | 723,450 | | | *,e | | Athabasca Oil Corp | | | 4,413 | |
| | 118,639 | | | * | | Athlon Energy, Inc | | | 3,589 | |
| | 194,191 | | | * | | Atwood Oceanics, Inc | | | 10,368 | |
| | 472,198 | | | * | | Aurora Oil and Gas Ltd | | | 1,278 | |
| | 1,450,354 | | | * | | Australian Worldwide Exploration Ltd | | | 1,737 | |
COLLEGE RETIREMENT EQUITIES FUND - Stock Account
| | | | | | | | VALUE | |
| SHARES | | | | | COMPANY | | (000) | |
| | 2,031,604 | | | | | Baker Hughes, Inc | | $ | 112,266 | |
| | 266,700 | | | | | Bangchak Petroleum PCL | | | 228 | |
| | 734,101 | | | * | | Bankers Petroleum Ltd | | | 3,020 | |
| | 1,236,000 | | | | | Banpu PCL | | | 1,140 | |
| | 120,477 | | | * | | Basic Energy Services, Inc | | | 1,901 | |
| | 136,169 | | | e | | Baytex Energy Trust | | | 5,338 | |
| | 3,673,888 | | | | | Beach Petroleum Ltd | | | 4,704 | |
| | 414,832 | | | * | | Bellatrix Exploration Ltd | | | 3,050 | |
| | 4,726,099 | | | | | BG Group plc | | | 101,698 | |
| | 389,070 | | | | | Bharat Petroleum Corp Ltd | | | 2,190 | |
| | 179,490 | | | *,e | | Bill Barrett Corp | | | 4,807 | |
| | 117,699 | | | * | | Birchcliff Energy Ltd | | | 806 | |
| | 437,200 | | | * | | BlackPearl Resources, Inc | | | 934 | |
| | 34,646 | | | | | Bolt Technology Corp | | | 763 | |
| | 95,570 | | | * | | Bonanza Creek Energy, Inc | | | 4,154 | |
| | 205,600 | | | e | | Bonavista Energy Trust | | | 2,694 | |
| | 27,826 | | | e | | Bonterra Oil & Gas Ltd | | | 1,418 | |
| | 108,684 | | | e | | Bourbon S.A. | | | 2,992 | |
| | 574,238 | | | | | Boustead Singapore Ltd | | | 770 | |
| | 321,388 | | | * | | BowLeven plc | | | 203 | |
| | 15,869,448 | | | | | BP plc | | | 128,608 | |
| | 1,389,481 | | | | | BP plc (ADR) | | | 67,543 | |
| | 423,970 | | | *,e | | BPZ Energy, Inc | | | 772 | |
| | 3,923,000 | | | *,e | | Brightoil Petroleum Holdings Ltd | | | 1,079 | |
| | 143,521 | | | | | Bristow Group, Inc | | | 10,773 | |
| | 1,896,000 | | | | | Bumi Armada BHD | | | 2,333 | |
| | 65,049 | | | * | | BUMI plc | | | 247 | |
| | 274,423 | | | *,e | | Buru Energy Ltd | | | 430 | |
| | 1,090,382 | | | | | BW Offshore Ltd | | | 1,305 | |
| | 177,891 | | | *,e | | C&J Energy Services, Inc | | | 4,109 | |
| | 2,901,688 | | | | | Cabot Oil & Gas Corp | | | 112,469 | |
| | 758,179 | | | * | | Cairn Energy plc | | | 3,390 | |
| | 1,246,536 | | | | | Cairn India Ltd | | | 6,532 | |
| | 358,857 | | | *,e | | Cal Dive International, Inc | | | 721 | |
| | 66,643 | | | | | Calfrac Well Services Ltd | | | 1,945 | |
| | 148,486 | | | * | | Callon Petroleum Co | | | 970 | |
| | 16,689 | | | | | Caltex Australia Ltd | | | 300 | |
| | 321,457 | | | e | | Cameco Corp | | | 6,670 | |
| | 325,591 | | | * | | Cameron International Corp | | | 19,382 | |
| | 76,200 | | | * | | Canacol Energy Ltd | | | 511 | |
| | 69,200 | | | e | | Canadian Energy Services & Technology Corp | | | 1,506 | |
| | 2,308,031 | | | | | Canadian Natural Resources Ltd (Canada) | | | 78,090 | |
| | 1,343,784 | | | | | Canadian Oil Sands Trust | | | 25,275 | |
| | 172,959 | | | e | | Canyon Services Group, Inc | | | 1,957 | |
| | 310,000 | | | | | Capital Product Partners LP | | | 3,246 | |
| | 70,623 | | | e | | CARBO Ceramics, Inc | | | 8,230 | |
| | 150,741 | | | * | | Carrizo Oil & Gas, Inc | | | 6,749 | |
| | 28,769 | | | | | CAT Oil AG. | | | 805 | |
COLLEGE RETIREMENT EQUITIES FUND - Stock Account
| | | | | | | | VALUE | |
| SHARES | | | | | COMPANY | | (000) | |
| | 1,150,179 | | | e | | Cenovus Energy, Inc | | $ | 32,953 | |
| | 593,803 | | | e | | Cenovus Energy, Inc (Toronto) | | | 16,994 | |
| | 137,400 | | | * | | Cequence Energy Ltd | | | 232 | |
| | 2,058,310 | | | * | | Cheniere Energy, Inc | | | 88,754 | |
| | 1,821,160 | | | | | Chesapeake Energy Corp | | | 49,426 | |
| | 7,851,376 | | | | | Chevron Corp | | | 980,715 | |
| | 11,340,900 | | | e | | China Coal Energy Co | | | 6,395 | |
| | 5,281,700 | | | | | China Oilfield Services Ltd | | | 16,452 | |
| | 6,926,899 | | | | | China Shenhua Energy Co Ltd | | | 21,922 | |
| | 1,441,000 | | | e | | China Suntien Green Energy Cor | | | 542 | |
| | 1,749,000 | | | | | Chu Kong Petroleum & Natural Gas Steel Pipe Holdings Ltd | | | 612 | |
| | 348,696 | | | | | Cimarex Energy Co | | | 36,582 | |
| | 29,431 | | | * | | Clayton Williams Energy, Inc | | | 2,412 | |
| | 222,094 | | | *,e | | Clean Energy Fuels Corp | | | 2,861 | |
| | 240,458 | | | * | | Cloud Peak Energy, Inc | | | 4,328 | |
| | 38,038,700 | | | | | CNOOC Ltd | | | 70,743 | |
| | 1,007,040 | | | | | Coal India Ltd | | | 4,730 | |
| | 1,818,156 | | | * | | Cobalt International Energy, Inc | | | 29,909 | |
| | 18,046 | | | * | | Compagnie Generale de Geophysique S.A. | | | 313 | |
| | 194,203 | | | | | Comstock Resources, Inc | | | 3,552 | |
| | 962,641 | | | * | | Concho Resources, Inc | | | 103,965 | |
| | 4,534,018 | | | | | ConocoPhillips | | | 320,328 | |
| | 1,227,918 | | | | | Consol Energy, Inc | | | 46,710 | |
| | 75,143 | | | * | | Contango Oil & Gas Co | | | 3,551 | |
| | 377,333 | | | *,e | | Continental Resources, Inc | | | 42,457 | |
| | 51,332 | | | | | Core Laboratories NV | | | 9,802 | |
| | 209,774 | | | | | Cosan SA Industria e Comercio | | | 3,520 | |
| | 1,661,400 | | | * | | Cosco Capital, Inc | | | 330 | |
| | 653,000 | | | * | | Cosmo Oil Co Ltd | | | 1,248 | |
| | 920,289 | | | e | | Crescent Point Energy Corp | | | 35,737 | |
| | 126,728 | | | * | | Crew Energy, Inc | | | 761 | |
| | 56,152 | | | | | CropEnergies AG. | | | 462 | |
| | 172,753 | | | | | Crosstex Energy, Inc | | | 6,247 | |
| | 35,716 | | | | | CVR Energy, Inc | | | 1,551 | |
| | 32,299 | | | * | | Dawson Geophysical Co | | | 1,092 | |
| | 579,100 | | | | | Dayang Enterprise Holdings BHD | | | 1,024 | |
| | 236,216 | | | * | | Deep Sea Supply plc | | | 447 | |
| | 90,300 | | | * | | DeeThree Exploration Ltd | | | 814 | |
| | 14,796 | | | | | Delek Group Ltd | | | 5,652 | |
| | 211,084 | | | | | Delek US Holdings, Inc | | | 7,263 | |
| | 4,366,564 | | | * | | Denbury Resources, Inc | | | 71,743 | |
| | 395,408 | | | *,e | | Denison Mines Corp | | | 480 | |
| | 81,995 | | | *,e | | Det Norske Oljeselskap ASA | | | 902 | |
| | 790,343 | | | | | Devon Energy Corp | | | 48,899 | |
| | 36,009 | | | e | | Diamond Offshore Drilling, Inc | | | 2,050 | |
| | 90,419 | | | * | | Diamondback Energy, Inc | | | 4,780 | |
| | 785,345 | | | * | | DNO International ASA | | | 3,143 | |
| | 294,297 | | | *,e | | Dolphin Group AS. | | | 228 | |
COLLEGE RETIREMENT EQUITIES FUND - Stock Account
| | | | | | | | VALUE | |
| SHARES | | | | | COMPANY | | (000) | |
| | 1,608,495 | | | | | Dragon Oil plc | | $ | 15,119 | |
| | 402,553 | | | * | | Dresser-Rand Group, Inc | | | 24,004 | |
| | 806,807 | | | *,e | | Drillsearch Energy Ltd | | | 975 | |
| | 280,766 | | | * | | Dril-Quip, Inc | | | 30,865 | |
| | 931,000 | | | e | | Dyna-Mac Holdings Ltd | | | 296 | |
| | 7,843,104 | | | | | Ecopetrol S.A. | | | 15,036 | |
| | 35,132 | | | e | | Ecopetrol S.A. (ADR) | | | 1,351 | |
| | 207,938 | | | *,e | | Electromagnetic GeoServices AS | | | 271 | |
| | 211,294 | | | * | | Emerald Oil, Inc | | | 1,619 | |
| | 1,035,226 | | | | | Empresas COPEC S.A. | | | 13,869 | |
| | 102,011 | | | | | Enbridge Income Fund | | | 2,271 | |
| | 693,266 | | | e | | Enbridge, Inc | | | 30,289 | |
| | 716,001 | | | e | | EnCana Corp | | | 12,928 | |
| | 174,088 | | | *,e | | Endeavour International Corp | | | 914 | |
| | 155,018 | | | | | Enerflex Ltd | | | 2,189 | |
| | 178,544 | | | | | Energen Corp | | | 12,632 | |
| | 1,110,000 | | | | | Energy Absolute PCL | | | 260 | |
| | 769,200 | | | | | Energy Earth PCL | | | 172 | |
| | 1,003,961 | | | * | | Energy Resources of Australia Ltd | | | 1,131 | |
| | 307,468 | | | e | | Energy XXI Bermuda Ltd | | | 8,320 | |
| | 210,182 | | | e | | Enerplus Resources Fund | | | 3,819 | |
| | 3,833,629 | | | | | ENI S.p.A. | | | 92,634 | |
| | 1,741,933 | | | * | | Enquest plc (London) | | | 3,885 | |
| | 23,700 | | | | | Ensco plc | | | 1,355 | |
| | 258,693 | | | | | Ensign Energy Services, Inc | | | 4,074 | |
| | 1,123,442 | | | | | EOG Resources, Inc | | | 188,558 | |
| | 109,774 | | | * | | EPL Oil & Gas, Inc | | | 3,129 | |
| | 144,798 | | | | | Equal Energy Ltd | | | 773 | |
| | 764,711 | | | | | Equitable Resources, Inc | | | 68,656 | |
| | 77,615 | | | * | | Era Group, Inc | | | 2,395 | |
| | 63,657 | | | | | ERG S.p.A. | | | 852 | |
| | 411,996 | | | * | | Essar Energy plc | | | 496 | |
| | 293,100 | | | e | | Essential Energy Services Ltd | | | 806 | |
| | 30,000 | | | | | Esso Malaysia BHD | | | 27 | |
| | 4,782 | | | | | Esso SA Francaise | | | 270 | |
| | 3,311,400 | | | | | Esso Thailand PCL (Foreign) | | | 607 | |
| | 113,849 | | | | | Etablissements Maurel et Prom | | | 1,904 | |
| | 135,902 | | | | | Eurasia Drilling Co Ltd (GDR) | | | 6,116 | |
| | 30,174 | | | * | | Euronav NV | | | 359 | |
| | 55,547 | | | | | Evolution Petroleum Corp | | | 685 | |
| | 2,266,122 | | | e | | EXCO Resources, Inc | | | 12,033 | |
| | 81,653 | | | | | Exmar NV | | | 1,248 | |
| | 227,606 | | | * | | Exterran Holdings, Inc | | | 7,784 | |
| | 15,214,568 | | | | | Exxon Mobil Corp | | | 1,539,714 | |
| | 2,849,800 | | | e | | Ezion Holdings Ltd | | | 5,029 | |
| | 858,200 | | | *,e | | Ezra Holdings Ltd | | | 937 | |
| | 190,854 | | | * | | Faroe Petroleum plc | | | 376 | |
| | 760,692 | | | * | | FMC Technologies, Inc | | | 39,716 | |
COLLEGE RETIREMENT EQUITIES FUND - Stock Account
| | | | | | | | VALUE | |
| SHARES | | | | | COMPANY | | (000) | |
| | 683,150 | | | *,e | | Forest Oil Corp | | $ | 2,466 | |
| | 1,606,680 | | | | | Formosa Petrochemical Corp | | | 4,406 | |
| | 138,328 | | | * | | Forum Energy Technologies, Inc | | | 3,909 | |
| | 239,797 | | | e | | Frank’s International NV | | | 6,475 | |
| | 97,240 | | | | | Fred Olsen Energy ASA | | | 3,968 | |
| | 113,813 | | | e | | Freehold Royalty Trust | | | 2,369 | |
| | 180,165 | | | *,e | | Frontline Ltd | | | 674 | |
| | 7,762 | | | | | Fugro NV | | | 463 | |
| | 196,698 | | | *,e | | FX Energy, Inc | | | 720 | |
| | 182,170 | | | | | Galp Energia SGPS S.A. | | | 2,986 | |
| | 102,034 | | | | | GasLog Ltd | | | 1,744 | |
| | 267,362 | | | * | | Gastar Exploration Ltd | | | 1,850 | |
| | 9,151,865 | | | | | Gazprom OAO (ADR) | | | 78,426 | |
| | 62,095 | | | | | Gazpromneft OAO (ADR) | | | 1,406 | |
| | 8,880,000 | | | *,e | | Genesis Energy Holdings Ltd | | | 287 | |
| | 361,000 | | | *,e | | Geo Energy Resources Ltd | | | 92 | |
| | 41,962 | | | *,e | | Geospace Technologies Corp | | | 3,979 | |
| | 413,809 | | | | | Gibson Energy, Inc | | | 10,674 | |
| | 119,528 | | | *,e | | Global Geophysical Services, Inc | | | 192 | |
| | 84,226 | | | e | | Golar LNG Ltd | | | 3,057 | |
| | 157,471 | | | *,e | | Goodrich Petroleum Corp | | | 2,680 | |
| | 96,285 | | | e | | Green Plains Renewable Energy, Inc | | | 1,867 | |
| | 106,503 | | | * | | Grupa Lotos S.A. | | | 1,251 | |
| | 198,164 | | | | | GS Holdings Corp | | | 10,785 | |
| | 118,398 | | | * | | Gujarat Mineral Development Corp Ltd | | | 228 | |
| | 59,485 | | | | | Gulf Island Fabrication, Inc | | | 1,381 | |
| | 1,014,809 | | | *,e | | Gulf Keystone Petroleum Ltd | | | 2,916 | |
| | 103,389 | | | | | Gulfmark Offshore, Inc | | | 4,873 | |
| | 186,042 | | | * | | Gulfport Energy Corp | | | 11,749 | |
| | 896,440 | | | *,e | | Halcon Resources Corp | | | 3,460 | |
| | 30,946 | | | e | | Hallador Petroleum Co | | | 249 | |
| | 4,243,675 | | | | | Halliburton Co | | | 215,366 | |
| | 1,924 | | | | | Hankook Shell Oil Co Ltd | | | 854 | |
| | 68,974 | | | | | Hargreaves Services plc | | | 961 | |
| | 411,630 | | | * | | Helix Energy Solutions Group, Inc | | | 9,542 | |
| | 119,272 | | | | | Hellenic Petroleum S.A. | | | 1,245 | |
| | 522,275 | | | | | Helmerich & Payne, Inc | | | 43,913 | |
| | 603,095 | | | * | | Hercules Offshore, Inc | | | 3,938 | |
| | 204,744 | | | * | | Heritage Oil Ltd | | | 506 | |
| | 1,610,816 | | | | | Hess Corp | | | 133,698 | |
| | 190,900 | | | * | | Hibiscus Petroleum BHD | | | 102 | |
| | 1,888,000 | | | *,e | | Hidili Industry International Development Ltd | | | 289 | |
| | 1,802,000 | | | | | Hilong Holding Ltd | | | 1,548 | |
| | 45,851 | | | * | | Hoegh LNG Holdings Ltd | | | 361 | |
| | 384,128 | | | | | Holly Corp | | | 19,087 | |
| | 1,549,000 | | | e | | Honghua Group Ltd | | | 523 | |
| | 1,241,663 | | | *,e | | Horizon Oil Ltd | | | 339 | |
| | 138,652 | | | *,e | | Hornbeck Offshore Services, Inc | | | 6,826 | |
COLLEGE RETIREMENT EQUITIES FUND - Stock Account
| | | | | | | | VALUE | |
| SHARES | | | | | COMPANY | | (000) | |
| | 158,243 | | | | | Hunting plc | | $ | 2,047 | |
| | 1,126,887 | | | e | | Husky Energy, Inc | | | 35,751 | |
| | 125,132 | | | | | Idemitsu Kosan Co Ltd | | | 2,849 | |
| | 325,588 | | | e | | Imperial Oil Ltd | | | 14,418 | |
| | 2,959,146 | | | | | Inner Mongolia Yitai Coal Co | | | 5,235 | |
| | 1,891,200 | | | | | Inpex Holdings, Inc | | | 24,257 | |
| | 105,046 | | | *,e | | Iofina plc | | | 173 | |
| | 815,031 | | | * | | ION Geophysical Corp | | | 2,690 | |
| | 149,020 | | | * | | Ipek Matbacilik Sanayi Ve Ticaret AS | | | 217 | |
| | 16,960,500 | | | | | IRPC PCL | | | 1,688 | |
| | 3,133 | | | *,e | | Isramco, Inc | | | 398 | |
| | 517,300 | | | * | | Ithaca Energy, Inc | | | 1,300 | |
| | 128,453 | | | | | Itochu Enex Co Ltd | | | 707 | |
| | 6,100 | | | e | | Japan Drilling Co Ltd | | | 359 | |
| | 16,144 | | | | | Japan Petroleum Exploration Co | | | 612 | |
| | 790,128 | | | | | John Wood Group plc | | | 9,007 | |
| | 53,236 | | | * | | Jones Energy, Inc (Class A) | | | 771 | |
| | 1,176,591 | | | | | JX Holdings, Inc | | | 6,059 | |
| | 278,350 | | | * | | Karoon Gas Australia Ltd | | | 1,084 | |
| | 67,955 | | | * | | Kelt Exploration Ltd | | | 601 | |
| | 596,060 | | | * | | Key Energy Services, Inc | | | 4,709 | |
| | 273,637 | | | e | | Keyera Facilities Income Fund | | | 16,468 | |
| | 727,701 | | | | | Kinder Morgan, Inc | | | 26,197 | |
| | 168,256 | | | *,e | | KiOR, Inc (Class A) | | | 283 | |
| | 107,395 | | | e | | Knightsbridge Tankers Ltd | | | 987 | |
| | 1,722,637 | | | * | | KNM Group BHD | | | 237 | |
| | 2,298,228 | | | * | | Kodiak Oil & Gas Corp | | | 25,763 | |
| | 52,483 | | | | | Koninklijke Vopak NV | | | 3,072 | |
| | 248,978 | | | * | | Kosmos Energy LLC | | | 2,784 | |
| | 681,000 | | | * | | KrisEnergy Ltd | | | 679 | |
| | 180,952 | | | e | | Kumba Resources Ltd | | | 2,530 | |
| | 450,368 | | | | | Kvaerner ASA | | | 856 | |
| | 125,526 | | | *,e,m | | L&L Energy, Inc | | | 188 | |
| | 633,982 | | | * | | Laredo Petroleum Holdings, Inc | | | 17,555 | |
| | 192,800 | | | * | | Legacy Oil & Gas, Inc | | | 1,113 | |
| | 251,207 | | | e | | Lightstream Resources Ltd | | | 1,391 | |
| | 67,600 | | | e | | Longview Oil Corp | | | 306 | |
| | 74,939 | | | | | Lubelski Wegiel Bogdanka S.A. | | | 3,121 | |
| | 1,113,346 | | | | | LUKOIL (ADR) | | | 69,648 | |
| | 24,884 | | | * | | Lundin Petroleum AB | | | 484 | |
| | 225,116 | | | | | Magellan Midstream Partners LP | | | 14,243 | |
| | 638,751 | | | *,e | | Magnum Hunter Resources Corp | | | 4,669 | |
| | 2,948,411 | | | | | Marathon Oil Corp | | | 104,079 | |
| | 1,687,993 | | | | | Marathon Petroleum Corp | | | 154,840 | |
| | 222,505 | | | * | | Maridive & Oil Services SAE | | | 222 | |
| | 1,147,351 | | | * | | Matador Resources Co | | | 21,387 | |
| | 145,072 | | | * | | Matrix Service Co | | | 3,550 | |
| | 105,932 | | | | | Maurel & Prom Nigeria | | | 450 | |
COLLEGE RETIREMENT EQUITIES FUND - Stock Account
| | | | | | | | VALUE | |
| SHARES | | | | | COMPANY | | (000) | |
| | 152,731 | | | * | | Maverick Drilling & Exploration Ltd | | $ | 60 | |
| | 444,248 | | | *,e | | McDermott International, Inc | | | 4,069 | |
| | 73,947 | | | * | | MEG Energy Corp | | | 2,131 | |
| | 121,397 | | | *,e | | Midstates Petroleum Co, Inc | | | 804 | |
| | 3,850,000 | | | e | | MIE Holdings Corp | | | 816 | |
| | 118,833 | | | *,e | | Miller Petroleum, Inc | | | 837 | |
| | 52,585 | | | * | | Mitcham Industries, Inc | | | 931 | |
| | 32,500 | | | | | Modec, Inc | | | 934 | |
| | 57,961 | | | | | MOL Hungarian Oil and Gas plc | | | 3,884 | |
| | 4,993,117 | | | *,e | | Mongolia Energy Co ltd | | | 157 | |
| | 41,423 | | | | | Motor Oil Hellas Corinth Refineries S.A. | | | 468 | |
| | 221,767 | | | e | | Mullen Group Ltd | | | 5,927 | |
| | 662,121 | | | | | Murphy Oil Corp | | | 42,958 | |
| | 1,654,565 | | | | | Nabors Industries Ltd | | | 28,111 | |
| | 48,350 | | | * | | Naphtha Israel Petroleum Corp Ltd | | | 334 | |
| | 1,284,565 | | | | | National Oilwell Varco, Inc | | | 102,161 | |
| | 54,814 | | | * | | Natural Gas Services Group, Inc | | | 1,511 | |
| | 90,322 | | | e | | Neste Oil Oyj | | | 1,786 | |
| | 1,474,366 | | | | | New Zealand Oil & Gas Ltd | | | 976 | |
| | 225,063 | | | * | | Newfield Exploration Co | | | 5,543 | |
| | 1,116,000 | | | e | | Newocean Energy Holdings Ltd | | | 913 | |
| | 393,845 | | | * | | Newpark Resources, Inc | | | 4,840 | |
| | 319,200 | | | *,e | | Niko Resources Ltd | | | 763 | |
| | 288,000 | | | | | Nippon Coke & Engineering Co Ltd | | | 370 | |
| | 60,000 | | | | | Noble Corp plc | | | 2,248 | |
| | 1,607,861 | | | | | Noble Energy, Inc | | | 109,511 | |
| | 270,601 | | | e | | Nordic American Tanker Shipping | | | 2,625 | |
| | 257,127 | | | *,e | | Northern Oil And Gas, Inc | | | 3,875 | |
| | 213,256 | | | | | NovaTek OAO (GDR) | | | 29,234 | |
| | 53,871 | | | *,e | | Nuverra Environmental Solutions, Inc | | | 904 | |
| | 140,779 | | | * | | NuVista Energy Ltd | | | 946 | |
| | 230,972 | | | * | | Oasis Petroleum, Inc | | | 10,849 | |
| | 3,727,536 | | | | | Occidental Petroleum Corp | | | 354,489 | |
| | 47,514 | | | | | Ocean Yield ASA | | | 272 | |
| | 577,377 | | | | | Oceaneering International, Inc | | | 45,543 | |
| | 295,326 | | | | | Oil India Ltd | | | 2,332 | |
| | 1,511,614 | | | * | | Oil Refineries Ltd | | | 486 | |
| | 1,179,085 | | | | | Oil Search Ltd | | | 8,566 | |
| | 144,268 | | | * | | Oil States International, Inc | | | 14,675 | |
| | 308,866 | | | | | OMV AG. | | | 14,782 | |
| | 945,134 | | | * | | Ophir Energy plc | | | 5,133 | |
| | 476,883 | | | | | Origin Energy Ltd | | | 6,010 | |
| | 371,307 | | | | | Pacific Rubiales Energy Corp (Toronto) | | | 6,411 | |
| | 995,999 | | | *,e | | Paladin Resources Ltd | | | 415 | |
| | 25,444 | | | | | Panhandle Oil and Gas, Inc (Class A) | | | 850 | |
| | 73,589 | | | * | | Paramount Resources Ltd (Class A) | | | 2,693 | |
| | 237,451 | | | * | | Parex Resources, Inc | | | 1,471 | |
| | 459,330 | | | * | | Parker Drilling Co | | | 3,734 | |
COLLEGE RETIREMENT EQUITIES FUND - Stock Account
| | | | | | | | VALUE | |
| SHARES | | | | | COMPANY | | (000) | |
| | 212,286 | | | e | | Parkland Income Fund | | $ | 3,691 | |
| | 132,626 | | | e | | Pason Systems, Inc | | | 2,869 | |
| | 481,573 | | | | | Patterson-UTI Energy, Inc | | | 12,193 | |
| | 5,276 | | | * | | Paz Oil Co Ltd | | | 862 | |
| | 160,721 | | | e | | PBF Energy, Inc | | | 5,056 | |
| | 140,676 | | | * | | PDC Energy, Inc | | | 7,487 | |
| | 379,024 | | | | | Peabody Energy Corp | | | 7,402 | |
| | 606,055 | | | e | | Pembina Pipeline Income Fund | | | 21,350 | |
| | 478,402 | | | e | | Pengrowth Energy Trust | | | 2,959 | |
| | 206,699 | | | *,e | | Penn Virginia Corp | | | 1,949 | |
| | 308,209 | | | e | | Penn West Energy Trust | | | 2,574 | |
| | 376,880 | | | * | | Perdana Petroleum BHD | | | 183 | |
| | 592,200 | | | * | | Perisai Petroleum Teknologi BHD | | | 288 | |
| | 39,867 | | | | | Petrofac Ltd | | | 808 | |
| | 4,306,176 | | | | | Petroleo Brasileiro S.A. | | | 29,253 | |
| | 390,800 | | | | | Petroleo Brasileiro S.A. (ADR) | | | 5,385 | |
| | 6,333,382 | | | | | Petroleo Brasileiro S.A. (Preference) | | | 45,877 | |
| | 358,844 | | | | | Petroleum Geo-Services ASA | | | 4,239 | |
| | 682,818 | | | | | Petronas Dagangan BHD | | | 6,560 | |
| | 176,889 | | | * | | Petroquest Energy, Inc | | | 764 | |
| | 1,413,957 | | | e | | Peyto Energy Trust | | | 43,274 | |
| | 48,236 | | | * | | PHI, Inc | | | 2,093 | |
| | 132,300 | | | * | | Philex Petroleum Corp | | | 23 | |
| | 2,566,103 | | | | | Phillips 66 | | | 197,924 | |
| | 237,131 | | | * | | Pioneer Energy Services Corp | | | 1,899 | |
| | 524,968 | | | | | Pioneer Natural Resources Co | | | 96,631 | |
| | 163,345 | | | * | | Plains GP Holdings LP | | | 4,373 | |
| | 1,710,819 | | | *,e | | Polarcus Ltd | | | 1,329 | |
| | 2,466,301 | | | | | Polish Oil & Gas Co | | | 4,188 | |
| | 378,342 | | | | | Polski Koncern Naftowy Orlen S.A. | | | 5,144 | |
| | 100,100 | | | *,m | | Poseidon Concepts Corp | | | 1 | |
| | 288,700 | | | | | Precision Drilling Trust | | | 2,701 | |
| | 722,435 | | | | | Premier Oil plc | | | 3,759 | |
| | 600,917 | | | | | ProSafe ASA | | | 4,649 | |
| | 13,068,000 | | | * | | PT Benakat Petroleum Energy | | | 120 | |
| | 17,070,000 | | | * | | PT Bumi Resources Minerals Tbk | | | 280 | |
| | 588,200 | | | * | | PT Bumi Resources Tbk | | | 15 | |
| | 34,082,000 | | | * | | PT Energi Mega Persada Tbk | | | 197 | |
| | 595,000 | | | * | | PT Golden Eagle Energy Tbk | | | 289 | |
| | 820,500 | | | | | PT Harum Energy Indonesia Tbk | | | 186 | |
| | 2,943,000 | | | | | PT Indika Energy Tbk | | | 143 | |
| | 524,000 | | | | | PT Indo Tambangraya Megah | | | 1,230 | |
| | 2,879,000 | | | | | PT Medco Energi Internasional Tbk | | | 498 | |
| | 401,000 | | | | | PT Resource Alam Indonesia Tbk | | | 68 | |
| | 19,026,500 | | | * | | PT Sugih Energy Tbk | | | 697 | |
| | 2,511,234 | | | | | PT Tambang Batubara Bukit Asam Tbk | | | 2,110 | |
| | 3,085,930 | | | | | PTT Exploration & Production PCL | | | 15,675 | |
| | 1,241,750 | | | | | PTT PCL | | | 10,831 | |
COLLEGE RETIREMENT EQUITIES FUND - Stock Account
| | | | | | | | VALUE | |
| SHARES | | | | | COMPANY | | (000) | |
| | 296,200 | | | | | QGEP Participacoes S.A. | | $ | 1,228 | |
| | 344,120 | | | | | Questar Market Resources, Inc | | | 10,547 | |
| | 489,337 | | | *,e | | Quicksilver Resources, Inc | | | 1,502 | |
| | 192,100 | | | * | | Raging River Exploration, Inc | | | 1,219 | |
| | 356,230 | | | | | Range Resources Corp | | | 30,034 | |
| | 308,610 | | | *,e | | Red Fork Energy Ltd | | | 105 | |
| | 1,142,564 | | | | | Refineria La Pampilla S.A. Relapasa | | | 123 | |
| | 2,080,488 | | | | | Reliance Industries Ltd | | | 30,157 | |
| | 172,618 | | | *,e | | Renewable Energy Group, Inc | | | 1,978 | |
| | 1,503,512 | | | | | Repsol YPF S.A. | | | 37,938 | |
| | 260,164 | | | *,e | | Resolute Energy Corp | | | 2,349 | |
| | 145,433 | | | * | | Rex Energy Corp | | | 2,866 | |
| | 297,000 | | | * | | Rex International Holding Ltd | | | 140 | |
| | 18,958 | | | * | | Rex Stores Corp | | | 848 | |
| | 37,925 | | | * | | RigNet, Inc | | | 1,818 | |
| | 118,200 | | | * | | RMP Energy Inc | | | 625 | |
| | 1,670,915 | | | * | | Roc Oil Co Ltd | | | 733 | |
| | 355,101 | | | *,e | | Rockhopper Exploration plc | | | 907 | |
| | 233,397 | | | * | | Rosetta Resources, Inc | | | 11,212 | |
| | 1,489,270 | | | | | Rosneft Oil Co (GDR) | | | 11,368 | |
| | 549,334 | | | * | | Rowan Cos plc | | | 19,424 | |
| | 6,294,228 | | | | | Royal Dutch Shell plc (A Shares) | | | 225,574 | |
| | 3,638,062 | | | | | Royal Dutch Shell plc (B Shares) | | | 137,228 | |
| | 558,626 | | | e | | RPC, Inc | | | 9,971 | |
| | 30,905 | | | | | Saipem S.p.A. | | | 663 | |
| | 333,027 | | | * | | Salamander Energy plc | | | 617 | |
| | 170,000 | | | | | San-Ai Oil Co Ltd | | | 800 | |
| | 143,695 | | | *,e | | Sanchez Energy Corp | | | 3,522 | |
| | 814,155 | | | *,e | | SandRidge Energy, Inc | | | 4,942 | |
| | 444,725 | | | | | Santos Ltd | | | 5,829 | |
| | 4,635,100 | | | * | | Sapurakencana Petroleum BHD | | | 6,944 | |
| | 325,925 | | | * | | Saras S.p.A. | | | 373 | |
| | 1,106,571 | | | | | Sasol Ltd | | | 54,461 | |
| | 191,038 | | | e | | Savanna Energy Services Corp | | | 1,529 | |
| | 254,458 | | | * | | SBM Offshore NV | | | 5,184 | |
| | 5,814,758 | | | | | Schlumberger Ltd | | | 523,968 | |
| | 23,049 | | | | | Schoeller-Bleckmann Oilfield Equipment AG. | | | 2,557 | |
| | 569,500 | | | * | | Scomi Group BHD | | | 64 | |
| | 707,683 | | | | | Scorpio Tankers, Inc | | | 8,344 | |
| | 114,650 | | | *,e | | SEACOR Holdings, Inc | | | 10,456 | |
| | 775,635 | | | e | | Seadrill Ltd | | | 31,863 | |
| | 299,090 | | | | | Seadrill Ltd (Oslo Exchange) | | | 12,258 | |
| | 126,500 | | | e | | Secure Energy Services, Inc | | | 2,104 | |
| | 152,702 | | | | | SemGroup Corp | | | 9,961 | |
| | 14,009,649 | | | *,e | | Senex Energy Ltd | | | 9,284 | |
| | 50 | | | *,m | | Serval Integrated Energy Services | | | 0 | ^ |
| | 352,100 | | | *,e | | Sevan Drilling AS. | | | 287 | |
| | 219,200 | | | | | Shandong Molong Petroleum Machinery Co Ltd | | | 84 | |
COLLEGE RETIREMENT EQUITIES FUND - Stock Account
| | | | | | | | VALUE | |
| SHARES | | | | | COMPANY | | (000) | |
| | 84,179 | | | | | ShawCor Ltd | | $ | 3,366 | |
| | 40,900 | | | | | Shinko Plantech Co Ltd | | | 318 | |
| | 214,237 | | | e | | Ship Finance International Ltd | | | 3,509 | |
| | 787,954 | | | e | | Showa Shell Sekiyu KK | | | 8,009 | |
| | 500,800 | | | | | Siamgas & Petrochemicals PCL | | | 241 | |
| | 61,000 | | | | | Sinanen Co Ltd | | | 238 | |
| | 8,240,000 | | | *,e | | Sino Union Energy Investment Group Ltd | | | 474 | |
| | 1,126,000 | | | e | | Sinopec Kantons Holdings Ltd | | | 1,252 | |
| | 69,377 | | | | | SK Energy Co Ltd | | | 9,328 | |
| | 7,504 | | | | | SK Gas Co Ltd | | | 533 | |
| | 33,300 | | | *,m | | Societatea Nationala de Gaze Naturale ROMGAZ S.A. (GDR) | | | 356 | |
| | 23,600 | | | * | | Societatea Nationala de Gaze Naturale ROMGAZ S.A. (GDR) Registered | | | 240 | |
| | 483,492 | | | | | Soco International plc | | | 3,166 | |
| | 58,066 | | | | | S-Oil Corp | | | 4,079 | |
| | 151,792 | | | *,e | | Solazyme, Inc | | | 1,653 | |
| | 168,771 | | | *,e | | Songa Offshore SE | | | 87 | |
| | 446,700 | | | * | | Southern Pacific Resource Corp | | | 78 | |
| | 980,639 | | | * | | Southwestern Energy Co | | | 38,569 | |
| | 4,110,861 | | | | | Spectra Energy Corp | | | 146,429 | |
| | 109,222 | | | e | | Sprott Resource Corp | | | 239 | |
| | 816,000 | | | | | SPT Energy Group, Inc | | | 486 | |
| | 135,028 | | | e | | Spyglass Resources Corp | | | 231 | |
| | 222,815 | | | | | St. Mary Land & Exploration Co | | | 18,518 | |
| | 1,032,731 | | | | | Statoil ASA | | | 25,112 | |
| | 199,885 | | | * | | Stone Energy Corp | | | 6,914 | |
| | 1,976,338 | | | | | Suncor Energy, Inc | | | 69,286 | |
| | 1,083,024 | | | | | Suncor Energy, Inc (NY) | | | 37,960 | |
| | 373,194 | | | * | | Sundance Energy Australia Ltd | | | 333 | |
| | 405,432 | | | * | | Superior Energy Services | | | 10,789 | |
| | 178,200 | | | e | | Surge Energy, Inc | | | 1,132 | |
| | 2,466,473 | | | | | Surgutneftegaz (ADR) | | | 21,357 | |
| | 316,700 | | | | | Surgutneftegaz (ADR) (London) | | | 2,746 | |
| | 433,000 | | | e | | Swiber Holdings Ltd | | | 229 | |
| | 169,512 | | | *,e | | Swift Energy Co | | | 2,288 | |
| | 161,203 | | | * | | Synergy Resources Corp | | | 1,493 | |
| | 70,300 | | | * | | TAG Oil Ltd | | | 218 | |
| | 5,983,526 | | | e | | Tailsman Energy, Inc | | | 69,708 | |
| | 4,587,096 | | | e | | Talisman Energy, Inc (Toronto) | | | 53,331 | |
| | 370,837 | | | | | Targa Resources Investments, Inc | | | 32,697 | |
| | 422,861 | | | e | | Tatneft (GDR) | | | 16,205 | |
| | 75,717 | | | | | Technip S.A. | | | 7,289 | |
| | 79,670 | | | e | | Tecnicas Reunidas S.A. | | | 4,330 | |
| | 70,742 | | | | | Teekay Corp | | | 3,396 | |
| | 241,687 | | | e | | Teekay Tankers Ltd (Class A) | | | 950 | |
| | 814,241 | | | | | Tenaris S.A. | | | 17,743 | |
| | 154,066 | | | * | | Tesco Corp | | | 3,047 | |
| | 750,500 | | | | | Tesoro Corp | | | 43,904 | |
| | 38,718 | | | * | | Tethys Oil AB | | | 406 | |
COLLEGE RETIREMENT EQUITIES FUND - Stock Account
| | | | | | | | VALUE | |
| SHARES | | | | | COMPANY | | (000) | |
| | 314,849 | | | * | | Tetra Technologies, Inc | | $ | 3,892 | |
| | 51,431 | | | *,e | | TGC Industries, Inc | | | 375 | |
| | 263,185 | | | | | TGS Nopec Geophysical Co ASA | | | 6,993 | |
| | 1,276,600 | | | | | Thai Oil PCL | | | 2,193 | |
| | 97,947 | | | | | Tidewater, Inc | | | 5,805 | |
| | 19,945 | | | | | TMK OAO (GDR) | | | 235 | |
| | 234,335 | | | e | | TonenGeneral Sekiyu KK | | | 2,150 | |
| | 85,500 | | | | | TORC Oil & Gas Ltd | | | 850 | |
| | 45,006 | | | e | | Total Energy Services, Inc | | | 874 | |
| | 3,933,554 | | | | | Total S.A. | | | 241,439 | |
| | 413,623 | | | * | | Tourmaline Oil Corp | | | 17,405 | |
| | 142,000 | | | | | Toyo Kanetsu K K | | | 399 | |
| | 1,257,364 | | | e | | TransCanada Corp | | | 57,456 | |
| | 208,733 | | | * | | TransGlobe Energy Corp | | | 1,745 | |
| | 402,726 | | | | | Transocean Ltd | | | 19,709 | |
| | 133,545 | | | e | | Transocean Ltd (NYSE) | | | 6,600 | |
| | 248,115 | | | *,e | | Triangle Petroleum Corp | | | 2,064 | |
| | 184,000 | | | e | | Trican Well Service Ltd | | | 2,248 | |
| | 147,662 | | | e | | Trilogy Energy Corp | | | 3,837 | |
| | 417,066 | | | | | Trinidad Drilling Ltd | | | 3,867 | |
| | 1,446,322 | | | | | Tullow Oil plc | | | 20,527 | |
| | 318,828 | | | | | Tupras Turkiye Petrol Rafine | | | 6,366 | |
| | 74,343 | | | | | Turcas Petrolculuk AS | | | 86 | |
| | 286,200 | | | | | Twin Butte Energy Ltd | | | 609 | |
| | 398,235 | | | *,e | | Ultra Petroleum Corp | | | 8,622 | |
| | 556,300 | | | | | Ultrapar Participacoes S.A. | | | 13,220 | |
| | 168,603 | | | * | | Unit Corp | | | 8,703 | |
| | 264,324 | | | *,e | | Uranium Energy Corp | | | 529 | |
| | 507,863 | | | *,e | | Ur-Energy, Inc | | | 701 | |
| | 343,557 | | | * | | Vaalco Energy, Inc | | | 2,367 | |
| | 2,552,532 | | | | | Valero Energy Corp | | | 128,648 | |
| | 773,287 | | | *,e | | Vantage Drilling Co | | | 1,423 | |
| | 264,200 | | | e | | Veresen, Inc | | | 3,549 | |
| | 231,793 | | | e | | Vermilion Energy Trust | | | 13,605 | |
| | 141,214 | | | | | W&T Offshore, Inc | | | 2,259 | |
| | 4,983,294 | | | | | Wah Seong Corp BHD | | | 2,513 | |
| | 351,162 | | | * | | Warren Resources, Inc | | | 1,103 | |
| | 2,115,818 | | | * | | Weatherford International Ltd | | | 32,774 | |
| | 68,800 | | | e | | Western Energy Services Corp | | | 479 | |
| | 519,930 | | | e | | Western Refining, Inc | | | 22,050 | |
| | 105,574 | | | * | | Westfire Energy Ltd | | | 534 | |
| | 46,359 | | | * | | Westmoreland Coal Co | | | 894 | |
| | 383,226 | | | e | | Whitecap Resources, Inc | | | 4,560 | |
| | 850,318 | | | *,e | | Whitehaven Coal Ltd | | | 1,455 | |
| | 428,420 | | | * | | Whiting Petroleum Corp | | | 26,506 | |
| | 147,200 | | | * | | Willbros Group, Inc | | | 1,387 | |
| | 3,692,759 | | | | | Williams Cos, Inc | | | 142,430 | |
| | 1,398,000 | | | *,e,m | | Wison Engineering Services Co Ltd | | | 178 | |
COLLEGE RETIREMENT EQUITIES FUND - Stock Account
| | | | | | | | VALUE | |
| SHARES | | | | | COMPANY | | (000) | |
| | 1,066,800 | | | | | Woodside Petroleum Ltd | | $ | 37,155 | |
| | 142,407 | | | e | | World Fuel Services Corp | | | 6,146 | |
| | 198,187 | | | | | WorleyParsons Ltd | | | 2,948 | |
| | 330,953 | | | * | | WPX Energy, Inc | | | 6,745 | |
| | 295,238 | | | *,e | | Xcite Energy Ltd | | | 464 | |
| | 11,286,900 | | | e | | Yanzhou Coal Mining Co Ltd | | | 10,380 | |
| | 575,654 | | | | | Z Energy Ltd | | | 1,753 | |
| | 146,361 | | | *,e | | ZaZa Energy Corp | | | 140 | |
| | | | | | | TOTAL ENERGY | | | 10,902,124 | |
| | | | | | | | | | | |
| FOOD & STAPLES RETAILING - 1.6% | | | | |
| | 682,402 | | | | | Aeon Co Ltd | | | 9,251 | |
| | 14,200 | | | | | Ain Pharmaciez Inc | | | 697 | |
| | 352,715 | | | | | Alimentation Couche Tard, Inc | | | 26,524 | |
| | 369,541 | | | | | Almacenes Exito S.A. | | | 5,744 | |
| | 93,049 | | | | | Andersons, Inc | | | 8,297 | |
| | 70,679 | | | | | Arcs Co Ltd | | | 1,354 | |
| | 3,575 | | | | | Arden Group, Inc (Class A) | | | 452 | |
| | 40,221 | | | | | Axfood AB | | | 2,018 | |
| | 398,520 | | | | | BIM Birlesik Magazalar AS | | | 8,048 | |
| | 39,862 | | | | | Bizim Toptan Satis Magazalari AS | | | 439 | |
| | 2,757,483 | | | | | Booker Group plc | | | 7,438 | |
| | 306,928 | | | * | | Brazil Pharma S.A. | | | 879 | |
| | 945,465 | | | | | Carrefour S.A. | | | 37,529 | |
| | 127,437 | | | | | Casey’s General Stores, Inc | | | 8,952 | |
| | 29,725 | | | | | Casino Guichard Perrachon S.A. | | | 3,430 | |
| | 14,800 | | | | | Cawachi Ltd | | | 279 | |
| | 1,304,152 | | | | | Centros Comerciales Sudamericanos S.A. | | | 4,697 | |
| | 51,232 | | | * | | Chefs’ Warehouse Holdings, Inc | | | 1,494 | |
| | 1,364,800 | | | | | China Resources Enterprise | | | 4,540 | |
| | 377,806 | | | | | Cia Brasileira de Distribuicao Grupo Pao de Acucar | | | 16,817 | |
| | 187,697 | | | e | | Cia Brasileira de Distribuicao Grupo Pao de Acucar (ADR) | | | 8,384 | |
| | 7,493 | | | | | CJ Freshway Corp | | | 208 | |
| | 355,451 | | | e | | Clicks Group Ltd | | | 2,128 | |
| | 22,860 | | | | | Cocokara Fine Holdings, Inc | | | 602 | |
| | 60,166 | | | | | Colruyt S.A. | | | 3,362 | |
| | 456,800 | | | | | Controladora Comercial Mexicana S.A. de C.V. | | | 1,956 | |
| | 10,500 | | | | | Cosmos Pharmaceutical Corp | | | 1,139 | |
| | 1,558,219 | | | | | Costco Wholesale Corp | | | 185,444 | |
| | 4,924,900 | | | | | CP Seven Eleven PCL | | | 6,315 | |
| | 18,900 | | | | | Create SD Holdings Co Ltd | | | 654 | |
| | 4,221,454 | | | | | CVS Corp | | | 302,129 | |
| | 5,900 | | | | | Daikokutenbussaan Co Ltd | | | 155 | |
| | 304,249 | | | e | | Delhaize Group | | | 18,100 | |
| | 149,391 | | | | | Distribuidora Internacional de Alimentacion S.A. | | | 1,338 | |
| | 82,169 | | | | | Dongsuh Co, Inc | | | 1,314 | |
| | 58,815 | | | | | E-Mart Co Ltd | | | 14,875 | |
| | 59,139 | | | | | Empire Co Ltd | | | 4,041 | |
COLLEGE RETIREMENT EQUITIES FUND - Stock Account
| | | | | | | | VALUE | |
| SHARES | | | | | COMPANY | | (000) | |
| | 171,826 | | | | | Eurocash S.A. | | $ | 2,716 | |
| | 58,231 | | | *,e | | Fairway Group Holdings Corp | | | 1,055 | |
| | 71,181 | | | e | | FamilyMart Co Ltd | | | 3,252 | |
| | 59,598 | | | *,e | | Fresh Market, Inc | | | 2,414 | |
| | 59,125 | | | e | | George Weston Ltd | | | 4,314 | |
| | 117,776 | | | | | Greggs plc | | | 842 | |
| | 25,130 | | | | | Growell Holdings Co Ltd | | | 1,314 | |
| | 316,800 | | | e | | Grupo Comercial Chedraui S.a. DE C.V. | | | 1,119 | |
| | 99,839 | | | | | Hakon Invest AB | | | 3,123 | |
| | 186,143 | | | e | | Harris Teeter Supermarkets, Inc | | | 9,186 | |
| | 75,600 | | | | | Heiwado Co Ltd | | | 1,083 | |
| | 3,032 | | | | | Indiabulls Wholesale Service | | | 1 | |
| | 44,706 | | | | | Ingles Markets, Inc (Class A) | | | 1,212 | |
| | 4,500 | | | | | Itochu-Shokuhin Co Ltd | | | 146 | |
| | 72,741 | | | | | Izumiya Co Ltd | | | 321 | |
| | 3,266,428 | | | | | J Sainsbury plc | | | 19,769 | |
| | 215,361 | | | | | Jean Coutu Group PJC, Inc | | | 3,732 | |
| | 393,215 | | | | | Jeronimo Martins SGPS S.A. | | | 7,689 | |
| | 84,300 | | | | | Kasumi Co Ltd | | | 521 | |
| | 48,400 | | | | | Kato Sangyo Co Ltd | | | 884 | |
| | 162,567 | | | | | Kesko Oyj (B Shares) | | | 5,997 | |
| | 2,593,844 | | | | | Koninklijke Ahold NV | | | 46,614 | |
| | 2,060,906 | | | | | Kroger Co | | | 81,468 | |
| | 3,300 | | | | | Kusuri No Aoki Co Ltd | | | 184 | |
| | 36,919 | | | | | Lawson, Inc | | | 2,763 | |
| | 1,610,000 | | | e | | Lianhua Supermarket Holdings Co Ltd | | | 1,247 | |
| | 28,100 | | | e | | Liquor Stores Income Fund | | | 372 | |
| | 109,866 | | | e | | Loblaw Cos Ltd | | | 4,383 | |
| | 525,516 | | | e | | Magnit OAO (GDR) | | | 34,904 | |
| | 94,339 | | | | | Majestic Wine plc | | | 840 | |
| | 37,770 | | | | | MARR S.p.A. | | | 627 | |
| | 43,233 | | | | | Maruetsu, Inc | | | 142 | |
| | 123,167 | | | | | Massmart Holdings Ltd | | | 1,527 | |
| | 122,900 | | | | | Matsumotokiyoshi Holdings Co Ltd | | | 4,285 | |
| | 585,342 | | | e | | Metcash Ltd | | | 1,653 | |
| | 746,163 | | | | | Metro AG. | | | 36,174 | |
| | 226,414 | | | e | | Metro, Inc | | | 13,833 | |
| | 15,500 | | | | | Ministop Co Ltd | | | 242 | |
| | 29,385 | | | *,e | | Natural Grocers by Vitamin C | | | 1,247 | |
| | 69,571 | | | | | North West Co Fund | | | 1,686 | |
| | 19,000 | | | | | Okuwa Co Ltd | | | 165 | |
| | 313,810 | | | e | | Olam International Ltd | | | 383 | |
| | 131,505 | | | * | | Pantry, Inc | | | 2,207 | |
| | 569,651 | | | | | Pick’n Pay Holdings Ltd | | | 1,222 | |
| | 260,060 | | | e | | Pick’n Pay Stores Ltd | | | 1,291 | |
| | 1,470,420 | | | | | President Chain Store Corp | | | 10,209 | |
| | 62,606 | | | | | Pricesmart, Inc | | | 7,234 | |
| | 15,286,500 | | | | | PT Sumber Alfaria Trijaya Tbk | | | 565 | |
COLLEGE RETIREMENT EQUITIES FUND - Stock Account
| | | | | | | | VALUE | |
| SHARES | | | | | COMPANY | | (000) | |
| | 244,272 | | | | | Raia Drogasil S.A. | | $ | 1,530 | |
| | 58,083 | | | | | Rallye S.A. | | | 2,437 | |
| | 8,059 | | | | | Rami Levi Chain Stores Hashikma Marketing 2006 Ltd | | | 441 | |
| | 7,054,528 | | | * | | Rite Aid Corp | | | 35,696 | |
| | 3,608,260 | | | * | | Robinsons Retail Holdings, Inc | | | 4,488 | |
| | 103,972 | | | e | | Roundy’s, Inc | | | 1,025 | |
| | 14,479 | | | e | | Ryoshoku Ltd | | | 352 | |
| | 11,000 | | | | | S Foods, Inc | | | 112 | |
| | 1,013,457 | | | | | Safeway, Inc | | | 33,008 | |
| | 17,400 | | | | | San-A Co Ltd | | | 476 | |
| | 1,076,719 | | | | | Seven & I Holdings Co Ltd | | | 42,871 | |
| | 533,000 | | | | | Sheng Siong Group Ltd | | | 258 | |
| | 183,731 | | | e | | Shoppers Drug Mart Corp | | | 10,065 | |
| | 763,393 | | | | | Shoprite Holdings Ltd | | | 11,954 | |
| | 203,743 | | | | | Shufersal Ltd | | | 784 | |
| | 1,190,556 | | | | | Sonae SPGS S.A. | | | 1,721 | |
| | 427,144 | | | | | Spar Group Ltd | | | 5,362 | |
| | 147,168 | | | e | | Spartan Stores, Inc | | | 3,573 | |
| | 677,139 | | | * | | Sprouts Farmers Market, Inc | | | 26,022 | |
| | 51,200 | | | | | Sugi Pharmacy Co Ltd | | | 2,080 | |
| | 3,075,900 | | | e | | Sun Art Retail Group Ltd | | | 4,344 | |
| | 57,100 | | | | | Sundrug Co Ltd | | | 2,551 | |
| | 1,009,697 | | | *,e | | Supervalu, Inc | | | 7,361 | |
| | 57,870 | | | * | | Susser Holdings Corp | | | 3,790 | |
| | 828,010 | | | | | Sysco Corp | | | 29,891 | |
| | 474,000 | | | * | | Taiwan TEA Corp | | | 398 | |
| | 8,454,928 | | | | | Tesco plc | | | 46,953 | |
| | 19,688 | | | | | Tsuruha Holdings, Inc | | | 1,808 | |
| | 211,296 | | | * | | United Natural Foods, Inc | | | 15,930 | |
| | 468,500 | | | | | UNY Co Ltd | | | 2,874 | |
| | 43,800 | | | | | Valor Co Ltd | | | 579 | |
| | 28,290 | | | | | Village Super Market (Class A) | | | 877 | |
| | 3,394,263 | | | | | Walgreen Co | | | 194,966 | |
| | 6,022,721 | | | | | Wal-Mart de Mexico S.A. de C.V. (Series V) | | | 15,804 | |
| | 3,845,164 | | | | | Wal-Mart Stores, Inc | | | 302,576 | |
| | 46,226 | | | | | Weis Markets, Inc | | | 2,430 | |
| | 1,085,251 | | | | | Wesfarmers Ltd | | | 42,730 | |
| | 1,180,181 | | | | | Whole Foods Market, Inc | | | 68,250 | |
| | 3,989,993 | | | | | WM Morrison Supermarkets plc | | | 17,272 | |
| | 1,034,770 | | | | | Woolworths Ltd | | | 31,334 | |
| | 1,053,799 | | | * | | Wumart Stores, Inc | | | 1,712 | |
| | 7,600 | | | | | Yaoko Co Ltd | | | 299 | |
| | 94,000 | | | | | Yokohama Reito Co Ltd | | | 713 | |
| | | | | | | TOTAL FOOD & STAPLES RETAILING | | | 2,008,877 | |
| | | | | | | | | | | |
| FOOD, BEVERAGE & TOBACCO - 4.6% | | | | |
| | 31,253 | | | | | AarhusKarlshamn AB | | | 2,002 | |
| | 562,862 | | | * | | AGV Products Corp | | | 174 | |
| | 518,260 | | | | | Ajinomoto Co, Inc | | | 7,503 | |
COLLEGE RETIREMENT EQUITIES FUND - Stock Account
| | | | | | | | VALUE | |
| SHARES | | | | | COMPANY | | (000) | |
| | 9,603 | | | e | | Alico, Inc | | $ | 373 | |
| | 452,262 | | | | | Alicorp S.A. | | | 1,472 | |
| | 39,916 | | | | | Alliance Grain Traders, Inc | | | 619 | |
| | 337,166 | | | * | | Alliance One International, Inc | | | 1,028 | |
| | 11,448,855 | | | | | Altria Group, Inc | | | 439,522 | |
| | 8,810,980 | | | | | AMBEV S.A. | | | 64,845 | |
| | 32,297 | | | | | Amsterdam Commodities NV | | | 735 | |
| | 414,629 | | | | | Anadolu Efes Biracilik Ve Malt Sanayii AS | | | 4,485 | |
| | 92,000 | | | | | Anheuser-Busch InBev NV (ADR) | | | 9,794 | |
| | 2,974 | | | *,m | | Anheuser-Busch InBev NV (Strip VVPR) | | | 0 | ^ |
| | 97,700 | | | | | Anhui Gujing Distillery Co Ltd | | | 220 | |
| | 45,683 | | | *,e | | Annie’s, Inc | | | 1,966 | |
| | 76,655 | | | * | | AquaChile S.A. | | | 40 | |
| | 2,002,197 | | | | | Archer Daniels Midland Co | | | 86,895 | |
| | 20,300 | | | | | Ariake Japan Co Ltd | | | 500 | |
| | 14,196 | | | | | Aryzta AG. | | | 1,091 | |
| | 539,661 | | | | | Asahi Breweries Ltd | | | 15,229 | |
| | 1,040,624 | | | | | Asian Citrus Holdings Ltd | | | 286 | |
| | 376,761 | | | | | Associated British Foods plc | | | 15,280 | |
| | 91,133 | | | e | | Astral Foods Ltd | | | 904 | |
| | 14,187 | | | | | Atria Group plc | | | 151 | |
| | 771,000 | | | *,m | | Ausnutria Dairy Corp Ltd | | | 1 | |
| | 227,435 | | | | | Austevoll Seafood ASA | | | 1,335 | |
| | 530,164 | | | * | | Australian Agricultural Co Ltd | | | 592 | |
| | 566,264 | | | | | AVI Ltd | | | 3,097 | |
| | 171,204 | | | | | B&G Foods, Inc (Class A) | | | 5,806 | |
| | 50,070 | | | | | Bakkafrost P | | | 787 | |
| | 213,659 | | | | | Balrampur Chini Mills Ltd | | | 159 | |
| | 2,111 | | | | | Barry Callebaut AG. | | | 2,653 | |
| | 390,005 | | | | | Beam, Inc | | | 26,544 | |
| | 28,181 | | | * | | Belvedere S.A. | | | 376 | |
| | 7,807 | | | | | Binggrae Co Ltd | | | 719 | |
| | 195,500 | | | | | Biostime Internatonal Holdings Ltd | | | 1,746 | |
| | 427,418 | | | *,e | | Black Earth Farming Ltd | | | 435 | |
| | 14,197 | | | | | Bonduelle S.C.A. | | | 376 | |
| | 27,025 | | | *,e | | Boston Beer Co, Inc (Class A) | | | 6,534 | |
| | 195,617 | | | * | | Boulder Brands, Inc | | | 3,103 | |
| | 36,569 | | | | | Britannia Industries Ltd | | | 545 | |
| | 262,100 | | | | | British American Tobacco Malaysia BHD | | | 5,131 | |
| | 2,841,360 | | | | | British American Tobacco plc | | | 152,507 | |
| | 4,266,288 | | | | | Britvic plc | | | 48,980 | |
| | 646,165 | | | | | Brown-Forman Corp (Class B) | | | 48,831 | |
| | 377,000 | | | e | | Bumitama Agri Ltd | | | 281 | |
| | 682,457 | | | | | Bunge Ltd | | | 56,037 | |
| | 430,192 | | | | | C&C Group plc | | | 2,515 | |
| | 39,989 | | | | | Calavo Growers, Inc | | | 1,210 | |
| | 92,700 | | | | | Calbee, Inc | | | 2,251 | |
| | 48,368 | | | | | Cal-Maine Foods, Inc | | | 2,913 | |
| | 365,388 | | | e | | Campbell Soup Co | | | 15,814 | |
COLLEGE RETIREMENT EQUITIES FUND - Stock Account
| | | | | | | | VALUE | |
| SHARES | | | | | COMPANY | | (000) | |
| | 14,000 | | | | | Carlsberg AS (Class B) | | $ | 1,549 | |
| | 160,000 | | | | | Carlsberg Brewery-Malay BHD | | | 596 | |
| | 68,465 | | | | | Casa Grande S.A. | | | 200 | |
| | 48,154 | | | | | Cermaq ASA | | | 857 | |
| | 592,000 | | | e | | Changshouhua Food Co Ltd | | | 763 | |
| | 3,090,800 | | | | | Charoen Pokphand Foods PCL | | | 3,020 | |
| | 2,769,310 | | | | | China Agri-Industries Holdings Ltd | | | 1,384 | |
| | 967,500 | | | *,e | | China Huiyuan Juice Group Ltd | | | 622 | |
| | 2,297,900 | | | | | China Mengniu Dairy Co Ltd | | | 10,929 | |
| | 10,059,000 | | | *,e | | China Modern Dairy Holdings | | | 5,458 | |
| | 5,760,000 | | | | | China Starch Holdings Ltd | | | 165 | |
| | 1,762,000 | | | *,e | | China Yurun Food Group Ltd | | | 1,134 | |
| | 177,929 | | | * | | Chiquita Brands International, Inc | | | 2,082 | |
| | 311,260 | | | | | Cia Cervecerias Unidas S.A. | | | 3,729 | |
| | 9,398 | | | | | CJ CheilJedang Corp | | | 2,470 | |
| | 67,016 | | | | | Clover Industries Ltd | | | 116 | |
| | 282,566 | | | | | Coca-Cola Amatil Ltd | | | 3,040 | |
| | 28,015 | | | | | Coca-Cola Bottling Co Consolidated | | | 2,050 | |
| | 179,695 | | | | | Coca-Cola Central Japan Co Ltd | | | 3,733 | |
| | 12,443,259 | | | | | Coca-Cola Co | | | 514,031 | |
| | 134,505 | | | | | Coca-Cola Embonor S.A. | | | 276 | |
| | 1,121,306 | | | | | Coca-Cola Enterprises, Inc | | | 49,483 | |
| | 492,687 | | | | | Coca-Cola Femsa S.A. de C.V. | | | 5,959 | |
| | 277,392 | | | | | Coca-Cola HBC AG. | | | 8,119 | |
| | 180,023 | | | | | Coca-Cola Icecek AS | | | 4,336 | |
| | 173,027 | | | e | | Coca-Cola West Japan Co Ltd | | | 3,665 | |
| | 10,295,700 | | | *,e | | Cofco International Ltd | | | 4,376 | |
| | 1,216,501 | | | | | ConAgra Foods, Inc | | | 40,996 | |
| | 1,274,509 | | | * | | Constellation Brands, Inc (Class A) | | | 89,700 | |
| | 88,676 | | | | | Corbion NV | | | 1,881 | |
| | 193,342 | | | | | Cott Corp | | | 1,556 | |
| | 35,132 | | | * | | Craft Brewers Alliance, Inc | | | 577 | |
| | 1,787 | | | | | Crown Confectionery Co Ltd | | | 464 | |
| | 2,160 | | | | | Dae Han Flour Mills Co Ltd | | | 314 | |
| | 56,460 | | | | | Daesang Corp | | | 2,059 | |
| | 162,676 | | | | | Dairy Crest Group plc | | | 1,455 | |
| | 705,820 | | | * | | Darling International, Inc | | | 14,738 | |
| | 343,174 | | | | | Davide Campari-Milano S.p.A. | | | 2,865 | |
| | 547,537 | | | * | | Dean Foods Co | | | 9,412 | |
| | 215,843 | | | | | Devro plc | | | 1,029 | |
| | 1,984,462 | | | | | Diageo plc | | | 65,762 | |
| | 88,426 | | | *,e | | Diamond Foods, Inc | | | 2,285 | |
| | 2,710 | | | | | Dongwon F&B Co Ltd | | | 339 | |
| | 2,650 | | | | | Dongwon Industries Co Ltd | | | 796 | |
| | 409,219 | | | | | Dr Pepper Snapple Group, Inc | | | 19,937 | |
| | 10,000 | | | | | Dutch Lady Milk Industries BHD | | | 144 | |
| | 29,100 | | | | | Dydo Drinco, Inc | | | 1,221 | |
| | 1,214,000 | | | *,e,m | | Dynasty Fine Wines Group Ltd | | | 2 | |
COLLEGE RETIREMENT EQUITIES FUND - Stock Account
| | | | | | | | VALUE | |
| SHARES | | | | | COMPANY | | (000) | |
| | 7,000 | | | * | | East Asiatic Co Ltd AS | | $ | 103 | |
| | 90,612 | | | | | Ebro Puleva S.A. | | | 2,124 | |
| | 137,854 | | | | | Embotelladora Andina S.A. | | | 632 | |
| | 370,558 | | | | | Embotelladoras Arca SAB de C.V. | | | 2,317 | |
| | 4,745 | | | | | Emmi AG. | | | 1,455 | |
| | 4,725,900 | | | * | | Emperador, Inc | | | 1,139 | |
| | 6,408,492 | | | | | Empresas Iansa S.A. | | | 213 | |
| | 203,464 | | | | | Ezaki Glico Co Ltd | | | 2,301 | |
| | 22,044 | | | * | | Farmer Bros Co | | | 513 | |
| | 2,081,900 | | | | | Felda Global Ventures Holdings BHD | | | 2,856 | |
| | 654,000 | | | e | | First Resources Ltd | | | 1,100 | |
| | 464,947 | | | | | Flowers Foods, Inc | | | 9,982 | |
| | 3,744,433 | | | | | Fomento Economico Mexicano S.A. de C.V. | | | 36,250 | |
| | 147,286 | | | | | Fresh Del Monte Produce, Inc | | | 4,168 | |
| | 72,773 | | | | | Fuji Oil Co Ltd | | | 1,084 | |
| | 18,832 | | | | | Fujicco Co Ltd | | | 213 | |
| | 150,000 | | | e | | Fujiya Co Ltd | | | 284 | |
| | 1,987,526 | | | | | General Mills, Inc | | | 99,197 | |
| | 215,600 | | | | | Genting Plantations BHD | | | 728 | |
| | 581,500 | | | * | | GFPT PCL | | | 227 | |
| | 171,185 | | | | | Glanbia plc | | | 2,657 | |
| | 7,995 | | | | | GlaxoSmithKline Consumer Healthcare Ltd | | | 575 | |
| | 2,566,000 | | | *,e | | Global Bio-Chem Technology Group Co Ltd | | | 199 | |
| | 3,608,000 | | | e | | GMG Global Ltd | | | 289 | |
| | 1,522,354 | | | e | | Golden Agri-Resources Ltd | | | 659 | |
| | 4,749,688 | | | | | Goodman Fielder Ltd | | | 2,910 | |
| | 220,946 | | | | | GrainCorp Ltd-A | | | 1,678 | |
| | 998,517 | | | | | Great Wall Enterprise Co | | | 886 | |
| | 873,720 | | | *,e | | Green Mountain Coffee Roasters, Inc | | | 66,036 | |
| | 1,416,040 | | | | | Greencore Group plc | | | 5,229 | |
| | 8,711 | | | | | Griffin Land & Nurseries, Inc (Class A) | | | 291 | |
| | 1,301,818 | | | | | Groupe Danone | | | 93,916 | |
| | 1,837,028 | | | e | | Grupo Bimbo S.A. de C.V. (Series A) | | | 5,656 | |
| | 392,200 | | | | | Grupo Herdez SAB de C.V. | | | 1,396 | |
| | 90,000 | | | | | Grupo Lala SAB de C.V. | | | 199 | |
| | 1,022,000 | | | e | | Guangdong Land Holdings Ltd | | | 224 | |
| | 378,386 | | | * | | Hain Celestial Group, Inc | | | 34,350 | |
| | 225,000 | | | | | Hap Seng Plantations Holdings BHD | | | 184 | |
| | 54,175 | | | * | | Harim & Co Ltd | | | 236 | |
| | 121,658 | | | | | Heineken Holding NV | | | 7,701 | |
| | 86,650 | | | | | Heineken NV | | | 5,856 | |
| | 1,728,022 | | | | | Hershey Co | | | 168,016 | |
| | 618,250 | | | | | Hey Song Corp | | | 725 | |
| | 714,278 | | | | | Hillshire Brands Co | | | 23,885 | |
| | 16,320 | | | | | Hite Holdings Co Ltd | | | 180 | |
| | 72,333 | | | | | HKScan Oyj | | | 374 | |
| | 24,200 | | | | | Hokuto Corp | | | 454 | |
| | 152,045 | | | | | Hormel Foods Corp | | | 6,868 | |
COLLEGE RETIREMENT EQUITIES FUND - Stock Account
| | | | | | | | VALUE | |
| SHARES | | | | | COMPANY | | (000) | |
| | 73,952 | | | | | House Foods Corp | | $ | 1,117 | |
| | 327,371 | | | e | | Illovo Sugar Ltd | | | 869 | |
| | 1,062,660 | | | | | Imperial Tobacco Group plc | | | 41,197 | |
| | 619,688 | | | | | InBev NV | | | 65,895 | |
| | 735,978 | | | e | | Indofood Agri Resources Ltd | | | 517 | |
| | 2,794,200 | | | | | Indofood CBP Sukses Makmur Tbk | | | 2,346 | |
| | 336,883 | | | | | Ingredion, Inc | | | 23,063 | |
| | 73,428 | | | * | | Inventure Foods, Inc | | | 974 | |
| | 5,825,176 | | | | | IOI Corp BHD | | | 8,384 | |
| | 2,977,364 | | | | | ITC Ltd | | | 15,504 | |
| | 62,700 | | | | | Ito En Ltd | | | 1,312 | |
| | 360,000 | | | e | | Itoham Foods, Inc | | | 1,567 | |
| | 79,241 | | | | | J&J Snack Foods Corp | | | 7,020 | |
| | 308,112 | | | | | J.M. Smucker Co | | | 31,927 | |
| | 2,043,500 | | | | | Japan Tobacco, Inc | | | 66,493 | |
| | 2,707,921 | | | | | JBS S.A. | | | 10,086 | |
| | 29,520 | | | | | Jinro Ltd | | | 618 | |
| | 33,628 | | | | | John B. Sanfilippo & Son, Inc | | | 830 | |
| | 305,944 | | | e | | J-Oil Mills, Inc | | | 823 | |
| | 588,125 | | | | | Juhayna Food Industries | | | 1,328 | |
| | 87,573 | | | e | | Kagome Co Ltd | | | 1,432 | |
| | 12,200 | | | | | Kameda Seika Co Ltd | | | 323 | |
| | 436,931 | | | | | Kellogg Co | | | 26,683 | |
| | 58,516 | | | * | | Kernel Holding S.A. | | | 740 | |
| | 654,381 | | | | | Kerry Group plc (Class A) | | | 45,462 | |
| | 39,000 | | | | | KEY Coffee, Inc | | | 586 | |
| | 1,972,000 | | | | | Khon Kaen Sugar Industry PCL (Foreign) | | | 722 | |
| | 39,671 | | | | | Kikkoman Corp | | | 750 | |
| | 1,084,865 | | | e | | Kirin Brewery Co Ltd | | | 15,624 | |
| | 94,664 | | | | | Koninklijke Wessanen NV | | | 370 | |
| | 2,421,439 | | | | | Kraft Foods Group, Inc | | | 130,564 | |
| | 159,083 | | | | | KT&G Corp | | | 11,236 | |
| | 509,473 | | | | | Kuala Lumpur Kepong BHD | | | 3,873 | |
| | 2,685 | | | | | KWS Saat AG. | | | 924 | |
| | 700,000 | | | | | Labixiaoxin Snacks Group Ltd | | | 469 | |
| | 62,040 | | | | | Lancaster Colony Corp | | | 5,469 | |
| | 183,021 | | | | | Lance, Inc | | | 5,256 | |
| | 46,187 | | | | | Leroy Seafood Group ASA | | | 1,353 | |
| | 342,987 | | | | | Lien Hwa Industrial Corp | | | 223 | |
| | 15,883 | | | e | | Lifeway Foods, Inc | | | 254 | |
| | 38,626 | | | e | | Limoneira Co | | | 1,027 | |
| | 1,422 | | | | | Lindt & Spruengli AG. | | | 6,410 | |
| | 48 | | | | | Lindt & Spruengli AG. (Registered) | | | 2,588 | |
| | 1,531,734 | | | | | Lorillard, Inc | | | 77,628 | |
| | 916 | | | | | Lotte Chilsung Beverage Co Ltd | | | 1,324 | |
| | 704 | | | | | Lotte Confectionery Co Ltd | | | 1,275 | |
| | 1,073 | | | | | Lotte Samkang Co Ltd | | | 759 | |
| | 99,200 | | | | | M Dias Branco S.A. | | | 4,205 | |
COLLEGE RETIREMENT EQUITIES FUND - Stock Account
| | | | | | | | VALUE | |
| SHARES | | | | | COMPANY | | (000) | |
| | 7,627 | | | | | Maeil Dairy Industry Co Ltd | | $ | 324 | |
| | 117,269 | | | e | | Maple Leaf Foods, Inc | | | 1,854 | |
| | 335,700 | | | * | | Marfrig Alimentos S.A. | | | 569 | |
| | 135,000 | | | | | Marudai Food Co Ltd | | | 395 | |
| | 512,000 | | | | | Maruha Nichiro Holdings, Inc | | | 892 | |
| | 194,208 | | | | | McCormick & Co, Inc | | | 13,385 | |
| | 75,219 | | | | | McLeod Russel India Ltd | | | 391 | |
| | 924,656 | | | | | Mead Johnson Nutrition Co | | | 77,449 | |
| | 65,900 | | | e | | Megmilk Snow Brand Co Ltd | | | 830 | |
| | 14,320 | | | | | MEIJI Holdings Co Ltd | | | 920 | |
| | 130,334 | | | | | MHP SA (GDR) | | | 2,222 | |
| | 251,600 | | | * | | Minerva S.A. | | | 1,226 | |
| | 276,655 | | | | | Mitsui Sugar Co Ltd | | | 1,063 | |
| | 114,197 | | | | | Molson Coors Brewing Co (Class B) | | | 6,412 | |
| | 3,859,919 | | | | | Mondelez International, Inc | | | 136,255 | |
| | 1,593,994 | | | *,e | | Monster Beverage Corp | | | 108,025 | |
| | 466,302 | | | | | Morinaga & Co Ltd | | | 958 | |
| | 533,000 | | | | | Morinaga Milk Industry Co Ltd | | | 1,581 | |
| | 17,533 | | | | | Muhak Co Ltd | | | 319 | |
| | 1,728,489 | | | * | | Multiexport Foods S.A. | | | 308 | |
| | 543,000 | | | | | Namchow Chemical Industrial Ltd | | | 830 | |
| | 919 | | | | | Namyang Dairy Products Co Ltd | | | 820 | |
| | 35,929 | | | * | | National Beverage Corp | | | 724 | |
| | 5,664 | | | e | | Naturex | | | 454 | |
| | 6,674 | | | | | Nestle India Ltd | | | 571 | |
| | 3,296,719 | | | | | Nestle S.A. | | | 241,617 | |
| | 444,000 | | | | | Nichirei Corp | | | 2,265 | |
| | 291,000 | | | | | Nippon Beet Sugar Manufacturing Co Ltd | | | 514 | |
| | 333,000 | | | | | Nippon Flour Mills Co Ltd | | | 1,641 | |
| | 231,705 | | | | | Nippon Meat Packers, Inc | | | 3,982 | |
| | 314,766 | | | * | | Nippon Suisan Kaisha Ltd | | | 716 | |
| | 141,000 | | | | | Nisshin Oillio Group Ltd | | | 458 | |
| | 51,400 | | | e | | Nisshin Seifun Group, Inc | | | 532 | |
| | 15,195 | | | | | Nissin Food Products Co Ltd | | | 641 | |
| | 3,995 | | | | | Nong Shim Co Ltd | | | 951 | |
| | 3,126 | | | | | Nong Shim Holdings Co Ltd | | | 234 | |
| | 8,225 | | | | | Nong Woo Bio Co Ltd | | | 179 | |
| | 166,195 | | | | | Nutreco NV | | | 8,264 | |
| | 290,900 | | | | | Oldtown BHD | | | 231 | |
| | 101,662 | | | *,e | | Omega Protein Corp | | | 1,249 | |
| | 3,736 | | | | | Orion Corp | | | 3,364 | |
| | 85,932 | | | | | Orkla ASA | | | 672 | |
| | 45,304 | | | | | Osem Investments Ltd | | | 1,106 | |
| | 3,359 | | | | | Ottogi Corp | | | 1,268 | |
| | 6,818,209 | | | e | | PAN Fish ASA | | | 8,317 | |
| | 7,408,632 | | | | | PepsiCo, Inc | | | 614,472 | |
| | 1,247,000 | | | | | Pepsi-Cola Products Philippine | | | 127 | |
| | 766,571 | | | | | Perdigao S.A. | | | 16,002 | |
COLLEGE RETIREMENT EQUITIES FUND - Stock Account
| | | | | | | | VALUE | |
| SHARES | | | | | COMPANY | | (000) | |
| | 47,850 | | | | | Pernod-Ricard S.A. | | $ | 5,452 | |
| | 72,987 | | | *,m | | Pescanova S.A. | | | 1 | |
| | 851,000 | | | e | | Petra Foods Ltd | | | 2,171 | |
| | 1,400 | | | | | Philip Morris CR | | | 746 | |
| | 6,142,880 | | | | | Philip Morris International, Inc | | | 535,229 | |
| | 832,520 | | | * | | Pilgrim’s Pride Corp | | | 13,528 | |
| | 47,539 | | | | | Pinar SUT Mamulleri Sanayii AS | | | 389 | |
| | 79,910 | | | | | Pinnacle Foods, Inc | | | 2,194 | |
| | 126,877 | | | * | | Post Holdings, Inc | | | 6,251 | |
| | 773,720 | | | | | PPB Group BHD | | | 3,818 | |
| | 428,643 | | | *,e | | Premier Foods plc | | | 887 | |
| | 34,900 | | | | | Premium Brands Holdings Corp | | | 745 | |
| | 180,000 | | | | | Prima Meat Packers Ltd | | | 332 | |
| | 1,403,424 | | | | | PT Astra Agro Lestari Tbk | | | 2,897 | |
| | 5,806,500 | | | *,m | | PT Austindo Nusantara Jaya | | | 716 | |
| | 2,761,000 | | | | | PT Bisi International | | | 127 | |
| | 3,839,500 | | | | | PT BW Plantation Tbk | | | 420 | |
| | 7,576,500 | | | | | PT Charoen Pokphand Indonesia Tbk | | | 2,108 | |
| | 516,500 | | | | | PT Gudang Garam Tbk | | | 1,786 | |
| | 15,608,200 | | | | | PT Indofood Sukses Makmur Tbk | | | 8,482 | |
| | 9,196,500 | | | | | PT Japfa Comfeed Indonesia Tbk | | | 924 | |
| | 1,050,000 | | | | | PT Malindo Feedmill Tbk | | | 275 | |
| | 12,006,500 | | | | | PT Perusahaan Perkebunan London Sumatra Indonesia Tbk | | | 1,908 | |
| | 5,198,500 | | | | | PT Salim Ivomas Pratama Tbk | | | 334 | |
| | 1,512,500 | | | | | PT Sampoerna Agro Tbk | | | 249 | |
| | 2,768,500 | | | | | PT Tunas Baru Lampung Tbk | | | 107 | |
| | 116,800 | | | | | Q.P. Corp | | | 1,622 | |
| | 135,000 | | | e | | QAF Ltd | | | 88 | |
| | 852,700 | | | | | QL Resources BHD | | | 1,061 | |
| | 19,517 | | | | | Radico Khaitan Ltd | | | 45 | |
| | 613,765 | | | e | | Remy Cointreau S.A. | | | 51,557 | |
| | 1,036,017 | | | | | Reynolds American, Inc | | | 51,791 | |
| | 276,500 | | | | | Rimbunan Sawit BHD | | | 66 | |
| | 11,139 | | | | | Royal UNIBREW AS | | | 1,512 | |
| | 2,455,850 | | | | | SABMiller plc | | | 126,415 | |
| | 73,896 | | | | | SABMiller plc (Johannesburg) | | | 3,756 | |
| | 32,655 | | | | | Sakata Seed Corp | | | 414 | |
| | 2,750 | | | | | Samyang Corp | | | 116 | |
| | 12,063 | | | | | Samyang Holdings Corp | | | 854 | |
| | 2,486 | | | *,m | | San Miguel Corp (New) | | | 2 | |
| | 79,460 | | | | | San Miguel Pure Foods Co Inc | | | 427 | |
| | 117,152 | | | | | Sanderson Farms, Inc | | | 8,474 | |
| | 126,400 | | | | | Sao Martinho S.A. | | | 1,538 | |
| | 2,104,000 | | | | | Sapporo Holdings Ltd | | | 8,849 | |
| | 168,620 | | | | | Saputo, Inc | | | 7,681 | |
| | 29,098 | | | | | Schouw & Co | | | 1,189 | |
| | 1,225 | | | * | | Seaboard Corp | | | 3,424 | |
| | 32,633 | | | * | | Seneca Foods Corp | | | 1,041 | |
COLLEGE RETIREMENT EQUITIES FUND - Stock Account
| | | | | | | | VALUE | |
| SHARES | | | | | COMPANY | | (000) | |
| | 612,700 | | | * | | Shanghai Dajiang Group | | $ | 235 | |
| | 1,188,000 | | | e | | Shenguan Holdings Group Ltd | | | 531 | |
| | 160,000 | | | | | Showa Sangyo Co Ltd | | | 487 | |
| | 929,268 | | | * | | Shree Renuka Sugars Ltd | | | 301 | |
| | 28,700 | | | | | Silla Co Ltd | | | 662 | |
| | 159,400 | | | | | SLC Agricola S.A. | | | 1,378 | |
| | 2,626 | | | | | Societa per la Bonifica dei Terreni Ferraresi e Imprese Agricole S.p.A. | | | 126 | |
| | 446,264 | | | * | | SOS Cuetara S.A. | | | 289 | |
| | 430,055 | | | | | Souza Cruz S.A. | | | 4,395 | |
| | 328,362 | | | | | Standard Foods Corp | | | 1,027 | |
| | 86,646 | | | | | Strauss Group Ltd | | | 1,657 | |
| | 426,959 | | | e | | Suedzucker AG. | | | 11,534 | |
| | 143,600 | | | * | | Suntory Beverage & Food Ltd | | | 4,581 | |
| | 1,014,000 | | | e | | Super Coffeemix Manufacturing Ltd | | | 3,061 | |
| | 152,273 | | | | | Swedish Match AB | | | 4,896 | |
| | 217,994 | | | * | | Synlait Milk Ltd | | | 706 | |
| | 55,848 | | | *,e | | Synutra International, Inc | | | 496 | |
| | 19,096 | | | * | | Taisun Enterprise Co Ltd | | | 9 | |
| | 56,096 | | | | | Taiyen Biotech Co Ltd | | | 58 | |
| | 192,000 | | | | | Takara Holdings, Inc | | | 1,792 | |
| | 287,855 | | | | | Tassal Group Ltd | | | 848 | |
| | 156,384 | | | * | | TAT Konserve | | | 181 | |
| | 488,928 | | | | | Tata Tea Ltd | | | 1,271 | |
| | 6,701,319 | | | | | Tate & Lyle plc | | | 89,894 | |
| | 1,970,400 | | | | | TDM BHD | | | 572 | |
| | 164,900 | | | | | Tereos Internacional S.A. | | | 174 | |
| | 499,680 | | | | | TH Plantations BHD | | | 287 | |
| | 882,200 | | | | | Thai Union Frozen Products PCL (ADR) | | | 1,932 | |
| | 600,000 | | | | | Thai Union Frozen Products PCL (Foreign) | | | 1,314 | |
| | 915,200 | | | | | Thai Vegetable Oil PCL | | | 517 | |
| | 2,165,000 | | | e | | Tibet 5100 Water Resources Holdings Ltd | | | 856 | |
| | 2,038,000 | | | | | Tiga Pilar Sejahtera Food Tbk | | | 240 | |
| | 198,256 | | | e | | Tiger Brands Ltd | | | 5,052 | |
| | 5,460,900 | | | e | | Tingyi Cayman Islands Holding Corp | | | 15,804 | |
| | 176,132 | | | | | Tongaat Hulett Ltd | | | 1,909 | |
| | 61,591 | | | e | | Tootsie Roll Industries, Inc | | | 2,004 | |
| | 50,259 | | | | | Toyo Suisan Kaisha Ltd | | | 1,510 | |
| | 123,329 | | | | | Treasury Wine Estates Ltd | | | 532 | |
| | 169,270 | | | * | | TreeHouse Foods, Inc | | | 11,666 | |
| | 14,010 | | | | | TS Corp | | | 376 | |
| | 451,700 | | | | | Tsingtao Brewery Co Ltd | | | 3,828 | |
| | 50,000 | | | | | Ttet Union Corp | | | 104 | |
| | 1,694,350 | | | | | Tyson Foods, Inc (Class A) | | | 56,693 | |
| | 104,690 | | | | | Ulker Biskuvi Sanayi AS | | | 741 | |
| | 2,503,178 | | | | | Unilever NV | | | 100,641 | |
| | 2,361,161 | | | | | Unilever plc | | | 97,152 | |
| | 1,420,800 | | | e | | Uni-President China Holdings Ltd | | | 1,449 | |
COLLEGE RETIREMENT EQUITIES FUND - Stock Account
| | | | | | | | VALUE | |
| SHARES | | | | | COMPANY | | (000) | |
| | 5,211,832 | | | | | Uni-President Enterprises Corp | | $ | 9,405 | |
| | 55,533 | | | * | | United Breweries Ltd | | | 696 | |
| | 4,201 | | | | | United International Enterprises | | | 868 | |
| | 91,178 | | | | | United Spirits Ltd | | | 3,851 | |
| | 91,195 | | | e | | Universal Corp | | | 4,979 | |
| | 3,408,433 | | | | | Universal Robina | | | 8,707 | |
| | 237,344 | | | * | | Vanguarda Agro S.A. | | | 345 | |
| | 151,000 | | | | | Ve Wong Corp | | | 126 | |
| | 210,393 | | | e | | Vector Group Ltd | | | 3,444 | |
| | 5,462 | | | e | | Vilmorin & Cie | | | 730 | |
| | 517,434 | | | | | Vina Concha Y Toro S.A. | | | 971 | |
| | 60,550 | | | e | | Viscofan S.A. | | | 3,444 | |
| | 3,158 | | | | | Vranken - Pommery Monopole | | | 107 | |
| | 6,470,900 | | | e | | Want Want China Holdings Ltd | | | 9,366 | |
| | 30,000 | | | | | Warabeya Nichiyo Co Ltd | | | 543 | |
| | 443,000 | | | | | Wei Chuan Food Corp | | | 780 | |
| | 158,725 | | | * | | WhiteWave Foods Co (Class A) | | | 3,641 | |
| | 3,136,367 | | | e | | Wilmar International Ltd | | | 8,519 | |
| | 91,969 | | | | | Yakult Honsha Co Ltd | | | 4,647 | |
| | 73,735 | | | | | Yamazaki Baking Co Ltd | | | 756 | |
| | 283,953 | | | | | Yantai Changyu Pioneer Wine Co | | | 945 | |
| | 3,204,000 | | | | | Yashili International | | | 1,975 | |
| | | | | | | TOTAL FOOD, BEVERAGE & TOBACCO | | | 5,802,170 | |
| | | | | | | | | | | |
| HEALTH CARE EQUIPMENT & SERVICES - 3.3% | | | | |
| | 79,991 | | | * | | Abaxis, Inc | | | 3,201 | |
| | 6,329,893 | | | | | Abbott Laboratories | | | 242,625 | |
| | 171,369 | | | *,e | | Abiomed, Inc | | | 4,582 | |
| | 113,231 | | | * | | Acadia Healthcare Co, Inc | | | 5,359 | |
| | 186,559 | | | *,e | | Accretive Health, Inc | | | 1,709 | |
| | 238,840 | | | *,e | | Accuray, Inc | | | 2,080 | |
| | 59,177 | | | * | | Addus HomeCare Corp | | | 1,329 | |
| | 461,124 | | | | | Advanced Medical Solutions Group plc | | | 827 | |
| | 2,057,517 | | | | | Aetna, Inc | | | 141,125 | |
| | 237,884 | | | * | | AGFA-Gevaert NV | | | 576 | |
| | 62,626 | | | *,m | | AGFA-Gevaert NV Brussels | | | 0 | ^ |
| | 126,956 | | | * | | Air Methods Corp | | | 7,405 | |
| | 257,958 | | | * | | Al Noor Hospitals Group plc | | | 3,834 | |
| | 143,884 | | | | | Alfresa Holdings Corp | | | 7,142 | |
| | 381,333 | | | * | | Align Technology, Inc | | | 21,793 | |
| | 35,494 | | | * | | Alliance HealthCare Services, Inc | | | 878 | |
| | 777,665 | | | * | | Allscripts Healthcare Solutions, Inc | | | 12,023 | |
| | 34,180 | | | * | | Almost Family, Inc | | | 1,105 | |
| | 231,972 | | | * | | Alphatec Holdings, Inc | | | 466 | |
| | 123,533 | | | * | | Amedisys, Inc | | | 1,807 | |
| | 649,040 | | | | | AmerisourceBergen Corp | | | 45,634 | |
| | 339,577 | | | * | | AMN Healthcare Services, Inc | | | 4,992 | |
| | 101,232 | | | | | Amplifon S.p.A. | | | 562 | |
| | 176,072 | | | * | | Amsurg Corp | | | 8,085 | |
COLLEGE RETIREMENT EQUITIES FUND - Stock Account
| | | | | | | | VALUE | |
| SHARES | | | | | COMPANY | | (000) | |
| | 50,945 | | | | | Analogic Corp | | $ | 4,512 | |
| | 115,550 | | | * | | Angiodynamics, Inc | | | 1,986 | |
| | 93,265 | | | * | | Anika Therapeutics, Inc | | | 3,559 | |
| | 172,225 | | | | | Ansell Ltd | | | 3,179 | |
| | 363,289 | | | *,e | | Antares Pharma, Inc | | | 1,628 | |
| | 73,128 | | | | | Apollo Hospitals Enterprise Ltd | | | 1,119 | |
| | 54,341 | | | | | Arseus NV | | | 2,066 | |
| | 161,749 | | | * | | Arthrocare Corp | | | 6,509 | |
| | 27,400 | | | | | Asahi Intecc Co Ltd | | | 1,024 | |
| | 126,405 | | | *,e | | athenahealth, Inc | | | 17,001 | |
| | 67,717 | | | * | | AtriCure, Inc | | | 1,265 | |
| | 5,643 | | | | | Atrion Corp | | | 1,672 | |
| | 49,966 | | | *,e | | Balda AG. | | | 336 | |
| | 2,635,250 | | | | | Bangkok Chain Hospital PCL | | | 485 | |
| | 392,800 | | | | | Bangkok Dusit Medical Services PCL | | | 1,412 | |
| | 448,005 | | | | | Bard (C.R.), Inc | | | 60,006 | |
| | 1,318,043 | | | | | Baxter International, Inc | | | 91,670 | |
| | 554,749 | | | | | Becton Dickinson & Co | | | 61,294 | |
| | 104,982 | | | *,e | | Biolase Technology, Inc | | | 297 | |
| | 81,414 | | | *,e | | Bio-Reference Labs, Inc | | | 2,079 | |
| | 228,511 | | | * | | BioScrip, Inc | | | 1,691 | |
| | 1,132,000 | | | e | | Biosensors International Group Ltd | | | 750 | |
| | 36,600 | | | | | BML, Inc | | | 1,239 | |
| | 5,129,521 | | | * | | Boston Scientific Corp | | | 61,657 | |
| | 83,160 | | | * | | Brookdale Senior Living, Inc | | | 2,260 | |
| | 516,100 | | | | | Bumrungrad Hospital PCL | | | 1,381 | |
| | 136,283 | | | | | Cantel Medical Corp | | | 4,621 | |
| | 88,271 | | | * | | Capital Senior Living Corp | | | 2,118 | |
| | 1,150,318 | | | | | Cardinal Health, Inc | | | 76,853 | |
| | 92,231 | | | * | | Cardiovascular Systems, Inc | | | 3,163 | |
| | 1,534,511 | | | * | | CareFusion Corp | | | 61,104 | |
| | 41,594 | | | | | Carl Zeiss Meditec AG. | | | 1,389 | |
| | 1,246 | | | *,e | | Carmat | | | 200 | |
| | 1,245,988 | | | * | | Catamaran Corp | | | 59,159 | |
| | 259,139 | | | * | | Catamaran Corp (Toronto) | | | 12,307 | |
| | 5,802 | | | * | | Cegedim S.A. | | | 183 | |
| | 36,028 | | | e | | Celesio AG. | | | 1,142 | |
| | 280,255 | | | * | | Centene Corp | | | 16,521 | |
| | 1,231,488 | | | * | | Cerner Corp | | | 68,643 | |
| | 208,200 | | | *,e | | Cerus Corp | | | 1,343 | |
| | 65,766 | | | * | | CHA Bio & Diostech Co Ltd | | | 681 | |
| | 117,333 | | | | | CHC Healthcare Group | | | 301 | |
| | 63,690 | | | e | | Chemed Corp | | | 4,880 | |
| | 44,327 | | | *,e | | Chindex International, Inc | | | 773 | |
| | 1,174,900 | | | | | Cigna Corp | | | 102,780 | |
| | 58,623 | | | | | Cochlear Ltd | | | 3,089 | |
| | 187,809 | | | | | Coloplast AS | | | 12,451 | |
| | 358,082 | | | * | | Community Health Systems, Inc | | | 14,062 | |
COLLEGE RETIREMENT EQUITIES FUND - Stock Account
| | | | | | | | VALUE | |
| SHARES | | | | | COMPANY | | (000) | |
| | 393,522 | | | | | Compagnie Generale d’Optique Essilor International S.A. | | $ | 41,874 | |
| | 35,988 | | | | | Computer Programs & Systems, Inc | | | 2,224 | |
| | 121,809 | | | | | Conmed Corp | | | 5,177 | |
| | 210,705 | | | | | Cooper Cos, Inc | | | 26,094 | |
| | 800,000 | | | e | | Cordlife Group Ltd | | | 757 | |
| | 60,614 | | | * | | Corvel Corp | | | 2,831 | |
| | 2,338,618 | | | | | Covidien plc | | | 159,260 | |
| | 103,933 | | | * | | Cross Country Healthcare, Inc | | | 1,037 | |
| | 306,908 | | | | | Cruz Blanca Salud S.A. | | | 269 | |
| | 108,212 | | | | | CryoLife, Inc | | | 1,200 | |
| | 58,487 | | | *,e | | Cutera, Inc | | | 595 | |
| | 138,821 | | | * | | Cyberonics, Inc | | | 9,094 | |
| | 90,622 | | | * | | Cynosure, Inc (Class A) | | | 2,418 | |
| | 436,065 | | | * | | DaVita, Inc | | | 27,633 | |
| | 285,988 | | | | | Dentsply International, Inc | | | 13,865 | |
| | 52,482 | | | *,e | | Derma Sciences, Inc | | | 568 | |
| | 226,868 | | | * | | DexCom, Inc | | | 8,033 | |
| | 289,500 | | | | | Diagnosticos da America S.A. | | | 1,772 | |
| | 26,093 | | | e | | DiaSorin S.p.A. | | | 1,224 | |
| | 7,351 | | | | | Draegerwerk AG. | | | 961 | |
| | 6,019 | | | | | Draegerwerk AG. & Co KGaA | | | 639 | |
| | 331,380 | | | * | | Edwards Lifesciences Corp | | | 21,792 | |
| | 16,400 | | | | | Eiken Chemical Co Ltd | | | 310 | |
| | 71,181 | | | e | | Elekta AB (B Shares) | | | 1,089 | |
| | 188,271 | | | * | | Emeritus Corp | | | 4,072 | |
| | 198,826 | | | * | | Endologix, Inc | | | 3,468 | |
| | 72,149 | | | | | Ensign Group, Inc | | | 3,194 | |
| | 96,641 | | | * | | Envision Healthcare Holdings, Inc | | | 3,433 | |
| | 34,480 | | | * | | Exactech, Inc | | | 819 | |
| | 99,527 | | | * | | ExamWorks Group, Inc | | | 2,973 | |
| | 398,000 | | | | | Excelsior Medical Co Ltd | | | 791 | |
| | 3,897,778 | | | * | | Express Scripts Holding Co | | | 273,780 | |
| | 202,831 | | | e | | Extendicare, Inc | | | 1,302 | |
| | 739,800 | | | | | Faber Group BHD | | | 576 | |
| | 1,384,700 | | | | | Fisher & Paykel Healthcare Corp | | | 4,388 | |
| | 157,433 | | | * | | Five Star Quality Care, Inc | | | 864 | |
| | 198,200 | | | | | Fleury S.A. | | | 1,546 | |
| | 135,136 | | | | | Fresenius Medical Care AG. | | | 9,639 | |
| | 126,043 | | | | | Fresenius SE | | | 19,382 | |
| | 9,897 | | | | | Galenica AG. | | | 9,963 | |
| | 109,750 | | | *,e | | GenMark Diagnostics, Inc | | | 1,461 | |
| | 169,821 | | | * | | Gentiva Health Services, Inc | | | 2,107 | |
| | 55,608 | | | | | Getinge AB (B Shares) | | | 1,906 | |
| | 63,000 | | | | | Ginko International Co Ltd | | | 1,190 | |
| | 19,293 | | | * | | Given Imaging Ltd | | | 580 | |
| | 172,437 | | | *,e | | Globus Medical, Inc | | | 3,480 | |
| | 400,620 | | | | | GN Store Nord | | | 9,846 | |
| | 18,033,986 | | | e | | Golden Meditech Co Ltd | | | 1,632 | |
COLLEGE RETIREMENT EQUITIES FUND - Stock Account
| | | | | | | | VALUE | |
| SHARES | | | | | COMPANY | | (000) | |
| | 96,406 | | | * | | Greatbatch, Inc | | $ | 4,265 | |
| | 46,500 | | | | | Green Hospital Supply, Inc | | | 1,806 | |
| | 2,982 | | | | | Guerbet | | | 445 | |
| | 170,084 | | | * | | Haemonetics Corp | | | 7,166 | |
| | 127,028 | | | * | | Hanger Orthopedic Group, Inc | | | 4,997 | |
| | 698,000 | | | | | Hartalega Holdings BHD | | | 1,541 | |
| | 1,138,112 | | | * | | HCA Holdings, Inc | | | 54,299 | |
| | 573,810 | | | * | | Health Management Associates, Inc (Class A) | | | 7,517 | |
| | 174,610 | | | * | | Health Net, Inc | | | 5,181 | |
| | 555,197 | | | | | Healthsouth Corp | | | 18,499 | |
| | 72,172 | | | * | | HealthStream, Inc | | | 2,365 | |
| | 118,945 | | | *,e | | Healthways, Inc | | | 1,826 | |
| | 52,550 | | | * | | HeartWare International, Inc | | | 4,938 | |
| | 284,013 | | | * | | Henry Schein, Inc | | | 32,451 | |
| | 299,092 | | | | | Hill-Rom Holdings, Inc | | | 12,364 | |
| | 9,348 | | | | | Hitachi Medical Corp | | | 158 | |
| | 279,872 | | | * | | HMS Holdings Corp | | | 6,361 | |
| | 19,600 | | | | | Hogy Medical Co Ltd | | | 1,032 | |
| | 2,341,764 | | | *,e | | Hologic, Inc | | | 52,338 | |
| | 539,129 | | | | | Humana, Inc | | | 55,649 | |
| | 63,583 | | | * | | ICU Medical, Inc | | | 4,051 | |
| | 119,318 | | | *,e | | Idexx Laboratories, Inc | | | 12,692 | |
| | 3,105,000 | | | * | | IHH Healthcare BHD | | | 3,662 | |
| | 18,903 | | | * | | Infinitt Healthcare Co Ltd | | | 129 | |
| | 170,155 | | | * | | Insulet Corp | | | 6,313 | |
| | 87,687 | | | * | | Integra LifeSciences Holdings Corp | | | 4,184 | |
| | 570,000 | | | * | | International Healthway Corp Ltd | | | 154 | |
| | 129,751 | | | * | | Intuitive Surgical, Inc | | | 49,835 | |
| | 125,201 | | | | | Invacare Corp | | | 2,906 | |
| | 153,897 | | | * | | Inverness Medical Innovations, Inc | | | 5,571 | |
| | 25,315 | | | * | | Ion Beam Applications | | | 272 | |
| | 54,110 | | | * | | IPC The Hospitalist Co, Inc | | | 3,214 | |
| | 6,075 | | | * | | i-SENS Inc | | | 240 | |
| | 87,000 | | | | | Jeol Ltd | | | 412 | |
| | 216,758 | | | | | Kindred Healthcare, Inc | | | 4,279 | |
| | 1,205,200 | | | | | Kossan Rubber Industries | | | 1,589 | |
| | 1,227,900 | | | | | KPJ Healthcare BHD | | | 1,454 | |
| | 202,169 | | | *,e | | Laboratory Corp of America Holdings | | | 18,472 | |
| | 30,329 | | | | | Landauer, Inc | | | 1,596 | |
| | 14,992 | | | *,e | | LDR Holding Corp | | | 354 | |
| | 32,900 | | | e | | Leisureworld Senior Care Corp | | | 354 | |
| | 48,093 | | | * | | LHC Group, Inc | | | 1,156 | |
| | 1,301,911 | | | | | Life Healthcare Group Holdings Pte Ltd | | | 5,200 | |
| | 90,045 | | | * | | LifePoint Hospitals, Inc | | | 4,758 | |
| | 104,287 | | | * | | Magellan Health Services, Inc | | | 6,248 | |
| | 6,400 | | | e | | Mani, Inc | | | 218 | |
| | 155,700 | | | * | | Masimo Corp | | | 4,551 | |
| | 1,487,615 | | | | | McKesson Corp | | | 240,101 | |
COLLEGE RETIREMENT EQUITIES FUND - Stock Account
| | | | | | | | VALUE | |
| SHARES | | | | | COMPANY | | (000) | |
| | 21,146 | | | | | MD Medical Group Investments plc (ADR) | | $ | 239 | |
| | 320,875 | | | * | | MedAssets, Inc | | | 6,363 | |
| | 67,013 | | | | | Medica | | | 1,750 | |
| | 47,423 | | | *,e | | Medical Action Industries, Inc | | | 406 | |
| | 64,100 | | | e | | Medical Facilities Corp | | | 1,083 | |
| | 543,136 | | | | | Mediceo Paltac Holdings Co Ltd | | | 7,170 | |
| | 342,774 | | | | | Mediclinic International Ltd | | | 2,486 | |
| | 174,232 | | | * | | Medidata Solutions, Inc | | | 10,553 | |
| | 3,245,137 | | | | | Medtronic, Inc | | | 186,238 | |
| | 217,634 | | | * | | Merge Healthcare, Inc | | | 505 | |
| | 131,992 | | | e | | Meridian Bioscience, Inc | | | 3,502 | |
| | 164,545 | | | * | | Merit Medical Systems, Inc | | | 2,590 | |
| | 14,600 | | | | | Message Co Ltd | | | 450 | |
| | 137,091 | | | | | Metlifecare Ltd | | | 447 | |
| | 210,500 | | | | | Microlife Corp | | | 573 | |
| | 719,000 | | | e | | Microport Scientific Corp | | | 471 | |
| | 77,606 | | | | | Miraca Holdings, Inc | | | 3,661 | |
| | 120,685 | | | * | | Molina Healthcare, Inc | | | 4,194 | |
| | 43,957 | | | * | | MWI Veterinary Supply, Inc | | | 7,499 | |
| | 21,136 | | | | | Nagaileben Co Ltd | | | 319 | |
| | 45,404 | | | | | National Healthcare Corp | | | 2,448 | |
| | 31,288 | | | * | | National Research Corp | | | 589 | |
| | 163,393 | | | * | | Natus Medical, Inc | | | 3,676 | |
| | 123,440 | | | * | | Neogen Corp | | | 5,641 | |
| | 1,093,881 | | | | | Network Healthcare Holdings Ltd | | | 2,715 | |
| | 159,900 | | | | | Nichii Gakkan Co | | | 1,282 | |
| | 66,100 | | | | | Nihon Kohden Corp | | | 2,307 | |
| | 140,767 | | | | | Nikkiso Co Ltd | | | 1,775 | |
| | 430,500 | | | e | | Nipro Corp | | | 3,897 | |
| | 213,718 | | | | | NMC Health plc | | | 1,550 | |
| | 226,057 | | | | | Nobel Biocare Holding AG. | | | 3,540 | |
| | 204,762 | | | * | | NuVasive, Inc | | | 6,620 | |
| | 195,869 | | | * | | NxStage Medical, Inc | | | 1,959 | |
| | 308,900 | | | | | Odontoprev S.A. | | | 1,287 | |
| | 3,039,502 | | | * | | Olympus Corp | | | 96,403 | |
| | 570,018 | | | e | | Omnicare, Inc | | | 34,406 | |
| | 120,130 | | | * | | Omnicell, Inc | | | 3,067 | |
| | 209,797 | | | * | | OraSure Technologies, Inc | | | 1,320 | |
| | 144,018 | | | | | Oriola-KD Oyj (B Shares) | | | 505 | |
| | 77,720 | | | | | Orpea | | | 4,521 | |
| | 77,256 | | | * | | Orthofix International NV | | | 1,763 | |
| | 15,294 | | | * | | Osstem Implant Co Ltd | | | 335 | |
| | 248,531 | | | e | | Owens & Minor, Inc | | | 9,086 | |
| | 15,980 | | | *,e | | Oxford Immunotec Global plc | | | 310 | |
| | 57,490 | | | | | Pacific Hospital Supply Co Ltd | | | 191 | |
| | 44,277 | | | | | Paramount Bed Holdings Co Ltd | | | 1,483 | |
| | 190,373 | | | | | Patterson Cos, Inc | | | 7,843 | |
| | 528,174 | | | * | | Pediatrix Medical Group, Inc | | | 28,194 | |
COLLEGE RETIREMENT EQUITIES FUND - Stock Account
| | | | | | | | VALUE | |
| SHARES | | | | | COMPANY | | (000) | |
| | 93,475 | | | | | Pharmaniaga BHD | | $ | 127 | |
| | 114,818 | | | * | | PharMerica Corp | | | 2,469 | |
| | 16,379 | | | | | Phonak Holding AG. | | | 2,209 | |
| | 47,934 | | | *,e | | PhotoMedex, Inc | | | 621 | |
| | 302,000 | | | * | | Pihsiang Machinery Manufacturing Co Ltd | | | 297 | |
| | 738,968 | | | * | | Premier, Inc | | | 27,164 | |
| | 1,014,831 | | | | | Primary Health Care Ltd | | | 4,496 | |
| | 4,400 | | | | | Profarma Distribuidora de Produtos Farmaceuticos S.A. | | | 35 | |
| | 74,653 | | | * | | Providence Service Corp | | | 1,920 | |
| | 221,200 | | | * | | Qualicorp S.A. | | | 2,110 | |
| | 131,350 | | | | | Quality Systems, Inc | | | 2,766 | |
| | 297,497 | | | e | | Quest Diagnostics, Inc | | | 15,928 | |
| | 90,934 | | | *,e | | Quidel Corp | | | 2,809 | |
| | 545,797 | | | e | | Raffles Medical Group Ltd | | | 1,345 | |
| | 148,385 | | | | | Ramsay Health Care Ltd | | | 5,743 | |
| | 314,998 | | | e | | Resmed, Inc | | | 14,830 | |
| | 123,271 | | | | | Rhoen Klinikum AG. | | | 3,604 | |
| | 148,890 | | | *,e | | Rockwell Medical Technologies, Inc | | | 1,554 | |
| | 225,919 | | | * | | RTI Biologics, Inc | | | 800 | |
| | 441,686 | | | e | | Ryman Healthcare Ltd | | | 2,853 | |
| | 10,694 | | | | | Sartorius AG. | | | 1,273 | |
| | 5,600 | | | | | Sartorius Stedim Biotech | | | 939 | |
| | 425,311 | | | | | Selcuk Ecza Deposu Ticaret ve Sanayi AS | | | 368 | |
| | 189,461 | | | | | Select Medical Holdings Corp | | | 2,200 | |
| | 2,077,200 | | | e | | Shandong Weigao Group Medical Polymer Co Ltd | | | 2,811 | |
| | 1,124,800 | | | | | Shanghai Pharmaceuticals Holding Co Ltd | | | 2,757 | |
| | 172,581 | | | | | Shenzhen Accord Pharmaceutical Co Ltd | | | 802 | |
| | 1,493,496 | | | | | Sigma Pharmaceuticals Ltd | | | 868 | |
| | 1,153,900 | | | e | | Sinopharm Group Co | | | 3,320 | |
| | 179,719 | | | * | | Sirona Dental Systems, Inc | | | 12,616 | |
| | 130,254 | | | * | | Skilled Healthcare Group, Inc (Class A) | | | 626 | |
| | 170,915 | | | | | Smith & Nephew plc | | | 2,441 | |
| | 287,593 | | | *,e | | Solta Medical, Inc | | | 848 | |
| | 1,226 | | | | | So-net M3, Inc | | | 3,070 | |
| | 649,501 | | | | | Sonic Healthcare Ltd | | | 9,639 | |
| | 342,858 | | | * | | Sorin S.p.A. | | | 979 | |
| | 171,459 | | | * | | Spectranetics Corp | | | 4,286 | |
| | 998,005 | | | | | St. Jude Medical, Inc | | | 61,826 | |
| | 78,000 | | | | | St. Shine Optical Co Ltd | | | 2,232 | |
| | 121,170 | | | * | | Staar Surgical Co | | | 1,962 | |
| | 207,526 | | | | | STERIS Corp | | | 9,972 | |
| | 6,676 | | | | | Stratec Biomedical Systems AG. | | | 278 | |
| | 11,579 | | | | | Straumann Holding AG. | | | 2,172 | |
| | 832,064 | | | | | Stryker Corp | | | 62,521 | |
| | 6,610 | | | | | Suheung Capsule Co Ltd | | | 243 | |
| | 580,372 | | | | | Summerset Group Holdings Ltd | | | 1,552 | |
| | 1,458,600 | | | | | Supermax Corp BHD | | | 1,235 | |
| | 38,647 | | | * | | Surgical Care Affiliates, Inc | | | 1,346 | |
COLLEGE RETIREMENT EQUITIES FUND - Stock Account
| | | | | | | | VALUE | |
| SHARES | | | | | COMPANY | | (000) | |
| | 82,840 | | | * | | SurModics, Inc | | $ | 2,020 | |
| | 99,793 | | | | | Suzuken Co Ltd | | | 3,233 | |
| | 167,807 | | | * | | Symmetry Medical, Inc | | | 1,691 | |
| | 91,578 | | | | | Synergy Healthcare plc | | | 1,826 | |
| | 39,102 | | | | | Sysmex Corp | | | 2,310 | |
| | 24,351 | | | * | | Tandem Diabetes Care, Inc | | | 628 | |
| | 286,972 | | | * | | Team Health Holdings, Inc | | | 13,072 | |
| | 93,201 | | | *,e | | TearLab Corp | | | 870 | |
| | 56,107 | | | e | | Teleflex, Inc | | | 5,266 | |
| | 123,700 | | | | | Tempo Participacoes S.A. | | | 182 | |
| | 228,458 | | | * | | Tenet Healthcare Corp | | | 9,623 | |
| | 66,100 | | | | | Terumo Corp | | | 3,191 | |
| | 271,569 | | | * | | Thoratec Corp | | | 9,939 | |
| | 56,500 | | | | | Toho Pharmaceutical Co Ltd | | | 907 | |
| | 10,100 | | | | | Tokai Corp (GIFU) | | | 295 | |
| | 625,400 | | | | | Top Glove Corp BHD | | | 1,076 | |
| | 102,893 | | | *,e | | Tornier BV | | | 1,933 | |
| | 88,146 | | | * | | Triple-S Management Corp (Class B) | | | 1,714 | |
| | 28,400 | | | | | Tsuki Corp | | | 270 | |
| | 290,625 | | | *,e | | Unilife Corp | | | 1,279 | |
| | 313,892 | | | | | United Drug plc | | | 1,681 | |
| | 4,191,069 | | | | | UnitedHealth Group, Inc | | | 315,587 | |
| | 152,964 | | | | | Universal American Corp | | | 1,117 | |
| | 532,853 | | | | | Universal Health Services, Inc (Class B) | | | 43,300 | |
| | 57,968 | | | | | US Physical Therapy, Inc | | | 2,044 | |
| | 2,686 | | | *,e | | USMD Holdings, Inc | | | 54 | |
| | 10,963 | | | | | Utah Medical Products, Inc | | | 627 | |
| | 8,215 | | | | | Value Added Technologies Co Lt | | | 87 | |
| | 239,696 | | | * | | Varian Medical Systems, Inc | | | 18,622 | |
| | 64,164 | | | * | | Vascular Solutions, Inc | | | 1,485 | |
| | 407,796 | | | * | | VCA Antech, Inc | | | 12,788 | |
| | 13,889 | | | *,e | | Veeva Systems, Inc | | | 446 | |
| | 12,447 | | | *,e | | Veracyte, Inc | | | 180 | |
| | 655,600 | | | | | Vibhavadi Medical Center PCL | | | 186 | |
| | 94,196 | | | * | | Virtus Health Ltd | | | 735 | |
| | 68,100 | | | | | VITAL KSK Holdings, Inc | | | 472 | |
| | 136,293 | | | * | | Vocera Communications, Inc | | | 2,128 | |
| | 177,269 | | | *,e | | Volcano Corp | | | 3,873 | |
| | 334,402 | | | * | | WellCare Health Plans, Inc | | | 23,549 | |
| | 1,427,544 | | | | | WellPoint, Inc | | | 131,891 | |
| | 302,474 | | | e | | West Pharmaceutical Services, Inc | | | 14,839 | |
| | 8,761 | | | *,e | | William Demant Holding | | | 851 | |
| | 216,289 | | | * | | Wright Medical Group, Inc | | | 6,642 | |
| | 57,044 | | | *,e | | Zeltiq Aesthetics, Inc | | | 1,079 | |
| | 937,267 | | | | | Zimmer Holdings, Inc | | | 87,344 | |
| | | | | | | TOTAL HEALTH CARE EQUIPMENT & SERVICES | | | 4,142,256 | |
COLLEGE RETIREMENT EQUITIES FUND - Stock Account
| | | | | | | | VALUE | |
| SHARES | | | | | COMPANY | | (000) | |
| HOUSEHOLD & PERSONAL PRODUCTS - 1.6% | | | | |
| | 12,414 | | | | | Able C&C Co Ltd | | $ | 357 | |
| | 23,300 | | | | | Aderans Co Ltd | | | 258 | |
| | 3,330 | | | | | Amorepacific Corp | | | 3,157 | |
| | 32,244 | | | * | | Atrium Innovations Inc | | | 738 | |
| | 2,255,519 | | | | | Avon Products, Inc | | | 38,840 | |
| | 2,004,000 | | | * | | BaWang International Group Holding Ltd | | | 124 | |
| | 1,485,746 | | | | | Beiersdorf AG. | | | 150,632 | |
| | 12,004 | | | | | Bioland Ltd | | | 128 | |
| | 166,390 | | | * | | Central Garden and Pet Co (Class A) | | | 1,123 | |
| | 731,317 | | | | | Church & Dwight Co, Inc | | | 48,472 | |
| | 332,544 | | | e | | Clorox Co | | | 30,847 | |
| | 3,933,473 | | | | | Colgate-Palmolive Co | | | 256,502 | |
| | 14,641 | | | | | Cosmax, Inc | | | 692 | |
| | 190,909 | | | e | | Coty, Inc | | | 2,911 | |
| | 230,550 | | | | | Dabur India Ltd | | | 635 | |
| | 178 | | | e | | Dr Ci:Labo Co Ltd | | | 544 | |
| | 85,944 | | | * | | Elizabeth Arden, Inc | | | 3,047 | |
| | 276,388 | | | | | Energizer Holdings, Inc | | | 29,916 | |
| | 1,238,131 | | | | | Estee Lauder Cos (Class A) | | | 93,256 | |
| | 55,400 | | | *,e | | Euglena Co Ltd | | | 750 | |
| | 124,500 | | | | | Fancl Corp | | | 1,346 | |
| | 73,153 | | | | | Female Health Co | | | 622 | |
| | 142,389 | | | | | Godrej Consumer Products Ltd | | | 1,976 | |
| | 355,000 | | | | | Grape King Industrial Co | | | 1,787 | |
| | 131,928 | | | * | | Harbinger Group, Inc | | | 1,563 | |
| | 812,800 | | | | | Hengan International Group Co Ltd | | | 9,616 | |
| | 63,847 | | | | | Henkel KGaA | | | 6,657 | |
| | 595,858 | | | | | Henkel KGaA (Preference) | | | 69,259 | |
| | 354,596 | | | e | | Herbalife Ltd | | | 27,907 | |
| | 859,407 | | | | | Hindustan Lever Ltd | | | 7,934 | |
| | 1,013,125 | | | | | Hypermarcas S.A. | | | 7,596 | |
| | 20,511 | | | | | Inter Parfums S.A. | | | 884 | |
| | 123,261 | | | | | Inter Parfums, Inc | | | 4,414 | |
| | 283,430 | | | * | | Jyothy Laboratories Ltd | | | 871 | |
| | 497,704 | | | | | Kao Corp | | | 15,669 | |
| | 843,772 | | | | | Kimberly-Clark Corp | | | 88,140 | |
| | 5,899,837 | | | | | Kimberly-Clark de Mexico S.A. de C.V. (Class A) | | | 16,755 | |
| | 32,500 | | | | | Kobayashi Pharmaceutical Co Ltd | | | 1,814 | |
| | 22,114 | | | | | Korea Kolmar Co Ltd | | | 573 | |
| | 8,390 | | | | | Korea Kolmar Holdings Co Ltd | | | 107 | |
| | 64,100 | | | | | Kose Corp | | | 2,036 | |
| | 10,008 | | | | | LG Household & Health Care Ltd | | | 5,204 | |
| | 381,550 | | | *,e | | Lifevantage Corp | | | 630 | |
| | 266,000 | | | | | Lion Corp | | | 1,484 | |
| | 712,066 | | | | | L’Oreal S.A. | | | 125,048 | |
| | 880,600 | | | | | Magic Holdings international Ltd | | | 697 | |
COLLEGE RETIREMENT EQUITIES FUND - Stock Account
| | | | | | | | VALUE | |
| SHARES | | | | | COMPANY | | (000) | |
| | 36,779 | | | | | Mandom Corp | | $ | 1,164 | |
| | 87,863 | | | * | | Medifast, Inc | | | 2,296 | |
| | 548,924 | | | * | | Microbio Co Ltd | | | 573 | |
| | 12,360 | | | | | Milbon Co Ltd | | | 484 | |
| | 192,138 | | | | | Natura Cosmeticos S.A. | | | 3,369 | |
| | 43,906 | | | | | Nature’s Sunshine Products, Inc | | | 760 | |
| | 17,700 | | | | | Noevir Holdings Co Ltd | | | 321 | |
| | 446,032 | | | | | Nu Skin Enterprises, Inc (Class A) | | | 61,651 | |
| | 33,027 | | | * | | Nutraceutical International Corp | | | 884 | |
| | 2,584,000 | | | e | | NVC Lighting Holdings Ltd | | | 621 | |
| | 16,582 | | | | | Oil-Dri Corp of America | | | 627 | |
| | 20,579 | | | e | | Orchids Paper Products Co | | | 676 | |
| | 48,935 | | | e | | Oriflame Cosmetics S.A. | | | 1,504 | |
| | 2,645 | | | | | Pacific Corp | | | 1,167 | |
| | 61,300 | | | | | Pigeon Corp | | | 2,973 | |
| | 33,400 | | | | | Pola Orbis Holdings, Inc | | | 1,193 | |
| | 599,000 | | | e | | Prince Frog International Holdings Ltd | | | 247 | |
| | 9,131,591 | | | | | Procter & Gamble Co | | | 743,403 | |
| | 2,670,700 | | | | | PT Unilever Indonesia Tbk | | | 5,722 | |
| | 748,169 | | | | | Reckitt Benckiser Group plc | | | 59,431 | |
| | 51,624 | | | * | | Revlon, Inc (Class A) | | | 1,289 | |
| | 2,179,000 | | | e | | Ruinian International Ltd | | | 563 | |
| | 543,111 | | | | | Shiseido Co Ltd | | | 8,734 | |
| | 68,200 | | | | | Spectrum Brands, Inc | | | 4,812 | |
| | 17,200 | | | | | ST Corp | | | 163 | |
| | 510,483 | | | *,e | | Star Scientific, Inc | | | 592 | |
| | 1,016,517 | | | | | Svenska Cellulosa AB (B Shares) | | | 31,317 | |
| | 165,305 | | | | | Uni-Charm Corp | | | 9,432 | |
| | 19,448 | | | *,e | | USANA Health Sciences, Inc | | | 1,470 | |
| | 265,000 | | | | | Vinda International Holdings Ltd | | | 441 | |
| | 75,105 | | | | | WD-40 Co | | | 5,609 | |
| | | | | | | TOTAL HOUSEHOLD & PERSONAL PRODUCTS | | | 2,017,006 | |
| | | | | | | | | | | |
| INSURANCE - 4.3% | | | | |
| | 3,757,867 | | | | | ACE Ltd | | | 389,052 | |
| | 123,483 | | | | | Admiral Group plc | | | 2,684 | |
| | 303,567 | | | | | Aegon NV | | | 2,877 | |
| | 1,974,701 | | | | | Aflac, Inc | | | 131,910 | |
| | 606,627 | | | | | Ageas | | | 25,869 | |
| | 21,453,607 | | | | | AIA Group Ltd | | | 107,986 | |
| | 92,511 | | | | | Aksigorta AS | | | 115 | |
| | 13,534 | | | * | | Alleghany Corp | | | 5,413 | |
| | 1,086,974 | | | | | Allianz AG. | | | 195,574 | |
| | 180,952 | | | | | Allied World Assurance Co Holdings Ltd | | | 20,413 | |
| | 3,162,521 | | | | | Allstate Corp | | | 172,484 | |
| | 88,520 | | | * | | Alm Brand AS | | | 392 | |
| | 201,065 | | | * | | AMBAC Financial Group, Inc | | | 4,938 | |
| | 249,314 | | | e | | American Equity Investment Life Holding Co | | | 6,577 | |
COLLEGE RETIREMENT EQUITIES FUND - Stock Account
| | | | | | | | VALUE | |
| SHARES | | | | | COMPANY | | (000) | |
| | 455,008 | | | | | American Financial Group, Inc | | $ | 26,263 | |
| | 4,753,158 | | | | | American International Group, Inc | | | 242,649 | |
| | 8,801 | | | | | American National Insurance Co | | | 1,008 | |
| | 81,456 | | | | | Amerisafe, Inc | | | 3,441 | |
| | 832,943 | | | | | Amlin plc | | | 6,341 | |
| | 3,257,458 | | | | | AMP Ltd | | | 12,803 | |
| | 102,943 | | | e | | Amtrust Financial Services, Inc | | | 3,365 | |
| | 188,325 | | | | | Anadolu Hayat Emeklilik AS | | | 461 | |
| | 450,254 | | | * | | Anadolu Sigorta | | | 279 | |
| | 574,745 | | | | | Aon plc | | | 48,215 | |
| | 19,455 | | | | | April Group | | | 392 | |
| | 499,978 | | | *,e | | Arch Capital Group Ltd | | | 29,844 | |
| | 97,463 | | | | | Argo Group International Holdings Ltd | | | 4,531 | |
| | 147,263 | | | | | Arthur J. Gallagher & Co | | | 6,911 | |
| | 454,546 | | | | | Aspen Insurance Holdings Ltd | | | 18,777 | |
| | 278,987 | | | | | Assicurazioni Generali S.p.A. | | | 6,555 | |
| | 379,855 | | | | | Assurant, Inc | | | 25,211 | |
| | 137,257 | | | | | Assured Guaranty Ltd | | | 3,238 | |
| | 1,327,033 | | | | | Aviva plc | | | 9,928 | |
| | 2,495,268 | | | | | AXA S.A. | | | 69,487 | |
| | 2,015,165 | | | | | Axis Capital Holdings Ltd | | | 95,861 | |
| | 4,146 | | | | | Bajaj Finserv Ltd | | | 50 | |
| | 36,206 | | | | | Baldwin & Lyons, Inc (Class B) | | | 989 | |
| | 21,313 | | | | | Baloise Holding AG. | | | 2,718 | |
| | 917,700 | | | | | BB Seguridade Participacoes S.A. | | | 9,530 | |
| | 1,152,347 | | | | | Beazley plc | | | 5,202 | |
| | 5,605,383 | | | * | | Berkshire Hathaway, Inc (Class B) | | | 664,574 | |
| | 16,270 | | | * | | Blue Capital Reinsurance Holdings Ltd | | | 299 | |
| | 203,700 | | | | | Brazil Insurance Participco | | | 1,576 | |
| | 231,755 | | | | | Brown & Brown, Inc | | | 7,275 | |
| | 11,426,260 | | | | | Cathay Financial Holding Co Ltd | | | 18,555 | |
| | 512,299 | | | | | Catlin Group Ltd | | | 4,932 | |
| | 283,363 | | | | | Chesnara plc | | | 1,510 | |
| | 1,021,308 | | | * | | China Insurance International Holdings Co Ltd | | | 2,091 | |
| | 10,719,124 | | | | | China Life Insurance Co Ltd | | | 33,784 | |
| | 2,549,706 | | | | | China Life Insurance Co Ltd (Taiwan) | | | 2,593 | |
| | 3,259,400 | | | | | China Pacific Insurance Group Co Ltd | | | 12,822 | |
| | 394,923 | | | | | Chubb Corp | | | 38,161 | |
| | 377,023 | | | | | Cincinnati Financial Corp | | | 19,745 | |
| | 171,564 | | | * | | Citizens, Inc (Class A) | | | 1,501 | |
| | 38,054 | | | | | Clal Insurance | | | 740 | |
| | 4,227,241 | | | | | ClearView Wealth Ltd | | | 2,340 | |
| | 47,787 | | | | | CNA Financial Corp | | | 2,050 | |
| | 260,531 | | | | | CNP Assurances | | | 5,342 | |
| | 864,469 | | | | | Conseco, Inc | | | 15,292 | |
| | 338,186 | | | | | Corp Mapfre S.A. | | | 1,451 | |
| | 87,128 | | | | | Crawford & Co (Class B) | | | 805 | |
| | 3,187,600 | | | | | Dai-ichi Mutual Life Insurance Co | | | 53,338 | |
COLLEGE RETIREMENT EQUITIES FUND - Stock Account
| | | | | | | | VALUE | |
| SHARES | | | | | COMPANY | | (000) | |
| | 35,802 | | | | | Delta Lloyd NV | | $ | 889 | |
| | 1,492,341 | | | | | Direct Line Insurance Group plc | | | 6,168 | |
| | 332,934 | | | | | Discovery Holdings Ltd | | | 2,685 | |
| | 24,266 | | | | | Donegal Group, Inc (Class A) | | | 386 | |
| | 124,844 | | | | | Dongbu Insurance Co Ltd | | | 6,652 | |
| | 21,957 | | | | | Eastern Insurance Holdings, Inc | | | 538 | |
| | 61,105 | | | * | | eHealth, Inc | | | 2,841 | |
| | 22,155 | | | | | EMC Insurance Group, Inc | | | 678 | |
| | 109,556 | | | | | Employers Holdings, Inc | | | 3,467 | |
| | 69,701 | | | | | Endurance Specialty Holdings Ltd | | | 4,089 | |
| | 37,282 | | | * | | Enstar Group Ltd | | | 5,179 | |
| | 34,427 | | | | | Erie Indemnity Co (Class A) | | | 2,517 | |
| | 563,761 | | | | | esure Group plc | | | 2,332 | |
| | 17,942 | | | | | Euler Hermes S.A. | | | 2,471 | |
| | 275,020 | | | | | Everest Re Group Ltd | | | 42,867 | |
| | 7,830 | | | | | Fairfax Financial Holdings Ltd | | | 3,126 | |
| | 29,907 | | | | | FBD Holdings plc | | | 714 | |
| | 35,382 | | | | | FBL Financial Group, Inc (Class A) | | | 1,585 | |
| | 487,770 | | | e | | Fidelity National Title Group, Inc (Class A) | | | 15,828 | |
| | 419,750 | | | | | First American Financial Corp | | | 11,837 | |
| | 548,144 | | | *,e | | Fondiaria-Sai S.p.A | | | 1,767 | |
| | 71,415 | | | * | | Fondiaria-Sai S.p.A (B Saving S) | | | 202 | |
| | 1,385 | | | * | | Fondiaria-Sai S.p.A-RSP | | | 342 | |
| | 17,951 | | | *,e | | Fortegra Financial Corp | | | 148 | |
| | 1,005,156 | | | * | | Genworth Financial, Inc (Class A) | | | 15,610 | |
| | 924,685 | | | | | Gjensidige Forsikring BA | | | 17,685 | |
| | 487,239 | | | e | | Great-West Lifeco, Inc | | | 15,022 | |
| | 105,969 | | | * | | Greenlight Capital Re Ltd (Class A) | | | 3,572 | |
| | 60,421 | | | | | Grupo Catalana Occidente S.A. | | | 2,166 | |
| | 48,801 | | | * | | Hallmark Financial Services | | | 434 | |
| | 196,057 | | | | | Hannover Rueckversicherung AG. | | | 16,855 | |
| | 86,733 | | | | | Hanover Insurance Group, Inc | | | 5,179 | |
| | 65,041 | | | * | | Hanwha Non-Life Insurance Co Ltd | | | 283 | |
| | 171,220 | | | | | Harel Insurance Investments & Finances Ltd | | | 996 | |
| | 5,577,622 | | | | | Hartford Financial Services Group, Inc | | | 202,077 | |
| | 520,111 | | | | | HCC Insurance Holdings, Inc | | | 23,998 | |
| | 31,756 | | | e | | HCI Group, Inc | | | 1,699 | |
| | 12,036 | | | * | | Health Insurance Innovations, Inc | | | 122 | |
| | 14,894 | | | | | Helvetia Holding AG. | | | 7,477 | |
| | 310,555 | | | * | | Hilltop Holdings, Inc | | | 7,183 | |
| | 737,546 | | | | | Hiscox Ltd | | | 8,500 | |
| | 160,596 | | | | | Horace Mann Educators Corp | | | 5,065 | |
| | 180,100 | | | | | Hyundai Marine & Fire Insurance Co Ltd | | | 5,549 | |
| | 26,310 | | | e | | Independence Holding Co | | | 355 | |
| | 110,182 | | | | | Industrial Alliance Insurance and Financial Services, Inc | | | 4,870 | |
| | 54,665 | | | | | Infinity Property & Casualty Corp | | | 3,922 | |
| | 116,325 | | | | | ING Canada, Inc | | | 7,597 | |
| | 5,598,837 | | | | | Insurance Australia Group Ltd | | | 29,151 | |
COLLEGE RETIREMENT EQUITIES FUND - Stock Account
| | | | | | | | VALUE | |
| SHARES | | | | | COMPANY | | (000) | |
| | 4,387 | | | e | | Investors Title Co | | $ | 355 | |
| | 217,583 | | | | | Jardine Lloyd Thompson Group plc | | | 3,673 | |
| | 16,159 | | | | | Kansas City Life Insurance Co | | | 771 | |
| | 38,627 | | | | | Kemper Corp | | | 1,579 | |
| | 527,410 | | | | | Korea Life Insurance Co Ltd | | | 3,801 | |
| | 235,339 | | | | | Korean Reinsurance Co | | | 2,556 | |
| | 227,277 | | | | | Lancashire Holdings Ltd | | | 3,055 | |
| | 20,693,413 | | | | | Legal & General Group plc | | | 76,492 | |
| | 274,700 | | | | | Liberty Holdings Ltd | | | 3,189 | |
| | 18,500 | | | * | | Lifenet Insurance Co | | | 96 | |
| | 80,190 | | | | | LIG Insurance Co Ltd | | | 2,504 | |
| | 941,995 | | | | | Lincoln National Corp | | | 48,626 | |
| | 254,985 | | | | | Loews Corp | | | 12,300 | |
| | 44,101 | | | * | | Lotte Non-Life Insurance Co Ltd | | | 119 | |
| | 246,020 | | | | | Maiden Holdings Ltd | | | 2,689 | |
| | 3,007,988 | | | | | Manulife Financial Corp | | | 59,353 | |
| | 11,120 | | | * | | Markel Corp | | | 6,453 | |
| | 4,024,561 | | | | | Marsh & McLennan Cos, Inc | | | 194,628 | |
| | 347,230 | | | * | | MBIA, Inc | | | 4,146 | |
| | 184,549 | | | | | Meadowbrook Insurance Group, Inc | | | 1,284 | |
| | 640,997 | | | | | Mediolanum S.p.A. | | | 5,555 | |
| | 50,851 | | | | | Menorah Mivtachim Holdings Ltd | | | 632 | |
| | 474,360 | | | * | | Mercuries Life Insurance Co Lt | | | 340 | |
| | 20,811 | | | | | Mercury General Corp | | | 1,035 | |
| | 144,555 | | | | | Meritz Fire & Marine Insurance Co Ltd | | | 2,078 | |
| | 6,318,359 | | | | | Metlife, Inc | | | 340,686 | |
| | 1,236,232 | | | | | Metropolitan Holdings Ltd | | | 2,985 | |
| | 668,228 | | | | | Migdal Insurance Holdings Ltd | | | 1,179 | |
| | 990,563 | | | * | | Milano Assicurazioni S.p.A. | | | 1,081 | |
| | 121,347 | | | * | | Milano Assicurazioni S.p.A. (RSP) | | | 188 | |
| | 957,488 | | | | | Millea Holdings, Inc | | | 32,047 | |
| | 601,691 | | | | | Mitsui Sumitomo Insurance Group Holdings, Inc | | | 16,173 | |
| | 169,143 | | | | | Montpelier Re Holdings Ltd | | | 4,922 | |
| | 383,664 | | | | | Muenchener Rueckver AG. | | | 84,625 | |
| | 25,259 | | | | | National Interstate Corp | | | 581 | |
| | 8,968 | | | | | National Western Life Insurance Co (Class A) | | | 2,005 | |
| | 49,662 | | | * | | Navigators Group, Inc | | | 3,137 | |
| | 829,700 | | | * | | New China Life insurance Co Ltd | | | 2,792 | |
| | 1,252,533 | | | | | NKSJ Holdings, Inc | | | 34,863 | |
| | 1,828,095 | | | | | Old Mutual plc | | | 5,736 | |
| | 494,112 | | | | | Old Republic International Corp | | | 8,533 | |
| | 85,807 | | | | | OneBeacon Insurance Group Ltd (Class A) | | | 1,357 | |
| | 791,373 | | | | | PartnerRe Ltd | | | 83,434 | |
| | 189,487 | | | * | | Partnership Assurance Group plc | | | 920 | |
| | 11,419,400 | | | | | People’s Insurance Co Group of China Ltd | | | 5,540 | |
| | 22,615 | | | * | | Phoenix Cos, Inc | | | 1,389 | |
| | 198,204 | | | | | Phoenix Group Holdings | | | 2,394 | |
| | 140,827 | | | | | Phoenix Holdings Ltd | | | 523 | |
COLLEGE RETIREMENT EQUITIES FUND - Stock Account
| | | | | | | | VALUE | |
| SHARES | | | | | COMPANY | | (000) | |
| | 4,103,831 | | | | | PICC Property & Casualty Co Ltd | | $ | 6,103 | |
| | 3,724,700 | | | | | Ping An Insurance Group Co of China Ltd | | | 33,463 | |
| | 112,662 | | | | | Platinum Underwriters Holdings Ltd | | | 6,904 | |
| | 395,131 | | | | | Porto Seguro S.A. | | | 4,983 | |
| | 391,206 | | | e | | Power Corp Of Canada | | | 11,767 | |
| | 328,211 | | | e | | Power Financial Corp | | | 11,123 | |
| | 153,526 | | | | | Powszechny Zaklad Ubezpieczen S.A. | | | 22,814 | |
| | 230,502 | | | | | Primerica, Inc | | | 9,891 | |
| | 1,196,895 | | | | | Principal Financial Group | | | 59,019 | |
| | 132,231 | | | | | ProAssurance Corp | | | 6,411 | |
| | 636,582 | | | | | Progressive Corp | | | 17,360 | |
| | 474,339 | | | | | Protective Life Corp | | | 24,030 | |
| | 2,413,298 | | | | | Prudential Financial, Inc | | | 222,554 | |
| | 6,563,013 | | | | | Prudential plc | | | 146,644 | |
| | 31,556,000 | | | | | PT Panin Insurance Tbk | | | 1,742 | |
| | 90,425,000 | | | * | | PT Panin Life Tbk | | | 1,453 | |
| | 1,802,332 | | | | | QBE Insurance Group Ltd | | | 18,592 | |
| | 259,281 | | | | | Reinsurance Group of America, Inc (Class A) | | | 20,071 | |
| | 123,251 | | | | | RenaissanceRe Holdings Ltd | | | 11,997 | |
| | 1,481,191 | | | | | Resolution Ltd | | | 8,694 | |
| | 88,538 | | | | | RLI Corp | | | 8,622 | |
| | 636,120 | | | | | RMI Holdings | | | 1,666 | |
| | 3,503,414 | | | | | Royal & Sun Alliance Insurance Group plc | | | 5,303 | |
| | 55,291 | | | | | Safety Insurance Group, Inc | | | 3,113 | |
| | 747,878 | | | | | Sampo Oyj (A Shares) | | | 36,760 | |
| | 54,167 | | | | | Samsung Fire & Marine Insurance Co Ltd | | | 13,311 | |
| | 167,475 | | | | | Samsung Life Insurance Co Ltd | | | 16,524 | |
| | 3,613,448 | | | | | Sanlam Ltd | | | 18,363 | |
| | 13,887 | | | | | Schweizerische National-Versicherungs-Gesellschaft | | | 1,000 | |
| | 196,517 | | | | | SCOR | | | 7,188 | |
| | 244,686 | | | | | Selective Insurance Group, Inc | | | 6,621 | |
| | 15,964,630 | | | | | Shin Kong Financial Holding Co Ltd | | | 5,530 | |
| | 265,000 | | | | | Shinkong Insurance Co Ltd | | | 214 | |
| | 86,896 | | | | | Societa Cattolica di Assicurazioni SCRL | | | 2,342 | |
| | 100,834 | | | | | Sony Financial Holdings, Inc | | | 1,837 | |
| | 957,074 | | | | | St. James’s Place plc | | | 11,568 | |
| | 36,625 | | | | | Stancorp Financial Group, Inc | | | 2,426 | |
| | 1,949,383 | | | | | Standard Life plc | | | 11,641 | |
| | 59,456 | | | | | State Auto Financial Corp | | | 1,263 | |
| | 593,180 | | | * | | Steadfast Group Ltd | | | 878 | |
| | 85,563 | | | | | Stewart Information Services Corp | | | 2,761 | |
| | 397,834 | | | * | | Storebrand ASA | | | 2,494 | |
| | 142,033 | | | | | Sul America SA | | | 890 | |
| | 958,411 | | | e | | Sun Life Financial, Inc | | | 33,852 | |
| | 2,179,411 | | | | | Suncorp-Metway Ltd | | | 25,582 | |
| | 4,291 | | | | | Swiss Life Holding | | | 892 | |
| | 1,287,333 | | | | | Swiss Re Ltd | | | 118,677 | |
| | 113,700 | | | | | Syarikat Takaful Malaysia BHD | | | 358 | |
COLLEGE RETIREMENT EQUITIES FUND - Stock Account
| | | | | | | | VALUE | |
| SHARES | | | | | COMPANY | | (000) | |
| | 319,795 | | | | | Symetra Financial Corp | | $ | 6,063 | |
| | 780,900 | | | | | T&D Holdings, Inc | | | 10,930 | |
| | 444,000 | | | | | Taiwan Fire & Marine Insurance Co | | | 369 | |
| | 757,409 | | | * | | Taiwan Life Insurance Co Ltd | | | 718 | |
| | 2,227,881 | | | * | | Third Point Reinsurance Ltd | | | 41,283 | |
| | 101,640 | | | | | Tong Yang Life Insurance | | | 1,093 | |
| | 120,878 | | | * | | Topdanmark AS | | | 3,186 | |
| | 452,770 | | | | | Torchmark Corp | | | 35,384 | |
| | 156,942 | | | e | | Tower Group International Ltd | | | 530 | |
| | 707,086 | | | | | Travelers Cos, Inc | | | 64,020 | |
| | 23,676 | | | | | TrygVesta AS | | | 2,289 | |
| | 454,200 | | | * | | Tune Ins Holdings BHD | | | 271 | |
| | 894,400 | | | | | Unipol Gruppo Finanziario S.p.A | | | 5,338 | |
| | 954,615 | | | | | Unipol Gruppo Finanziario S.p.A (Preference) | | | 4,817 | |
| | 37,116 | | | *,e | | United America Indemnity Ltd | | | 939 | |
| | 80,879 | | | | | United Fire & Casualty Co | | | 2,318 | |
| | 93,666 | | | | | Universal Insurance Holdings, Inc | | | 1,356 | |
| | 634,805 | | | | | UnumProvident Corp | | | 22,269 | |
| | 832,665 | | | | | Validus Holdings Ltd | | | 33,548 | |
| | 28,771 | | | | | Vittoria Assicurazioni S.p.A. | | | 339 | |
| | 154,567 | | | | | W.R. Berkley Corp | | | 6,707 | |
| | 6,369 | | | | | White Mountains Insurance Group Ltd | | | 3,841 | |
| | 25,621 | | | | | Wiener Staedtische Allgemeine Versicherung AG. | | | 1,280 | |
| | 1,098,956 | | | | | XL Capital Ltd | | | 34,991 | |
| | 81,354 | | | | | Zurich Financial Services AG. | | | 23,598 | |
| | | | | | | TOTAL INSURANCE | | | 5,464,951 | |
| | | | | | | | | | | |
| MATERIALS - 5.3% | | | | |
| | 118,532 | | | | | A. Schulman, Inc | | | 4,179 | |
| | 348,522 | | | e | | Acerinox S.A. | | | 4,440 | |
| | 524,083 | | | | | ACHEM Technology Corp | | | 295 | |
| | 557,000 | | | | | Achilles Corp | | | 785 | |
| | 50,000 | | | *,m | | Acron JSC (ADR) | | | 158 | |
| | 161,581 | | | | | Adana Cimento | | | 272 | |
| | 259,500 | | | | | ADEKA Corp | | | 2,860 | |
| | 714,864 | | | | | Adelaide Brighton Ltd | | | 2,348 | |
| | 66,797 | | | *,e | | Advanced Emissions Solutions, Inc | | | 3,622 | |
| | 29,781 | | | * | | Advanced Metallurgical Group NV | | | 318 | |
| | 171,379 | | | | | Aeci Ltd | | | 2,042 | |
| | 14,511 | | | * | | AEP Industries, Inc | | | 767 | |
| | 145,516 | | | | | African Barrick Gold Ltd | | | 450 | |
| | 296,063 | | | *,e | | African Minerals Ltd | | | 975 | |
| | 163,870 | | | | | African Oxygen Ltd | | | 344 | |
| | 109,302 | | | | | African Rainbow Minerals Ltd | | | 1,974 | |
| | 131,697 | | | | | Agnico-Eagle Mines Ltd | | | 3,475 | |
| | 309,170 | | | | | Agrium, Inc (Toronto) | | | 28,282 | |
| | 213,000 | | | | | Aichi Steel Corp | | | 883 | |
| | 338,900 | | | * | | Ainsworth Lumber Co Ltd | | | 1,330 | |
COLLEGE RETIREMENT EQUITIES FUND - Stock Account
| | | | | | | | VALUE | |
| SHARES | | | | | COMPANY | | (000) | |
| | 184,977 | | | | | Air Liquide | | $ | 26,180 | |
| | 122,433 | | | | | Air Products & Chemicals, Inc | | | 13,686 | |
| | 150,422 | | | | | Air Water, Inc | | | 2,039 | |
| | 54,973 | | | | | Airgas, Inc | | | 6,149 | |
| | 547,654 | | | *,e | | AK Steel Holding Corp | | | 4,491 | |
| | 73,539 | | | | | Akcansa Cimento AS | | | 404 | |
| | 578,558 | | | | | Akzo Nobel NV | | | 44,865 | |
| | 371,070 | | | e | | Alamos Gold, Inc | | | 4,496 | |
| | 118,109 | | | | | Albemarle Corp | | | 7,487 | |
| | 568,996 | | | e | | Alcoa, Inc | | | 6,048 | |
| | 402,756 | | | | | Alent plc | | | 2,368 | |
| | 59,263 | | | | | Allegheny Technologies, Inc | | | 2,112 | |
| | 433,086 | | | *,e | | Allied Nevada Gold Corp | | | 1,537 | |
| | 1,088,800 | | | e | | Alpek SAB de C.V. | | | 2,476 | |
| | 423,258 | | | | | Altri SGPS S.A. | | | 1,304 | |
| | 337,279 | | | * | | Alumina Ltd | | | 335 | |
| | 11,057,300 | | | *,e | | Aluminum Corp of China Ltd | | | 3,859 | |
| | 13,707 | | | f | | AMAG Austria Metall AG (Purchased 5/31/12, cost $313) | | | 409 | |
| | 1,055,881 | | | | | Ambuja Cements Ltd | | | 3,124 | |
| | 101,728 | | | | | AMCOL International Corp | | | 3,457 | |
| | 2,572,949 | | | | | Amcor Ltd | | | 24,304 | |
| | 44,360 | | | * | | American Pacific Corp | | | 1,653 | |
| | 140,620 | | | | | American Vanguard Corp | | | 3,416 | |
| | 4,707,000 | | | | | AMVIG Holdings Ltd | | | 2,240 | |
| | 316,997 | | | | | Anadolu Cam Sanayii AS | | | 283 | |
| | 722,900 | | | e | | Anatolia Minerals Development Ltd | | | 1,477 | |
| | 57,800 | | | *,e | | Angang New Steel Co Ltd | | | 43 | |
| | 782,453 | | | | | Anglo American plc (London) | | | 17,124 | |
| | 126,146 | | | *,e | | Anglo Platinum Ltd | | | 4,750 | |
| | 470,130 | | | | | AngloGold Ashanti Ltd | | | 5,519 | |
| | 3,471,594 | | | e | | Anhui Conch Cement Co Ltd | | | 12,916 | |
| | 158,000 | | | * | | ANN JOO Resources BHD | | | 51 | |
| | 2,339,761 | | | | | Antofagasta plc | | | 32,077 | |
| | 246,239 | | | e | | APERAM | | | 4,555 | |
| | 134,681 | | | | | Aptargroup, Inc | | | 9,133 | |
| | 806,430 | | | * | | Aquarius Platinum Ltd | | | 549 | |
| | 78,969 | | | * | | Arabian American Development Co | | | 991 | |
| | 720,809 | | | | | ArcelorMittal | | | 12,875 | |
| | 185,000 | | | * | | Argonaut Gold, Inc | | | 927 | |
| | 91,916 | | | | | Arkema | | | 10,732 | |
| | 67,774 | | | e | | Asahi Holdings, Inc | | | 1,153 | |
| | 2,637,852 | | | | | Asahi Kasei Corp | | | 20,691 | |
| | 94,000 | | | | | Asahi Organic Chemicals Industry Co Ltd | | | 196 | |
| | 100,500 | | | * | | Asanko Gold, Inc | | | 162 | |
| | 122,545 | | | | | Ashland, Inc | | | 11,892 | |
COLLEGE RETIREMENT EQUITIES FUND - Stock Account
| | | | | | | | VALUE | |
| SHARES | | | | | COMPANY | | (000) | |
| | 1,750,000 | | | | | Asia Cement China Holdings Corp | | $ | 1,106 | |
| | 2,489 | | | * | | Asia Cement Co Ltd | | | 198 | |
| | 2,288,693 | | | | | Asia Cement Corp | | | 2,969 | |
| | 59,639 | | | | | Asia Plastic Recycling Holding Ltd | | | 191 | |
| | 369,500 | | | | | Asia Polymer | | | 324 | |
| | 498,639 | | | | | Asian Paints Ltd | | | 3,956 | |
| | 41,674 | | | | | Associated Cement Co Ltd | | | 748 | |
| | 82,026 | | | | | Assore Ltd | | | 2,666 | |
| | 677,200 | | | | | Atlas Consolidated Mining & Development | | | 222 | |
| | 3,178,471 | | | | | Atlas Iron Ltd | | | 3,286 | |
| | 16,480 | | | * | | Auriga Industries (Class B) | | | 564 | |
| | 265,540 | | | | | Avery Dennison Corp | | | 13,327 | |
| | 2,593,482 | | | | | Axiall Corp | | | 123,035 | |
| | 465,305 | | | | | AZ Electronic Materials S.A. | | | 3,050 | |
| | 745,635 | | | * | | B2Gold Corp | | | 1,530 | |
| | 8,789 | | | | | Bagfas Bandirma Gubre Fabrik | | | 141 | |
| | 132,429 | | | * | | Balchem Corp | | | 7,774 | |
| | 147,401 | | | | | Ball Corp | | | 7,615 | |
| | 1,264,939 | | | | | Barrick Gold Corp (Canada) | | | 22,280 | |
| | 1,255,270 | | | | | BASF AG. | | | 133,980 | |
| | 2,138 | | | | | BASF India Ltd | | | 22 | |
| | 67,077 | | | * | | Baticim Bati Anadolu Cimento Sanayii AS | | | 177 | |
| | 5,096 | | | | | Bayer CropScience Ltd | | | 146 | |
| | 3,534,600 | | | | | BBMG Corp | | | 3,085 | |
| | 139,095 | | | | | BC Iron Ltd | | | 646 | |
| | 751,278 | | | * | | Beadell Resources Ltd | | | 535 | |
| | 108,290 | | | | | Bekaert S.A. | | | 3,833 | |
| | 68,009 | | | | | Bemis Co, Inc | | | 2,786 | |
| | 362,200 | | | | | Bengang Steel Plates Co | | | 118 | |
| | 49,361 | | | * | | Berger Paints India Ltd | | | 179 | |
| | 3,961,565 | | | * | | Berry Plastics Group, Inc | | | 94,246 | |
| | 4,742,926 | | | | | BHP Billiton Ltd | | | 161,700 | |
| | 5,470,724 | | | | | BHP Billiton plc | | | 169,756 | |
| | 183,681 | | | | | Billerud AB | | | 2,323 | |
| | 784,997 | | | * | | BlueScope Steel Ltd | | | 4,096 | |
| | 87,188 | | | * | | Boise Cascade Co | | | 2,570 | |
| | 458,746 | | | | | Boliden AB | | | 7,033 | |
| | 1,376,876 | | | | | Boral Ltd | | | 5,888 | |
| | 5,340,000 | | | * | | Borneo Lumbung Energi & Metal | | | 76 | |
| | 212,175 | | | | | Borregaard ASA | | | 1,058 | |
| | 54,715 | | | | | Borusan Mannesmann Boru Sanayi | | | 121 | |
| | 8,829,246 | | | * | | Boryszew S.A. | | | 1,461 | |
| | 257,893 | | | | | Bradespar S.A. | | | 2,748 | |
| | 442,528 | | | * | | Braskem S.A. | | | 3,939 | |
| | 74,542 | | | | | Brush Engineered Materials, Inc | | | 2,300 | |
| | 95,165 | | | | | Buzzi Unicem S.p.A. | | | 1,713 | |
| | 89,964 | | | | | Buzzi Unicem S.p.A. RSP | | | 875 | |
| | 5,600 | | | | | C Uyemura & Co Ltd | | | 245 | |
COLLEGE RETIREMENT EQUITIES FUND - Stock Account
| | | | | | | | VALUE | |
| SHARES | | | | | COMPANY | | (000) | |
| | 52,799 | | | | | Cabot Corp | | $ | 2,714 | |
| | 464,458 | | | * | | Calgon Carbon Corp | | | 9,554 | |
| | 177,900 | | | e | | Canexus Corp | | | 1,199 | |
| | 311,468 | | | * | | Canfor Corp | | | 7,817 | |
| | 69,900 | | | e | | Canfor Pulp Products, Inc | | | 676 | |
| | 152,660 | | | | | CAP S.A. | | | 2,905 | |
| | 29,150 | | | | | Capro Corp | | | 178 | |
| | 372,811 | | | * | | Capstone Mining Corp | | | 1,053 | |
| | 78,083 | | | | | Carclo plc | | | 370 | |
| | 178,547 | | | | | Carpenter Technology Corp | | | 11,106 | |
| | 145,552 | | | | | Cascades, Inc | | | 943 | |
| | 65,900 | | | *,e | | Castle (A.M.) & Co | | | 973 | |
| | 1,139,280 | | | | | Celanese Corp (Series A) | | | 63,014 | |
| | 153,431 | | | | | Cementir S.p.A. | | | 881 | |
| | 851,427 | | | | | Cementos Argos S.A. | | | 4,323 | |
| | 700,941 | | | * | | Cemex Latam Holdings S.A. | | | 5,375 | |
| | 21,256,474 | | | *,e | | Cemex S.A. de C.V. | | | 24,974 | |
| | 2,211,574 | | | * | | Centamin plc | | | 1,640 | |
| | 543,600 | | | | | Centerra Gold, Inc | | | 2,211 | |
| | 198,338 | | | * | | Century Aluminum Co | | | 2,075 | |
| | 120,538 | | | | | Century Textile & Industries Ltd | | | 612 | |
| | 370,492 | | | | | CF Industries Holdings, Inc | | | 86,339 | |
| | 457,166 | | | | | Chambal Fertilizers & Chemicals Ltd | | | 297 | |
| | 21,899 | | | e | | Chase Corp | | | 773 | |
| | 50,535 | | | | | Cheil Industries, Inc | | | 4,244 | |
| | 414,228 | | | * | | Chemtura | | | 11,565 | |
| | 2,191,560 | | | | | Cheng Loong Corp | | | 1,056 | |
| | 832,925 | | | * | | Chia Hsin Cement Corp | | | 439 | |
| | 710,000 | | | | | Chiho-Tiande Group Ltd | | | 263 | |
| | 5,387,100 | | | | | China BlueChemical Ltd | | | 3,375 | |
| | 1,300,620 | | | | | China General Plastics Corp | | | 739 | |
| | 171,000 | | | | | China Hi-ment Corp | | | 350 | |
| | 670,000 | | | * | | China Manmade Fibers Corp | | | 284 | |
| | 375,777 | | | | | China Metal Products | | | 519 | |
| | 3,613,200 | | | *,e,m | | China Metal Recycling Holdings Ltd | | | 5 | |
| | 5,703,578 | | | e | | China National Building Material Co Ltd | | | 6,156 | |
| | 2,111,175 | | | | | China Petrochemical Development Corp | | | 965 | |
| | 3,306,000 | | | *,e | | China Precious Metal Resources Holdings Co Ltd | | | 507 | |
| | 1,422,000 | | | * | | China Rare Earth Holdings Ltd | | | 198 | |
| | 8,059,056 | | | | | China Resources Cement Holdings Ltd | | | 5,430 | |
| | 1,950,000 | | | e | | China Sanjiang Fine Chemicals | | | 998 | |
| | 7,334,200 | | | | | China Shanshui Cement Group Ltd | | | 3,161 | |
| | 216,000 | | | | | China Steel Chemical Corp | | | 1,190 | |
| | 12,446,228 | | | | | China Steel Corp | | | 11,286 | |
| | 937,000 | | | | | China Synthetic Rubber Corp | | | 884 | |
| | 663,000 | | | * | | China Vanadium Titano-Magnetite Mining Co Ltd | | | 92 | |
| | 496,000 | | | * | | Chongqing Iron & Steel Co Ltd | | | 78 | |
| | 259,049 | | | | | Christian Hansen Holding | | | 10,269 | |
COLLEGE RETIREMENT EQUITIES FUND - Stock Account
| | | | | | | | VALUE | |
| SHARES | | | | | COMPANY | | (000) | |
| | 66,000 | | | | | Chugoku Marine Paints Ltd | | $ | 350 | |
| | 1,398,328 | | | | | Chun Yuan Steel | | | 538 | |
| | 1,344,720 | | | * | | Chung Hung Steel Corp | | | 387 | |
| | 169,950 | | | * | | Chung Hwa Pulp Corp | | | 54 | |
| | 211,000 | | | | | Cia de Minas Buenaventura S.A. (ADR) (Series B) | | | 2,367 | |
| | 1,699,336 | | | | | Cia Siderurgica Nacional S.A. | | | 10,367 | |
| | 94,930 | | | * | | Ciech S.A. | | | 976 | |
| | 178,669 | | | | | Cimsa Cimento Sanayi Ve Tica | | | 948 | |
| | 1,208,000 | | | * | | Citic Dameng Holdings | | | 91 | |
| | 2,204,115 | | | | | Clariant AG. | | | 40,342 | |
| | 83,025 | | | * | | Clearwater Paper Corp | | | 4,359 | |
| | 5,625,870 | | | e | | Cliffs Natural Resources, Inc | | | 147,454 | |
| | 63,833 | | | * | | CNK International Co Ltd | | | 228 | |
| | 449,384 | | | * | | Coeur d’Alene Mines Corp | | | 4,876 | |
| | 455,101 | | | | | Commercial Metals Co | | | 9,252 | |
| | 86,132 | | | *,m | | Companhia Vale do Rio Doce | | | 0 | ^ |
| | 1,277,868 | | | e | | Companhia Vale do Rio Doce (ADR) | | | 19,487 | |
| | 28,158 | | | e | | Compass Minerals International, Inc | | | 2,254 | |
| | 557,496 | | | * | | Constellium NV | | | 12,973 | |
| | 221,000 | | | *,e | | Corp Durango SAB de C.V. | | | 537 | |
| | 3,293,000 | | | e | | CPMC Holdings Ltd | | | 2,573 | |
| | 3,075,383 | | | | | CRH plc | | | 77,936 | |
| | 30,301 | | | | | CRH plc (Ireland) | | | 769 | |
| | 203,797 | | | | | Croda International plc | | | 8,307 | |
| | 145,100 | | | * | | Cronus Resources Ltd | | | 462 | |
| | 313,770 | | | * | | Crown Holdings, Inc | | | 13,985 | |
| | 374,600 | | | | | CSC Steel Holdings BHD | | | 142 | |
| | 2,242,873 | | | | | CSR Ltd | | | 5,321 | |
| | 25,040,000 | | | * | | CST Mining Group Ltd | | | 217 | |
| | 140,972 | | | *,e | | Cudeco Ltd | | | 227 | |
| | 303,569 | | | | | Cytec Industries, Inc | | | 28,280 | |
| | 1,502,300 | | | | | D&L Industries Inc | | | 214 | |
| | 144,000 | | | | | Dai Nippon Toryo Co Ltd | | | 236 | |
| | 441,689 | | | | | Daicel Chemical Industries Ltd | | | 3,600 | |
| | 59,530 | | | | | Daido Steel Co Ltd | | | 296 | |
| | 162,000 | | | | | Daiken Corp | | | 434 | |
| | 154,857 | | | | | Dainichiseika Color & Chemicals Manufacturing Co Ltd | | | 707 | |
| | 1,131,845 | | | | | Dainippon Ink and Chemicals, Inc | | | 3,451 | |
| | 219,872 | | | | | Daio Paper Corp | | | 2,204 | |
| | 168,000 | | | | | Daiso Co Ltd | | | 565 | |
| | 225,400 | | | * | | Danhua Chemical Technology Co Ltd | | | 134 | |
| | 19,216 | | | | | DC Chemical Co Ltd | | | 3,486 | |
| | 37,310 | | | | | Deltic Timber Corp | | | 2,535 | |
| | 1,546,000 | | | | | Denki Kagaku Kogyo KK | | | 6,390 | |
| | 158,132 | | | * | | Detour Gold Corp | | | 610 | |
| | 112,614 | | | * | | Dominion Diamond Corp | | | 1,614 | |
| | 110,211 | | | | | Domtar Corp | | | 10,397 | |
| | 67,414 | | | | | Dongjin Semichem Co Ltd | | | 250 | |
COLLEGE RETIREMENT EQUITIES FUND - Stock Account
| | | | | | | | VALUE | |
| SHARES | | | | | COMPANY | | (000) | |
| | 67,948 | | | | | Dongkuk Industries Co Ltd | | $ | 224 | |
| | 112,550 | | | | | Dongkuk Steel Mill Co Ltd | | | 1,406 | |
| | 21,542 | | | * | | Dongsung Finetec Co Ltd | | | 219 | |
| | 1,644,000 | | | e | | Dongyue Group | | | 653 | |
| | 6,184,976 | | | | | Dow Chemical Co | | | 274,613 | |
| | 408,000 | | | | | Dowa Holdings Co Ltd | | | 3,992 | |
| | 807,447 | | | | | DRDGOLD Ltd | | | 289 | |
| | 1,684,400 | | | | | DS Smith plc | | | 9,288 | |
| | 723,644 | | | | | DSM NV | | | 56,950 | |
| | 869,325 | | | | | Du Pont (E.I.) de Nemours & Co | | | 56,480 | |
| | 1,046,454 | | | | | DuluxGroup Ltd | | | 5,018 | |
| | 124,100 | | | * | | Dundee Precious Metals, Inc | | | 359 | |
| | 46,894 | | | | | Eagle Materials, Inc | | | 3,631 | |
| | 15,600 | | | | | Earth Chemical Co Ltd | | | 548 | |
| | 280,415 | | | | | Eastman Chemical Co | | | 22,629 | |
| | 437,391 | | | | | Ecolab, Inc | | | 45,607 | |
| | 15,074 | | | | | EID Parry India Ltd | | | 34 | |
| | 490,824 | | | * | | El Ezz Steel Co | | | 1,087 | |
| | 1,044,859 | | | | | Eldorado Gold Corp | | | 5,931 | |
| | 1,517,915 | | | | | Elementis plc | | | 6,777 | |
| | 1,499,901 | | | | | Empresas CMPC S.A. | | | 3,671 | |
| | 27,253 | | | | | EMS-Chemie Holding AG. | | | 9,718 | |
| | 292,538 | | | * | | Endeavour Mining Corp | | | 132 | |
| | 153,139 | | | * | | Endeavour Mining Corp (ADR) | | | 67 | |
| | 230,100 | | | * | | Endeavour Silver Corp | | | 832 | |
| | 6,287 | | | | | Eramet | | | 608 | |
| | 5,103,540 | | | | | Eregli Demir ve Celik Fabrikalari TAS | | | 6,131 | |
| | 574,000 | | | | | Eternal Chemical Co Ltd | | | 559 | |
| | 160,900 | | | | | Eternit S.A. | | | 594 | |
| | 95,300 | | | | | Eucatex S.A. Industria e Comercio | | | 275 | |
| | 33,492 | | | | | Eugene Corp | | | 90 | |
| | 599,098 | | | | | Everlight Chemical Industrial Corp | | | 492 | |
| | 596,694 | | | | | Evolution Mining Ltd | | | 330 | |
| | 439,475 | | | * | | Evonik Industries AG. | | | 17,914 | |
| | 342,224 | | | * | | Evraz plc | | | 637 | |
| | 511,750 | | | | | Feng Hsin Iron & Steel Co | | | 939 | |
| | 101,400 | | | | | Ferbasa-Ferro Ligas DA Bahia | | | 567 | |
| | 635,067 | | | | | Ferrexpo plc | | | 2,019 | |
| | 236,755 | | | * | | Ferro Corp | | | 3,038 | |
| | 44,100 | | | * | | Fertilizantes Heringer S.A. | | | 131 | |
| | 392,163 | | | * | | Fibria Celulose S.A. | | | 4,593 | |
| | 2,599,295 | | | | | Filtrona plc | | | 37,028 | |
| | 137,200 | | | * | | First Majestic Silver Corp | | | 1,347 | |
| | 743,337 | | | | | First Quantum Minerals Ltd | | | 13,394 | |
| | 2,390,100 | | | e | | Fletcher Building Ltd | | | 16,749 | |
| | 158,565 | | | *,e | | Flotek Industries, Inc | | | 3,182 | |
| | 405,910 | | | | | FMC Corp | | | 30,630 | |
| | 75,040 | | | * | | Foosung Co Ltd | | | 236 | |
COLLEGE RETIREMENT EQUITIES FUND - Stock Account
| | | | | | | | VALUE | |
| SHARES | | | | | COMPANY | | (000) | |
| | 3,866,400 | | | | | Formosa Chemicals & Fibre Corp | | $ | 10,918 | |
| | 4,982,088 | | | | | Formosa Plastics Corp | | | 13,482 | |
| | 735,000 | | | | | Formosan Rubber Group, Inc | | | 693 | |
| | 1,227,732 | | | | | Formosan Union Chemical | | | 590 | |
| | 14,906,926 | | | e | | Fortescue Metals Group Ltd | | | 77,871 | |
| | 164,400 | | | * | | Fortuna Silver Mines, Inc | | | 472 | |
| | 4,625,600 | | | e | | Fosun International | | | 4,605 | |
| | 14,300 | | | | | FP Corp | | | 1,020 | |
| | 210,609 | | | | | Franco-Nevada Corp | | | 8,583 | |
| | 4,062,296 | | | | | Freeport-McMoRan Copper & Gold, Inc (Class B) | | | 153,311 | |
| | 994,673 | | | | | Fresnillo plc | | | 12,368 | |
| | 43,401 | | | | | Frutarom Industries Ltd | | | 913 | |
| | 168,054 | | | | | Fuchs Petrolub AG. (Preference) | | | 16,464 | |
| | 3,121,200 | | | e | | Fufeng Group Ltd | | | 1,280 | |
| | 27,852 | | | | | Fuji Seal International, Inc | | | 863 | |
| | 16,300 | | | | | Fujimi, Inc | | | 211 | |
| | 37,200 | | | | | Fujimori Kogyo Co Ltd | | | 926 | |
| | 1,562,000 | | | | | Furukawa-Sky Aluminum Corp | | | 5,917 | |
| | 8,785,000 | | | e | | Fushan International Energy Group Ltd | | | 3,089 | |
| | 84,656 | | | | | FutureFuel Corp | | | 1,338 | |
| | 34,782,600 | | | * | | G J Steel PCL | | | 64 | |
| | 14,545,600 | | | * | | G Steel PCL | | | 44 | |
| | 311,670 | | | * | | Gabriel Resources Ltd | | | 229 | |
| | 333,342 | | | | | Gammon Gold, Inc | | | 1,224 | |
| | 135,877 | | | * | | Gem Diamonds Ltd | | | 328 | |
| | 192,339 | | | *,e | | General Moly, Inc | | | 258 | |
| | 1,613,002 | | | | | Gerdau S.A. (Preference) | | | 12,529 | |
| | 13,145 | | | | | Givaudan S.A. | | | 18,805 | |
| | 145,614 | | | | | Glatfelter | | | 4,025 | |
| | 750,300 | | | * | | Gleichen Resources Ltd | | | 664 | |
| | 4,451,517 | | | | | Glencore Xstrata plc | | | 23,159 | |
| | 251,429 | | | | | Globe Specialty Metals, Inc | | | 4,528 | |
| | 486,192 | | | | | Gloria Material Technology Corp | | | 356 | |
| | 175,000 | | | | | Godo Steel Ltd | | | 325 | |
| | 78,783 | | | | | Godrej Industries Ltd | | | 353 | |
| | 1,127,357 | | | | | Gold Fields Ltd | | | 3,604 | |
| | 103,615 | | | e | | Gold Resource Corp | | | 469 | |
| | 767,560 | | | | | Goldcorp, Inc | | | 16,648 | |
| | 8,356,418 | | | | | Goldsun Development & Construction Co Ltd | | | 3,481 | |
| | 6,187 | | | | | Goltas Cimento | | | 137 | |
| | 2,041,000 | | | | | Grand Pacific Petrochemical | | | 1,588 | |
| | 1,155,425 | | | | | Grange Resources Ltd | | | 264 | |
| | 2,603,620 | | | * | | Graphic Packaging Holding Co | | | 24,995 | |
| | 605,755 | | | *,m | | Great Basin Gold Ltd | | | 6 | |
| | 148,000 | | | | | Great China Metal Industry | | | 182 | |
| | 5,230,000 | | | | | Greatview Aseptic Packaging Co | | | 3,092 | |
| | 19,186 | | | | | Greif, Inc (Class A) | | | 1,005 | |
| | 29,921,560 | | | *,e | | G-Resources Group Ltd | | | 725 | |
COLLEGE RETIREMENT EQUITIES FUND - Stock Account
| | | | | | | | VALUE | |
| SHARES | | | | | COMPANY | | (000) | |
| | 529,324 | | | | | Grupo Argos S.A. | | $ | 5,332 | |
| | 162,223 | | | | | Grupo Argos S.A.(Preference) | | | 1,639 | |
| | 356,627 | | | e | | Grupo Empresarial Ence S.A. | | | 1,338 | |
| | 5,349,149 | | | | | Grupo Mexico S.A. de C.V. (Series B) | | | 17,711 | |
| | 158,400 | | | *,e | | Grupo Simec SAB de C.V. | | | 661 | |
| | 28,836 | | | *,e | | GSE Holding, Inc | | | 60 | |
| | 132,352 | | | * | | Gubre Fabrikalari TAS | | | 170 | |
| | 41,946 | | | | | Gujarat Flourochemicals | | | 161 | |
| | 125,675 | | | | | Gujarat State Fertilisers & Chemicals Ltd | | | 110 | |
| | 3,179,452 | | | *,e,m | | Gunns Ltd | | | 28 | |
| | 1,584 | | | *,m | | Gunns Ltd (Forest) | | | 0 | ^ |
| | 105,742 | | | *,e | | Guyana Goldfields, Inc | | | 163 | |
| | 32,051 | | | * | | H&R WASAG AG. | | | 383 | |
| | 175,927 | | | | | H.B. Fuller Co | | | 9,155 | |
| | 2,488 | | | * | | Hadera Paper Ltd | | | 113 | |
| | 23,210 | | | | | Han Kuk Carbon Co Ltd | | | 181 | |
| | 7,020 | | | | | Hanil Cement Manufacturing | | | 566 | |
| | 17,730 | | | | | Hansol Chemical Co Ltd | | | 460 | |
| | 54,710 | | | | | Hansol Paper Co | | | 588 | |
| | 92,695 | | | | | Hanwha Chemical Corp | | | 1,899 | |
| | 165,987 | | | | | Hanwha Corp | | | 6,176 | |
| | 399,875 | | | | | Harmony Gold Mining Co Ltd | | | 1,014 | |
| | 30,056 | | | | | Hawkins, Inc | | | 1,118 | |
| | 49,736 | | | | | Haynes International, Inc | | | 2,747 | |
| | 457,224 | | | * | | Headwaters, Inc | | | 4,476 | |
| | 1,264,165 | | | e | | Hecla Mining Co | | | 3,894 | |
| | 86,862 | | | | | HeidelbergCement AG. | | | 6,596 | |
| | 53,779 | | | | | Hexpol AB (Series B) | | | 4,032 | |
| | 375,616 | | | | | Highland Gold Mining Ltd | | | 366 | |
| | 119,784 | | | | | Hill & Smith Holdings plc | | | 1,023 | |
| | 1,070,432 | | | | | Hindalco Industries Ltd | | | 2,126 | |
| | 124,682 | | | | | Hitachi Chemical Co Ltd | | | 1,988 | |
| | 67,830 | | | | | Hitachi Metals Ltd | | | 960 | |
| | 674,131 | | | | | Ho Tung Chemical Corp | | | 326 | |
| | 224,595 | | | | | Hochschild Mining plc | | | 529 | |
| | 312,429 | | | | | Hokuetsu Paper Mills Ltd | | | 1,473 | |
| | 693,221 | | | | | Holcim Ltd | | | 51,828 | |
| | 1,784,100 | | | | | Holcim Philippines, Inc | | | 623 | |
| | 147,429 | | | | | Holmen AB (B Shares) | | | 5,363 | |
| | 41,663 | | | | | Honam Petrochemical Corp | | | 9,186 | |
| | 2,160,000 | | | * | | Honbridge Holdings Ltd | | | 267 | |
| | 184,493 | | | *,e | | Horsehead Holding Corp | | | 2,991 | |
| | 49,000 | | | | | Hsin Kuang Steel Co Ltd | | | 32 | |
| | 2,813,700 | | | e | | Huabao International Holdings Ltd | | | 1,560 | |
| | 615,800 | | | | | Hubei Sanonda Co Ltd | | | 603 | |
| | 38,250 | | | | | Huchems Fine Chemical Corp | | | 871 | |
| | 201,892 | | | | | HudBay Minerals, Inc | | | 1,661 | |
| | 200,852 | | | | | Huhtamaki Oyj | | | 5,166 | |
COLLEGE RETIREMENT EQUITIES FUND - Stock Account
| | | | | | | | VALUE | |
| SHARES | | | | | COMPANY | | (000) | |
| | 532,000 | | | * | | Huili Resources Group Ltd | | $ | 132 | |
| | 1,648,000 | | | *,e | | Hunan Non-Ferrous Metal Ltd | | | 517 | |
| | 1,503,100 | | | | | Huntsman Corp | | | 36,976 | |
| | 27,968 | | | | | Hyosung Corp | | | 1,866 | |
| | 36,509 | | | m | | Hyundai Hysco | | | 1,436 | |
| | 58,099 | | | | | Hyundai Steel Co | | | 4,763 | |
| | 1,134,600 | | | | | IAMGOLD Corp | | | 3,770 | |
| | 37,000 | | | | | Ihara Chemical Industry Co Ltd | | | 279 | |
| | 693,788 | | | e | | Iluka Resources Ltd | | | 5,376 | |
| | 272,633 | | | | | Imerys S.A. | | | 23,732 | |
| | 565,224 | | | | | Impala Platinum Holdings Ltd | | | 6,645 | |
| | 63,900 | | | * | | Imperial Metals Corp | | | 962 | |
| | 3,277,429 | | | | | Incitec Pivot Ltd | | | 7,862 | |
| | 243,031 | | | | | Independence Group NL | | | 679 | |
| | 267,893 | | | | | India Cements Ltd | | | 261 | |
| | 1,566,778 | | | | | Indorama Ventures PCL (Foreign) | | | 954 | |
| | 181,200 | | | *,e | | Industrias CH SAB de C.V. | | | 1,222 | |
| | 136,580 | | | e | | Industrias Penoles S.A. de C.V. | | | 3,391 | |
| | 650,570 | | | | | Inner Mongolia Eerduosi Resourses Co Ltd | | | 630 | |
| | 85,865 | | | | | Innophos Holdings, Inc | | | 4,173 | |
| | 108,478 | | | | | Innospec, Inc | | | 5,014 | |
| | 68,743 | | | | | International Flavors & Fragrances, Inc | | | 5,911 | |
| | 74,700 | | | * | | International Forest Products Ltd | | | 945 | |
| | 1,970,145 | | | | | International Paper Co | | | 96,596 | |
| | 131,505 | | | | | Intertape Polymer Group, Inc | | | 1,737 | |
| | 215,736 | | | *,e | | Intrepid Potash, Inc | | | 3,417 | |
| | 2,820,000 | | | * | | IRC Ltd | | | 285 | |
| | 441,000 | | | * | | Ishihara Sangyo Kaisha Ltd | | | 483 | |
| | 582,412 | | | | | Israel Chemicals Ltd | | | 4,858 | |
| | 1,081 | | | * | | Israel Corp Ltd | | | 569 | |
| | 5,220 | | | | | ISU Chemical Co Ltd | | | 63 | |
| | 78,622 | | | | | Italcementi S.p.A. | | | 672 | |
| | 143,517 | | | | | Italcementi S.p.A. RNC | | | 673 | |
| | 7,057 | | | * | | Italmobiliare S.p.A. | | | 238 | |
| | 18,057 | | | * | | Italmobiliare S.p.A. RSP | | | 360 | |
| | 435,200 | | | * | | Ivanhoe Mines Ltd | | | 766 | |
| | 42,897 | | | * | | Izmir Demir Celik Sanayi AS | | | 43 | |
| | 376,549 | | | | | James Hardie Industries NV | | | 4,370 | |
| | 18,000 | | | | | Japan Pile Corp | | | 176 | |
| | 61,877 | | | | | Jastrzebska Spolka Weglowa S.A. | | | 1,089 | |
| | 289,111 | | | | | JFE Holdings, Inc | | | 6,890 | |
| | 7,914,900 | | | e | | Jiangxi Copper Co Ltd | | | 14,327 | |
| | 99,092 | | | | | Jindal Saw Ltd | | | 79 | |
| | 399,832 | | | * | | Jindal Steel & Power Ltd | | | 1,691 | |
| | 209,900 | | | * | | Jinshan Gold Mines, Inc | | | 534 | |
| | 346,211 | | | | | Johnson Matthey plc | | | 18,838 | |
| | 16,500 | | | | | JSP Corp | | | 251 | |
| | 308,055 | | | | | JSR Corp | | | 5,971 | |
COLLEGE RETIREMENT EQUITIES FUND - Stock Account
| | | | | | | | VALUE | |
| SHARES | | | | | COMPANY | | (000) | |
| | 97,115 | | | | | JSW Steel Ltd | | $ | 1,600 | |
| | 364,555 | | | e | | K&S AG. | | | 11,233 | |
| | 2,571,394 | | | *,b,e,m | | Kagara Zinc Ltd | | | 23 | |
| | 73,303 | | | | | Kaiser Aluminum Corp | | | 5,149 | |
| | 227,715 | | | | | Kaneka Corp | | | 1,495 | |
| | 434,424 | | | | | Kansai Paint Co Ltd | | | 6,424 | |
| | 133,993 | | | * | | Kapstone Paper and Packaging Corp | | | 7,485 | |
| | 80,636 | | | * | | Kardemir Karabuk Demir Celik S | | | 127 | |
| | 153,308 | | | * | | Kardemir Karabuk Demir Celik Sanayi ve Ticaret AS (Class A) | | | 136 | |
| | 337,549 | | | * | | Kardemir Karabuk Demir Celik Sanayi ve Ticaret AS (Class D) | | | 167 | |
| | 1,215 | | | | | Kartonsan Karton Sanayi | | | 128 | |
| | 341,144 | | | e | | Kazakhmys plc | | | 1,238 | |
| | 125,695 | | | e | | Kemira Oyj | | | 2,104 | |
| | 396,212 | | | | | KGHM Polska Miedz S.A. | | | 15,443 | |
| | 908,400 | | | | | Kian Joo Can Factory BHD | | | 866 | |
| | 796,478 | | | | | Kingsgate Consolidated Ltd | | | 667 | |
| | 1,482,578 | | | | | Kinross Gold Corp | | | 6,490 | |
| | 15,620 | | | | | KISCO Corp | | | 363 | |
| | 13,588 | | | | | KISWIRE Ltd | | | 481 | |
| | 513,155 | | | | | Klabin S.A. | | | 2,667 | |
| | 30,244 | | | e | | KMG Chemicals, Inc | | | 511 | |
| | 35,000 | | | | | Koatsu Gas Kogyo Co Ltd | | | 203 | |
| | 2,164,680 | | | * | | Kobe Steel Ltd | | | 3,711 | |
| | 8,750 | | | | | Kolon Corp | | | 141 | |
| | 46,694 | | | | | Kolon Industries, Inc | | | 2,425 | |
| | 39,500 | | | | | Konishi Co Ltd | | | 741 | |
| | 956 | | | | | Konya Cimento Sanayii | | | 110 | |
| | 111,298 | | | | | Koppers Holdings, Inc | | | 5,092 | |
| | 14,252 | | | | | Korea Kumho Petrochemical | | | 1,290 | |
| | 3,109 | | | * | | Korea Petrochemical Ind Co Ltd | | | 258 | |
| | 15,027 | | | | | Korea Zinc Co Ltd | | | 4,533 | |
| | 1,241,720 | | | | | Koza Altin Isletmeleri AS | | | 12,834 | |
| | 251,951 | | | * | | Koza Anadolu Metal Madencilik Isletmeleri AS | | | 284 | |
| | 3,822 | | | | | KPX Chemical Co Ltd | | | 231 | |
| | 129,521 | | | * | | Kraton Polymers LLC | | | 2,985 | |
| | 41,639 | | | e | | Kronos Worldwide, Inc | | | 793 | |
| | 57,000 | | | | | Krosaki Harima Corp | | | 136 | |
| | 16,391 | | | | | Kukdo Chemical Co Ltd | | | 863 | |
| | 148,457 | | | e | | Kumba Iron Ore Ltd | | | 6,285 | |
| | 54,000 | | | | | Kumiai Chemical Industry Co Ltd | | | 367 | |
| | 410,285 | | | | | Kuraray Co Ltd | | | 4,897 | |
| | 163,000 | | | | | Kureha CORP | | | 834 | |
| | 123,000 | | | | | Kurimoto Ltd | | | 292 | |
| | 16,900 | | | | | Kyoei Steel Ltd | | | 319 | |
| | 118,200 | | | | | Labrador Iron Ore Royalty Corp | | | 3,823 | |
| | 415,120 | | | | | Lafarge Malayan Cement BHD | | | 1,086 | |
| | 317,437 | | | | | Lafarge S.A. | | | 23,827 | |
| | 83,087 | | | * | | Landec Corp | | | 1,007 | |
COLLEGE RETIREMENT EQUITIES FUND - Stock Account
| SHARES | | | | | COMPANY | | VALUE
(000) | |
| | 106,853 | | | | | Lanxess AG. | | $ | 7,140 | |
| | 5,946,700 | | | | | Lee & Man Paper Manufacturing Ltd | | | 3,930 | |
| | 523,193 | | | | | LEE Chang Yung Chem IND Corp | | | 681 | |
| | 9,146 | | | e | | Lenzing AG. | | | 524 | |
| | 82,346 | | | | | LG Chem Ltd | | | 23,423 | |
| | 12,716 | | | | | LG Chem Ltd (Preference) | | | 1,840 | |
| | 65,835 | | | | | Linde AG. | | | 13,785 | |
| | 249,000 | | | | | Lingbao Gold Co Ltd | | | 43 | |
| | 93,700 | | | | | Lintec Corp | | | 1,737 | |
| | 496,300 | | | | | Lion Industries Corp BHD | | | 112 | |
| | 28,854 | | | | | Lock & Lock Co Ltd | | | 630 | |
| | 137,345 | | | *,e | | London Mining plc | | | 257 | |
| | 1,742,560 | | | | | Long Chen Paper Co Ltd | | | 873 | |
| | 571,657 | | | *,e | | Lonmin plc | | | 2,931 | |
| | 1,082,830 | | | * | | Louisiana-Pacific Corp | | | 20,043 | |
| | 68,434 | | | * | | LSB Industries, Inc | | | 2,807 | |
| | 76,000 | | | | | Luks Group Vietnam Holdings Ltd | | | 23 | |
| | 646,381 | | | * | | Lundin Mining Corp | | | 2,799 | |
| | 2,530,962 | | | *,e | | Lynas Corp Ltd | | | 669 | |
| | 4,523,066 | | | | | LyondellBasell Industries AF S.C.A | | | 363,112 | |
| | 14,285 | | | | | Madras Cements Ltd | | | 44 | |
| | 61,469 | | | * | | MAG. Silver Corp | | | 318 | |
| | 220,000 | | | | | Magnesita Refratarios S.A. | | | 551 | |
| | 4,905 | | | * | | Maharashtra Seamless Ltd | | | 13 | |
| | 193,712 | | | | | Major Drilling Group International | | | 1,402 | |
| | 111,393 | | | | | Mardin Cimento Sanayii | | | 221 | |
| | 13,045 | | | *,e | | Marrone Bio Innovations, Inc | | | 232 | |
| | 39,092 | | | | | Martin Marietta Materials, Inc | | | 3,907 | |
| | 26,624 | | | | | Maruichi Steel Tube Ltd | | | 673 | |
| | 4,965,653 | | | | | Masisa S.A. | | | 326 | |
| | 18,730 | | | e | | Mayr-Melnhof Karton AG. | | | 2,319 | |
| | 304,520 | | | | | MeadWestvaco Corp | | | 11,246 | |
| | 50,024 | | | e | | Mechel Steel Group OAO (ADR) | | | 128 | |
| | 258,732 | | | *,e | | Medusa Mining Ltd | | | 475 | |
| | 2,964,930 | | | * | | Merafe Resources Ltd | | | 232 | |
| | 549,742 | | | * | | Metals X Ltd | | | 84 | |
| | 384,400 | | | | | Metalurgica Gerdau S.A. | | | 3,823 | |
| | 172,286 | | | | | Methanex Corp | | | 10,189 | |
| | 1,203,109 | | | | | Mexichem SAB de C.V. | | | 4,954 | |
| | 5,102,000 | | | e | | Midas Holdings Ltd | | | 2,068 | |
| | 351,591 | | | *,e | | Midway Gold Corp | | | 285 | |
| | 683,838 | | | *,e | | Minera Frisco SAB de C.V. | | | 1,410 | |
| | 108,873 | | | * | | Mineral Deposits Ltd | | | 272 | |
| | 135,421 | | | | | Minerals Technologies, Inc | | | 8,135 | |
| | 2,104,400 | | | *,e | | Minmetals Resources Ltd | | | 447 | |
| | 3,829,337 | | | *,e,m | | Mirabela Nickel Ltd | | | 27 | |
| | 2,745,113 | | | | | Mitsubishi Chemical Holdings Corp | | | 12,704 | |
| | 309,158 | | | | | Mitsubishi Gas Chemical Co, Inc | | | 2,279 | |
COLLEGE RETIREMENT EQUITIES FUND - Stock Account
| SHARES | | | | | COMPANY | | VALUE
(000) | |
| | 3,010,060 | | | | | Mitsubishi Materials Corp | | $ | 11,127 | |
| | 400,000 | | | | | Mitsubishi Paper Mills Ltd | | | 350 | |
| | 173,000 | | | | | Mitsubishi Steel Manufacturing Co Ltd | | | 439 | |
| | 675,402 | | | | | Mitsui Chemicals, Inc | | | 1,633 | |
| | 1,684,000 | | | | | Mitsui Mining & Smelting Co Ltd | | | 5,178 | |
| | 220,057 | | | * | | Mittal Steel South Africa Ltd | | | 783 | |
| | 877,033 | | | e | | MMC Norilsk Nickel (ADR) | | | 14,606 | |
| | 20,185 | | | | | MNTech Co Ltd | | | 120 | |
| | 567,944 | | | *,e | | Molycorp, Inc | | | 3,192 | |
| | 215,194 | | | | | Mondi Ltd | | | 3,688 | |
| | 807,303 | | | | | Mondi plc | | | 14,014 | |
| | 2,909,837 | | | | | Monsanto Co | | | 339,142 | |
| | 53,400 | | | | | Moorim P&P Co Ltd | | | 289 | |
| | 451,817 | | | | | Mosaic Co | | | 21,357 | |
| | 4,292,571 | | | | | Mount Gibson Iron Ltd | | | 3,905 | |
| | 267,267 | | | | | Mpact Ltd | | | 685 | |
| | 398,714 | | | e | | M-real Oyj (B Shares) | | | 1,725 | |
| | 188,670 | | | | | Myers Industries, Inc | | | 3,985 | |
| | 147,551 | | | * | | Mytilineos Holdings S.A. | | | 1,153 | |
| | 531,194 | | | *,m | | Nagarjuna Fertilizers & Chemicals | | | 68 | |
| | 187,000 | | | * | | Nakayama Steel Works Ltd | | | 169 | |
| | 50,510 | | | | | Namhae Chemical Corp | | | 331 | |
| | 670,745 | | | | | Nampak Ltd | | | 2,624 | |
| | 5,661,813 | | | | | Nan Ya Plastics Corp | | | 13,118 | |
| | 737,418 | | | | | Nantex Industry Co Ltd | | | 477 | |
| | 67,989 | | | | | Neenah Paper, Inc | | | 2,908 | |
| | 33,100 | | | | | Neturen Co Ltd | | | 272 | |
| | 495,056 | | | e | | Nevsun Resources Ltd | | | 1,645 | |
| | 682,582 | | | * | | New Gold, Inc | | | 3,573 | |
| | 112,930 | | | *,e | | New World Resources plc (A Shares) | | | 137 | |
| | 1,025,659 | | | | | Newcrest Mining Ltd | | | 7,202 | |
| | 64,699 | | | e | | NewMarket Corp | | | 21,619 | |
| | 459,325 | | | | | Newmont Mining Corp | | | 10,578 | |
| | 167,200 | | | * | | NGEx Resources, Inc | | | 225 | |
| | 1,481,250 | | | | | Nickel Asia Corp | | | 509 | |
| | 124,700 | | | | | Nihon Nohyaku Co Ltd | | | 1,787 | |
| | 54,874 | | | | | Nihon Parkerizing Co Ltd | | | 1,146 | |
| | 220,000 | | | | | Nihon Yamamura Glass Co Ltd | | | 389 | |
| | 4,716,800 | | | e | | Nine Dragons Paper Holdings Ltd | | | 4,120 | |
| | 70,000 | | | e | | Nippon Carbide Industries Co I | | | 211 | |
| | 115,000 | | | | | Nippon Denko Co Ltd | | | 347 | |
| | 194,800 | | | | | Nippon Kayaku Co Ltd | | | 2,770 | |
| | 642,400 | | | | | Nippon Light Metal Holdings Co Ltd | | | 869 | |
| | 195,000 | | | | | Nippon Paint Co Ltd | | | 3,244 | |
| | 212,200 | | | e | | Nippon Paper Industries Co Ltd | | | 3,941 | |
| | 156,000 | | | | | Nippon Shokubai Co Ltd | | | 1,724 | |
| | 163,000 | | | | | Nippon Soda Co Ltd | | | 1,040 | |
| | 7,380,870 | | | | | Nippon Steel Corp | | | 24,754 | |
COLLEGE RETIREMENT EQUITIES FUND - Stock Account
| SHARES | | | | | COMPANY | | VALUE
(000) | |
| | 48,810 | | | | | Nippon Synthetic Chemical Industry Co Ltd | | $ | 438 | |
| | 215,000 | | | | | Nippon Valqua Industries Ltd | | | 578 | |
| | 165,000 | | | *,e | | Nippon Yakin Kogyo Co Ltd | | | 557 | |
| | 145,800 | | | | | Nissan Chemical Industries Ltd | | | 2,317 | |
| | 143,200 | | | | | Nisshin Steel Holdings Co Ltd | | | 1,716 | |
| | 162,000 | | | | | Nittetsu Mining Co Ltd | | | 801 | |
| | 144,479 | | | | | Nitto Denko Corp | | | 6,109 | |
| | 326,921 | | | | | NOF Corp | | | 2,327 | |
| | 174,206 | | | | | Noranda Aluminium Holding Corp | | | 573 | |
| | 119,076 | | | e | | Norbord, Inc | | | 3,796 | |
| | 39,802 | | | | | Norddeutsche Affinerie AG. | | | 2,429 | |
| | 1,167,341 | | | e | | Norsk Hydro ASA | | | 5,222 | |
| | 155,822 | | | *,e | | North American Palladium Ltd | | | 106 | |
| | 13,010,000 | | | * | | North Mining Shares Co Ltd | | | 520 | |
| | 377,875 | | | * | | Northam Platinum Ltd | | | 1,518 | |
| | 1,280,544 | | | | | Northern Star Resources Ltd | | | 903 | |
| | 344,582 | | | * | | Novagold Resources, Inc | | | 876 | |
| | 22,222 | | | e | | Novolipetsk Steel (GDR) | | | 376 | |
| | 707,034 | | | | | Nucor Corp | | | 37,741 | |
| | 1,116,318 | | | e | | Nufarm Ltd | | | 4,385 | |
| | 434,890 | | | e | | Nuplex Industries Ltd | | | 1,217 | |
| | 485,606 | | | e | | Nyrstar | | | 1,545 | |
| | 86,450 | | | *,m | | Nyrstar (Strip VVPR) | | | 0 | ^ |
| | 245,000 | | | * | | Ocean Plastics Co Ltd | | | 283 | |
| | 635,200 | | | * | | OceanaGold Corp | | | 981 | |
| | 712,259 | | | | | OJI Paper Co Ltd | | | 3,653 | |
| | 164,000 | | | | | Okamoto Industries, Inc | | | 511 | |
| | 274,272 | | | e | | Olin Corp | | | 7,913 | |
| | 34,387 | | | | | Olympic Steel, Inc | | | 997 | |
| | 183,215 | | | * | | OM Group, Inc | | | 6,671 | |
| | 350,588 | | | * | | OM Holdings Ltd | | | 102 | |
| | 115,257 | | | | | Omnia Holdings Ltd | | | 2,219 | |
| | 156,204 | | | * | | Omnova Solutions, Inc | | | 1,423 | |
| | 2,793,713 | | | | | OneSteel Ltd | | | 4,387 | |
| | 923,945 | | | | | Orica Ltd | | | 19,757 | |
| | 753,600 | | | | | Oriental Union Chemical Corp | | | 816 | |
| | 3,058,051 | | | * | | Orora Ltd | | | 3,167 | |
| | 11,800 | | | | | Osaka Steel Co Ltd | | | 205 | |
| | 548,800 | | | * | | Osisko Mining Corp | | | 2,433 | |
| | 1,215,665 | | | *,e | | Outokumpu Oyj | | | 680 | |
| | 1,470,698 | | | * | | Owens-Illinois, Inc | | | 52,622 | |
| | 385,537 | | | | | Oxiana Ltd | | | 1,090 | |
| | 169,507 | | | | | Pacific Metals Co Ltd | | | 619 | |
| | 17,800 | | | | | Pack Corp | | | 316 | |
| | 1,030,952 | | | | | Packaging Corp of America | | | 65,239 | |
| | 2,553,405 | | | e | | Pan African Resources plc | | | 571 | |
| | 194,100 | | | | | Pan American Silver Corp | | | 2,268 | |
| | 644,626 | | | | | Pan Australian Resources Ltd | | | 1,046 | |
COLLEGE RETIREMENT EQUITIES FUND - Stock Account
| SHARES | | | | | COMPANY | | VALUE
(000) | |
| | 81,419 | | | | | Papeles y Cartones de Europa S.A. | | $ | 431 | |
| | 308,118 | | | *,e | | Papillon Resources Ltd | | | 271 | |
| | 402,630 | | | *,e | | Paramount Gold and Silver Corp | | | 375 | |
| | 242,400 | | | * | | Paranapanema S.A. | | | 535 | |
| | 87,812 | | | * | | Park Elektrik Madencilik Sanayi Ve Ticaret AS | | | 201 | |
| | 27,302 | | | * | | Penford Corp | | | 351 | |
| | 663,688 | | | * | | Perseus Mining Ltd | | | 147 | |
| | 211,115 | | | e | | Peter Hambro Mining plc | | | 256 | |
| | 506,462 | | | * | | Petra Diamonds Ltd | | | 995 | |
| | 3,292,900 | | | | | Petronas Chemicals Group BHD | | | 6,963 | |
| | 264,041 | | | *,m | | Pike River Coal Ltd | | | 0 | ^ |
| | 739,995 | | | | | PolyOne Corp | | | 26,159 | |
| | 11,560 | | | | | Poongsan | | | 322 | |
| | 76,210 | | | | | Poongsan Corp | | | 2,070 | |
| | 422,114 | | | | | Portucel Empresa Produtora de Pasta e Papel S.A. | | | 1,690 | |
| | 129,024 | | | | | POSCO | | | 40,147 | |
| | 48,800 | | | | | POSCO M-Tech Co Ltd | | | 307 | |
| | 9,231 | | | | | POSCO Refractories & Environment Co Ltd | | | 1,097 | |
| | 1,158,198 | | | e | | Potash Corp of Saskatchewan (Toronto) | | | 38,183 | |
| | 569,486 | | | | | PPC Ltd | | | 1,706 | |
| | 1,138,842 | | | | | PPG Industries, Inc | | | 215,993 | |
| | 349,761 | | | | | Praxair, Inc | | | 45,479 | |
| | 160,400 | | | *,e | | Premier Gold Mines Ltd | | | 227 | |
| | 488,300 | | | | | Press Metal BHD | | | 346 | |
| | 100,200 | | | *,e | | Pretium Resources, Inc | | | 517 | |
| | 110,000 | | | * | | Primero Mining Corp | | | 485 | |
| | 2,726,500 | | | | | PT Aneka Tambang Tbk | | | 244 | |
| | 1,705,900 | | | | | PT Indocement Tunggal Prakarsa Tbk | | | 2,810 | |
| | 6,731,000 | | | | | PT International Nickel Indonesia Tbk | | | 1,468 | |
| | 11,168,500 | | | * | | PT Krakatau Steel Tbk | | | 454 | |
| | 3,492,500 | | | | | PT Semen Gresik Persero Tbk | | | 4,073 | |
| | 8,299,000 | | | | | PT Timah Tbk | | | 1,094 | |
| | 6,601,887 | | | | | PTT Global Chemical PCL | | | 15,944 | |
| | 50,739 | | | | | Quaker Chemical Corp | | | 3,910 | |
| | 424,638 | | | *,e | | Qualipak International Holdings Ltd | | | 41 | |
| | 17,540 | | | | | Rallis India Ltd | | | 51 | |
| | 15,866 | | | | | Randgold Resources Ltd | | | 998 | |
| | 288,051 | | | | | Rautaruukki Oyj | | | 2,671 | |
| | 461,656 | | | | | Regis Resources Ltd | | | 1,212 | |
| | 381,007 | | | | | Reliance Steel & Aluminum Co | | | 28,896 | |
| | 605,767 | | | | | Rengo Co Ltd | | | 3,646 | |
| | 750,468 | | | *,e | | Rentech, Inc | | | 1,313 | |
| | 279,386 | | | *,e | | Resolute Forest Products | | | 4,476 | |
| | 2,889,368 | | | * | | Resolute Mining Ltd | | | 1,445 | |
| | 730,955 | | | | | Rexam plc | | | 6,431 | |
| | 29,078 | | | e | | RHI AG. | | | 901 | |
| | 81,738 | | | * | | Rio Alto Mining Ltd | | | 133 | |
COLLEGE RETIREMENT EQUITIES FUND - Stock Account
| SHARES | | | | | COMPANY | | VALUE
(000) | |
| | 396,712 | | | | | Rio Tinto Ltd | | $ | 24,282 | |
| | 1,618,181 | | | | | Rio Tinto plc | | | 91,443 | |
| | 209,917 | | | | | Rock-Tenn Co (Class A) | | | 22,043 | |
| | 164,789 | | | | | Rockwood Holdings, Inc | | | 11,852 | |
| | 673,700 | | | * | | Romarco Minerals, Inc | | | 238 | |
| | 116,000 | | | | | Rotam Global Agrosciences Ltd | | | 257 | |
| | 81,850 | | | * | | Royal Bafokeng Platinum Ltd | | | 460 | |
| | 126,425 | | | | | Royal Gold, Inc | | | 5,824 | |
| | 229,646 | | | | | RPC Group plc | | | 2,247 | |
| | 476,032 | | | | | RPM International, Inc | | | 19,760 | |
| | 123,460 | | | * | | RTI International Metals, Inc | | | 4,224 | |
| | 349,400 | | | *,e | | Rubicon Minerals Corp | | | 322 | |
| | 18,388 | | | | | Sa des Ciments Vicat | | | 1,366 | |
| | 122,000 | | | | | Sakai Chemical Industry Co Ltd | | | 377 | |
| | 33,000 | | | | | Sakata INX Corp | | | 314 | |
| | 49,281 | | | | | Salzgitter AG. | | | 2,102 | |
| | 2,833 | | | | | Sam Kwang Glass Ind Co Ltd | | | 126 | |
| | 25,546 | | | | | Samsung Fine Chemicals Co Ltd | | | 1,081 | |
| | 246,040 | | | | | San Fang Chemical Industry Co Ltd | | | 260 | |
| | 107,267 | | | * | | Sandfire Resources NL | | | 622 | |
| | 117,700 | | | * | | Sandstorm Gold Ltd | | | 509 | |
| | 162,000 | | | | | Sanyo Chemical Industries Ltd | | | 1,111 | |
| | 207,000 | | | | | Sanyo Special Steel Co Ltd | | | 1,011 | |
| | 530,528 | | | * | | Sappi Ltd | | | 1,659 | |
| | 788,920 | | | | | Satipel Industrial S.A. | | | 4,403 | |
| | 552,309 | | | | | Schmolz + Bickenbach AG. | | | 685 | |
| | 100,290 | | | | | Schnitzer Steel Industries, Inc (Class A) | | | 3,276 | |
| | 162,507 | | | | | Schweitzer-Mauduit International, Inc | | | 8,364 | |
| | 143,145 | | | | | Scotts Miracle-Gro Co (Class A) | | | 8,906 | |
| | 46,200 | | | *,e | | Seabridge Gold, Inc | | | 334 | |
| | 45,606 | | | | | Seah Besteel Corp | | | 1,123 | |
| | 2,498 | | | | | SeAH Holdings Corp | | | 224 | |
| | 11,868 | | | | | SeAH Steel Corp | | | 995 | |
| | 2,305,594 | | | | | Sealed Air Corp | | | 78,505 | |
| | 1,524,000 | | | | | Sekisui Plastics Co Ltd | | | 4,085 | |
| | 365,320 | | | e | | SEMAFO, Inc | | | 960 | |
| | 113,903 | | | | | Semapa-Sociedade de Investimento e Gestao | | | 1,276 | |
| | 194,192 | | | | | Sensient Technologies Corp | | | 9,422 | |
| | 11,828 | | | *,e | | Sequana S.A. | | | 93 | |
| | 1,254,708 | | | | | Sesa Goa Ltd | | | 4,111 | |
| | 17,850 | | | | | Sesoda Corp | | | 19 | |
| | 210,648 | | | e | | Severstal (GDR) | | | 2,086 | |
| | 1,509,000 | | | | | Shandong Chenming Paper Holdings Ltd | | | 661 | |
| | 1,096,050 | | | | | Shandong Chenming Paper Holdings Ltd (Class B) | | | 543 | |
| | 155,400 | | | * | | Shanghai Chlor-Alkali Chemical Co Ltd | | | 74 | |
| | 246,300 | | | | | Shanghai Yaohua Pilkington Glass Co Ltd | | | 138 | |
| | 201,000 | | | | | Sheng Yu Steel Co Ltd | | | 152 | |
| | 359,500 | | | e | | Sherritt International Corp | | | 1,252 | |
COLLEGE RETIREMENT EQUITIES FUND - Stock Account
| SHARES | | | | | COMPANY | | VALUE
(000) | |
| | 540,559 | | | | | Sherwin-Williams Co | | $ | 99,193 | |
| | 218,000 | | | * | | Shihlin Paper Corp | | | 335 | |
| | 38,000 | | | | | Shikoku Chemicals Corp | | | 288 | |
| | 11,529 | | | * | | Shine Co Ltd | | | 100 | |
| | 453,112 | | | | | Shin-Etsu Chemical Co Ltd | | | 26,502 | |
| | 126,300 | | | | | Shin-Etsu Polymer Co Ltd | | | 455 | |
| | 3,959,032 | | | | | Shinkong Synthetic Fibers Corp | | | 1,391 | |
| | 259,000 | | | | | Shiny Chemical Industrial Co Ltd | | | 431 | |
| | 6,362,000 | | | *,e | | Shougang Concord International Enterprises Co Ltd | | | 370 | |
| | 1,066,723 | | | e | | Showa Denko KK | | | 1,513 | |
| | 5,300 | | | | | Siam Cement PCL | | | 65 | |
| | 549,200 | | | | | Siam Cement PCL (Foreign) | | | 6,810 | |
| | 1,708,804 | | | | | Sibanye Gold Ltd | | | 2,008 | |
| | 160,545 | | | | | Sigma-Aldrich Corp | | | 15,093 | |
| | 1,131,000 | | | *,m | | Sijia Group Co | | | 1 | |
| | 1,785 | | | | | Sika AG. | | | 6,361 | |
| | 235,055 | | | | | Silgan Holdings, Inc | | | 11,287 | |
| | 368,662 | | | *,e | | Silver Lake Resources Ltd | | | 178 | |
| | 100,842 | | | * | | Silver Standard Resources, Inc | | | 700 | |
| | 870,002 | | | | | Silver Wheaton Corp | | | 17,568 | |
| | 362,577 | | | e | | Silvercorp Metals, Inc | | | 833 | |
| | 278,386 | | | *,e | | Sims Group Ltd | | | 2,712 | |
| | 1,852,000 | | | e | | Sinochem Hong Kong Holding Ltd | | | 302 | |
| | 1,116,000 | | | | | Sinon Corp | | | 626 | |
| | 5,240,850 | | | | | Sinopec Shanghai Petrochemical Co Ltd | | | 1,512 | |
| | 248,160 | | | *,e | | Sirius Resources NL | | | 507 | |
| | 22,402 | | | | | SK Chemicals Co Ltd | | | 1,174 | |
| | 24,767 | | | | | SKC Co Ltd | | | 719 | |
| | 757,180 | | | | | Smurfit Kappa Group plc | | | 18,582 | |
| | 290,002 | | | e | | Smurfit Kappa Group plc (Euro Comp) | | | 7,135 | |
| | 112,796 | | | | | Sociedad Quimica y Minera de Chile S.A. (Class B) | | | 2,873 | |
| | 2,028 | | | | | Societe Internationale de Plantations d’Heveas S.A. | | | 143 | |
| | 11,472 | | | | | SODIFF Advanced Materials Co Ltd | | | 324 | |
| | 878,478 | | | | | Solar Applied Materials Technology Co | | | 752 | |
| | 148,224 | | | | | Solvay S.A. | | | 23,459 | |
| | 15,770 | | | | | Songwon Industrial Co Ltd | | | 149 | |
| | 236,032 | | | | | Sonoco Products Co | | | 9,847 | |
| | 259,351 | | | * | | South Valley Cement | | | 184 | |
| | 385,000 | | | | | Southeast Cement Co Ltd | | | 226 | |
| | 1,575,784 | | | | | Southern Copper Corp (NY) | | | 45,241 | |
| | 211,521 | | | e | | Ssab Svenskt Stal AB (Series A) | | | 1,625 | |
| | 97,178 | | | | | Ssab Svenskt Stal AB (Series B) | | | 628 | |
| | 44,540 | | | * | | Ssangyong Cement Industrial Co Ltd | | | 289 | |
| | 620,881 | | | * | | St Barbara Ltd | | | 146 | |
| | 820,557 | | | | | Steel Dynamics, Inc | | | 16,034 | |
| | 12,700 | | | | | Stella Chemifa Corp | | | 191 | |
| | 66,506 | | | | | Stepan Co | | | 4,365 | |
| | 466,292 | | | *,e | | Stillwater Mining Co | | | 5,754 | |
COLLEGE RETIREMENT EQUITIES FUND - Stock Account
| SHARES | | | | | COMPANY | | VALUE
(000) | |
| | 5,036 | | | | | STO AG. | | $ | 957 | |
| | 2,556,054 | | | | | Stora Enso Oyj (R Shares) | | | 25,685 | |
| | 1,412,221 | | | | | Sumitomo Bakelite Co Ltd | | | 5,080 | |
| | 1,529,329 | | | | | Sumitomo Chemical Co Ltd | | | 6,002 | |
| | 1,066,618 | | | | | Sumitomo Metal Mining Co Ltd | | | 13,976 | |
| | 1,341,193 | | | | | Sumitomo Osaka Cement Co Ltd | | | 5,156 | |
| | 46,000 | | | | | Sumitomo Seika Chemicals Co Ltd | | | 377 | |
| | 25,412 | | | e | | Sumitomo Titanium Corp | | | 443 | |
| | 281,120 | | | * | | SunCoke Energy, Inc | | | 6,412 | |
| | 3,011,979 | | | * | | Sundance Resources Ltd | | | 256 | |
| | 13,211 | | | * | | Supreme Industries Ltd | | | 91 | |
| | 575,900 | | | | | Suzano Papel e Celulose S.A. | | | 2,260 | |
| | 160,410 | | | | | Symrise AG. | | | 7,401 | |
| | 92,106 | | | | | Syngenta AG. | | | 36,722 | |
| | 1,483,178 | | | | | Synthos S.A. | | | 2,681 | |
| | 73,389 | | | *,e | | Syrah Resources Ltd | | | 203 | |
| | 94,100 | | | | | Ta Ann Holdings BHD | | | 120 | |
| | 1,200,320 | | | | | TA Chen Stainless Pipe | | | 568 | |
| | 1,037 | | | | | Taekwang Industrial Co Ltd | | | 1,269 | |
| | 164,811 | | | *,e | | Tahoe Resources, Inc | | | 2,742 | |
| | 102,700 | | | * | | Tahoe Resources, Inc (Toronto) | | | 1,708 | |
| | 1,981,174 | | | | | Taiheiyo Cement Corp | | | 7,619 | |
| | 9,301,988 | | | | | Taiwan Cement Corp | | | 14,464 | |
| | 1,006,600 | | | | | Taiwan Fertilizer Co Ltd | | | 2,283 | |
| | 335,345 | | | | | Taiwan Hon Chuan Enterprise Co Ltd | | | 707 | |
| | 155,000 | | | | | Taiwan Prosperity Chemical Corp | | | 146 | |
| | 795,980 | | | * | | Taiwan Styrene Monomer | | | 564 | |
| | 18,800 | | | | | Taiyo Ink Manufacturing Co Ltd | | | 592 | |
| | 168,464 | | | | | Taiyo Nippon Sanso Corp | | | 1,200 | |
| | 103,000 | | | | | Takasago International Corp | | | 579 | |
| | 126,000 | | | | | Takiron Co Ltd | | | 520 | |
| | 51,552 | | | *,e | | Taminco Corp | | | 1,042 | |
| | 120,154 | | | *,e | | Tanzanian Royalty Exploration Corp | | | 209 | |
| | 258,359 | | | * | | Taseko Mines Ltd | | | 550 | |
| | 1,195,115 | | | | | Tata Steel Ltd | | | 8,214 | |
| | 972,000 | | | | | TCC International Holdings Ltd | | | 477 | |
| | 31,231 | | | | | Technosemichem Co Ltd | | | 1,322 | |
| | 1,323,315 | | | e | | Teck Cominco Ltd | | | 34,445 | |
| | 3,826,713 | | | | | Teijin Ltd | | | 8,524 | |
| | 32,119 | | | | | Ten Cate NV | | | 1,013 | |
| | 38,600 | | | | | Tenma Corp | | | 605 | |
| | 35,046 | | | | | Ternium S.A. (ADR) | | | 1,097 | |
| | 26,395 | | | e | | Tessenderlo Chemie NV | | | 690 | |
| | 71,578 | | | *,e | | Texas Industries, Inc | | | 4,923 | |
| | 201,381 | | | *,e | | Thompson Creek Metals Co, Inc (Toronto) | | | 440 | |
| | 394,075 | | | | | Thye Ming Industrial Co Ltd | | | 471 | |
| | 43,778 | | | * | | ThyssenKrupp AG. | | | 1,068 | |
| | 2,586,000 | | | | | Tiangong International Co Ltd | | | 749 | |
COLLEGE RETIREMENT EQUITIES FUND - Stock Account
| SHARES | | | | | COMPANY | | VALUE
(000) | |
| | 1,865,808 | | | * | | Tiger Resources Ltd | | $ | 578 | |
| | 320,936 | | | * | | Timmins Gold Corp | | | 341 | |
| | 58,923 | | | * | | Titan Cement Co S.A. | | | 1,605 | |
| | 283,000 | | | | | Toagosei Co Ltd | | | 1,211 | |
| | 34,900 | | | e | | Toho Titanium Co Ltd | | | 244 | |
| | 169,000 | | | | | Toho Zinc Co Ltd | | | 566 | |
| | 701,000 | | | | | Tokai Carbon Co Ltd | | | 2,449 | |
| | 649,000 | | | | | Tokuyama Corp | | | 2,467 | |
| | 126,200 | | | | | Tokyo Ohka Kogyo Co Ltd | | | 2,702 | |
| | 152,796 | | | *,e | | Tokyo Rope Manufacturing Co Ltd | | | 240 | |
| | 115,400 | | | * | | Tokyo Steel Manufacturing Co Ltd | | | 599 | |
| | 1,317,750 | | | | | Ton Yi Industrial Corp | | | 1,357 | |
| | 100,625 | | | | | Topco Technologies Corp | | | 240 | |
| | 266,000 | | | | | Topy Industries Ltd | | | 493 | |
| | 1,166,534 | | | | | Toray Industries, Inc | | | 8,081 | |
| | 962,005 | | | | | Tosoh Corp | | | 4,482 | |
| | 314,000 | | | | | Toyo Ink Manufacturing Co Ltd | | | 1,550 | |
| | 145,000 | | | | | Toyo Kohan Co Ltd | | | 679 | |
| | 248,150 | | | | | Toyo Seikan Kaisha Ltd | | | 5,342 | |
| | 2,831,676 | | | | | Toyobo Co Ltd | | | 5,227 | |
| | 1,555,500 | | | | | TPI Polene PCL | | | 513 | |
| | 92,547 | | | | | Tredegar Corp | | | 2,666 | |
| | 726,335 | | | | | TSRC Corp | | | 1,074 | |
| | 108,975 | | | | | Tubacex S.A. | | | 434 | |
| | 127,313 | | | e | | Tubos Reunidos S.A. | | | 310 | |
| | 815,900 | | | | | Tung Ho Steel Enterprise Corp | | | 718 | |
| | 973,377 | | | *,e | | Turquoise Hill Resources Ltd | | | 3,216 | |
| | 1,391,136 | | | | | UBE Industries Ltd | | | 2,980 | |
| | 19,357 | | | * | | UFP Technologies, Inc | | | 488 | |
| | 64,517 | | | | | Ultra Tech Cement Ltd | | | 1,842 | |
| | 13,013 | | | | | Umicore | | | 608 | |
| | 34,600 | | | | | Uniao de Industrias Petroquimicas S.A. | | | 8 | |
| | 9,791 | | | | | Unid Co Ltd | | | 549 | |
| | 511,629 | | | | | United Phosphorus Ltd | | | 1,640 | |
| | 12,554 | | | * | | United States Lime & Minerals, Inc | | | 768 | |
| | 901,546 | | | e | | United States Steel Corp | | | 26,596 | |
| | 619,000 | | | | | Universal Cement Corp | | | 588 | |
| | 25,829 | | | * | | Universal Stainless & Alloy | | | 931 | |
| | 1,583,632 | | | | | UPC Technology Corp | | | 769 | |
| | 1,437,138 | | | | | UPM-Kymmene Oyj | | | 24,374 | |
| | 327,155 | | | | | Uralkali (GDR) | | | 8,712 | |
| | 46,448 | | | * | | US Concrete, Inc | | | 1,051 | |
| | 68,363 | | | | | US Silica Holdings Inc | | | 2,332 | |
| | 2,332,987 | | | | | USI Corp | | | 1,623 | |
| | 929,562 | | | * | | Usinas Siderurgicas de Minas Gerais S.A. (Preference) | | | 5,599 | |
| | 2,322,718 | | | | | Vale S.A. | | | 35,128 | |
| | 3,859,806 | | | | | Vale S.A. (Preference) | | | 53,493 | |
| | 75,379 | | | | | Valspar Corp | | | 5,374 | |
COLLEGE RETIREMENT EQUITIES FUND - Stock Account
| SHARES | | | | | COMPANY | | VALUE
(000) | |
| | 158,219 | | | | | Vedanta Resources plc | | $ | 2,456 | |
| | 315 | | | | | Vetropack Holding AG. | | | 643 | |
| | 177,846 | | | | | Victrex plc | | | 5,426 | |
| | 103,916 | | | * | | Viohalco S.A. | | | 530 | |
| | 240,608 | | | | | Voestalpine AG. | | | 11,562 | |
| | 92,184 | | | | | Vulcan Materials Co | | | 5,478 | |
| | 146,932 | | | e | | Wacker Chemie AG. | | | 16,289 | |
| | 1,843,335 | | | e | | Walter Energy, Inc | | | 30,655 | |
| | 161,048 | | | | | Wausau Paper Corp | | | 2,042 | |
| | 2,818,000 | | | | | West China Cement Ltd | | | 419 | |
| | 233,887 | | | | | West Fraser Timber Co Ltd | | | 22,811 | |
| | 190,590 | | | e | | Western Areas NL | | | 406 | |
| | 287,718 | | | * | | Western Desert Resources Ltd | | | 189 | |
| | 580,700 | | | | | Western Forest Products, Inc | | | 1,050 | |
| | 182,275 | | | | | Westlake Chemical Corp | | | 22,250 | |
| | 16,860 | | | * | | WHX Corp | | | 408 | |
| | 1,975,000 | | | * | | Winsway Coking Coal Holding Ltd | | | 125 | |
| | 273,775 | | | | | Worthington Industries, Inc | | | 11,520 | |
| | 897,632 | | | * | | WR Grace & Co | | | 88,749 | |
| | 1,118,000 | | | *,e | | Xinjiang Xinxin Mining Industry Co Ltd | | | 168 | |
| | 500,000 | | | | | Xiwang Special Steel Co Ltd | | | 69 | |
| | 571,713 | | | | | Yamana Gold, Inc | | | 4,930 | |
| | 5,012 | | | | | Yamato Kogyo Co Ltd | | | 160 | |
| | 360,605 | | | | | Yara International ASA | | | 15,552 | |
| | 570,000 | | | | | Yeun Chyang Industrial Co Ltd | | | 438 | |
| | 1,895,670 | | | * | | Yieh Phui Enterprise | | | 616 | |
| | 1,649,600 | | | | | Yingde Gases | | | 1,731 | |
| | 582,000 | | | | | Yip’s Chemical Holdings Ltd | | | 503 | |
| | 256,000 | | | | | Yodogawa Steel Works Ltd | | | 1,103 | |
| | 42,970 | | | | | Youlchon Chemical Co Ltd | | | 479 | |
| | 1,380,500 | | | | | Youyuan International Holdings Ltd | | | 357 | |
| | 1,537,285 | | | | | Yuen Foong Yu Paper Manufacturing Co Ltd | | | 770 | |
| | 349,667 | | | | | Yule Catto & Co plc | | | 1,480 | |
| | 99,000 | | | | | Yung Chi Paint & Varnish Manufacturing Co Ltd | | | 260 | |
| | 30,473 | | | | | Zaklady Azotowe w Tarnowie-Moscicach S.A. | | | 630 | |
| | 40,165 | | | | | Zaklady Chemiczne Police S.A. | | | 320 | |
| | 397,512 | | | | | Zeon Corp | | | 3,725 | |
| | 94,141 | | | | | Zep, Inc | | | 1,710 | |
| | 349,500 | | | e | | Zhaojin Mining Industry Co Ltd | | | 201 | |
| | 44,894 | | | | | Zignago Vetro S.p.A. | | | 305 | |
| | 22,573,800 | | | e | | Zijin Mining Group Co Ltd | | | 4,861 | |
| | 104,275 | | | *,e | | Zoltek Cos, Inc | | | 1,747 | |
| | | | | | | TOTAL MATERIALS | | | 6,729,710 | |
| | | | | | | | | | | |
| MEDIA - 3.8% | | | | |
| | 1,500,000 | | | | | ABS-CBN Holdings Corp (ADR) | | | 1,079 | |
| | 19,200 | | | *,e | | Adways, Inc | | | 534 | |
| | 86,132 | | | | | AH Belo Corp (Class A) | | | 643 | |
COLLEGE RETIREMENT EQUITIES FUND - Stock Account
| SHARES | | | | | COMPANY | | VALUE
(000) | |
| | 233,660 | | | e | | Aimia, Inc | | $ | 4,292 | |
| | 167,867 | | | * | | AMC Entertainment Holdings, Inc | | | 3,450 | |
| | 614,686 | | | * | | AMC Networks, Inc | | | 41,866 | |
| | 66,927 | | | *,e | | Antena 3 de Television S.A. | | | 1,109 | |
| | 1,060,868 | | | * | | APN News & Media Ltd | | | 426 | |
| | 170,172 | | | *,e | | Arnoldo Mondadori Editore S.p.A. | | | 329 | |
| | 34,900 | | | e | | Asatsu-DK, Inc | | | 821 | |
| | 3,281,700 | | | | | Astro Malaysia Holdings BHD | | | 3,009 | |
| | 45,959 | | | e | | Avex Group Holdings, Inc | | | 990 | |
| | 29,528 | | | | | Axel Springer AG. | | | 1,901 | |
| | 10,390 | | | * | | Beasley Broadcasting Group, Inc | | | 91 | |
| | 1,065,300 | | | | | BEC World PCL (Foreign) | | | 1,642 | |
| | 16,228,600 | | | | | Benpres Holdings Corp | | | 1,466 | |
| | 163,073 | | | | | Borussia Dortmund GmbH & Co KGaA | | | 817 | |
| | 11,384,562 | | | | | British Sky Broadcasting plc | | | 159,113 | |
| | 434,990 | | | e | | Cablevision Systems Corp (Class A) | | | 7,799 | |
| | 102,639 | | | | | Cairo Communication S.p.A. | | | 838 | |
| | 96,205 | | | * | | Carmike Cinemas, Inc | | | 2,678 | |
| | 2,755,162 | | | | | CBS Corp (Class B) | | | 175,614 | |
| | 61,000 | | | *,e | | Central European Media Enterprises Ltd (Class A) | | | 225 | |
| | 338,029 | | | *,e | | Central European Media Enterprises Ltd (Class A) Nasdaq | | | 1,298 | |
| | 131,034 | | | * | | Charter Communications, Inc | | | 17,920 | |
| | 94,690 | | | * | | Cheil Communications, Inc | | | 2,472 | |
| | 108,066 | | | | | Chime Communications plc | | | 603 | |
| | 6,520,000 | | | * | | ChinaVision Media Group Ltd | | | 337 | |
| | 255,383 | | | | | Cinemark Holdings, Inc | | | 8,512 | |
| | 163,569 | | | e | | Cineplex Galaxy Income Fund | | | 6,785 | |
| | 175,505 | | | | | Cineworld Group plc | | | 1,105 | |
| | 436,000 | | | e | | City Telecom (HK) Ltd | | | 198 | |
| | 14,500 | | | | | CJ CGV Co Ltd | | | 598 | |
| | 25,844 | | | * | | CJ E&M Corp | | | 747 | |
| | 49,674 | | | | | Clear Channel Outdoor Holdings, Inc (Class A) | | | 504 | |
| | 42,682 | | | | | Cogeco Cable, Inc | | | 1,928 | |
| | 16,964,980 | | | | | Comcast Corp (Class A) | | | 881,585 | |
| | 17,300 | | | *,e | | COOKPAD, Inc | | | 542 | |
| | 107,611 | | | e | | Corus Entertainment, Inc | | | 2,606 | |
| | 130,247 | | | *,e | | Crown Media Holdings, Inc (Class A) | | | 460 | |
| | 46,495 | | | | | CTS Eventim AG. | | | 2,357 | |
| | 286,303 | | | *,e | | Cumulus Media, Inc (Class A) | | | 2,213 | |
| | 59,400 | | | | | CyberAgent, Inc | | | 2,420 | |
| | 170,352 | | | * | | Cyfrowy Polsat S.A. | | | 1,120 | |
| | 33,110 | | | | | Daekyo Co Ltd | | | 229 | |
| | 65,300 | | | | | Daiichikosho Co Ltd | | | 1,846 | |
| | 3,025 | | | *,e | | Daily Journal Corp | | | 560 | |
| | 652,279 | | | e | | Daily Mail & General Trust | | | 10,390 | |
| | 4,190,747 | | | * | | DEN Networks Ltd | | | 10,912 | |
| | 200,470 | | | | | Dentsu, Inc | | | 8,199 | |
| | 62,960 | | | *,e | | Dex Media, Inc | | | 427 | |
COLLEGE RETIREMENT EQUITIES FUND - Stock Account
| SHARES | | | | | COMPANY | | VALUE
(000) | |
| | 79,200 | | | e | | DHX Media Ltd | | $ | 418 | |
| | 88,761 | | | *,e | | Digital Generation, Inc | | | 1,132 | |
| | 1,592,964 | | | * | | DIRECTV | | | 110,058 | |
| | 889,514 | | | * | | Discovery Communications, Inc (Class A) | | | 80,430 | |
| | 294,073 | | | * | | Discovery Communications, Inc (Class C) | | | 24,661 | |
| | 1,662,499 | | | * | | DISH Network Corp (Class A) | | | 96,292 | |
| | 772,072 | | | * | | Dogan Yayin Holding | | | 198 | |
| | 269,738 | | | *,e | | DreamWorks Animation SKG, Inc (Class A) | | | 9,576 | |
| | 100,846 | | | * | | Eniro AB | | | 779 | |
| | 96,420 | | | *,e | | Entercom Communications Corp (Class A) | | | 1,013 | |
| | 231,973 | | | * | | Entertainment One Ltd | | | 996 | |
| | 246,792 | | | | | Entravision Communications Corp (Class A) | | | 1,503 | |
| | 1,261,991 | | | | | Eros International Media Ltd | | | 3,446 | |
| | 110,463 | | | | | Eutelsat Communications | | | 3,447 | |
| | 125,998 | | | * | | EW Scripps Co (Class A) | | | 2,737 | |
| | 4,845 | | | | | Fenerbahce Sportif Hizmetleri Sanayi ve Ticaret AS | | | 64 | |
| | 358,000 | | | | | Fuji Television Network, Inc | | | 7,331 | |
| | 124,000 | | | | | Gakken Co Ltd | | | 364 | |
| | 5,423 | | | * | | Galatasaray Sportif Sinai ve Ticari Yatirimlar AS | | | 54 | |
| | 669,568 | | | | | Gannett Co, Inc | | | 19,806 | |
| | 191,882 | | | * | | Gestevision Telecinco S.A. | | | 2,217 | |
| | 70,520 | | | * | | Global Sources Ltd | | | 573 | |
| | 188,372 | | | *,e | | Gray Television, Inc | | | 2,803 | |
| | 4,595,027 | | | | | Grupo Televisa S.A. | | | 27,697 | |
| | 55,000 | | | | | Grupo Televisa SAB (ADR) | | | 1,664 | |
| | 174,408 | | | * | | Gruppo Editoriale L’Espresso S.p.A. | | | 326 | |
| | 243,900 | | | | | Hakuhodo DY Holdings, Inc | | | 1,891 | |
| | 172,318 | | | | | Harte-Hanks, Inc | | | 1,348 | |
| | 30,909 | | | * | | Hathway Cables and Datacom Pvt Ltd | | | 142 | |
| | 313,942 | | | | | Havas S.A. | | | 2,588 | |
| | 27,907 | | | *,e | | Hemisphere Media Group, Inc | | | 331 | |
| | 32,450 | | | | | Hyundai Hy Communications & Network Co | | | 160 | |
| | 1,069,882 | | | * | | IBN18 Broadcast Ltd | | | 413 | |
| | 927,562 | | | | | Informa plc | | | 8,828 | |
| | 3,564,238 | | | | | Interpublic Group of Cos, Inc | | | 63,087 | |
| | 39,840 | | | | | IPSOS | | | 1,707 | |
| | 8,592,694 | | | | | ITV plc | | | 27,652 | |
| | 706,820 | | | | | JC Decaux S.A. | | | 29,180 | |
| | 23,182 | | | * | | Jcontentree Corp | | | 91 | |
| | 15,847,541 | | | e | | John Fairfax Holdings Ltd | | | 9,084 | |
| | 120,721 | | | | | John Wiley & Sons, Inc (Class A) | | | 6,664 | |
| | 200,985 | | | * | | Journal Communications, Inc (Class A) | | | 1,871 | |
| | 321,310 | | | *,e | | Juventus Football Club S.p.A. | | | 99 | |
| | 2,513 | | | | | Kabel Deutschland Holding AG. | | | 326 | |
| | 82,681 | | | e | | Kadokawa Holdings, Inc | | | 2,804 | |
| | 6,517 | | | | | Kinepolis | | | 1,031 | |
| | 27,180 | | | | | KT Skylife Co Ltd | | | 762 | |
| | 78,482 | | | | | Lagardere S.C.A. | | | 2,917 | |
COLLEGE RETIREMENT EQUITIES FUND - Stock Account
| SHARES | | | | | COMPANY | | VALUE
(000) | |
| | 148,108 | | | * | | Lamar Advertising Co (Class A) | | $ | 7,739 | |
| | 1,086,829 | | | * | | Liberty Global plc (Class A) | | | 96,717 | |
| | 287,733 | | | * | | Liberty Media Corp | | | 42,138 | |
| | 737,066 | | | *,e | | Lions Gate Entertainment Corp | | | 23,335 | |
| | 560,181 | | | * | | Live Nation, Inc | | | 11,069 | |
| | 4,837 | | | | | Loen Entertainment, Inc | | | 78 | |
| | 40,187 | | | * | | Loral Space & Communications, Inc | | | 3,254 | |
| | 167,329 | | | | | M6-Metropole Television | | | 3,832 | |
| | 229,113 | | | * | | Madison Square Garden, Inc | | | 13,192 | |
| | 666,400 | | | | | Major Cineplex Group PCL | | | 356 | |
| | 98,915 | | | *,e | | Martha Stewart Living Omnimedia, Inc (Class A) | | | 415 | |
| | 204,729 | | | *,e | | McClatchy Co (Class A) | | | 696 | |
| | 867,178 | | | | | McGraw-Hill Cos, Inc | | | 67,813 | |
| | 454,600 | | | | | MCOT PCL | | | 402 | |
| | 181,545 | | | | | MDC Partners, Inc | | | 4,631 | |
| | 1,202,800 | | | | | Media Chinese International Ltd | | | 358 | |
| | 76,854 | | | *,e | | Media General, Inc (Class A) | | | 1,737 | |
| | 1,365,100 | | | | | Media Prima BHD | | | 1,092 | |
| | 901,011 | | | * | | Mediaset S.p.A. | | | 4,273 | |
| | 250,000 | | | | | Megacable Holdings SAB de C.V. | | | 846 | |
| | 138,528 | | | e | | Meredith Corp | | | 7,176 | |
| | 143,345 | | | | | Modern Times Group AB (B Shares) | | | 7,431 | |
| | 52,080 | | | | | Morningstar, Inc | | | 4,067 | |
| | 64,900 | | | | | Multiplus S.A. | | | 823 | |
| | 743,994 | | | | | Naspers Ltd (N Shares) | | | 77,877 | |
| | 266,889 | | | | | National CineMedia, Inc | | | 5,327 | |
| | 500,360 | | | e | | New York Times Co (Class A) | | | 7,941 | |
| | 378,288 | | | * | | News Corp | | | 6,817 | |
| | 94,228 | | | e | | Nexstar Broadcasting Group, Inc (Class A) | | | 5,251 | |
| | 69,900 | | | | | Next Co Ltd | | | 743 | |
| | 1,672,700 | | | * | | Nine Entertainment Co Holdings Ltd | | | 2,942 | |
| | 169,755 | | | * | | Numericable SAS | | | 6,165 | |
| | 534,508 | | | | | Omnicom Group, Inc | | | 39,751 | |
| | 169,654 | | | *,e | | PagesJaunes Groupe S.A. | | | 257 | |
| | 247,304 | | | | | Pearson plc | | | 5,514 | |
| | 557,962 | | | * | | Perform Group plc | | | 2,070 | |
| | 3,070,000 | | | | | Phoenix Satellite Television Holdings Ltd | | | 1,119 | |
| | 1,580,000 | | | | | Pico Far East Holdings Ltd | | | 552 | |
| | 1,143,222 | | | * | | Premiere AG. | | | 12,636 | |
| | 365,953 | | | *,e | | Promotora de Informaciones S.A. | | | 201 | |
| | 1,048,376 | | | | | ProSiebenSat. Media AG. | | | 52,058 | |
| | 11,600 | | | | | Proto Corp | | | 162 | |
| | 33,655,000 | | | | | PT Bhakti Investama Tbk | | | 942 | |
| | 7,190,100 | | | | | PT Global MediaCom Tbk | | | 1,124 | |
| | 4,073,300 | | | | | PT Media Nusantara Citra Tbk | | | 882 | |
| | 38,348,709 | | | | | PT MNC Sky Vision Tbk | | | 6,312 | |
| | 293,625 | | | e | | PT Multimedia Servicos de Telecomunicacoes e Multimedia SGPS S.A. | | | 2,183 | |
COLLEGE RETIREMENT EQUITIES FUND - Stock Account
| SHARES | | | | | COMPANY | | VALUE
(000) | |
| | 7,229,000 | | | | | PT Surya Citra Media Tbk | | $ | 1,560 | |
| | 7,765,500 | | | * | | PT Visi Media Asia Tbk | | | 176 | |
| | 107,459 | | | | | Publicis Groupe S.A. | | | 9,846 | |
| | 100,572 | | | e | | Quebecor, Inc | | | 2,503 | |
| | 85,411 | | | | | REA Group Ltd | | | 2,885 | |
| | 45,921 | | | *,e | | ReachLocal, Inc | | | 584 | |
| | 56,847 | | | * | | Reading International, Inc | | | 426 | |
| | 2,327,583 | | | | | Reed Elsevier NV | | | 49,470 | |
| | 5,789,203 | | | | | Reed Elsevier plc | | | 86,338 | |
| | 371,907 | | | e | | Regal Entertainment Group (Class A) | | | 7,234 | |
| | 32,788 | | | * | | Rentrak Corp | | | 1,242 | |
| | 261,222 | | | | | Rightmove plc | | | 11,863 | |
| | 467,154 | | | e | | RTL Group | | | 60,465 | |
| | 18,401 | | | | | Saga Communications, Inc | | | 926 | |
| | 33,270 | | | | | Salem Communications | | | 289 | |
| | 153,679 | | | e | | Sanoma-WSOY Oyj | | | 1,353 | |
| | 56,500 | | | | | Saraiva S.A. Livreiros Editores | | | 622 | |
| | 60,420 | | | | | SBS Media Holdings Co Ltd | | | 302 | |
| | 110,070 | | | | | Schibsted ASA | | | 7,294 | |
| | 103,553 | | | | | Scholastic Corp | | | 3,522 | |
| | 539,913 | | | | | Scripps Networks Interactive (Class A) | | | 46,654 | |
| | 192,624 | | | | | SES Global S.A. | | | 6,240 | |
| | 615,402 | | | *,e | | SFX Entertainment, Inc | | | 7,385 | |
| | 596,667 | | | e | | Shaw Communications, Inc (B Shares) | | | 14,520 | |
| | 99,000 | | | e | | Shochiku Co Ltd | | | 911 | |
| | 219,497 | | | | | Sinclair Broadcast Group, Inc (Class A) | | | 7,843 | |
| | 195,101 | | | e | | Singapore Press Holdings Ltd | | | 638 | |
| | 540,000 | | | e | | SinoMedia Holding Ltd | | | 386 | |
| | 16,629,079 | | | *,e | | Sirius XM Holdings, Inc | | | 58,035 | |
| | 1,344,288 | | | e | | Sky Network Television Ltd | | | 6,462 | |
| | 321,100 | | | | | Sky Perfect Jsat Corp | | | 1,738 | |
| | 21,961 | | | * | | SM Entertainment Co | | | 922 | |
| | 2,680,000 | | | * | | SMI Corp Ltd | | | 70 | |
| | 383,700 | | | | | Smiles S.A. | | | 5,284 | |
| | 1,161,637 | | | | | Societe Television Francaise 1 | | | 22,387 | |
| | 1,489,065 | | | | | Southern Cross Media Group | | | 2,253 | |
| | 298,603 | | | * | | Starz-Liberty Capital | | | 8,731 | |
| | 21,867 | | | * | | Stroer Out-of-Home Media AG. | | | 389 | |
| | 391,763 | | | | | STW Communications Group Ltd | | | 525 | |
| | 405,260 | | | | | Sun TV Network Ltd | | | 2,495 | |
| | 47,000 | | | * | | T4F Entretenimento S.A. | | | 108 | |
| | 122,642 | | | | | Telenet Group Holding NV | | | 7,318 | |
| | 1,973,643 | | | e | | Television Broadcasts Ltd | | | 13,220 | |
| | 10,316,230 | | | *,e | | Ten Network Holdings Ltd | | | 2,586 | |
| | 69,807 | | | *,m | | Tera Resource Co Ltd | | | 24 | |
COLLEGE RETIREMENT EQUITIES FUND - Stock Account
| SHARES | | | | | COMPANY | | VALUE
(000) | |
| | 708,443 | | | e | | Thomson Corp | | $ | 26,793 | |
| | 368,940 | | | e | | Thomson Corp (Toronto) | | | 13,952 | |
| | 2,438,904 | | | | | Time Warner Cable, Inc | | | 330,471 | |
| | 3,893,956 | | | | | Time Warner, Inc | | | 271,487 | |
| | 185,000 | | | | | Toei Animation Co Ltd | | | 4,541 | |
| | 629,885 | | | | | Toei Co Ltd | | | 3,567 | |
| | 80,505 | | | | | Toho Co Ltd | | | 1,771 | |
| | 22,600 | | | | | Tohokushinsha Film Corp | | | 187 | |
| | 189,600 | | | | | Tokyo Broadcasting System, Inc | | | 2,357 | |
| | 619,562 | | | * | | Tribune Co | | | 47,954 | |
| | 336,438 | | | * | | Trinity Mirror plc | | | 1,139 | |
| | 75,200 | | | | | TV Asahi Corp | | | 1,668 | |
| | 3,333,463 | | | e | | TV Azteca S.A. de C.V. | | | 1,787 | |
| | 361,606 | | | | | TVN S.A. | | | 1,761 | |
| | 5,269,095 | | | | | Twenty-First Century Fox, Inc | | | 185,367 | |
| | 344,483 | | | | | United Business Media Ltd | | | 3,751 | |
| | 143,246 | | | *,e | | Usen Corp | | | 575 | |
| | 151,265 | | | e | | Valassis Communications, Inc | | | 5,181 | |
| | 18,400 | | | | | ValueCommerce Co Ltd | | | 226 | |
| | 1,508,000 | | | | | VGI Global Media PCL | | | 451 | |
| | 3,310,229 | | | | | Viacom, Inc (Class B) | | | 289,115 | |
| | 1,909,600 | | | * | | Viva China Holdings Ltd | | | 111 | |
| | 7,018,477 | | | *,e | | Walt Disney Co | | | 536,212 | |
| | 781,230 | | | | | West Australian Newspapers Holdings Ltd | | | 1,646 | |
| | 1,133,000 | | | * | | Wisdom Holdings Group | | | 668 | |
| | 32,617 | | | | | Wolters Kluwer NV | | | 931 | |
| | 29,600 | | | * | | Woongjin Thinkbig Co Ltd | | | 194 | |
| | 107,445 | | | e | | World Wrestling Entertainment, Inc (Class A) | | | 1,781 | |
| | 2,855,658 | | | | | WPP plc | | | 65,406 | |
| | 8,100 | | | | | YG Entertainment, Inc | | | 400 | |
| | 8,405,838 | | | * | | Zee Entertainment Enterprises Ltd | | | 8,257 | |
| | 741,665 | | | | | ZEE Telefilms Ltd | | | 3,322 | |
| | 28,800 | | | | | Zenrin Co Ltd | | | 281 | |
| | | | | | | TOTAL MEDIA | | | 4,763,796 | |
| | | | | | | | | | | |
| PHARMACEUTICALS, BIOTECHNOLOGY & LIFE SCIENCES - 8.3% | | | | |
| | 13,600 | | | *,e | | 3-D Matrix Ltd | | | 421 | |
| | 18,156 | | | *,e | | AB Science S.A. | | | 344 | |
| | 5,710,933 | | | | | AbbVie, Inc | | | 301,594 | |
| | 206,934 | | | | | Abcam plc | | | 1,683 | |
| | 27,840 | | | * | | Ablynx NV | | | 268 | |
| | 325,970 | | | *,e | | Acadia Pharmaceuticals, Inc | | | 8,146 | |
| | 39,880 | | | *,e | | Accelerate Diagnostics, Inc | | | 487 | |
| | 26,742 | | | *,e | | Acceleron Pharma, Inc | | | 1,059 | |
| | 101,880 | | | *,e | | AcelRx Pharmaceuticals, Inc | | | 1,152 | |
| | 312,476 | | | *,e | | Achillion Pharmaceuticals, Inc | | | 1,037 | |
| | 188,549 | | | * | | Acorda Therapeutics, Inc | | | 5,506 | |
COLLEGE RETIREMENT EQUITIES FUND - Stock Account
| SHARES | | | | | COMPANY | | VALUE
(000) | |
| | 509,318 | | | e | | Acrux Ltd | | $ | 1,167 | |
| | 893,513 | | | * | | Actavis plc | | | 150,110 | |
| | 156,648 | | | | | Actelion Ltd | | | 13,287 | |
| | 49,050 | | | *,e | | Active Biotech AB | | | 530 | |
| | 452,434 | | | | | Adcock Ingram Holdings Ltd | | | 3,058 | |
| | 87,000 | | | * | | Adimmune Corp | | | 128 | |
| | 226,990 | | | *,e | | Aegerion Pharmaceuticals, Inc | | | 16,107 | |
| | 20,069 | | | * | | Aerie Pharmaceuticals, Inc | | | 360 | |
| | 271,571 | | | *,e | | Affymetrix, Inc | | | 2,327 | |
| | 1,154,110 | | | | | Agilent Technologies, Inc | | | 66,004 | |
| | 22,732 | | | *,e | | Agios Pharmaceuticals, Inc | | | 544 | |
| | 193,416 | | | *,e | | Akorn, Inc | | | 4,764 | |
| | 86,078 | | | * | | Albany Molecular Research, Inc | | | 868 | |
| | 1,422,329 | | | * | | Alexion Pharmaceuticals, Inc | | | 189,255 | |
| | 139,074 | | | * | | Algeta ASA | | | 8,227 | |
| | 54,579 | | | *,e | | Alimera Sciences, Inc | | | 257 | |
| | 6,865 | | | | | ALK-Abello AS | | | 777 | |
| | 996,019 | | | * | | Alkermes plc | | | 40,498 | |
| | 1,491,008 | | | | | Allergan, Inc | | | 165,621 | |
| | 211,329 | | | * | | Alnylam Pharmaceuticals, Inc | | | 13,595 | |
| | 106,962 | | | * | | AMAG Pharmaceuticals, Inc | | | 2,596 | |
| | 3,079,420 | | | | | Amgen, Inc | | | 351,547 | |
| | 100,632 | | | *,e | | Amicus Therapeutics, Inc | | | 237 | |
| | 104,116 | | | *,e | | Ampio Pharmaceuticals, Inc | | | 742 | |
| | 77,296 | | | *,e | | Anacor Pharmaceuticals, Inc | | | 1,297 | |
| | 31,600 | | | *,e | | AnGes MG, Inc | | | 186 | |
| | 155,954 | | | | | Apex Biotechnology Corp | | | 356 | |
| | 16,692 | | | *,e | | Aratana Therapeutics, Inc | | | 319 | |
| | 842,912 | | | *,e | | Arena Pharmaceuticals, Inc | | | 4,931 | |
| | 204,259 | | | * | | Arqule, Inc | | | 439 | |
| | 386,752 | | | * | | Array Biopharma, Inc | | | 1,938 | |
| | 31,000 | | | | | ASKA Pharmaceutical Co Ltd | | | 228 | |
| | 472,059 | | | | | Aspen Pharmacare Holdings Ltd | | | 12,107 | |
| | 387,597 | | | | | Astellas Pharma, Inc | | | 22,979 | |
| | 631,616 | | | | | AstraZeneca plc | | | 37,472 | |
| | 575,938 | | | | | AstraZeneca plc (ADR) | | | 34,193 | |
| | 255,585 | | | | | Aurobindo Pharma Ltd | | | 1,624 | |
| | 160,405 | | | * | | Auxilium Pharmaceuticals, Inc | | | 3,327 | |
| | 461,425 | | | *,e | | AVANIR Pharmaceuticals, Inc | | | 1,550 | |
| | 205,518 | | | *,e | | AVEO Pharmaceuticals, Inc | | | 378 | |
| | 32,800 | | | | | Basilea Pharmaceutica | | | 3,892 | |
| | 30,332 | | | * | | Bavarian Nordic AS | | | 498 | |
| | 3,159,100 | | | | | Bayer AG. | | | 443,571 | |
| | 14,274 | | | *,e | | BIND Therapeutics, Inc | | | 215 | |
| | 104,811 | | | | | Biocon Ltd | | | 785 | |
| | 99,465 | | | *,e | | BioDelivery Sciences International, Inc | | | 586 | |
| | 28,974 | | | | | Biogaia AB (B Shares) | | | 1,140 | |
| | 1,425,929 | | | * | | Biogen Idec, Inc | | | 398,904 | |
COLLEGE RETIREMENT EQUITIES FUND - Stock Account
| SHARES | | | | | COMPANY | | VALUE
(000) | |
| | 117,112 | | | * | | BioMarin Pharmaceuticals, Inc | | $ | 8,229 | |
| | 140,000 | | | * | | Bioneer Corp | | | 1,464 | |
| | 49,611 | | | * | | Bio-Rad Laboratories, Inc (Class A) | | | 6,132 | |
| | 13,064 | | | | | Biotest AG. (Preference) | | | 1,366 | |
| | 139,378 | | | *,e | | Biotime, Inc | | | 502 | |
| | 157,382 | | | * | | Biovail Corp | | | 18,477 | |
| | 506,228 | | | * | | Biovail Corp (Toronto) | | | 59,389 | |
| | 8,247,886 | | | * | | Biovitrum AB | | | 85,569 | |
| | 18,501 | | | *,e | | Bluebird Bio, Inc | | | 388 | |
| | 13,987 | | | | | Boiron S.A. | | | 986 | |
| | 6,374,806 | | | | | Bristol-Myers Squibb Co | | | 338,821 | |
| | 244,028 | | | * | | Bruker BioSciences Corp | | | 4,824 | |
| | 449,353 | | | * | | BTG plc | | | 4,281 | |
| | 61,498 | | | | | Bukwang Pharmaceutical Co Ltd | | | 837 | |
| | 204,547 | | | * | | Cadence Pharmaceuticals, Inc | | | 1,851 | |
| | 184,793 | | | * | | Cambrex Corp | | | 3,295 | |
| | 2,437,831 | | | * | | Celgene Corp | | | 411,896 | |
| | 409,638 | | | *,e | | Cell Therapeutics, Inc | | | 787 | |
| | 329,579 | | | * | | Celldex Therapeutics, Inc | | | 7,979 | |
| | 12,283 | | | * | | Celltrion Pharm Inc | | | 121 | |
| | 162,726 | | | | | Celltrion, Inc | | | 5,913 | |
| | 9,535 | | | *,e | | Cellular Dynamics International, Inc | | | 157 | |
| | 79,046 | | | * | | Cempra, Inc | | | 979 | |
| | 109,000 | | | * | | Center Laboratories, Inc | | | 227 | |
| | 214,052 | | | *,e | | Cepheid, Inc | | | 10,001 | |
| | 172,462 | | | * | | Charles River Laboratories International, Inc | | | 9,147 | |
| | 246,297 | | | *,e | | Chelsea Therapeutics International, Inc | | | 1,091 | |
| | 112,451 | | | *,e | | ChemoCentryx, Inc | | | 651 | |
| | 28,084 | | | *,e | | Chimerix, Inc | | | 424 | |
| | 67,000 | | | | | China Chemical & Pharmaceutical Co Ltd | | | 53 | |
| | 2,493,000 | | | e | | China Medical System Holdings Ltd | | | 2,670 | |
| | 4,212,000 | | | e | | China Pharmaceutical Group Ltd | | | 3,329 | |
| | 818,000 | | | | | China Shineway Pharmaceutical Group Ltd | | | 1,122 | |
| | 7,700 | | | *,e | | Chiome Bioscience Inc | | | 237 | |
| | 6,234 | | | | | Chong Kun Dang Pharm Corp | | | 251 | |
| | 5,775 | | | *,m | | Chong Kun Dang Pharmaceutical Corp | | | 373 | |
| | 8,359 | | | | | Choongwae Pharma Corp | | | 128 | |
| | 278,483 | | | e | | Chugai Pharmaceutical Co Ltd | | | 6,164 | |
| | 422,477 | | | | | Cipla Ltd | | | 2,740 | |
| | 5,770,093 | | | | | CK Life Sciences International Holdings, Inc | | | 537 | |
| | 122,986 | | | | | Clinigen Group plc | | | 1,222 | |
| | 80,730 | | | * | | Clovis Oncology, Inc | | | 4,866 | |
| | 8,600 | | | e | | CMIC Co Ltd | | | 111 | |
| | 10,927 | | | *,e | | Contatus Pharmaceuticals, Inc | | | 70 | |
| | 155,372 | | | *,e | | Corcept Therapeutics, Inc | | | 500 | |
| | 45,998 | | | * | | Cornerstone Therapeutics, Inc | | | 437 | |
| | 79,197 | | | *,e | | Coronado Biosciences, Inc | | | 208 | |
COLLEGE RETIREMENT EQUITIES FUND - Stock Account
| SHARES | | | | | COMPANY | | VALUE
(000) | |
| | 4,718 | | | * | | Cosmo Pharmaceuticals S.p.A | | $ | 449 | |
| | 132,730 | | | * | | Covance, Inc | | | 11,688 | |
| | 782,005 | | | | | CSL Ltd | | | 48,208 | |
| | 16,000 | | | * | | CTC BIO, Inc | | | 275 | |
| | 168,559 | | | * | | Cubist Pharmaceuticals, Inc | | | 11,609 | |
| | 264,815 | | | *,e | | Curis, Inc | | | 747 | |
| | 201,170 | | | *,e | | Cytokinetics, Inc | | | 1,308 | |
| | 206,124 | | | *,e | | Cytori Therapeutics, Inc | | | 530 | |
| | 20,647 | | | | | Daewoong Pharmaceutical Co Ltd | | | 1,493 | |
| | 895,478 | | | | | Daiichi Sankyo Co Ltd | | | 16,374 | |
| | 257,194 | | | | | Dainippon Sumitomo Pharma Co Ltd | | | 4,028 | |
| | 1,136,000 | | | | | Dawnrays Pharmaceutical Holdings Ltd | | | 722 | |
| | 535,041 | | | *,e | | Dendreon Corp | | | 1,600 | |
| | 183,174 | | | * | | Depomed, Inc | | | 1,938 | |
| | 38,724 | | | | | Divi S Laboratories Ltd | | | 765 | |
| | 9,720 | | | | | Dong-A Pharmaceutical Co Ltd | | | 1,361 | |
| | 6,061 | | | * | | Dong-A ST Co Ltd | | | 572 | |
| | 7,195 | | | | | DongKook Pharmaceutical Co Ltd | | | 238 | |
| | 221,213 | | | | | Dr Reddy’s Laboratories Ltd | | | 9,054 | |
| | 42,712 | | | *,e | | Durata Therapeutics, Inc | | | 546 | |
| | 445,445 | | | * | | Dyax Corp | | | 3,354 | |
| | 835,468 | | | *,e | | Dynavax Technologies Corp | | | 1,638 | |
| | 197,342 | | | | | EIS Eczacibasi Ilac ve Sinai ve Finansal Yatirimlar Sanayi ve Ticaret AS | | | 194 | |
| | 285,116 | | | | | Eisai Co Ltd | | | 11,050 | |
| | 1,779,962 | | | | | Eli Lilly & Co | | | 90,778 | |
| | 161,726 | | | * | | Emergent Biosolutions, Inc | | | 3,718 | |
| | 32,588 | | | *,e | | Enanta Pharmaceuticals, Inc | | | 889 | |
| | 344,091 | | | *,e | | Endo Pharmaceuticals Holdings, Inc | | | 23,212 | |
| | 99,192 | | | *,e | | Endocyte, Inc | | | 1,060 | |
| | 135,404 | | | | | Enzon Pharmaceuticals, Inc | | | 157 | |
| | 19,221 | | | *,e | | Epizyme, Inc | | | 400 | |
| | 254 | | | e | | EPS Co Ltd | | | 333 | |
| | 9,758 | | | *,e | | Esperion Thereapeutics, Inc | | | 134 | |
| | 10,001 | | | | | Eurofins Scientific | | | 2,707 | |
| | 159,707 | | | *,e | | Evolutec Group plc | | | 379 | |
| | 122,030 | | | *,e | | Evotec AG. | | | 617 | |
| | 223,602 | | | *,e | | Exact Sciences Corp | | | 2,614 | |
| | 596,374 | | | *,e | | Exelixis, Inc | | | 3,656 | |
| | 3,060,000 | | | *,e | | Extrawell Pharmaceutical Holdings Ltd | | | 196 | |
| | 288,574 | | | | | FAES FARMA S.A. | | | 1,051 | |
| | 11,152 | | | | | FDC Ltd | | | 23 | |
| | 70,256 | | | *,e | | Fibrocell Science, Inc | | | 285 | |
| | 15,150 | | | *,e | | Five Prime Therapeutics, Inc | | | 254 | |
| | 82,797 | | | * | | Fluidigm Corp | | | 3,173 | |
| | 679,542 | | | * | | Forest Laboratories, Inc | | | 40,793 | |
| | 55,620 | | | *,m | | Forest Laboratories, Inc CVR | | | 53 | |
| | 29,695 | | | *,e | | Foundation Medicine, Inc | | | 707 | |
COLLEGE RETIREMENT EQUITIES FUND - Stock Account
| SHARES | | | | | COMPANY | | VALUE
(000) | |
| | 44,000 | | | | | Fuji Pharma Co Ltd | | $ | 782 | |
| | 22,066 | | | * | | Furiex Pharmaceuticals Inc | | | 927 | |
| | 189,000 | | | | | Fuso Pharmaceutical Industries Ltd | | | 614 | |
| | 27,178 | | | * | | Galapagos NV | | | 573 | |
| | 510,811 | | | *,e | | Galena Biopharma, Inc | | | 2,534 | |
| | 47,942 | | | *,e | | Genmab AS | | | 1,874 | |
| | 108,537 | | | *,e | | Genomic Health, Inc | | | 3,177 | |
| | 2,480,100 | | | *,e | | Genomma Lab Internacional S.A. de C.V. | | | 6,956 | |
| | 88,311 | | | | | Genus plc | | | 1,901 | |
| | 501,450 | | | * | | Geron Corp | | | 2,377 | |
| | 127,221 | | | | | Gerresheimer AG. | | | 8,914 | |
| | 9,996,561 | | | * | | Gilead Sciences, Inc | | | 751,241 | |
| | 5,606,224 | | | | | GlaxoSmithKline plc | | | 149,784 | |
| | 47,000 | | | | | GlycoNex, Inc | | | 161 | |
| | 110,000 | | | *,e | | GNI Group Ltd | | | 489 | |
| | 59,486 | | | *,e | | Golf Trust Of America, Inc | | | 150 | |
| | 6,537 | | | | | Green Cross Corp | | | 772 | |
| | 24,000 | | | | | Green Cross Holdings Corp | | | 283 | |
| | 81,108 | | | | | Grifols S.A. | | | 3,881 | |
| | 241 | | | | | Grifols S.A. (Class B) | | | 9 | |
| | 72,709 | | | *,e | | GTx, Inc | | | 120 | |
| | 290,170 | | | *,e | | Halozyme Therapeutics, Inc | | | 4,350 | |
| | 25,910 | | | * | | Han All Pharmarceutical Co | | | 103 | |
| | 27,825 | | | * | | Hanmi Holdings Co Ltd | | | 334 | |
| | 6,486 | | | * | | Hanmi Pharm Co Ltd | | | 699 | |
| | 25,167 | | | *,e | | Harvard Apparatus Regenerative Technology, Inc | | | 120 | |
| | 100,669 | | | * | | Harvard Bioscience, Inc | | | 473 | |
| | 12,816 | | | | | Haw Par Corp Ltd | | | 82 | |
| | 340,049 | | | | | Hikma Pharmaceuticals plc | | | 6,773 | |
| | 71,291 | | | | | Hisamitsu Pharmaceutical Co, Inc | | | 3,593 | |
| | 39,045 | | | * | | Hi-Tech Pharmacal Co, Inc | | | 1,694 | |
| | 181,614 | | | *,e | | Horizon Pharma, Inc | | | 1,384 | |
| | 194,256 | | | * | | Hospira, Inc | | | 8,019 | |
| | 2,868,480 | | | e | | Hua Han Bio-Pharmaceutical Holdings Ltd | | | 559 | |
| | 6,945 | | | | | Huons Co Ltd | | | 264 | |
| | 27,873 | | | *,e | | Hyperion Therapeutics, Inc | | | 564 | |
| | 319,698 | | | *,e | | Idenix Pharmaceuticals, Inc | | | 1,912 | |
| | 3,900 | | | | | Il Dong Pharmaceutical Co Ltd | | | 37 | |
| | 793,353 | | | *,e | | Illumina, Inc | | | 87,761 | |
| | 18,415 | | | | | Ilyang Pharmaceutical Co Ltd | | | 462 | |
| | 281,239 | | | *,e | | Immunogen, Inc | | | 4,126 | |
| | 224,354 | | | *,e | | Immunomedics, Inc | | | 1,032 | |
| | 271,531 | | | * | | Impax Laboratories, Inc | | | 6,826 | |
| | 228,394 | | | * | | Incyte Corp | | | 11,564 | |
| | 151,332 | | | *,e | | Infinity Pharmaceuticals, Inc | | | 2,090 | |
| | 6,863 | | | * | | Innocell Corp | | | 155 | |
| | 145,488 | | | * | | Insmed, Inc | | | 2,475 | |
| | 18,192 | | | *,e | | Insys Therapeutics, Inc | | | 704 | |
COLLEGE RETIREMENT EQUITIES FUND - Stock Account
| SHARES | | | | | COMPANY | | VALUE
(000) | |
| | 249,432 | | | * | | Intercept Pharmaceuticals, Inc | | $ | 17,031 | |
| | 299,841 | | | *,e | | InterMune, Inc | | | 4,417 | |
| | 38,497 | | | *,e | | Intrexon Corp | | | 916 | |
| | 36,132 | | | | | Ipsen | | | 1,709 | |
| | 302,733 | | | *,e | | Ironwood Pharmaceuticals, Inc | | | 3,515 | |
| | 486,543 | | | *,e | | Isis Pharmaceuticals, Inc | | | 19,384 | |
| | 82 | | | * | | Japan Tissue Engineering Co Lt | | | 330 | |
| | 686,477 | | | *,e | | Jazz Pharmaceuticals plc | | | 86,881 | |
| | 10,300 | | | | | JCR Pharmaceuticals Co Ltd | | | 224 | |
| | 10,950 | | | | | Jeil Pharmaceutical Co | | | 135 | |
| | 12,978,310 | | | | | Johnson & Johnson | | | 1,188,683 | |
| | 101,521 | | | | | Kaken Pharmaceutical Co Ltd | | | 1,524 | |
| | 17,951 | | | * | | KaloBios Pharmaceuticals, Inc | | | 79 | |
| | 29,176 | | | * | | Kamada Ltd | | | 427 | |
| | 20,529 | | | * | | Karyopharm Therapeutics, Inc | | | 471 | |
| | 264,343 | | | *,e | | Keryx Biopharmaceuticals, Inc | | | 3,423 | |
| | 91,200 | | | | | Kissei Pharmaceutical Co Ltd | | | 2,246 | |
| | 4,780 | | | | | Kolon Life Science, Inc | | | 290 | |
| | 56,785 | | | * | | Komipharm International Co Ltd | | | 391 | |
| | 174,330 | | | | | Kwang Dong Pharmaceutical Co Ltd | | | 1,234 | |
| | 130,436 | | | | | Kyorin Co Ltd | | | 2,795 | |
| | 902,091 | | | e | | Kyowa Hakko Kogyo Co Ltd | | | 9,955 | |
| | 45,233 | | | *,e | | KYTHERA Biopharmaceuticals, Inc | | | 1,685 | |
| | 69,322 | | | | | Laboratorios Almirall S.A. | | | 1,130 | |
| | 25,509 | | | | | Laboratorios Farmaceuticos Rovi S.A | | | 350 | |
| | 149,285 | | | * | | Lannett Co, Inc | | | 4,941 | |
| | 751,812 | | | * | | Lexicon Pharmaceuticals, Inc | | | 1,353 | |
| | 18,990 | | | * | | LG Life Sciences Ltd | | | 732 | |
| | 381,607 | | | * | | Life Technologies Corp | | | 28,926 | |
| | 131,626 | | | *,e | | Ligand Pharmaceuticals, Inc (Class B) | | | 6,924 | |
| | 2,308,000 | | | | | Lijun International Pharmaceutical Holding Ltd | | | 632 | |
| | 175,900 | | | m | | Livzon Pharmaceutical, Inc | | | 860 | |
| | 943,550 | | | | | Lonza Group AG. | | | 89,668 | |
| | 144,156 | | | * | | Luminex Corp | | | 2,797 | |
| | 307,840 | | | * | | Lupin Ltd | | | 4,522 | |
| | 15,131 | | | *,e | | MacroGenics, Inc | | | 415 | |
| | 125,958 | | | *,e | | Mallinckrodt plc | | | 6,583 | |
| | 541,616 | | | *,e | | MannKind Corp | | | 2,822 | |
| | 751,636 | | | * | | Mayne Pharma Group Ltd | | | 497 | |
| | 551,435 | | | | | Meda AB (A Shares) | | | 7,003 | |
| | 277,847 | | | * | | Medicines Co | | | 10,730 | |
| | 124,918 | | | * | | Medigen Biotechnology Corp | | | 837 | |
| | 1,059 | | | *,e | | Medinet Co Ltd | | | 432 | |
| | 9,630 | | | * | | Medipost Co Ltd | | | 578 | |
| | 698,594 | | | * | | Medivation, Inc | | | 44,584 | |
| | 28,097 | | | *,e | | Medivir AB | | | 369 | |
| | 5,369 | | | | | Medy-Tox, Inc | | | 865 | |
| | 35,308 | | | *,e | | MEI Pharma, Inc | | | 283 | |
COLLEGE RETIREMENT EQUITIES FUND - Stock Account
| SHARES | | | | | COMPANY | | VALUE
(000) | |
| | 11,487,518 | | | | | Merck & Co, Inc | | $ | 574,950 | |
| | 112,453 | | | | | Merck KGaA | | | 20,177 | |
| | 370,782 | | | *,e | | Merrimack Pharmaceuticals, Inc | | | 1,980 | |
| | 208,063 | | | *,e | | Mesoblast Ltd | | | 1,089 | |
| | 124,912 | | | * | | Mettler-Toledo International, Inc | | | 30,302 | |
| | 274,935 | | | *,e | | MiMedx Group, Inc | | | 2,403 | |
| | 14,100 | | | | | Mochida Pharmaceutical Co Ltd | | | 838 | |
| | 234,277 | | | * | | Momenta Pharmaceuticals, Inc | | | 4,142 | |
| | 106,803 | | | * | | Morphosys AG. | | | 8,234 | |
| | 22,167,242 | | | *,m | | MPM Bioventures II | | | 1,259 | |
| | 3,509,391 | | | * | | Mylan Laboratories, Inc | | | 152,308 | |
| | 192,361 | | | *,e | | Myriad Genetics, Inc | | | 4,036 | |
| | 429 | | | *,e | | NanoCarrier Co Ltd | | | 932 | |
| | 171,261 | | | *,e | | Nanosphere, Inc | | | 392 | |
| | 369,044 | | | *,e | | Navidea Biopharmaceuticals, Inc | | | 764 | |
| | 397,208 | | | *,e | | Nektar Therapeutics | | | 4,508 | |
| | 110,393 | | | *,e | | NeoGenomics, Inc | | | 400 | |
| | 235,347 | | | * | | Neurocrine Biosciences, Inc | | | 2,198 | |
| | 53,017 | | | *,e | | NewLink Genetics Corp | | | 1,167 | |
| | 106,400 | | | e | | Nichi-iko Pharmaceutical Co Ltd | | | 1,644 | |
| | 229,000 | | | | | Nippon Shinyaku Co Ltd | | | 4,457 | |
| | 5,423,710 | | | | | Novartis AG. | | | 434,707 | |
| | 482,620 | | | | | Novartis AG. (ADR) | | | 38,793 | |
| | 594,536 | | | * | | Novavax, Inc | | | 3,044 | |
| | 534,990 | | | | | Novo Nordisk AS (Class B) | | | 98,065 | |
| | 31,806 | | | | | Novozymes AS | | | 1,344 | |
| | 974,206 | | | * | | NPS Pharmaceuticals, Inc | | | 29,577 | |
| | 96,194 | | | *,e | | Omeros Corp | | | 1,086 | |
| | 17,790 | | | *,m | | Omthera Pharmaceuticals, Inc | | | 11 | |
| | 48,397 | | | *,e | | OncoGenex Pharmaceutical, Inc | | | 404 | |
| | 12,680 | | | *,e | | OncoMed Pharmaceuticals, Inc | | | 374 | |
| | 16,310 | | | *,e | | Onconova Therapeutics, Inc | | | 187 | |
| | 99,000 | | | *,e | | OncoTherapy Science, Inc | | | 239 | |
| | 122,000 | | | * | | Oneness Biotech Co Ltd | | | 185 | |
| | 126,795 | | | | | Ono Pharmaceutical Co Ltd | | | 11,114 | |
| | 27,454 | | | *,e | | Ophthotech Corp | | | 888 | |
| | 592,131 | | | *,e | | Opko Health, Inc | | | 4,998 | |
| | 395,418 | | | *,e | | Orexigen Therapeutics, Inc | | | 2,226 | |
| | 17,414 | | | * | | Orexo AB | | | 443 | |
| | 115,171 | | | | | Orion Oyj (Class B) | | | 3,237 | |
| | 61,908 | | | *,e | | Osiris Therapeutics, Inc | | | 995 | |
| | 920,569 | | | | | Otsuka Holdings KK | | | 26,580 | |
| | 29,737 | | | * | | OvaScience, Inc | | | 272 | |
| | 188,442 | | | * | | Pacific Biosciences of California, Inc | | | 986 | |
| | 90,108 | | | *,e | | Pacira Pharmaceuticals, Inc | | | 5,180 | |
| | 22,399 | | | * | | Paladin Labs, Inc | | | 2,498 | |
| | 254,587 | | | *,e | | Parexel International Corp | | | 11,502 | |
| | 672,539 | | | e | | PDL BioPharma, Inc | | | 5,676 | |
COLLEGE RETIREMENT EQUITIES FUND - Stock Account
| SHARES | | | | | COMPANY | | VALUE
(000) | |
| | 8,600 | | | * | | PeptiDream, Inc | | $ | 1,134 | |
| | 484,273 | | | *,e | | Peregrine Pharmaceuticals, Inc | | | 673 | |
| | 337,813 | | | | | PerkinElmer, Inc | | | 13,928 | |
| | 734,015 | | | e | | Perrigo Co plc | | | 112,642 | |
| | 26,392,751 | | | | | Pfizer, Inc | | | 808,410 | |
| | 162,788 | | | * | | Pharmacyclics, Inc | | | 17,220 | |
| | 46,861 | | | * | | PharmaEngine Inc | | | 334 | |
| | 45,580 | | | * | | Pharmicell Co Ltd | | | 164 | |
| | 41,000 | | | * | | Pharmstandard (GDR) | | | 407 | |
| | 227,865 | | | * | | Phytohealth Corp | | | 290 | |
| | 128,863 | | | | | Piramal Healthcare Ltd | | | 1,150 | |
| | 67,275 | | | * | | Portola Pharmaceuticals, Inc | | | 1,732 | |
| | 110,241 | | | | | Pozen, Inc | | | 886 | |
| | 263,675 | | | * | | Prestige Brands Holdings, Inc | | | 9,440 | |
| | 191,506 | | | * | | Progenics Pharmaceuticals, Inc | | | 1,021 | |
| | 53,045 | | | *,e | | Prothena Corp plc | | | 1,407 | |
| | 23,269,300 | | | | | PT Kalbe Farma Tbk | | | 2,397 | |
| | 27,188 | | | *,e | | PTC Therapeutics, Inc | | | 461 | |
| | 94,545 | | | *,e | | Puma Biotechnology, Inc | | | 9,788 | |
| | 40,154 | | | * | | Qiagen NV | | | 937 | |
| | 490,363 | | | *,e | | Qiagen NV (NASDAQ) | | | 11,676 | |
| | 1,186,567 | | | e | | Questcor Pharmaceuticals, Inc | | | 64,609 | |
| | 55,532 | | | * | | Quintiles Transnational Holdings, Inc | | | 2,573 | |
| | 156,690 | | | * | | Ranbaxy Laboratories Ltd | | | 1,150 | |
| | 191,363 | | | *,e | | Raptor Pharmaceutical Corp | | | 2,492 | |
| | 28,000 | | | * | | Receptos, Inc | | | 812 | |
| | 237,252 | | | | | Recordati S.p.A. | | | 3,416 | |
| | 251,708 | | | * | | Regeneron Pharmaceuticals, Inc | | | 69,280 | |
| | 32,089 | | | *,e | | Regulus Therapeutics, Inc | | | 237 | |
| | 16,213 | | | *,e | | Relypsa, Inc | | | 405 | |
| | 95,307 | | | *,e | | Repligen Corp | | | 1,300 | |
| | 28,800 | | | *,e | | ReproCELL, Inc | | | 474 | |
| | 72,223 | | | *,e | | Repros Therapeutics, Inc | | | 1,322 | |
| | 117,561 | | | | | Richter Gedeon Rt | | | 2,390 | |
| | 328,414 | | | * | | Rigel Pharmaceuticals, Inc | | | 936 | |
| | 1,243,894 | | | | | Roche Holding AG. | | | 348,447 | |
| | 104,000 | | | | | Rohto Pharmaceutical Co Ltd | | | 1,587 | |
| | 65,448 | | | * | | Sagent Pharmaceuticals | | | 1,661 | |
| | 1,672,433 | | | * | | Salix Pharmaceuticals Ltd | | | 150,419 | |
| | 195,113 | | | *,e | | Sangamo Biosciences, Inc | | | 2,710 | |
| | 2,483,792 | | | | | Sanofi-Aventis | | | 265,256 | |
| | 87,556 | | | | | Santen Pharmaceutical Co Ltd | | | 4,079 | |
| | 176,854 | | | *,e | | Sarepta Therapeutics, Inc | | | 3,603 | |
| | 80,700 | | | | | Sawai Pharmaceutical Co Ltd | | | 5,211 | |
| | 261,094 | | | * | | Sciclone Pharmaceuticals, Inc | | | 1,316 | |
| | 247,088 | | | | | Scinopharm Taiwan Ltd | | | 727 | |
| | 221,653 | | | *,e | | Seattle Genetics, Inc | | | 8,842 | |
| | 46,361 | | | * | | Seegene, Inc | | | 2,598 | |
COLLEGE RETIREMENT EQUITIES FUND - Stock Account
| SHARES | | | | | COMPANY | | VALUE
(000) | |
| | 285,000 | | | | | Seikagaku Corp | | $ | 3,485 | |
| | 355,935 | | | *,e | | Sequenom, Inc | | | 833 | |
| | 510,000 | | | | | Shandong Luoxin Pharmacy Stock Co Ltd | | | 435 | |
| | 179,000 | | | | | Shanghai Dingli Technology Dev | | | 114 | |
| | 753,000 | | | | | Shanghai Fosun Pharmaceutical Group Co Ltd | | | 2,273 | |
| | 17,000 | | | *,e | | Shin Nippon Biomedical Laboratories Ltd | | | 216 | |
| | 926,547 | | | | | Shionogi & Co Ltd | | | 20,115 | |
| | 982,158 | | | | | Shire Ltd | | | 46,286 | |
| | 50,500 | | | | | Shire plc (ADR) | | | 7,135 | |
| | 7,058 | | | | | Siegfried Holding AG. | | | 1,279 | |
| | 142,620 | | | *,e | | SIGA Technologies, Inc | | | 466 | |
| | 2,891,400 | | | | | Sihuan Pharmaceutical Holdings | | | 2,646 | |
| | 11,632,000 | | | e | | Sino Biopharmaceutical | | | 9,247 | |
| | 91,000 | | | | | Sinphar Pharmaceutical Co Ltd | | | 151 | |
| | 53,844 | | | | | Sirtex Medical Ltd | | | 565 | |
| | 4,254,176 | | | * | | Skyline Venture Fund II Ltd | | | 245 | |
| | 976,029 | | | *,m | | Skyline Venture Fund III Ltd | | | 46 | |
| | 15,400 | | | * | | Sosei Group | | | 633 | |
| | 243,508 | | | *,e | | Spectrum Pharmaceuticals, Inc | | | 2,155 | |
| | 145,515 | | | | | Stada Arzneimittel AG. | | | 7,204 | |
| | 3,732 | | | | | Stallergenes | | | 279 | |
| | 246,100 | | | | | Standard Chemical & Pharma | | | 372 | |
| | 273,260 | | | *,e | | Starpharma Holdings Ltd | | | 211 | |
| | 30,371 | | | *,e | | Stemline Therapeutics, Inc | | | 595 | |
| | 106,516 | | | | | Strides Arcolab Ltd | | | 620 | |
| | 46,710 | | | * | | Sucampo Pharmaceuticals, Inc (Class A) | | | 439 | |
| | 127,373 | | | * | | Sun Pharma Advanced Research Company Ltd | | | 332 | |
| | 1,521,798 | | | | | Sun Pharmaceutical Industries Ltd | | | 13,979 | |
| | 106,655 | | | *,e | | Sunesis Pharmaceuticals, Inc | | | 506 | |
| | 48,741 | | | *,e | | Supernus Pharmaceuticals, Inc | | | 368 | |
| | 67,333 | | | *,e | | Synageva BioPharma Corp | | | 4,358 | |
| | 256,950 | | | *,e | | Synergy Pharmaceuticals, Inc | | | 1,447 | |
| | 163,661 | | | *,e | | Synta Pharmaceuticals Corp | | | 858 | |
| | 39,569 | | | | | Taisho Pharmaceutical Holdings Co Ltd | | | 2,720 | |
| | 57,339 | | | * | | Taiwan Liposome Co Ltd | | | 666 | |
| | 61,200 | | | e | | Takara Bio, Inc | | | 1,269 | |
| | 779,320 | | | | | Takeda Pharmaceutical Co Ltd | | | 35,744 | |
| | 259,877 | | | | | Tanabe Seiyaku Co Ltd | | | 3,625 | |
| | 109,762 | | | * | | Targacept, Inc | | | 456 | |
| | 12,618 | | | | | Tecan Group AG. | | | 1,497 | |
| | 96,066 | | | | | Techne Corp | | | 9,095 | |
| | 8,900 | | | e | | tella, Inc | | | 223 | |
| | 95,544 | | | *,e | | TESARO, Inc | | | 2,698 | |
| | 37,004 | | | * | | Tetraphase Pharmaceuticals, Inc | | | 500 | |
| | 488,625 | | | | | Teva Pharmaceutical Industries Ltd | | | 19,551 | |
| | 89,533 | | | | | Teva Pharmaceutical Industries Ltd (ADR) | | | 3,588 | |
| | 50,104 | | | *,e | | TG Therapeutics, Inc | | | 195 | |
| | 274,641 | | | *,e | | TherapeuticsMD, Inc | | | 1,431 | |
COLLEGE RETIREMENT EQUITIES FUND - Stock Account
| SHARES | | | | | COMPANY | | VALUE
(000) | |
| | 436,612 | | | *,e | | Theravance, Inc | | $ | 15,565 | |
| | 1,328,626 | | | | | Thermo Electron Corp | | | 147,943 | |
| | 278,688 | | | *,e | | Threshold Pharmaceuticals, Inc | | | 1,301 | |
| | 42,356 | | | *,e | | ThromboGenics NV | | | 1,175 | |
| | 472,000 | | | e | | Tong Ren Tang Technologies Co Ltd | | | 1,509 | |
| | 12,400 | | | | | Torii Pharmaceutical Co Ltd | | | 364 | |
| | 6,200 | | | | | Torrent Pharmaceuticals Ltd | | | 47 | |
| | 12,900 | | | | | Towa Pharmaceutical Co Ltd | | | 541 | |
| | 19,359 | | | *,e | | Transgene S.A. | | | 234 | |
| | 88,393 | | | e | | Tsumura & Co | | | 2,342 | |
| | 224,485 | | | | | TTY Biopharm Co Ltd | | | 689 | |
| | 174,886 | | | | | UCB S.A. | | | 13,029 | |
| | 6,000 | | | *,e | | UMN Pharma, Inc | | | 174 | |
| | 6,460 | | | * | | Unichem Laboratories Ltd | | | 20 | |
| | 799,500 | | | *,e | | United Laboratories Ltd | | | 321 | |
| | 167,755 | | | * | | United Therapeutics Corp | | | 18,970 | |
| | 417,565 | | | *,e | | Vanda Pharmaceuticals, Inc | | | 5,182 | |
| | 445,681 | | | * | | Vectura Group plc | | | 1,033 | |
| | 54,924 | | | *,e | | Verastem, Inc | | | 626 | |
| | 886,412 | | | * | | Vertex Pharmaceuticals, Inc | | | 65,860 | |
| | 249,172 | | | * | | Vical, Inc | | | 294 | |
| | 4,915 | | | | | Virbac S.A. | | | 1,050 | |
| | 16,713 | | | * | | ViroMed Co Ltd | | | 626 | |
| | 271,439 | | | * | | Viropharma, Inc | | | 13,531 | |
| | 327,311 | | | *,e | | Vivus, Inc | | | 2,972 | |
| | 193,456 | | | * | | Waters Corp | | | 19,346 | |
| | 1,024,000 | | | * | | Winteam Pharmaceutical Group Ltd | | | 412 | |
| | 51,123 | | | * | | Wockhardt Ltd | | | 374 | |
| | 192,515 | | | * | | Xenoport, Inc | | | 1,107 | |
| | 337,497 | | | *,e | | XOMA Corp | | | 2,271 | |
| | 8,805 | | | | | Yuhan Corp | | | 1,563 | |
| | 214,410 | | | * | | Yungjin Pharmaceutical Co Ltd | | | 342 | |
| | 170,000 | | | | | YungShin Global Holding Corp | | | 313 | |
| | 9,259 | | | *,e | | Zealand Pharma AS | | | 101 | |
| | 215,313 | | | * | | Zeltia S.A. | | | 686 | |
| | 25,300 | | | | | Zeria Pharmaceutical Co Ltd | | | 616 | |
| | 251,441 | | | *,e | | ZIOPHARM Oncology, Inc | | | 1,091 | |
| | 4,528,931 | | | | | Zoetis Inc | | | 148,051 | |
| | 299,229 | | | *,e | | Zogenix, Inc | | | 1,029 | |
| | | | | | | TOTAL PHARMACEUTICALS, BIOTECHNOLOGY & LIFE SCIENCES | | | 10,429,793 | |
| | | | | | | | | | | |
| REAL ESTATE - 3.2% | | | | | |
| | 645,658 | | | | | Abacus Property Group | | | 1,340 | |
| | 212,923 | | | | | Acadia Realty Trust | | | 5,287 | |
| | 1,623 | | | e | | Activia Properties Inc | | | 12,790 | |
| | 361,928 | | | | | Acucap Properties Ltd | | | 1,505 | |
| | 4,481 | | | | | Advance Residence Investment Corp | | | 9,667 | |
| | 55,742 | | | | | Aeon Mall Co Ltd | | | 1,562 | |
COLLEGE RETIREMENT EQUITIES FUND - Stock Account
| SHARES | | | | | COMPANY | | VALUE
(000) | |
| | 126,968 | | | * | | Africa Israel Investments Ltd | | $ | 253 | |
| | 14,138 | | | * | | Africa Israel Properties Ltd | | | 224 | |
| | 111,991 | | | | | AG Mortgage Investment Trust | | | 1,752 | |
| | 6,246,500 | | | e | | Agile Property Holdings Ltd | | | 6,717 | |
| | 55,717 | | | | | Agree Realty Corp | | | 1,617 | |
| | 1,253,157 | | | | | AIMS AMP Capital Industrial REIT | | | 1,424 | |
| | 63,604 | | | * | | Airport City Ltd | | | 587 | |
| | 24,600 | | | | | Airport Facilities Co Ltd | | | 203 | |
| | 28,608 | | | | | Akmerkez Gayrimenkul Yatirim Ortakligi AS | | | 201 | |
| | 165,207 | | | | | Alexander & Baldwin, Inc | | | 6,894 | |
| | 7,183 | | | | | Alexander’s, Inc | | | 2,370 | |
| | 84,324 | | | | | Alexandria Real Estate Equities, Inc | | | 5,365 | |
| | 338,484 | | | | | Aliansce Shopping Centers S.A. | | | 2,615 | |
| | 1,907,364 | | | | | Allan Gray Property Trust | | | 1,344 | |
| | 11,176,693 | | | | | Allco Commercial Real Estate Investment Trust | | | 11,269 | |
| | 102,517 | | | | | Allied Properties Real Estate Investment Trust | | | 3,162 | |
| | 18,944 | | | | | Allreal Holding AG. | | | 2,623 | |
| | 170,748 | | | | | Alony Hetz Properties & Investments Ltd | | | 1,194 | |
| | 4,850 | | | * | | AL-ROV Israel Ltd | | | 189 | |
| | 6,102 | | | * | | Alrov Properties and Lodgings Ltd | | | 189 | |
| | 76,342 | | | | | Alstria Office REIT-AG. | | | 961 | |
| | 163,329 | | | | | Altisource Residential Corp | | | 4,918 | |
| | 4,343,900 | | | | | Amata Corp PCL (Foreign) | | | 1,831 | |
| | 133,731 | | | | | American Assets Trust,Inc | | | 4,203 | |
| | 191,432 | | | | | American Campus Communities, Inc | | | 6,166 | |
| | 852,093 | | | | | American Capital Agency Corp | | | 16,437 | |
| | 206,450 | | | | | American Capital Mortgage, Inc | | | 3,605 | |
| | 100,165 | | | * | | American Homes 4 Rent | | | 1,623 | |
| | 638,660 | | | e | | American Realty Capital Properties, Inc | | | 8,213 | |
| | 63,573 | | | *,e | | American Residential Properties, Inc | | | 1,091 | |
| | 1,783,279 | | | | | American Tower Corp | | | 142,341 | |
| | 119,596 | | | | | Amot Investments Ltd | | | 365 | |
| | 1,753,464 | | | | | AMP NZ Office Trust | | | 1,428 | |
| | 65,910 | | | | | AmREIT, Inc (Class B) | | | 1,107 | |
| | 1,593,392 | | | * | | Anant Raj Industries Ltd | | | 1,613 | |
| | 13,463 | | | | | ANF Immobilier | | | 413 | |
| | 1,987,582 | | | | | Annaly Capital Management, Inc | | | 19,816 | |
| | 585,375 | | | | | Anworth Mortgage Asset Corp | | | 2,464 | |
| | 1,182,600 | | | * | | AP Thailand PCL (Foreign) | | | 159 | |
| | 381,137 | | | | | Apartment Investment & Management Co (Class A) | | | 9,875 | |
| | 144,169 | | | | | Apollo Commercial Real Estate Finance, Inc | | | 2,343 | |
| | 76,737 | | | | | Ares Commercial Real Estate Corp | | | 1,005 | |
| | 849,248 | | | | | Argosy Property Ltd | | | 639 | |
| | 75,831 | | | | | Armada Hoffler Properties, Inc | | | 704 | |
| | 1,456,593 | | | | | ARMOUR Residential REIT, Inc | | | 5,841 | |
| | 347,176 | | | | | Arrowhead Properties Ltd | | | 229 | |
| | 138,951 | | | | | Artis Real Estate Investment Trust | | | 1,944 | |
| | 1,131,000 | | | e | | Ascendas Hospitality Trust | | | 645 | |
COLLEGE RETIREMENT EQUITIES FUND - Stock Account
| SHARES | | | | | COMPANY | | VALUE
(000) | |
| | 1,464,000 | | | | | Ascendas India Trust | | $ | 789 | |
| | 396,587 | | | | | Ascendas Real Estate Investment Trust | | | 694 | |
| | 2,071,302 | | | | | Ascott Residence Trust | | | 1,980 | |
| | 45,898 | | | * | | Ashford Hospitality Prime, Inc | | | 835 | |
| | 234,394 | | | | | Ashford Hospitality Trust, Inc | | | 1,941 | |
| | 221,853 | | | e | | Associated Estates Realty Corp | | | 3,561 | |
| | 595,587 | | | e | | Australand Property Group | | | 2,051 | |
| | 38,274 | | | * | | AV Homes, Inc | | | 695 | |
| | 352,961 | | | | | AvalonBay Communities, Inc | | | 41,731 | |
| | 392,715 | | | e | | Aveo Group | | | 724 | |
| | 45,163 | | | e | | Aviv REIT, Inc | | | 1,070 | |
| | 6,483,623 | | | | | Ayala Land, Inc | | | 3,633 | |
| | 123,809 | | | | | Babcock & Brown Japan Property Trust | | | 381 | |
| | 12,663,700 | | | | | Bangkokland PCL | | | 596 | |
| | 1,528 | | | | | Bayside Land Corp | | | 421 | |
| | 23,532 | | | | | Befimmo SCA Sicafi | | | 1,633 | |
| | 2,432,000 | | | e | | Beijing Capital Land Ltd | | | 829 | |
| | 1,420,000 | | | | | Beijing North Star Co | | | 321 | |
| | 2,722,000 | | | * | | Beijing Properties Holdings Ltd | | | 215 | |
| | 3,893,950 | | | * | | Belle Corp | | | 433 | |
| | 1,430,859 | | | | | Beni Stabili S.p.A. | | | 965 | |
| | 4,761,352 | | | *,m | | BGP Holdings plc | | | 0 | ^ |
| | 226,267 | | | | | Big Yellow Group plc | | | 1,794 | |
| | 144,393 | | | | | BioMed Realty Trust, Inc | | | 2,616 | |
| | 847 | | | * | | BLife Investment Corp | | | 3,377 | |
| | 43,659 | | | | | Boardwalk Real Estate Investment Trust | | | 2,460 | |
| | 623,284 | | | | | Boston Properties, Inc | | | 62,559 | |
| | 450,056 | | | | | BR Malls Participacoes S.A. | | | 3,246 | |
| | 209,600 | | | | | BR Properties S.A. | | | 1,655 | |
| | 167,436 | | | | | Brandywine Realty Trust | | | 2,359 | |
| | 206,000 | | | | | Brasil Brokers Participacoes S.A. | | | 511 | |
| | 122,925 | | | | | BRE Properties, Inc (Class A) | | | 6,725 | |
| | 571,684 | | | | | British Land Co plc | | | 5,960 | |
| | 27,730 | | | * | | Brixmor Property Group, Inc | | | 564 | |
| | 577,344 | | | e | | Brookfield Asset Management, Inc | | | 22,404 | |
| | 18,100 | | | | | Brookfield Canada Office Properties | | | 453 | |
| | 7,964 | | | * | | Brookfield Multiplex Group | | | 583 | |
| | 40,000 | | | | | Brookfield Office Properties, Inc | | | 770 | |
| | 688,232 | | | e | | Brookfield Office Properties, Inc (Toronto) | | | 13,250 | |
| | 1,188 | | | | | Brookfield Property Partners LP | | | 24 | |
| | 1,226,438 | | | | | Bunnings Warehouse Property Trust | | | 2,403 | |
| | 26,098,188 | | | | | C C Land Holdings Ltd | | | 6,584 | |
| | 87,304 | | | | | CA Immobilien Anlagen AG. | | | 1,548 | |
| | 816,000 | | | | | Cache Logistics Trust | | | 722 | |
| | 87,975 | | | | | Calloway Real Estate Investment Trust | | | 2,084 | |
| | 1,389,594 | | | | | Cambridge Industrial Trust | | | 761 | |
| | 75,851 | | | | | Camden Property Trust | | | 4,314 | |
COLLEGE RETIREMENT EQUITIES FUND - Stock Account
| SHARES | | | | | COMPANY | | VALUE
(000) | |
| | 250,710 | | | | | Campus Crest Communities, Inc | | $ | 2,359 | |
| | 69,991 | | | | | Canadian Apartment Properties REIT | | | 1,400 | |
| | 44,856 | | | | | Canadian Real Estate Investment Trust | | | 1,831 | |
| | 3,880,400 | | | e | | CapitaCommercial Trust | | | 4,469 | |
| | 967,244 | | | | | Capital & Counties Properties | | | 5,277 | |
| | 2,814,565 | | | | | Capital Property Fund | | | 2,858 | |
| | 2,561,880 | | | e | | CapitaLand Ltd | | | 6,175 | |
| | 5,739,181 | | | | | CapitaMall Trust | | | 8,685 | |
| | 2,882,273 | | | e | | CapitaMalls Asia Ltd | | | 4,492 | |
| | 770,500 | | | | | CapitaMalls Malaysia Trust | | | 329 | |
| | 1,173,420 | | | e | | CapitaRetail China Trust | | | 1,239 | |
| | 381,387 | | | | | Capstead Mortgage Corp | | | 4,607 | |
| | 371,667 | | | | | Castellum AB | | | 5,787 | |
| | 1,206,000 | | | | | Cathay Real Estate Development Co Ltd | | | 762 | |
| | 270,169 | | | | | CBL & Associates Properties, Inc | | | 4,852 | |
| | 1,210,567 | | | * | | CBRE Group, Inc | | | 31,838 | |
| | 809,000 | | | e | | CDL Hospitality Trusts | | | 1,052 | |
| | 274,913 | | | | | Cedar Shopping Centers, Inc | | | 1,721 | |
| | 1,723,000 | | | | | Central China Real Estate Ltd | | | 533 | |
| | 1,603,400 | | | | | Central Pattana PCL | | | 2,013 | |
| | 10,000,000 | | | | | Century Properties Group, Inc | | | 298 | |
| | 1,557,559 | | | | | CFS Gandel Retail Trust | | | 2,711 | |
| | 953,000 | | | | | CH Karnchang PCL | | | 452 | |
| | 236,234 | | | | | Challenger Diversified Property Group | | | 527 | |
| | 914,204 | | | e | | Chambers Street Properties | | | 6,994 | |
| | 3,767,636 | | | | | Champion Real Estate Investment Trust | | | 1,667 | |
| | 571,323 | | | | | Charter Hall Group | | | 1,867 | |
| | 219,000 | | | | | Chartwell Retirement Residences | | | 2,060 | |
| | 94,582 | | | | | Chatham Lodging Trust | | | 1,934 | |
| | 188,262 | | | | | Chesapeake Lodging Trust | | | 4,761 | |
| | 5,720,340 | | | | | Cheuk Nang Holdings Ltd | | | 5,209 | |
| | 1,272,607 | | | | | Cheung Kong Holdings Ltd | | | 20,134 | |
| | 1,979,694 | | | | | Chimera Investment Corp | | | 6,137 | |
| | 2,589,500 | | | e | | China Aoyuan Property Group Ltd | | | 545 | |
| | 9,385,021 | | | *,e | | China New Town Development Co Ltd | | | 825 | |
| | 10,610,994 | | | e | | China Overseas Land & Investment Ltd | | | 29,951 | |
| | 652,000 | | | * | | China Properties Group Ltd | | | 167 | |
| | 2,692,994 | | | | | China Resources Land Ltd | | | 6,700 | |
| | 2,773,200 | | | | | China SCE Property Holdings Ltd | | | 662 | |
| | 7,372,000 | | | e | | China South City Holdings Ltd | | | 2,091 | |
| | 1,617,678 | | | | | China Vanke Co Ltd | | | 2,526 | |
| | 335,500 | | | | | Chinese Estates Holdings Ltd | | | 1,044 | |
| | 50,800 | | | | | Choice Properties REIT | | | 503 | |
| | 414,080 | | | | | Chong Hong Construction Co | | | 1,275 | |
| | 4,930,000 | | | e | | CIFI Holdings Group Co Ltd | | | 1,046 | |
| | 115,428 | | | e | | City Developments Ltd | | | 882 | |
| | 389,608 | | | | | Citycon Oyj | | | 1,373 | |
| | 21,268 | | | | | Cofinimmo | | | 2,627 | |
COLLEGE RETIREMENT EQUITIES FUND - Stock Account
| SHARES | | | | | COMPANY | | VALUE
(000) | |
| | 26,001 | | | * | | Colonia Real Estate AG. | | $ | 161 | |
| | 280,441 | | | | | Colony Financial, Inc | | | 5,690 | |
| | 40 | | | | | Comforia Residential REIT, Inc | | | 282 | |
| | 102,498 | | | | | Cominar Real Estate Investment Trust | | | 1,779 | |
| | 3,810,422 | | | e | | Commonwealth Property Office Fund | | | 4,243 | |
| | 549,900 | | | e | | Concentradora Fibra Hotelera Mexicana S.A. de C.V. | | | 880 | |
| | 21,877 | | | | | Consolidated-Tomoka Land Co | | | 794 | |
| | 80,674 | | | | | Conwert Immobilien Invest AG. | | | 1,035 | |
| | 68,702 | | | | | Coresite Realty | | | 2,212 | |
| | 14,783 | | | | | Corio NV | | | 663 | |
| | 392,436 | | | e | | Corp Inmobiliaria Vesta SAB de C.V. | | | 684 | |
| | 47,897 | | | | | Corporate Office Properties Trust | | | 1,135 | |
| | 9,851,882 | | | | | Country Garden Holdings Co Ltd | | | 5,972 | |
| | 366,892 | | | | | Countrywide plc | | | 3,615 | |
| | 646,028 | | | | | Cousins Properties, Inc | | | 6,654 | |
| | 2,207 | | | e | | Crescendo Investment Corp | | | 1,698 | |
| | 93,800 | | | | | Crombie Real Estate Investment Trust | | | 1,196 | |
| | 1,527,000 | | | | | Cromwell Group | | | 1,330 | |
| | 6,858,943 | | | | | CSI Properties Ltd | | | 292 | |
| | 738,520 | | | | | CubeSmart | | | 11,772 | |
| | 74,030 | | | | | CyrusOne, Inc | | | 1,653 | |
| | 678,044 | | | | | CYS Investments, Inc | | | 5,024 | |
| | 1,561 | | | e | | DA Office Investment Corp | | | 7,276 | |
| | 109,100 | | | | | Daibiru Corp | | | 1,338 | |
| | 550,000 | | | | | Daikyo, Inc | | | 1,498 | |
| | 3,395,900 | | | | | Daiman Development BHD | | | 3,208 | |
| | 15,116 | | | | | Daito Trust Construction Co Ltd | | | 1,413 | |
| | 1,387,671 | | | | | Daiwa House Industry Co Ltd | | | 26,886 | |
| | 246 | | | | | Daiwa House REIT Investment Corp | | | 1,847 | |
| | 4,298,840 | | | | | DB RREEF Trust | | | 3,866 | |
| | 1,507,669 | | | | | DCT Industrial Trust, Inc | | | 10,750 | |
| | 1,842,843 | | | | | DDR Corp | | | 28,325 | |
| | 510,763 | | | * | | Delta Corp Ltd | | | 861 | |
| | 183,630 | | | | | Derwent London plc | | | 7,590 | |
| | 122,627 | | | | | Deutsche Euroshop AG. | | | 5,368 | |
| | 223,612 | | | | | Deutsche Wohnen AG. | | | 4,318 | |
| | 93,065 | | | * | | Deutsche Wohnen AG. (NEW) | | | 1,728 | |
| | 768,911 | | | | | DiamondRock Hospitality Co | | | 8,881 | |
| | 36,278 | | | | | DIC Asset AG. | | | 334 | |
| | 290,408 | | | e | | Digital Realty Trust, Inc | | | 14,265 | |
| | 10,522,807 | | | | | DLF Ltd | | | 28,423 | |
| | 44,854 | | | * | | Dogus Gayrimenkul Yatirim Ortakligi AS | | | 86 | |
| | 112,357 | | | | | Douglas Emmett, Inc | | | 2,617 | |
| | 45,713 | | | * | | Dream Unlimited Corp | | | 727 | |
| | 521,191 | | | | | Duke Realty Corp | | | 7,839 | |
| | 23,700 | | | | | Dundee Industrial Real Estate Investment Trust | | | 197 | |
| | 51,700 | | | | | Dundee International Real Estate Investment Trust | | | 410 | |
| | 144,374 | | | | | Dundee Real Estate Investment Trust | | | 3,917 | |
COLLEGE RETIREMENT EQUITIES FUND - Stock Account
| | | | | | | | | VALUE | |
| SHARES | | | | | COMPANY | | (000) | |
| | 221,654 | | | e | | DuPont Fabros Technology, Inc | | $ | 5,477 | |
| | 215,457 | | | | | Dynex Capital, Inc | | | 1,724 | |
| | 1,169,800 | | | | | Eastern & Oriental BHD | | | 676 | |
| | 123,367 | | | | | EastGroup Properties, Inc | | | 7,147 | |
| | 490,447 | | | | | Education Realty Trust, Inc | | | 4,326 | |
| | 24,163 | | | | | Ellington Residential Mortgage REIT | | | 372 | |
| | 1,096,496 | | | * | | Emaar Properties PJSC | | | 2,284 | |
| | 390,918 | | | | | Emira Property Fund | | | 533 | |
| | 6,120,550 | | | | | Emlak Konut Gayrimenkul Yatiri | | | 5,960 | |
| | 1,997,333 | | | | | Emperor International Holdings | | | 542 | |
| | 308,175 | | | | | Empire State Realty Trust, Inc | | | 4,715 | |
| | 196,215 | | | | | Entertainment Properties Trust | | | 9,646 | |
| | 314,171 | | | | | Equity Lifestyle Properties, Inc | | | 11,382 | |
| | 232,748 | | | | | Equity One, Inc | | | 5,223 | |
| | 1,162,453 | | | | | Equity Residential | | | 60,296 | |
| | 37,195 | | | e | | Essex Property Trust, Inc | | | 5,338 | |
| | 14,490 | | | * | | Eurobank Properties Real Estate Investment Co | | | 161 | |
| | 45,433 | | | | | Eurocommercial Properties NV | | | 1,927 | |
| | 8,224,000 | | | e | | Evergrande Real Estate Group | | | 3,151 | |
| | 205,624 | | | | | Excel Trust, Inc | | | 2,342 | |
| | 1,022,384 | | | | | Extra Space Storage, Inc | | | 43,073 | |
| | 310,124 | | | | | Fabege AB | | | 3,705 | |
| | 5,894,500 | | | e | | Fantasia Holdings Group Co Ltd | | | 1,021 | |
| | 1,050,000 | | | | | Far East Consortium | | | 395 | |
| | 1,138,000 | | | e | | Far East Hospitality Trust | | | 758 | |
| | 316,605 | | | | | Farglory Land Development Co Ltd | | | 537 | |
| | 93,075 | | | *,e | | Fastighets AB Balder | | | 956 | |
| | 133,153 | | | | | Federal Realty Investment Trust | | | 13,503 | |
| | 1,427,457 | | | | | Federation Centres | | | 2,992 | |
| | 604,174 | | | * | | FelCor Lodging Trust, Inc | | | 4,930 | |
| | 5,017,400 | | | | | Fibra Uno Administracion S.A. de C.V. | | | 16,071 | |
| | 12,000,000 | | | | | Filinvest Development Corp | | | 1,191 | |
| | 35,839,000 | | | | | Filinvest Land, Inc | | | 1,141 | |
| | 123,710 | | | | | First Capital Realty, Inc | | | 2,063 | |
| | 412,537 | | | | | First Industrial Realty Trust, Inc | | | 7,199 | |
| | 227,482 | | | | | First Potomac Realty Trust | | | 2,646 | |
| | 585,000 | | | | | First Real Estate Investment Trust | | | 492 | |
| | 35,910 | | | | | FirstService Corp | | | 1,547 | |
| | 3,286 | | | | | Fonciere Des Regions | | | 284 | |
| | 646,108 | | | * | | Forest City Enterprises, Inc (Class A) | | | 12,341 | |
| | 137,032 | | | * | | Forestar Real Estate Group, Inc | | | 2,915 | |
| | 173,931 | | | | | Fortress Income Fund Ltd | | | 244 | |
| | 404,883 | | | | | Franklin Street Properties Corp | | | 4,838 | |
| | 8,933,800 | | | e | | Franshion Properties China Ltd | | | 3,120 | |
| | 770,000 | | | *,m | | Frasers Centrepoint Ltd | | | 924 | |
| | 1,216,000 | | | | | Frasers Centrepoint Trust | | | 1,698 | |
| | 588 | | | | | Frontier Real Estate Investment Corp | | | 2,903 | |
| | 145 | | | | | Fukuoka REIT Corp | | | 1,174 | |
COLLEGE RETIREMENT EQUITIES FUND - Stock Account
| | | | | | | | | VALUE | |
| SHARES | | | | | COMPANY | | (000) | |
| | 4,170,000 | | | | | Future Land Development Holdin | | $ | 496 | |
| | 108,749 | | | * | | GAGFAH S.A. | | | 1,604 | |
| | 990,733 | | | *,e | | Gaming and Leisure Properties, Inc | | | 50,339 | |
| | 192,626 | | | | | Gazit Globe Ltd | | | 2,591 | |
| | 16,408 | | | | | Gazit, Inc | | | 482 | |
| | 2,256 | | | | | Gecina S.A. | | | 299 | |
| | 2,556,000 | | | * | | Gemdale Properties and Investm | | | 232 | |
| | 2,957,723 | | | | | General Growth Properties, Inc | | | 59,362 | |
| | 69,900 | | | * | | General Shopping Brasil S.A. | | | 279 | |
| | 115,707 | | | | | Getty Realty Corp | | | 2,126 | |
| | 58,333 | | | | | Gladstone Commercial Corp | | | 1,048 | |
| | 661,961 | | | | | Glimcher Realty Trust | | | 6,196 | |
| | 7,335,991 | | | e | | Global Logistic Properties | | | 16,828 | |
| | 335 | | | | | Global One Real Estate Investment Corp | | | 2,275 | |
| | 36,000,000 | | | * | | Global-Estate Resorts, Inc | | | 1,098 | |
| | 715,632 | | | * | | Globe Trade Centre S.A. | | | 1,768 | |
| | 280,100 | | | | | Glomac BHD | | | 96 | |
| | 4,690,895 | | | *,e | | Glorious Property Holdings Ltd | �� | | 1,013 | |
| | 2,289 | | | *,e | | GLP J-REIT | | | 2,236 | |
| | 208,359 | | | | | Gold Wheaton Gold Corp (GDR) | | | 872 | |
| | 33,080 | | | | | Goldcrest Co Ltd | | | 862 | |
| | 1,584,980 | | | | | Goodman Property Trust | | | 1,284 | |
| | 215,369 | | | e | | Government Properties Income Trust | | | 5,352 | |
| | 1,973,725 | | | | | GPT Group (ASE) | | | 6,002 | |
| | 594,411 | | | | | Grainger plc | | | 2,008 | |
| | 232,430 | | | *,e | | Gramercy Property Trust, Inc | | | 1,336 | |
| | 29,200 | | | | | Granite Real Estate Investment Trust | | | 1,063 | |
| | 294,652 | | | | | Great Eagle Holdings Ltd | | | 1,011 | |
| | 915,496 | | | | | Great Portland Estates plc | | | 9,096 | |
| | 210,400 | | | * | | Greattown Holdings Ltd | | | 86 | |
| | 4,836,347 | | | * | | Green REIT plc | | | 9,594 | |
| | 382,000 | | | | | Greenland Hong Kong Holdings Ltd | | | 186 | |
| | 720,900 | | | | | Greentown China Holdings Ltd | | | 1,105 | |
| | 1,982,514 | | | | | Growthpoint Properties Ltd | | | 4,595 | |
| | 6,883,300 | | | | | Guangzhou Investment Co Ltd | | | 1,701 | |
| | 3,446,936 | | | | | Guangzhou R&F Properties Co Ltd | | | 5,057 | |
| | 1,198,000 | | | | | GZI Real Estate Investment Trust | | | 585 | |
| | 303,086 | | | | | H&R Real Estate Investment Trust | | | 6,106 | |
| | 3,909 | | | | | Haesung Industrial Co Ltd | | | 206 | |
| | 597,747 | | | * | | Halk Gayrimenkul Yatrm Ortakli | | | 339 | |
| | 48,508 | | | | | Hamborner AG. | | | 490 | |
| | 3,198,145 | | | | | Hammerson plc | | | 26,625 | |
| | 1,991,016 | | | e | | Hang Lung Group Ltd | | | 10,072 | |
| | 16,409,071 | | | e | | Hang Lung Properties Ltd | | | 52,015 | |
| | 127 | | | | | Hankyu REIT, Inc | | | 659 | |
| | 41,794 | | | e | | Hannon Armstrong Sustainable Infrastructure Capital, Inc | | | 583 | |
| | 1,518,447 | | | e | | Hansteen Holdings plc | | | 2,721 | |
| | 211,079 | | | | | Hatteras Financial Corp | | | 3,449 | |
COLLEGE RETIREMENT EQUITIES FUND - Stock Account
| | | | | | | | | VALUE | |
| SHARES | | | | | COMPANY | | (000) | |
| | 1,006,544 | | | | | HCP, Inc | | $ | 36,558 | |
| | 648,849 | | | | | Health Care REIT, Inc | | | 34,759 | |
| | 395,684 | | | | | Healthcare Realty Trust, Inc | | | 8,432 | |
| | 219,785 | | | | | Healthcare Trust of America, Inc | | | 2,163 | |
| | 145,700 | | | | | Heiwa Real Estate Co Ltd | | | 2,537 | |
| | 158,653 | | | | | Helical Bar plc | | | 858 | |
| | 14,816 | | | | | Heliopolis Housing | | | 53 | |
| | 6,261,800 | | | | | Hemaraj Land and Development PCL | | | 562 | |
| | 1,587,279 | | | | | Henderson Land Development Co Ltd | | | 9,074 | |
| | 790,112 | | | | | Hersha Hospitality Trust | | | 4,401 | |
| | 19,410,600 | | | *,a | | Hibernia REIT plc | | | 31,243 | |
| | 318,500 | | | | | Highwealth Construction Corp | | | 675 | |
| | 377,082 | | | | | Highwoods Properties, Inc | | | 13,639 | |
| | 1,032,000 | | | | | HKR International Ltd | | | 480 | |
| | 472,000 | | | e | | Ho Bee Investment Ltd | | | 794 | |
| | 44,666 | | | | | Home Properties, Inc | | | 2,395 | |
| | 261,000 | | | | | Hong Fok Corp Ltd | | | 144 | |
| | 260,994 | | | | | Hongkong Land Holdings Ltd | | | 1,542 | |
| | 1,042,000 | | | * | | Hopson Development Holdings Ltd | | | 1,258 | |
| | 399,688 | | | | | Hospitality Properties Trust | | | 10,804 | |
| | 3,129,121 | | | | | Host Marriott Corp | | | 60,830 | |
| | 871,431 | | | * | | Housing Development & Infrastruture Ltd | | | 755 | |
| | 108,936 | | | * | | Howard Hughes Corp | | | 13,083 | |
| | 167,838 | | | | | HRPT Properties Trust | | | 3,912 | |
| | 611,235 | | | | | Huaku Development Co Ltd | | | 1,729 | |
| | 154,000 | | | | | Huang Hsiang Construction Co | | | 276 | |
| | 211,835 | | | | | Hudson Pacific Properties | | | 4,633 | |
| | 269,271 | | | | | Hufvudstaden AB (Series A) | | | 3,607 | |
| | 430,362 | | | | | Hung Poo Real Estate Development Corp | | | 435 | |
| | 553,000 | | | | | Hung Sheng Construction Co Ltd | | | 451 | |
| | 455,559 | | | | | Hyprop Investments Ltd | | | 3,316 | |
| | 1,104,125 | | | e | | Hysan Development Co Ltd | | | 4,766 | |
| | 12,825 | | | | | Icade | | | 1,194 | |
| | 3,915 | | | e | | Ichigo Real Estate Investment Corp | | | 2,399 | |
| | 98,200 | | | * | | IDU Co | | | 101 | |
| | 1,402,790 | | | | | IGB Corp BHD | | | 1,165 | |
| | 962,600 | | | | | IGB Real Estate Investment Trust | | | 350 | |
| | 126,600 | | | | | Iguatemi Empresa de Shopping Centers S.A. | | | 1,193 | |
| | 1,054,600 | | | | | IJM Land BHD | | | 820 | |
| | 193,672 | | | | | Immobiliare Grande Distribuzione | | | 230 | |
| | 1,355,948 | | | *,e,m | | Immoeast AG. | | | 0 | ^ |
| | 658,721 | | | *,e,m | | Immofinanz ANSPR NACHB AG. | | | 0 | ^ |
| | 129,420 | | | | | Immofinanz Immobilien Anlagen AG. | | | 600 | |
| | 693,635 | | | | | Indiabulls Real Estate Ltd | | | 775 | |
| | 371 | | | e | | Industrial & Infrastructure Fund Investment Corp | | | 3,091 | |
| | 1,828,530 | | | e | | ING Office Fund | | | 5,121 | |
| | 342,655 | | | | | Inland Real Estate Corp | | | 3,605 | |
| | 156,400 | | | | | InnVest Real Estate Investment Trust | | | 688 | |
COLLEGE RETIREMENT EQUITIES FUND - Stock Account
| | | | | | | | | VALUE | |
| SHARES | | | | | COMPANY | | (000) | |
| | 26,900 | | | | | InterRent Real Estate Investment Trust | | $ | 136 | |
| | 1,135 | | | | | Intershop Holdings | | | 426 | |
| | 10,075 | | | | | Intervest Offices | | | 270 | |
| | 529,141 | | | | | Invesco Mortgage Capital, Inc | | | 7,768 | |
| | 463,057 | | | e | | Investors Real Estate Trust | | | 3,973 | |
| | 1,941,725 | | | *,m | | IOI Properties Group Sdn BHD | | | 1,956 | |
| | 1,274,468 | | | | | Is Gayrimenkul Yatirim Ortakligi AS | | | 831 | |
| | 340,720 | | | *,e | | iStar Financial, Inc | | | 4,862 | |
| | 3,660 | | | | | Japan Excellent, Inc | | | 4,289 | |
| | 2,952 | | | | | Japan Hotel REIT Investment Corp | | | 1,415 | |
| | 632 | | | | | Japan Logistics Fund Inc | | | 6,698 | |
| | 449 | | | e | | Japan Prime Realty Investment Corp | | | 1,437 | |
| | 252 | | | | | Japan Real Estate Investment Corp | | | 1,348 | |
| | 2,505 | | | | | Japan Rental Housing Investments, Inc | | | 1,533 | |
| | 4,772 | | | | | Japan Retail Fund Investment Corp | | | 9,710 | |
| | 49,425 | | | e | | JAVELIN Mortgage Investment Corp | | | 689 | |
| | 17,724 | | | | | Jerusalem Economy Ltd | | | 176 | |
| | 11,792 | | | * | | Jerusalem Oil Exploration | | | 458 | |
| | 378,600 | | | | | JHSF Participacoes S.A. | | | 684 | |
| | 1,959,050 | | | | | Jiangsu Future Land Co Ltd | | | 1,192 | |
| | 553 | | | e | | Joint REIT Investment Corp | | | 2,686 | |
| | 62,309 | | | | | Jones Lang LaSalle, Inc | | | 6,380 | |
| | 10,100 | | | | | Jowa Holdings Co Ltd | | | 315 | |
| | 1,590,750 | | | | | K Wah International Holdings Ltd | | | 967 | |
| | 3,020,000 | | | *,e | | Kaisa Group Holdings Ltd | | | 978 | |
| | 228,480 | | | | | KEE TAI Properties Co Ltd | | | 153 | |
| | 2,230 | | | | | Kenedix Realty Investment Corp | | | 10,584 | |
| | 871 | | | | | Kenedix Residential Investment Corp | | | 1,882 | |
| | 426,800 | | | *,e | | Kenedix, Inc | | | 2,209 | |
| | 245,516 | | | e | | Kennedy-Wilson Holdings, Inc | | | 5,463 | |
| | 1,348,419 | | | e | | Keppel Land Ltd | | | 3,579 | |
| | 2,302,640 | | | | | Kerry Properties Ltd | | | 8,018 | |
| | 108,700 | | | e | | Killam Properties, Inc | | | 1,072 | |
| | 215,605 | | | | | Kilroy Realty Corp | | | 10,819 | |
| | 561,802 | | | | | Kimco Realty Corp | | | 11,096 | |
| | 246,000 | | | | | Kindom Construction Co | | | 283 | |
| | 476,280 | | | * | | King’s Town Construction Co Ltd | | | 465 | |
| | 498,084 | | | | | Kite Realty Group Trust | | | 3,272 | |
| | 1,963,056 | | | | | Kiwi Income Property Trust | | | 1,744 | |
| | 79,600 | | | | | KLCC Property Holdings BHD | | | 142 | |
| | 33,153 | | | | | Klepierre | | | 1,537 | |
| | 215,938 | | | | | Klovern AB | | | 957 | |
| | 3,250 | | | | | Klovern AB (Preference) | | | 76 | |
| | 110,636 | | | * | | Korea Real Estate Investment Trust Co | | | 173 | |
| | 3,438,130 | | | | | Kowloon Development Co Ltd | | | 4,243 | |
| | 2,671,026 | | | e | | K-REIT Asia | | | 2,511 | |
| | 273,768 | | | | | Kungsleden AB | | | 1,837 | |
| | 516,185 | | | | | Kuoyang Construction Co Ltd | | | 338 | |
COLLEGE RETIREMENT EQUITIES FUND - Stock Account
| | | | | | | | | VALUE | |
| SHARES | | | | | COMPANY | | (000) | |
| | 12,470,500 | | | | | KWG Property Holding Ltd | | $ | 6,935 | |
| | 79,846,000 | | | | | Lai Fung Holdings Ltd | | | 2,021 | |
| | 11,088,250 | | | * | | Lai Sun Development | | | 301 | |
| | 624,455 | | | | | Land Securities Group plc | | | 9,975 | |
| | 4,385,000 | | | * | | Langham Hospitality Investments Ltd | | | 2,105 | |
| | 403,567 | | | | | LaSalle Hotel Properties | | | 12,454 | |
| | 267,400 | | | | | LBS Bina Group BHD | | | 128 | |
| | 205,110 | | | * | | LC Corp S.A. | | | 113 | |
| | 104,105 | | | | | LEG Immobilien AG. | | | 6,157 | |
| | 368,416 | | | | | Lend Lease Corp Ltd | | | 3,677 | |
| | 206,011 | | | * | | Leopalace21 Corp | | | 1,091 | |
| | 706,696 | | | e | | Lexington Corporate Properties Trust | | | 7,215 | |
| | 206,731 | | | | | Liberty International plc | | | 1,061 | |
| | 323,076 | | | | | Liberty Property Trust | | | 10,943 | |
| | 3,411,321 | | | e | | Link Real Estate Investment Trust | | | 16,545 | |
| | 1,868,000 | | | e | | Lippo-Mapletree Indonesia Retail Trust | | | 616 | |
| | 724,280 | | | | | London & Stamford Property plc | | | 1,659 | |
| | 391,000 | | | | | Long Bon International Co Ltd | | | 249 | |
| | 1,837,400 | | | e | | Longfor Properties Co Ltd | | | 2,575 | |
| | 1,950,000 | | | | | LPN Development PCL | | | 922 | |
| | 239,400 | | | | | LPS Brasil Consultoria de Imoveis S.A. | | | 1,465 | |
| | 183,758 | | | | | LTC Properties, Inc | | | 6,503 | |
| | 99,276 | | | | | Macerich Co | | | 5,846 | |
| | 369,145 | | | | | Mack-Cali Realty Corp | | | 7,929 | |
| | 889,029 | | | e | | Macquarie CountryWide Trust | | | 2,854 | |
| | 738,839 | | | | | Macquarie Goodman Group | | | 3,130 | |
| | 3,132,590 | | | | | Macquarie MEAG Prime REIT | | | 1,953 | |
| | 1,992,878 | | | | | Mah Sing Group BHD | | | 1,376 | |
| | 5,600 | | | * | | Mainstreet Equity Corp | | | 192 | |
| | 35,779 | | | *,e,m | | Mapeley Ltd | | | 8 | |
| | 3,104,000 | | | e | | Mapletree Commercial Trust | | | 2,935 | |
| | 2,213,000 | | | | | Mapletree Greater China Commercial Trust | | | 1,476 | |
| | 3,101,147 | | | e | | Mapletree Industrial Trust | | | 3,286 | |
| | 3,806,584 | | | | | Mapletree Logistics Trust | | | 3,186 | |
| | 100,000 | | | | | MBK PCL | | | 427 | |
| | 640,918 | | | | | Medical Properties Trust, Inc | | | 7,832 | |
| | 17,472 | | | * | | Medinet Nasr Housing | | | 58 | |
| | 43,095,200 | | | | | Megaworld Corp | | | 3,159 | |
| | 24,448 | | | | | Melisron Ltd | | | 664 | |
| | 108,794 | | | | | Mercialys S.A | | | 2,282 | |
| | 773,100 | | | | | Mexico Real Estate Management S.A. de C.V. | | | 1,527 | |
| | 1,325,386 | | | e | | MFA Mortgage Investments, Inc | | | 9,357 | |
| | 587 | | | | | MID REIT, Inc | | | 1,307 | |
| | 159,684 | | | e | | Mid-America Apartment Communities, Inc | | | 9,699 | |
| | 1,792,929 | | | e | | Midland Holdings Ltd | | | 864 | |
| | 2,744,000 | | | e | | Minmetals Land Ltd | | | 366 | |
| | 1,650,697 | | | e | | Mirvac Group | | | 2,482 | |
| | 874,837 | | | | | Mitsubishi Estate Co Ltd | | | 26,180 | |
COLLEGE RETIREMENT EQUITIES FUND - Stock Account
| | | | | | | | | VALUE | |
| SHARES | | | | | COMPANY | | (000) | |
| | 1,887,022 | | | | | Mitsui Fudosan Co Ltd | | $ | 68,066 | |
| | 116,000 | | | | | MKH BHD | | | 95 | |
| | 7,899 | | | | | Mobimo Holding AG. | | | 1,651 | |
| | 185,013 | | | | | Monmouth Real Estate Investment Corp (Class A) | | | 1,682 | |
| | 13,500 | | | | | Morguard North American Reside | | | 120 | |
| | 36,221 | | | | | Morguard Real Estate Investment Trust | | | 561 | |
| | 379 | | | | | Mori Hills REIT Investment Corp | | | 2,512 | |
| | 291 | | | | | Mori Trust Sogo REIT, Inc | | | 2,318 | |
| | 173,909 | | | | | Multiplan Empreendimentos Imobiliarios S.A. | | | 3,678 | |
| | 383,600 | | | | | Naim Holdings BHD | | | 428 | |
| | 121,095 | | | | | National Health Investors, Inc | | | 6,793 | |
| | 394,326 | | | e | | National Retail Properties, Inc | | | 11,960 | |
| | 113,255,000 | | | * | | Natural Park PCL | | | 207 | |
| | 1,718,000 | | | *,e | | Neo-China Land Group Holdings Ltd | | | 427 | |
| | 990,837 | | | | | New Residential Investment Corp | | | 6,619 | |
| | 5,390,666 | | | e | | New World China Land Ltd | | | 2,609 | |
| | 10,645,667 | | | | | New World Development Ltd | | | 13,480 | |
| | 253,558 | | | e | | New York Mortgage Trust, Inc | | | 1,772 | |
| | 93,816 | | | | | Nieuwe Steen Investments NV | | | 595 | |
| | 284 | | | | | Nippon Accommodations Fund, Inc | | | 1,911 | |
| | 568 | | | e | | Nippon Building Fund, Inc | | | 3,300 | |
| | 1,021 | | | | | Nippon ProLogis REIT, Inc | | | 9,780 | |
| | 35,588 | | | * | | Nitsba Holdings 1995 Ltd | | | 522 | |
| | 479,629 | | | | | Nomura Real Estate Holdings, Inc | | | 10,807 | |
| | 5,059 | | | | | Nomura Real Estate Master Fund, Inc | | | 5,212 | |
| | 470 | | | | | Nomura Real Estate Office Fund, Inc | | | 2,184 | |
| | 356 | | | | | Nomura Real Estate Residential Fund, Inc | | | 1,843 | |
| | 52,469 | | | | | Northern Property Real Estate Investment Trust | | | 1,371 | |
| | 1,123,546 | | | e | | NorthStar Realty Finance Corp | | | 15,112 | |
| | 19,700 | | | | | NorthWest Healthcare Properties Real Estate Investment Trust | | | 194 | |
| | 766,783 | | | | | Norwegian Property ASA | | | 919 | |
| | 159,900 | | | | | NTT Urban Development Corp | | | 1,843 | |
| | 508,958 | | | | | Omega Healthcare Investors, Inc | | | 15,167 | |
| | 48,095 | | | | | One Liberty Properties, Inc | | | 968 | |
| | 1,200,000 | | | * | | Orbit Corp Ltd | | | 325 | |
| | 138,000 | | | | | Orchard Parade Holdings Ltd | | | 204 | |
| | 107,558 | | | * | | Orco Property Group | | | 248 | |
| | 4,003 | | | * | | Orix JREIT, Inc | | | 5,008 | |
| | 1,005,000 | | | * | | OUE Hospitality Trust | | | 697 | |
| | 1,856,805 | | | * | | Palm Hills Developments SAE | | | 700 | |
| | 140,920 | | | | | Paramount Corp BHD | | | 65 | |
| | 728,000 | | | e | | Parkway Life Real Estate Investment Trust | | | 1,356 | |
| | 472,542 | | | | | Parkway Properties, Inc | | | 9,115 | |
| | 1,442,051 | | | | | Parque Arauco S.A | | | 2,650 | |
| | 42,824 | | | * | | Patrizia Immobilien AG. | | | 452 | |
| | 330,900 | | | | | Pavilion Real Estate Investment Trust | | | 129 | |
| | 236,508 | | | | | Pebblebrook Hotel Trust | | | 7,275 | |
| | 267,773 | | | | | Pennsylvania Real Estate Investment Trust | | | 5,082 | |
COLLEGE RETIREMENT EQUITIES FUND - Stock Account
| | | | | | | | | VALUE | |
| SHARES | | | | | COMPANY | | (000) | |
| | 270,825 | | | | | Pennymac Mortgage Investment Trust | | $ | 6,218 | |
| | 800,000 | | | e | | Perennial China Retail Trust | | | 337 | |
| | 953,476 | | | * | | Phoenix Mills Ltd | | | 3,509 | |
| | 75,126 | | | e | | Physicians Realty Trust | | | 957 | |
| | 130,282 | | | e | | Piedmont Office Realty Trust, Inc | | | 2,152 | |
| | 382,672 | | | | | Plum Creek Timber Co, Inc | | | 17,798 | |
| | 2,778,300 | | | e | | Poly Hong Kong Investment Ltd | | | 1,489 | |
| | 7,091,160 | | | | | Polytec Asset Holdings Ltd | | | 907 | |
| | 141,504 | | | | | Post Properties, Inc | | | 6,400 | |
| | 309,639 | | | | | Potlatch Corp | | | 12,924 | |
| | 2,048,000 | | | | | Powerlong Real Estate Holdings Ltd | | | 440 | |
| | 1,091 | | | e | | Premier Investment Co | | | 4,223 | |
| | 6,189 | | | | | Prestige Estates Projects Ltd | | | 16 | |
| | 1,936,400 | | | | | Preuksa Real Estate PCL (Foreign) | | | 1,077 | |
| | 88,529 | | | | | Primary Health Properties plc | | | 518 | |
| | 48,165 | | | * | | Prime Office REIT-AG. | | | 205 | |
| | 1,239,766 | | | | | Prince Housing & Development Corp | | | 731 | |
| | 1,805,007 | | | | | Prologis, Inc | | | 66,695 | |
| | 1,679 | | | | | Property & Building Corp | | | 112 | |
| | 3,168,000 | | | e | | Prosperity REIT | | | 924 | |
| | 109,012 | | | | | PS Business Parks, Inc | | | 8,331 | |
| | 61,328 | | | | | PSP Swiss Property AG. | | | 5,197 | |
| | 8,067,500 | | | | | PT Agung Podomoro Land Tbk | | | 143 | |
| | 16,780,000 | | | | | PT Alam Sutera Realty Tbk | | | 594 | |
| | 4,019,500 | | | | | PT Bekasi Fajar Industrial Estate Tbk | | | 147 | |
| | 7,520,100 | | | | | PT Bumi Serpong Damai | | | 798 | |
| | 29,434,500 | | | | | PT Ciputra Development Tbk | | | 1,818 | |
| | 16,321,000 | | | | | PT Ciputra Property Tbk | | | 832 | |
| | 3,949,000 | | | | | PT Ciputra Surya Tbk | | | 426 | |
| | 5,923,500 | | | *,m | | PT Gading Development Tbk | | | 43 | |
| | 9,451,500 | | | | | PT Intiland Development Tbk | | | 245 | |
| | 84,439,149 | | | | | PT Kawasan Industri Jababeka Tbk | | | 1,341 | |
| | 575,500 | | | * | | PT Lippo Cikarang Tbk | | | 231 | |
| | 35,852,900 | | | | | PT Lippo Karawaci Tbk | | | 2,684 | |
| | 2,493,500 | | | | | PT Metropolitan Land Tbk | | | 78 | |
| | 9,753,000 | | | * | | PT Modernland Realty Tbk | | | 313 | |
| | 5,881,000 | | | * | | PT Nirvana Development Tbk | | | 128 | |
| | 16,872,000 | | | | | PT Pakuwon Jati Tbk | | | 375 | |
| | 37,811,500 | | | * | | PT Sentul City Tbk | | | 489 | |
| | 13,146,000 | | | | | PT Summarecon Agung Tbk | | | 844 | |
| | 704,349 | | | | | Public Storage, Inc | | | 106,019 | |
| | 4,319,882 | | | * | | Puravankara Projects Ltd | | | 5,672 | |
| | 72,500 | | | | | Pure Industrial Real Estate Trust | | | 326 | |
| | 50,251 | | | * | | QTS Realty Trust, Inc | | | 1,245 | |
| | 14,466,432 | | | | | Quality House PCL | | | 1,168 | |
| | 712,992 | | | * | | Quintain Estates & Development plc | | | 1,116 | |
| | 783,167 | | | | | Radium Life Tech Co Ltd | | | 630 | |
COLLEGE RETIREMENT EQUITIES FUND - Stock Account
| | | | | | | | | VALUE | |
| SHARES | | | | | COMPANY | | (000) | |
| | 271,711 | | | e | | RAIT Investment Trust | | $ | 2,437 | |
| | 253,117 | | | | | Ramco-Gershenson Properties | | | 3,984 | |
| | 152,776 | | | | | Rayonier, Inc | | | 6,432 | |
| | 150 | | | *,e | | Raysum Co Ltd | | | 242 | |
| | 48,197 | | | * | | RE/MAX Holdings, Inc | | | 1,546 | |
| | 2,307,281 | | | * | | Realogy Holdings Corp | | | 114,141 | |
| | 153,766 | | | e | | Realty Income Corp | | | 5,740 | |
| | 107,977 | | | | | Rebosis Property Fund Ltd | | | 123 | |
| | 6,082,665 | | | | | Redefine Income Fund Ltd | | | 5,648 | |
| | 730,573 | | | | | Redefine International plc | | | 726 | |
| | 316,666 | | | e | | Redwood Trust, Inc | | | 6,134 | |
| | 27,552,000 | | | | | Regal Real Estate Investment Trust | | | 7,923 | |
| | 83,228 | | | | | Regency Centers Corp | | | 3,853 | |
| | 3,259,000 | | | e | | Religare Health Trust | | | 2,000 | |
| | 19,700 | | | | | Relo Holdings, Inc | | | 1,011 | |
| | 14,811,500 | | | *,e | | Renhe Commercial Holdings Co Ltd | | | 947 | |
| | 475,608 | | | | | Resilient Property Income Fund Ltd | | | 2,514 | |
| | 511,304 | | | e | | Resource Capital Corp | | | 3,032 | |
| | 275,261 | | | | | Retail Opportunities Investment Corp | | | 4,052 | |
| | 305,301 | | | | | Retail Properties of America, Inc | | | 3,883 | |
| | 62,805 | | | * | | Rexford Industrial Realty, Inc | | | 829 | |
| | 529,601 | | | | | RioCan Real Estate Investment Trust | | | 12,349 | |
| | 564,806 | | | | | RLJ Lodging Trust | | | 13,736 | |
| | 2,474,700 | | | | | Robinsons Land Corp | | | 1,115 | |
| | 88,249 | | | e | | Rouse Properties, Inc | | | 1,958 | |
| | 696,294 | | | | | Ruentex Development Co Ltd | | | 1,353 | |
| | 151,298 | | | e | | Ryman Hospitality Properties | | | 6,321 | |
| | 3,533,288 | | | | | S.A. Corporate Real Estate Fund | | | 1,344 | |
| | 678,000 | | | e | | Sabana Shari’ah Compliant Industrial REIT | | | 580 | |
| | 139,011 | | | | | Sabra Healthcare REIT, Inc | | | 3,634 | |
| | 265,259 | | | * | | Saf Gayrimenkul Yatirim Ortakligi AS | | | 137 | |
| | 120,000 | | | | | Saizen REIT | | | 88 | |
| | 19,839,232 | | | | | Sansiri PCL | | | 1,087 | |
| | 40,800 | | | | | Sao Carlos Empreendimentos e Participacoes S.A. | | | 640 | |
| | 46,101 | | | e | | Saul Centers, Inc | | | 2,200 | |
| | 180,255 | | | | | Savills plc | | | 1,928 | |
| | 1,699,200 | | | | | SC Asset Corp PCL | | | 157 | |
| | 257,367 | | | | | Segro plc | | | 1,425 | |
| | 97,096 | | | | | Select Income REIT | | | 2,596 | |
| | 22,199 | | | * | | Selvaag Bolig ASA | | | 65 | |
| | 188,917 | | | | | Senior Housing Properties Trust | | | 4,200 | |
| | 370,325 | | | | | Shaftesbury plc | | | 3,857 | |
| | 542,840 | | | m | | Shanghai Jinqiao Export Processing Zone Development Co Ltd | | | 578 | |
| | 72,000 | | | | | Shanghai Lujiazui Finance & Trade Zone Development Co Ltd | | | 116 | |
| | 24,843,429 | | | * | | Shanghai Real Estate Ltd | | | 850 | |
| | 805,000 | | | e | | Shell Electric MFG | | | 770 | |
| | 4,168,650 | | | e | | Shenzhen Investment Ltd | | | 1,576 | |
| | 1,756,000 | | | | | Shimao Property Holdings Ltd | | | 4,048 | |
COLLEGE RETIREMENT EQUITIES FUND - Stock Account
| | | | | | | | | VALUE | |
| SHARES | | | | | COMPANY | | (000) | |
| | 760,254 | | | * | | Shining Building Business Co Ltd | | $ | 636 | |
| | 796,800 | | | | | Shoei Co Ltd | | | 11,792 | |
| | 698,676 | | | | | Shopping Centres Australasia Property Group | | | 965 | |
| | 4,307,793 | | | | | Shui On Land Ltd | | | 1,325 | |
| | 62,547 | | | e | | Silver Bay Realty Trust Corp | | | 1,000 | |
| | 1,959,997 | | | | | Simon Property Group, Inc | | | 298,233 | |
| | 12,600 | | | e | | Singapore Land Ltd | | | 84 | |
| | 9,926,000 | | | * | | SingHaiyi Group Ltd | | | 166 | |
| | 3,625,936 | | | e | | Sino Land Co | | | 4,973 | |
| | 2,132,000 | | | * | | Sinolink Worldwide Holdings Ltd | | | 201 | |
| | 9,656,718 | | | e | | Sino-Ocean Land Holdings Ltd | | | 6,355 | |
| | 128,367 | | | | | Sinpas Gayrimenkul Yatirim Ortakligi AS | | | 49 | |
| | 398,778 | | | | | Sinyi Realty Co | | | 719 | |
| | 66,083 | | | * | | Six of October Development & Investment | | | 215 | |
| | 714,563 | | | | | SL Green Realty Corp | | | 66,011 | |
| | 11,500,415 | | | | | SM Prime Holdings | | | 3,818 | |
| | 772,805 | | | * | | Sobha Developers Ltd | | | 3,901 | |
| | 7,712 | | | | | Societe de la Tour Eiffel | | | 515 | |
| | 6,439,000 | | | e | | Soho China Ltd | | | 5,559 | |
| | 714,000 | | | | | Soilbuild Business Space REIT | | | 436 | |
| | 80,600 | | | | | Sonae Sierra Brasil S.A. | | | 623 | |
| | 98,000 | | | | | Soundwill Holdings Ltd | | | 186 | |
| | 140,641 | | | | | Sovran Self Storage, Inc | | | 9,166 | |
| | 126,210 | | | | | Sparkassen Immobilien AG. | | | 919 | |
| | 1,054,000 | | | * | | SPH REIT | | | 819 | |
| | 1,192,718 | | | | | Spirit Realty Capital, Inc | | | 11,724 | |
| | 504,214 | | | | | Sponda Oyj | | | 2,370 | |
| | 373,323 | | | | | ST Modwen Properties plc | | | 2,275 | |
| | 53,628 | | | *,e | | St. Joe Co | | | 1,029 | |
| | 163,028 | | | | | STAG Industrial, Inc | | | 3,324 | |
| | 1,185,832 | | | | | Starwood Property Trust, Inc | | | 32,848 | |
| | 2,874,914 | | | e | | Stockland Trust Group | | | 9,295 | |
| | 1,683,746 | | | * | | Strategic Hotels & Resorts, Inc | | | 15,911 | |
| | 39,100 | | | | | Sumitomo Real Estate Sales Co Ltd | | | 1,196 | |
| | 1,056,822 | | | | | Sumitomo Realty & Development Co Ltd | | | 52,659 | |
| | 298,797 | | | | | Summit Hotel Properties, Inc | | | 2,689 | |
| | 133,731 | | | | | Sun Communities, Inc | | | 5,702 | |
| | 24,200 | | | e | | Sun Frontier Fudousan Co Ltd | | | 386 | |
| | 3,327,635 | | | | | Sun Hung Kai Properties Ltd | | | 42,292 | |
| | 1,741,000 | | | e | | Sunac China Holdings Ltd | | | 1,046 | |
| | 2,497,000 | | | | | Sunlight Real Estate Investment Trust | | | 966 | |
| | 1,221,592 | | | | | Sunstone Hotel Investors, Inc | | | 16,369 | |
| | 2,999,298 | | | e | | Suntec Real Estate Investment Trust | | | 3,668 | |
| | 1,845,222 | | | * | | Sunteck Realty Ltd | | | 9,014 | |
| | 1,876,058 | | | | | Sunway BHD | | | 1,559 | |
| | 1,253,200 | | | | | Sunway Real Estate Investment | | | 474 | |
| | 3,689,000 | | | | | Supalai PCL | | | 1,647 | |
| | 1,469,693 | | | | | Swire Pacific Ltd (Class A) | | | 17,268 | |
COLLEGE RETIREMENT EQUITIES FUND - Stock Account
| | | | | | | | | VALUE | |
| SHARES | | | | | COMPANY | | (000) | |
| | 2,159,301 | | | | | Swire Properties Ltd | | $ | 5,468 | |
| | 110,363 | | | | | Swiss Prime Site AG. | | | 8,546 | |
| | 238,288 | | | | | Sycom Property Fund | | | 565 | |
| | 1,256,600 | | | | | TA Global BHD | | | 113 | |
| | 303,583 | | | e | | TAG Tegernsee Immobilien und Beteiligungs AG. | | | 3,672 | |
| | 415,852 | | | * | | Taiwan Land Development Corp | | | 153 | |
| | 95,600 | | | | | Takara Leben Co Ltd | | | 326 | |
| | 838,470 | | | * | | Talaat Moustafa Group | | | 753 | |
| | 264,601 | | | | | Tanger Factory Outlet Centers, Inc | | | 8,473 | |
| | 94,449 | | | | | Taubman Centers, Inc | | | 6,037 | |
| | 202,966 | | | | | Technopolis plc | | | 1,214 | |
| | 41,440 | | | *,e | | Tejon Ranch Co | | | 1,523 | |
| | 113,818 | | | | | Terreno Realty Corp | | | 2,015 | |
| | 326,700 | | | | | TF Administradora Industrial S de RL de C.V. | | | 588 | |
| | 1,481,400 | | | | | Ticon Industrial Connection PCL | | | 716 | |
| | 81,700 | | | | | TOC Co Ltd | | | 653 | |
| | 1,045,079 | | | | | Tokyo Tatemono Co Ltd | | | 11,621 | |
| | 1,132,335 | | | * | | Tokyu Fudosan Holdings Corp | | | 10,645 | |
| | 258 | | | | | Tokyu REIT, Inc | | | 1,591 | |
| | 236 | | | | | Top REIT Inc | | | 1,108 | |
| | 190,778 | | | | | Torunlar Gayrimenkul Yatirim Ortakligi AS | | | 245 | |
| | 607,800 | | | e | | Tosei Corp | | | 4,977 | |
| | 301,000 | | | | | Tropicana Corp BHD | | | 112 | |
| | 1,014,015 | | | | | Two Harbors Investment Corp | | | 9,410 | |
| | 191,920 | | | | | UDR, Inc | | | 4,481 | |
| | 1,540,430 | | | | | UEM Land Holdings BHD | | | 1,112 | |
| | 74,395 | | | | | UMH Properties, Inc | | | 701 | |
| | 104,643 | | | | | Unibail-Rodamco | | | 26,816 | |
| | 372,808 | | | | | Unite Group plc | | | 2,488 | |
| | 6,958,291 | | | * | | Unitech Corporate Parks plc | | | 4,724 | |
| | 64,406,092 | | | * | | Unitech Ltd | | | 15,953 | |
| | 854,519 | | | | | United Overseas Land Ltd | | | 4,206 | |
| | 4,589 | | | | | United Urban Investment Corp | | | 6,596 | |
| | 989,000 | | | | | Univentures PCL | | | 209 | |
| | 47,014 | | | | | Universal Health Realty Income Trust | | | 1,883 | |
| | 931,148 | | | | | UOA Development BHD | | | 552 | |
| | 101,335 | | | | | Urstadt Biddle Properties, Inc (Class A) | | | 1,870 | |
| | 49,444 | | | * | | Vakif Gayrimenkul Yatirim Ortakligi AS | | | 262 | |
| | 22,414 | | | | | Vastned Retail NV | | | 1,017 | |
| | 1,197,783 | | | | | Ventas, Inc | | | 68,609 | |
| | 9,057,000 | | | | | Vista Land & Lifescapes, Inc | | | 1,063 | |
| | 594,179 | | | | | Vornado Realty Trust | | | 52,757 | |
| | 762,163 | | | | | Vukile Property Fund Ltd | | | 1,228 | |
| | 118,472 | | | e | | Wallenstam Byggnads AB (B Shares) | | | 1,792 | |
| | 25,278 | | | | | Warehouses De Pauw SCA | | | 1,833 | |
| | 244,985 | | | e | | Washington Real Estate Investment Trust | | | 5,723 | |
| | 211,243 | | | | | Weingarten Realty Investors | | | 5,792 | |
| | 26,467 | | | | | Wereldhave NV | | | 2,083 | |
COLLEGE RETIREMENT EQUITIES FUND - Stock Account
| | | | | | | VALUE | |
| SHARES | | | | COMPANY | | (000) | |
| | 97,401 | | | e | | Western Asset Mortgage Capital Corp | | $ | 1,449 | |
| | 4,567,456 | | | | | Westfield Group | | | 41,232 | |
| | 7,182,306 | | | | | Westfield Retail Trust | | | 19,081 | |
| | 1,414,033 | | | | | Weyerhaeuser Co | | | 44,641 | |
| | 352,950 | | | | | WHA Corp PCL | | | 302 | |
| | 2,750,413 | | | e | | Wharf Holdings Ltd | | | 21,069 | |
| | 1,862,064 | | | | | Wheelock & Co Ltd | | | 8,578 | |
| | 413,097 | | | e | | Wheelock Properties S Ltd | | | 555 | |
| | 69,628 | | | e | | Whitestone REIT | | | 931 | |
| | 145,402 | | | | | Wihlborgs Fastigheter AB | | | 2,608 | |
| | 492,832 | | | e | | Wing Tai Holdings Ltd | | | 770 | |
| | 141,601 | | | | | Winthrop Realty Trust | | | 1,565 | |
| | 249,681 | | | | | Workspace Group plc | | | 2,183 | |
| | 206,436 | | | e | | WP Carey, Inc | | | 12,665 | |
| | 5,825,000 | | | e | | Yanlord Land Group Ltd | | | 5,669 | |
| | 1,197,000 | | | *,e | | Ying Li International Real Estate Ltd | | | 376 | |
| | 11,753 | | | | | YNH Property BHD | | | 7 | |
| | 1,133,600 | | | * | | YTL Land & Development BHD | | | 324 | |
| | 2,204,320 | | | | | Yuzhou Properties Co | | | 549 | |
| | 21,472 | | | | | ZAIS Financial Corp | | | 344 | |
| | 1,108,000 | | | | | Zall Development Group Ltd | | | 392 | |
| | 4,410,800 | | | *,e | | Zhong An Real Estate Ltd | | | 819 | |
| | 377 | | | | | Zug Estates Holding AG | | | 491 | |
| | | | | | | TOTAL REAL ESTATE | | | 4,015,080 | |
| | | | | | | | | | | |
| RETAILING - 4.0% | | | | |
| | 109,311 | | | * | | 1-800-FLOWERS.COM, Inc (Class A) | | | 591 | |
| | 89,050 | | | | | Aaron’s, Inc | | | 2,618 | |
| | 48,391 | | | | | ABC-Mart, Inc | | | 2,114 | |
| | 342,384 | | | e | | Abercrombie & Fitch Co (Class A) | | | 11,268 | |
| | 114,013 | | | | | Advance Auto Parts, Inc | | | 12,619 | |
| | 1,253,556 | | | *,e | | Aeropostale, Inc | | | 11,395 | |
| | 17,600 | | | e | | Alpen Co Ltd | | | 316 | |
| | 1,429,814 | | | * | | Amazon.com, Inc | | | 570,196 | |
| | 937,296 | | | | | American Eagle Outfitters, Inc | | | 13,497 | |
| | 25,656 | | | * | | America’s Car-Mart, Inc | | | 1,083 | |
| | 446,464 | | | * | | Ann Taylor Stores Corp | | | 16,323 | |
| | 49,506 | | | | | AOKI Holdings, Inc | | | 859 | |
| | 171,241 | | | | | Aoyama Trading Co Ltd | | | 4,631 | |
| | 14,000 | | | | | Arc Land Sakamoto Co Ltd | | | 244 | |
| | 15,200 | | | | | Asahi Co Ltd | | | 212 | |
| | 100,498 | | | * | | Asbury Automotive Group, Inc | | | 5,401 | |
| | 844,301 | | | * | | Ascena Retail Group, Inc | | | 17,865 | |
| | 20,400 | | | | | ASKUL Corp | | | 598 | |
| | 386,563 | | | * | | ASOS plc | | | 39,386 | |
| | 73,737 | | | * | | Audiovox Corp (Class A) | | | 1,231 | |
| | 434,000 | | | | | Aurora Corp | | | 932 | |
| | 71,288 | | | | | Autobacs Seven Co Ltd | | | 1,110 | |
COLLEGE RETIREMENT EQUITIES FUND - Stock Account
| | | | | | | VALUE | |
| SHARES | | | | COMPANY | | (000) | |
| | 32,957 | | | e | | AutoCanada, Inc | | $ | 1,424 | |
| | 208,828 | | | | | Automotive Holdings Group | | | 706 | |
| | 93,181 | | | * | | Autonation, Inc | | | 4,630 | |
| | 76,374 | | | * | | AutoZone, Inc | | | 36,502 | |
| | 90,900 | | | * | | B2W Companhia Global Do Varejo | | | 588 | |
| | 157,469 | | | * | | Barnes & Noble, Inc | | | 2,354 | |
| | 5,854,069 | | | | | Beauty Community PCL (ADR) | | | 3,615 | |
| | 127,082 | | | | | Bebe Stores, Inc | | | 676 | |
| | 817,226 | | | * | | Bed Bath & Beyond, Inc | | | 65,623 | |
| | 5,108,400 | | | e | | Belle International Holdings Ltd | | | 5,935 | |
| | 73,900 | | | | | Belluna Co Ltd | | | 358 | |
| | 3,650,803 | | | | | Best Buy Co, Inc | | | 145,594 | |
| | 2,514 | | | e | | BIC CAMERA, Inc | | | 1,412 | |
| | 111,685 | | | | | Big 5 Sporting Goods Corp | | | 2,214 | |
| | 327,575 | | | * | | Big Lots, Inc | | | 10,577 | |
| | 49,918 | | | | | Bilia AB (A Shares) | | | 1,275 | |
| | 86,639 | | | *,e | | Blue Nile, Inc | | | 4,080 | |
| | 66,312 | | | *,e | | Body Central Corp | | | 261 | |
| | 4,988,000 | | | | | Bonjour Holdings Ltd | | | 1,089 | |
| | 43,966 | | | e | | Bon-Ton Stores, Inc | | | 716 | |
| | 1,287,000 | | | *,e,m | | Boshiwa International Holding | | | 2 | |
| | 47,982 | | | * | | Boyner Buyuk Magazacilik | | | 161 | |
| | 98,088 | | | | | Breville Group Ltd | | | 782 | |
| | 234,771 | | | | | Brown Shoe Co, Inc | | | 6,606 | |
| | 91,873 | | | e | | Buckle, Inc | | | 4,829 | |
| | 51,696 | | | *,e | | Burlington Stores, Inc | | | 1,654 | |
| | 101,157 | | | e | | Byggmax Group AB | | | 764 | |
| | 105,514 | | | * | | Cabela’s, Inc | | | 7,034 | |
| | 130,604 | | | e | | Canadian Tire Corp Ltd | | | 12,232 | |
| | 111,523 | | | | | Canon Marketing Japan, Inc | | | 1,556 | |
| | 1,883,699 | | | * | | Carmax, Inc | | | 88,572 | |
| | 275,398 | | | e | | Cash Converters International Ltd | | | 239 | |
| | 22,690 | | | | | Cashbuild Ltd | | | 335 | |
| | 106,882 | | | | | Cato Corp (Class A) | | | 3,399 | |
| | 106,941 | | | *,e | | CDON Group AB | | | 525 | |
| | 598,000 | | | | | Century Ginwa Retail Holdings Ltd | | | 128 | |
| | 234,947 | | | | | Chico’s FAS, Inc | | | 4,426 | |
| | 278,493 | | | * | | Children’s Place Retail Stores, Inc | | | 15,866 | |
| | 341,000 | | | * | | China Harmony Auto Holding Ltd | | | 241 | |
| | 347,500 | | | e | | China Yongda Automobiles Services Holdings Ltd | | | 313 | |
| | 16,009,600 | | | *,e | | China ZhengTong Auto Services Holdings Ltd | | | 10,295 | |
| | 26,700 | | | | | Chiyoda Co Ltd | | | 515 | |
| | 11,000 | | | | | Chori Co Ltd | | | 124 | |
| | 837,000 | | | | | Chow Sang Sang Holding | | | 2,391 | |
| | 1,278,600 | | | e | | Chow Tai Fook Jewellery Group Ltd | | | 1,911 | |
| | 160,424 | | | * | | Christopher & Banks Corp | | | 1,370 | |
| | 157,200 | | | | | Cia Hering | | | 1,992 | |
| | 61,852 | | | * | | Citi Trends, Inc | | | 1,051 | |
COLLEGE RETIREMENT EQUITIES FUND - Stock Account
| | | | | | | VALUE | |
| SHARES | | | | COMPANY | | (000) | |
| | 18,728 | | | | | CJ O Shopping Co Ltd | | $ | 7,368 | |
| | 80,404 | | | | | Clas Ohlson AB (B Shares) | | | 1,509 | |
| | 383,256 | | | *,e | | Conn’s, Inc | | | 30,197 | |
| | 199,219 | | | *,e | | Container Store Group, Inc | | | 9,286 | |
| | 49,575 | | | | | Core-Mark Holding Co, Inc | | | 3,764 | |
| | 152,000 | | | e | | Courts Asia Ltd | | | 74 | |
| | 367,500 | | | e | | CST Brands, Inc | | | 13,495 | |
| | 395,750 | | | *,e | | Ctrip.com International Ltd (ADR) | | | 19,637 | |
| | 1,739,000 | | | e | | Dah Chong Hong Holdings Ltd | | | 1,304 | |
| | 318,900 | | | * | | Daiei, Inc | | | 1,056 | |
| | 1,040,707 | | | e | | David Jones Ltd | | | 2,813 | |
| | 260,500 | | | | | DCM Japan Holdings Co Ltd | | | 1,807 | |
| | 6,586,736 | | | | | Debenhams plc | | | 7,979 | |
| | 71,417 | | | | | Delek Automotive Systems Ltd | | | 772 | |
| | 6,250 | | | | | Delticom AG. | | | 276 | |
| | 49,725 | | | | | Destination Maternity Corp | | | 1,486 | |
| | 169,092 | | | * | | Destination XL Group, Inc | | | 1,111 | |
| | 142,621 | | | | | Dick’s Sporting Goods, Inc | | | 8,286 | |
| | 1,070,986 | | | | | Dickson Concepts International Ltd | | | 652 | |
| | 45,963 | | | | | Dieteren S.A. | | | 2,290 | |
| | 129,486 | | | | | Dillard’s, Inc (Class A) | | | 12,587 | |
| | 70,073 | | | | | Dogus Otomotiv Servis ve Ticaret AS | | | 219 | |
| | 473,031 | | | * | | Dollar General Corp | | | 28,533 | |
| | 311,881 | | | * | | Dollar Tree, Inc | | | 17,596 | |
| | 165,363 | | | | | Dollarama, Inc | | | 13,732 | |
| | 45,810 | | | | | Don Quijote Co Ltd | | | 2,777 | |
| | 24,500 | | | | | Doshisha Co Ltd | | | 345 | |
| | 4,390,421 | | | * | | DSG International plc | | | 3,528 | |
| | 550,304 | | | | | DSW, Inc (Class A) | | | 23,515 | |
| | 34,473 | | | * | | Dufry Group | | | 6,056 | |
| | 187,121 | | | | | Dunelm Group plc | | | 2,795 | |
| | 417,483 | | | e | | EDION Corp | | | 2,442 | |
| | 213,320 | | | e | | El Puerto de Liverpool SAB de C.V. | | | 2,436 | |
| | 270,000 | | | | | E-LIFE MALL Corp | | | 570 | |
| | 4,030,000 | | | e | | Emperor Watch & Jewellery Ltd | | | 307 | |
| | 431,675 | | | | | Empresas Hites S.A. | | | 304 | |
| | 2,519,857 | | | * | | Empresas La Polar S.A. | | | 328 | |
| | 3,708,000 | | | | | Esprit Holdings Ltd | | | 7,165 | |
| | 1,171,571 | | | | | Expedia, Inc | | | 81,612 | |
| | 540,991 | | | * | | Express Parent LLC | | | 10,100 | |
| | 139,293 | | | | | Family Dollar Stores, Inc | | | 9,050 | |
| | 948,715 | | | | | Far Eastern Department Stores Co Ltd | | | 940 | |
| | 49,289 | | | | | Fast Retailing Co Ltd | | | 20,357 | |
| | 212,452 | | | | | Finish Line, Inc (Class A) | | | 5,985 | |
| | 194,671 | | | *,e | | Five Below, Inc | | | 8,410 | |
| | 46,639 | | | * | | Folli Follie SA | | | 1,501 | |
| | 955,040 | | | | | Foot Locker, Inc | | | 39,577 | |
| | 229,110 | | | e | | Foschini Ltd | | | 2,095 | |
COLLEGE RETIREMENT EQUITIES FUND - Stock Account
| | | | | | | VALUE | |
| SHARES | | | | COMPANY | | (000) | |
| | 155,728 | | | *,e | | Francesca’s Holdings Corp | | $ | 2,867 | |
| | 142,111 | | | | | Fred’s, Inc (Class A) | | | 2,632 | |
| | 75,517 | | | *,e | | FTD Cos, Inc | | | 2,460 | |
| | 35,600 | | | | | Fuji Co Ltd | | | 607 | |
| | 1,702,241 | | | e | | GameStop Corp (Class A) | | | 83,852 | |
| | 1,525,873 | | | | | Gap, Inc | | | 59,631 | |
| | 106,923 | | | * | | Genesco, Inc | | | 7,812 | |
| | 333,709 | | | | | Genuine Parts Co | | | 27,761 | |
| | 58,800 | | | | | Geo Corp | | | 528 | |
| | 1,480,000 | | | e | | Giordano International Ltd | | | 1,324 | |
| | 759,465 | | | | | GNC Holdings, Inc | | | 44,391 | |
| | 14,183,600 | | | e | | Golden Eagle Retail Group Ltd | | | 18,777 | |
| | 464,000 | | | e | | Goldlion Holdings Ltd | | | 223 | |
| | 15,005,608 | | | e | | GOME Electrical Appliances Holdings Ltd | | | 2,775 | |
| | 30,678 | | | | | Gordmans Stores, Inc | | | 235 | |
| | 86,201 | | | | | Group 1 Automotive, Inc | | | 6,122 | |
| | 12,877 | | | * | | Groupe Fnac | | | 422 | |
| | 4,338,011 | | | *,e | | Groupon, Inc | | | 51,058 | |
| | 2,561,400 | | | * | | Grupo Famsa SAB de C.V. | | | 4,632 | |
| | 2,414 | | | | | GS Home Shopping, Inc | | | 702 | |
| | 4,097,000 | | | * | | GSH Corp Ltd | | | 263 | |
| | 69,183 | | | | | Guess?, Inc | | | 2,150 | |
| | 58,700 | | | | | Gulliver International Co Ltd | | | 327 | |
| | 1,048 | | | | | GwangjuShinsegae Co Ltd | | | 251 | |
| | 93,500 | | | | | Hai-O Enterprise BHD | | | 73 | |
| | 526,877 | | | | | Halfords Group plc | | | 3,906 | |
| | 153,825 | | | | | Hankyu Department Stores, Inc | | | 1,231 | |
| | 124,548 | | | e | | Harvey Norman Holdings Ltd | | | 352 | |
| | 70,925 | | | | | Haverty Furniture Cos, Inc | | | 2,220 | |
| | 18,272,400 | | | e | | Hengdeli Holdings Ltd | | | 4,318 | |
| | 992,508 | | | | | Hennes & Mauritz AB (B Shares) | | | 45,711 | |
| | 51,201 | | | *,e | | HHgregg, Inc | | | 715 | |
| | 88,043 | | | *,e | | Hibbett Sports, Inc | | | 5,917 | |
| | 8,198,187 | | | | | Home Depot, Inc | | | 675,039 | |
| | 2,870,317 | | | | | Home Product Center PCL | | | 821 | |
| | 1,956,409 | | | | | Home Retail Group | | | 6,231 | |
| | 502,527 | | | *,e | | HomeAway, Inc | | | 20,543 | |
| | 15,910 | | | e | | Honeys Co Ltd | | | 155 | |
| | 249,900 | | | | | Hotai Motor Co Ltd | | | 3,088 | |
| | 155,171 | | | | | HSN, Inc | | | 9,667 | |
| | 60,200 | | | e | | Hudson’s Bay Co | | | 1,016 | |
| | 17,695 | | | | | Hyundai Department Store Co Ltd | | | 2,706 | |
| | 70,180 | | | | | Hyundai H&S Co Ltd | | | 1,118 | |
| | 8,372 | | | | | Hyundai Home Shopping Network Corp | | | 1,478 | |
| | 198 | | | | | Ikyu | | | 281 | |
| | 415,541 | | | | | Imperial Holdings Ltd | | | 8,036 | |
| | 1,499,070 | | | | | Inchcape plc | | | 15,308 | |
| | 218,323 | | | | | Inditex S.A. | | | 36,048 | |
COLLEGE RETIREMENT EQUITIES FUND - Stock Account
| | | | | | | VALUE | |
| SHARES | | | | COMPANY | | (000) | |
| | 48,125 | | | | | Interpark Corp | | $ | 487 | |
| | 1,293,300 | | | * | | Intime Retail Group Co Ltd | | | 1,348 | |
| | 432,871 | | | | | Isetan Mitsukoshi Holdings Ltd | | | 6,162 | |
| | 578,000 | | | | | IT Ltd | | | 149 | |
| | 63,700 | | | | | Izumi Co Ltd | | | 1,996 | |
| | 2,970,366 | | | | | J Front Retailing Co Ltd | | | 22,534 | |
| | 88,480 | | | | | Jardine Cycle & Carriage Ltd | | | 2,528 | |
| | 306,552 | | | e | | JB Hi-Fi Ltd | | | 5,902 | |
| | 796,378 | | | *,e | | JC Penney Co, Inc | | | 7,287 | |
| | 102,990 | | | e | | JD Group Ltd | | | 285 | |
| | 31,600 | | | e | | Jin Co Ltd | | | 1,337 | |
| | 66,705 | | | | | John Menzies plc | | | 782 | |
| | 108,187 | | | * | | JOS A Bank Clothiers, Inc | | | 5,921 | |
| | 39,000 | | | | | Joshin Denki Co Ltd | | | 300 | |
| | 156,509 | | | * | | JUMBO S.A. | | | 2,496 | |
| | 126,289 | | | * | | KappAhl Holding AB | | | 744 | |
| | 433,035 | | | | | Kathmandu Holdings Ltd | | | 1,251 | |
| | 37,987 | | | e | | Keiyo Co Ltd | | | 169 | |
| | 830,102 | | | e | | Kesa Electricals plc | | | 1,627 | |
| | 3,507,665 | | | | | Kingfisher plc | | | 22,393 | |
| | 84,454 | | | * | | Kirkland’s, Inc | | | 1,999 | |
| | 280,884 | | | | | Kohl’s Corp | | | 15,940 | |
| | 39,900 | | | e | | Kohnan Shoji Co Ltd | | | 412 | |
| | 39,967 | | | | | Kolao Holdings | | | 1,026 | |
| | 38,300 | | | | | Komeri Co Ltd | | | 978 | |
| | 26,900 | | | | | Konaka Co Ltd | | | 240 | |
| | 60,263 | | | | | K’s Holdings Corp | | | 1,742 | |
| | 457,422 | | | | | L Brands, Inc | | | 28,292 | |
| | 13,722 | | | | | LES Enphants Co Ltd | | | 11 | |
| | 265,368 | | | e | | Lewis Group Ltd | | | 1,794 | |
| | 3,454,377 | | | e | | Li & Fung Ltd | | | 4,465 | |
| | 1,924,973 | | | * | | Liberty Interactive Corp | | | 56,498 | |
| | 169,279 | | | * | | Liberty Ventures | | | 20,752 | |
| | 1,793,000 | | | | | Lifestyle International Holdings Ltd | | | 3,320 | |
| | 90,119 | | | *,e | | Lifestyle Properties Development Ltd | | | 19 | |
| | 71,551 | | | | | Lithia Motors, Inc (Class A) | | | 4,967 | |
| | 544,062 | | | * | | LKQ Corp | | | 17,900 | |
| | 51,500 | | | | | Lojas Americanas S.A. | | | 299 | |
| | 445,563 | | | | | Lojas Americanas S.A.(Preference) | | | 2,971 | |
| | 139,150 | | | | | Lojas Renner S.A. | | | 3,607 | |
| | 532,357 | | | | | Lookers plc | | | 1,067 | |
| | 31,858 | | | | | Lotte Shopping Co Ltd | | | 12,204 | |
| | 2,249,407 | | | | | Lowe’s Companies, Inc | | | 111,458 | |
| | 896,000 | | | e | | Luk Fook Holdings International Ltd | | | 3,420 | |
| | 94,072 | | | *,e | | Lumber Liquidators, Inc | | | 9,679 | |
| | 3,492,314 | | | | | Macy’s, Inc | | | 186,490 | |
| | 244,500 | | | * | | Magazine Luiza S.A. | | | 784 | |
| | 1,211,000 | | | e | | Maoye International Holdings Ltd | | | 218 | |
COLLEGE RETIREMENT EQUITIES FUND - Stock Account
| | | | | | | VALUE | |
| SHARES | | | | COMPANY | | (000) | |
| | 81,978 | | | * | | MarineMax, Inc | | $ | 1,318 | |
| | 53,000 | | | | | Marisa Lojas S.A. | | | 418 | |
| | 872,918 | | | | | Marks & Spencer Group plc | | | 6,268 | |
| | 771,974 | | | | | Marui Co Ltd | | | 7,852 | |
| | 38,637 | | | * | | Matas A.S. | | | 1,069 | |
| | 37,800 | | | * | | Matsuya Co Ltd | | | 405 | |
| | 42,485 | | | *,e | | Mattress Firm Holding Corp | | | 1,829 | |
| | 412,300 | | | | | MBM Resources BHD | | | 404 | |
| | 34,541 | | | | | Mekonomen AB | | | 1,064 | |
| | 187,902 | | | | | Men’s Wearhouse, Inc | | | 9,598 | |
| | 898,465 | | | | | Mercuries & Associates Ltd | | | 637 | |
| | 2,123,696 | | | | | MFI Furniture plc | | | 12,151 | |
| | 66,672 | | | | | Mobilezone Holding AG. | | | 704 | |
| | 101,145 | | | e | | Monro Muffler, Inc | | | 5,701 | |
| | 115,134 | | | *,e | | Mothercare plc | | | 749 | |
| | 394,894 | | | | | Mr Price Group Ltd | | | 6,172 | |
| | 228,993 | | | * | | Murphy USA, Inc | | | 9,517 | |
| | 756,379 | | | e | | Myer Holdings Ltd | | | 1,863 | |
| | 185,224 | | | | | N Brown Group plc | | | 1,634 | |
| | 341,000 | | | | | National Petroleum Co Ltd | | | 334 | |
| | 276,537 | | | * | | NetFlix, Inc | | | 101,813 | |
| | 725,000 | | | | | New Carphone Warehouse plc | | | 3,259 | |
| | 1,033,000 | | | e | | New World Department Store China Ltd | | | 581 | |
| | 143,689 | | | * | | New York & Co, Inc | | | 628 | |
| | 528,926 | | | | | Next plc | | | 47,810 | |
| | 94,000 | | | | | Nice Holdings, Inc | | | 223 | |
| | 64,600 | | | | | Nishimatsuya Chain Co Ltd | | | 507 | |
| | 40,500 | | | e | | Nissen Holdings Co Ltd | | | 156 | |
| | 39,220 | | | | | Nitori Co Ltd | | | 3,713 | |
| | 710,810 | | | | | Nordstrom, Inc | | | 43,928 | |
| | 138,829 | | | e | | Nutri/System, Inc | | | 2,282 | |
| | 3,872,428 | | | * | | Ocado Ltd | | | 28,402 | |
| | 1,937,908 | | | * | | Office Depot, Inc | | | 10,252 | |
| | 110,000 | | | | | OfficeMate PCL | | | 99 | |
| | 350,589 | | | * | | Orbitz Worldwide, Inc | | | 2,517 | |
| | 508,188 | | | * | | O’Reilly Automotive, Inc | | | 65,409 | |
| | 12,859 | | | | | OrotonGroup Ltd | | | 51 | |
| | 870,000 | | | e | | OSIM International Ltd | | | 1,587 | |
| | 26,000 | | | | | Otsuka Kagu Ltd | | | 253 | |
| | 92,102 | | | *,e | | Outerwall, Inc | | | 6,196 | |
| | 105,284 | | | *,e | | Overstock.com, Inc | | | 3,242 | |
| | 1,311,285 | | | | | Pacific Brands Ltd | | | 752 | |
| | 122,980 | | | * | | Pacific Sunwear Of California, Inc | | | 411 | |
| | 402,200 | | | | | Padini Holdings BHD | | | 222 | |
| | 11,900 | | | | | Pal Co Ltd | | | 291 | |
| | 92,374 | | | | | Paltac Corp | | | 1,197 | |
| | 150,000 | | | * | | Pantaloon Retail India Ltd | | | 189 | |
| | 36,800 | | | | | Paris Miki, Inc | | | 169 | |
COLLEGE RETIREMENT EQUITIES FUND - Stock Account
| | | | | | | VALUE | |
| SHARES | | | | COMPANY | | (000) | |
| | 428,792 | | | | | Parkson Holdings BHD | | $ | 360 | |
| | 1,602,000 | | | | | Parkson Retail Asia Ltd | | | 1,231 | |
| | 1,425,000 | | | e | | Parkson Retail Group Ltd | | | 439 | |
| | 192,694 | | | * | | PC Jeweller Ltd | | | 267 | |
| | 188,331 | | | | | Penske Auto Group, Inc | | | 8,882 | |
| | 213,796 | | | * | | PEP Boys - Manny Moe & Jack | | | 2,595 | |
| | 63,935 | | | e | | PetMed Express, Inc | | | 1,063 | |
| | 704,067 | | | | | Petsmart, Inc | | | 51,221 | |
| | 340,117 | | | | | Pier 1 Imports, Inc | | | 7,850 | |
| | 16,910 | | | | | Point, Inc | | | 610 | |
| | 2,647,500 | | | * | | Pou Sheng International Holdings Ltd | | | 137 | |
| | 72,720 | | | | | Poya Co Ltd | | | 456 | |
| | 9,546 | | | | | PPR | | | 2,018 | |
| | 118,907 | | | | | Premier Investments Ltd | | | 873 | |
| | 244,306 | | | * | | Priceline.com, Inc | | | 283,981 | |
| | 11,798,500 | | | | | PT ACE Hardware Indonesia Tbk | | | 573 | |
| | 3,465,500 | | | * | | PT Matahari Department Store Tbk | | | 3,136 | |
| | 1,292,000 | | | | | PT Matahari Putra Prima Tbk | | | 207 | |
| | 1,112,000 | | | | | PT Mitra Adiperkasa Tbk | | | 503 | |
| | 3,258,000 | | | * | | PT Mitra Pinasthika Mustika Tbk | | | 344 | |
| | 8,255,500 | | | | | PT Multipolar Corp Tbk | | | 245 | |
| | 7,198,500 | | | | | PT Ramayana Lestari Sentosa Tbk | | | 628 | |
| | 5,312,000 | | | | | PT Tiphone Mobile Indonesia Tbk | | | 272 | |
| | 25,000 | | | *,e | | Qunar Cayman Islands Ltd (ADR) | | | 663 | |
| | 389,515 | | | *,e | | RadioShack Corp | | | 1,013 | |
| | 1,294,400 | | | | | Rakuten, Inc | | | 19,317 | |
| | 122,437 | | | | | Reitmans Canada Ltd | | | 784 | |
| | 32,834 | | | e | | Reject Shop Ltd | | | 508 | |
| | 207,131 | | | e | | Rent-A-Center, Inc | | | 6,906 | |
| | 204,859 | | | *,e | | Restoration Hardware Holdings, Inc | | | 13,787 | |
| | 46,150 | | | *,e | | RetailMeNot, Inc | | | 1,329 | |
| | 154,022 | | | | | RONA, Inc | | | 1,915 | |
| | 571,232 | | | | | Ross Stores, Inc | | | 42,802 | |
| | 26,500 | | | | | Ryohin Keikaku Co Ltd | | | 2,866 | |
| | 3,254,000 | | | | | SA SA International Holdings Ltd | | | 3,822 | |
| | 796,797 | | | | | SACI Falabella | | | 7,147 | |
| | 375,984 | | | * | | Sally Beauty Holdings, Inc | | | 11,366 | |
| | 86,949 | | | e | | Sanrio Co Ltd | | | 3,661 | |
| | 57,100 | | | e | | Sears Canada, Inc | | | 699 | |
| | 49,379 | | | *,e | | Sears Holdings Corp | | | 2,422 | |
| | 78,713 | | | * | | Sears Hometown and Outlet Stores, Inc | | | 2,007 | |
| | 208,477 | | | * | | Select Comfort Corp | | | 4,397 | |
| | 155,000 | | | | | Senao International Co Ltd | | | 484 | |
| | 72,200 | | | | | Senshukai Co Ltd | | | 604 | |
| | 26,129 | | | * | | Seobu Truck Terminal Co Ltd | | | 433 | |
| | 44,700 | | | | | Seria Co Ltd | | | 1,797 | |
| | 57,000 | | | | | Shimachu Co Ltd | | | 1,350 | |
| | 9,403 | | | | | Shimamura Co Ltd | | | 881 | |
COLLEGE RETIREMENT EQUITIES FUND - Stock Account
| | | | | | | VALUE | |
| SHARES | | | | COMPANY | | (000) | |
| | 11,833 | | | | | Shinsegae Co Ltd | | $ | 2,834 | |
| | 3,589 | | | | | Shinsegae International Co Ltd | | | 306 | |
| | 59,101 | | | | | Shoe Carnival, Inc | | | 1,715 | |
| | 132,637 | | | *,e | | Shutterfly, Inc | | | 6,755 | |
| | 1,025,700 | | | | | Siam Global House PCL | | | 496 | |
| | 1,057,000 | | | | | Sichuan Xinhua Winshare Chainstore Co Ltd | | | 582 | |
| | 294,819 | | | | | Signet Jewelers Ltd | | | 23,202 | |
| | 25,000 | | | | | Signet Jewelers Ltd (London) | | | 1,980 | |
| | 591,425 | | | e | | Silver base Group Holdings Ltd | | | 86 | |
| | 147,907 | | | e | | Sonic Automotive, Inc (Class A) | | | 3,621 | |
| | 749,174 | | | * | | Sports Direct International plc | | | 8,894 | |
| | 495,000 | | | | | Springland International Holdings Ltd | | | 255 | |
| | 130,031 | | | e | | Stage Stores, Inc | | | 2,889 | |
| | 4,230,110 | | | | | Staples, Inc | | | 67,216 | |
| | 112,200 | | | | | Start Today Co Ltd | | | 2,790 | |
| | 96,705 | | | | | Stein Mart, Inc | | | 1,301 | |
| | 327,000 | | | | | Stelux Holdings International | | | 114 | |
| | 69,258 | | | e | | Stockmann Oyj Abp (B Share) | | | 1,053 | |
| | 161,918 | | | | | Super Cheap Auto Group Ltd | | | 1,925 | |
| | 598,761 | | | * | | Super Group Ltd | | | 1,493 | |
| | 68,300 | | | * | | SuperGroup plc | | | 1,601 | |
| | 36,385 | | | * | | Systemax, Inc | | | 409 | |
| | 220,799 | | | | | Takashimaya Co Ltd | | | 2,203 | |
| | 26,978 | | | | | Takkt AG. | | | 501 | |
| | 1,418,279 | | | | | Target Corp | | | 89,735 | |
| | 76,100 | | | | | Telepark Corp | | | 858 | |
| | 7,754,865 | | | | | Test-Rite International Co | | | 5,785 | |
| | 158,856 | | | e | | Thorn Group Ltd | | | 308 | |
| | 98,473 | | | | | Tiffany & Co | | | 9,136 | |
| | 58,906 | | | *,e | | Tile Shop Holdings, Inc | | | 1,064 | |
| | 41,955 | | | * | | Tilly’s, Inc | | | 480 | |
| | 3,265,781 | | | | | TJX Companies, Inc | | | 208,128 | |
| | 7,100 | | | | | Tokyo Derica Co Ltd | | | 102 | |
| | 19,706 | | | * | | Tom Tailor Holding AG. | | | 447 | |
| | 451,969 | | | | | Tractor Supply Co | | | 35,064 | |
| | 900,224 | | | e | | Trade Me Ltd | | | 3,007 | |
| | 14,732 | | | * | | Trans World Entertainment Corp | | | 65 | |
| | 1,143 | | | | | Trent Ltd | | | 23 | |
| | 794,455 | | | *,e | | TripAdvisor, Inc | | | 65,805 | |
| | 518,574 | | | e | | Truworths International Ltd | | | 3,799 | |
| | 135,000 | | | | | Tsann Kuen Enterprise Co Ltd | �� | | 187 | |
| | 174,203 | | | | | Tsutsumi Jewelry Co Ltd | | | 4,053 | |
| | 165,878 | | | * | | Tuesday Morning Corp | | | 2,647 | |
| | 648,588 | | | * | | Ulta Salon Cosmetics & Fragrance, Inc | | | 62,602 | |
| | 138,299 | | | | | United Arrows Ltd | | | 5,175 | |
| | 1,847,283 | | | * | | Urban Outfitters, Inc | | | 68,534 | |
| | 335,890 | | | | | USS Co Ltd | | | 4,607 | |
| | 3,169 | | | | | Valora Holding AG. | | | 884 | |
COLLEGE RETIREMENT EQUITIES FUND - Stock Account
| | | | | | | VALUE | |
| SHARES | | | | COMPANY | | (000) | |
| | 163,767 | | | * | | Valuevision International, Inc (Class A) | | $ | 1,145 | |
| | 504,800 | | | * | | Via Varejo S.A. | | | 5,381 | |
| | 75,889 | | | *,e | | Vitacost.com, Inc | | | 439 | |
| | 134,563 | | | * | | Vitamin Shoppe, Inc | | | 6,999 | |
| | 28,300 | | | * | | VT Holdings Co Ltd | | | 466 | |
| | 148,214 | | | | | Warehouse Group Ltd | | | 456 | |
| | 63,389 | | | e | | Webjet Ltd | | | 180 | |
| | 62,914 | | | * | | West Marine, Inc | | | 895 | |
| | 300,906 | | | * | | Wet Seal, Inc (Class A) | | | 821 | |
| | 127,534 | | | * | | WEX, Inc | | | 12,630 | |
| | 597,747 | | | | | WH Smith plc | | | 9,926 | |
| | 398,291 | | | | | Williams-Sonoma, Inc | | | 23,212 | |
| | 8,923 | | | e | | Winmark Corp | | | 826 | |
| | 1,782,674 | | | | | Woolworths Holdings Ltd | | | 12,704 | |
| | 144,463 | | | * | | World Duty Free S.p.A | | | 1,816 | |
| | 157,290 | | | e | | Wotif.com Holdings Ltd | | | 389 | |
| | 27,300 | | | | | Xebio Co Ltd | | | 524 | |
| | 113,670 | | | | | Yamada Denki Co Ltd | | | 372 | |
| | 39,800 | | | | | Yellow Hat Ltd | | | 709 | |
| | 457,555 | | | * | | Yoox S.p.A | | | 20,515 | |
| | 121,002 | | | * | | Zale Corp | | | 1,908 | |
| | 696,900 | | | e | | Zhongsheng Group Holdings Ltd | | | 964 | |
| | 3,016 | | | * | | zooplus AG. | | | 216 | |
| | 12,716 | | | *,e | | zulily, Inc | | | 527 | |
| | 68,491 | | | * | | Zumiez, Inc | | | 1,781 | |
| | | | | | | TOTAL RETAILING | | | 5,048,679 | |
| | | | | | | | | | | |
| SEMICONDUCTORS & SEMICONDUCTOR EQUIPMENT - 2.2% | | | | |
| | 770,000 | | | | | A-DATA Technology Co Ltd | | | 1,820 | |
| | 181,748 | | | * | | Advanced Energy Industries, Inc | | | 4,155 | |
| | 1,022,733 | | | *,e | | Advanced Micro Devices, Inc | | | 3,958 | |
| | 32,439,668 | | | | | Advanced Semiconductor Engineering, Inc | | | 30,305 | |
| | 163,618 | | | e | | Advantest Corp | | | 2,039 | |
| | 122,322 | | | *,e | | Aixtron AG. | | | 1,775 | |
| | 544,000 | | | | | ALI Corp | | | 569 | |
| | 70,341 | | | * | | Alpha & Omega Semiconductor Ltd | | | 542 | |
| | 475,577 | | | | | Altera Corp | | | 15,471 | |
| | 91,452 | | | *,e | | Ambarella, Inc | | | 3,103 | |
| | 396,934 | | | *,e | | Amkor Technology, Inc | | | 2,433 | |
| | 319,606 | | | *,e | | Anadigics, Inc | | | 588 | |
| | 458,822 | | | | | Analog Devices, Inc | | | 23,368 | |
| | 6,333,528 | | | | | Applied Materials, Inc | | | 112,040 | |
| | 716,770 | | | * | | Applied Micro Circuits Corp | | | 9,590 | |
| | 442,503 | | | | | Ardentec Corp | | | 325 | |
| | 3,969,603 | | | | | ARM Holdings plc | | | 72,179 | |
| | 175,784 | | | | | ARM Holdings plc (ADR) | | | 9,622 | |
| | 17,637 | | | * | | Asia Pacific Systems, Inc | | | 165 | |
COLLEGE RETIREMENT EQUITIES FUND - Stock Account
| | | | | | | VALUE | |
| SHARES | | | | COMPANY | | (000) | |
| | 119,108 | | | | | ASM International NV | | $ | 3,928 | |
| | 224,423 | | | e | | ASM Pacific Technology | | | 1,878 | |
| | 820,731 | | | | | ASML Holding NV | | | 76,871 | |
| | 734,828 | | | * | | Atmel Corp | | | 5,754 | |
| | 125,136 | | | * | | ATMI, Inc | | | 3,780 | |
| | 50,764 | | | * | | Atto Co Ltd | | | 414 | |
| | 42,445 | | | | | Austriamicrosystems AG. | | | 5,139 | |
| | 2,077,327 | | | | | Avago Technologies Ltd | | | 109,870 | |
| | 435,944 | | | * | | Axcelis Technologies, Inc | | | 1,064 | |
| | 6,700 | | | e | | Axell Corp | | | 114 | |
| | 76,643 | | | | | BE Semiconductor Industries NV | | | 866 | |
| | 3,013,039 | | | | | Broadcom Corp (Class A) | | | 89,337 | |
| | 267,961 | | | | | Brooks Automation, Inc | | | 2,811 | |
| | 87,074 | | | * | | Cabot Microelectronics Corp | | | 3,979 | |
| | 57,827 | | | | | Capella Microsystems Taiwan, Inc | | | 224 | |
| | 231,451 | | | * | | Cavium Networks, Inc | | | 7,987 | |
| | 85,824 | | | * | | Ceva, Inc | | | 1,306 | |
| | 11,538 | | | *,e,m | | China Energy Savings Technology, Inc | | | 0 | ^ |
| | 1,760,000 | | | * | | China Ruifeng Renewable Energy Holdings Ltd | | | 468 | |
| | 857,000 | | | | | Chipbond Technology Corp | | | 1,352 | |
| | 102,000 | | | | | ChipMOS TECHNOLOGIES Bermuda Ltd | | | 1,962 | |
| | 333,543 | | | *,e | | Cirrus Logic, Inc | | | 6,814 | |
| | 101,656 | | | | | Cohu, Inc | | | 1,067 | |
| | 498,512 | | | *,e | | Cree, Inc | | | 31,192 | |
| | 657,497 | | | | | CSR plc | | | 6,893 | |
| | 549,029 | | | e | | Cypress Semiconductor Corp | | | 5,765 | |
| | 25,530 | | | * | | D.I Corp | | | 244 | |
| | 245,616 | | | * | | Dainippon Screen Manufacturing Co Ltd | | | 1,392 | |
| | 76,654 | | | *,e | | Dialog Semiconductor plc | | | 1,653 | |
| | 123,043 | | | * | | Diodes, Inc | | | 2,899 | |
| | 39,172 | | | e | | Disco Corp | | | 2,600 | |
| | 28,380 | | | * | | Dongbu HiTek Co Ltd | | | 203 | |
| | 80,624 | | | * | | DSP Group, Inc | | | 783 | |
| | 20,687 | | | * | | Duksan Hi-Metal Co Ltd | | | 373 | |
| | 488,000 | | | | | Elan Microelectronics Corp | | | 769 | |
| | 252,000 | | | | | Elite Semiconductor Memory Technology, Inc | | | 304 | |
| | 209,571 | | | | | eMemory Technology, Inc | | | 556 | |
| | 553,354 | | | * | | Entegris, Inc | | | 6,419 | |
| | 328,527 | | | *,e | | Entropic Communications, Inc | | | 1,547 | |
| | 13,875 | | | | | Eo Technics Co Ltd | | | 544 | |
| | 2,320,578 | | | | | Epistar Corp | | | 4,477 | |
| | 438,167 | | | * | | E-Ton Solar Tech Co Ltd | | | 268 | |
| | 18,565 | | | | | Eugene Technology Co Ltd | | | 296 | |
| | 444,000 | | | | | Everlight Electronics Co Ltd | | | 1,023 | |
| | 122,318 | | | * | | Exar Corp | | | 1,442 | |
| | 42,769 | | | * | | EZchip Semiconductor Ltd | | | 1,066 | |
| | 170,042 | | | * | | Fairchild Semiconductor International, Inc | | | 2,270 | |
| | 416,101 | | | | | Faraday Technology Corp | | | 584 | |
COLLEGE RETIREMENT EQUITIES FUND - Stock Account
| | | | | | | VALUE | |
| SHARES | | | | COMPANY | | (000) | |
| | 136,455 | | | *,e | | First Solar, Inc | | $ | 7,456 | |
| | 878,000 | | | | | Forhouse Corp | | | 333 | |
| | 207,067 | | | * | | Formfactor, Inc | | | 1,247 | |
| | 353,000 | | | | | Formosa Advanced Technologies Co Ltd | | | 205 | |
| | 523,000 | | | * | | Formosa Epitaxy, Inc | | | 300 | |
| | 2,136,569 | | | *,e | | Freescale Semiconductor Holdings Ltd | | | 34,292 | |
| | 19,752,800 | | | *,e | | GCL Poly Energy Holdings Ltd | | | 6,141 | |
| | 29,927 | | | * | | GemVax & Kael Co Ltd | | | 337 | |
| | 382,819 | | | * | | Genesis Photonics, Inc | | | 210 | |
| | 30,072 | | | | | Giga Solar Materials Corp | | | 485 | |
| | 446,850 | | | * | | Gintech Energy Corp | | | 511 | |
| | 172,000 | | | | | Global Mixed Mode Technology, Inc | | | 483 | |
| | 117,000 | | | | | Global Unichip Corp | | | 291 | |
| | 211,100 | | | | | Globetronics Technology BHD | | | 205 | |
| | 5,922,000 | | | *,e | | Goldpoly New Energy Holdings Ltd | | | 1,163 | |
| | 427,000 | | | | | Greatek Electronics, Inc | | | 395 | |
| | 194,561 | | | * | | Green Energy Technology, Inc | | | 206 | |
| | 83,707 | | | * | | GSI Technology, Inc | | | 556 | |
| | 430,714 | | | *,e | | GT Solar International, Inc | | | 3,756 | |
| | 995,700 | | | | | Hana Microelectronics PCL (Foreign) | | | 765 | |
| | 12,200,000 | | | *,e,m | | Hanergy Solar Group Ltd | | | 1,243 | |
| | 74,950 | | | | | Hanmi Semiconductor Co Ltd | | | 797 | |
| | 12,651 | | | * | | Hansol LCD, Inc | | | 249 | |
| | 35,600 | | | | | Hermes Microvision, Inc | | | 1,159 | |
| | 112,922 | | | * | | Hittite Microwave Corp | | | 6,971 | |
| | 458,000 | | | | | Holtek Semiconductor, Inc | | | 732 | |
| | 1,352,850 | | | * | | Hynix Semiconductor, Inc | | | 47,319 | |
| | 14,602 | | | * | | ICD Co Ltd | | | 142 | |
| | 24,010 | | | | | Iljin Display Co Ltd | | | 356 | |
| | 247,620 | | | *,e | | Imagination Technologies Group plc | | | 732 | |
| | 1,496,849 | | | | | Infineon Technologies AG. | | | 15,989 | |
| | 11,888 | | | * | | Innox Corp | | | 248 | |
| | 8,004,000 | | | * | | Inotera Memories, Inc | | | 5,932 | |
| | 91,213 | | | *,e | | Inphi Corp | | | 1,177 | |
| | 493,227 | | | * | | Integrated Device Technology, Inc | | | 5,026 | |
| | 68,175 | | | | | Integrated Memory Logic Ltd | | | 149 | |
| | 109,372 | | | * | | Integrated Silicon Solution, Inc | | | 1,322 | |
| | 15,046,172 | | | | | Intel Corp | | | 390,599 | |
| | 63,354 | | | * | | Intermolecular, Inc | | | 312 | |
| | 665,046 | | | * | | International Rectifier Corp | | | 17,338 | |
| | 487,936 | | | | | Intersil Corp (Class A) | | | 5,597 | |
| | 635,648 | | | * | | IQE plc | | | 247 | |
| | 97,040 | | | | | IXYS Corp | | | 1,259 | |
| | 346,164 | | | *,e | | JinkoSolar Holding Co Ltd (ADR) | | | 10,143 | |
| | 37,876 | | | * | | Jusung Engineering Co Ltd | | | 202 | |
| | 1,669,000 | | | | | King Yuan Electronics Co Ltd | | | 1,149 | |
| | 276,769 | | | | | Kinsus Interconnect Technology Corp | | | 920 | |
| | 440,650 | | | | | Kla-Tencor Corp | | | 28,404 | |
COLLEGE RETIREMENT EQUITIES FUND - Stock Account
| | | | | | | VALUE | |
| SHARES | | | | COMPANY | | (000) | |
| | 13,885 | | | | | Koh Young Technology, Inc | | $ | 368 | |
| | 71,130 | | | | | Kontron AG. | | | 510 | |
| | 267,090 | | | * | | Kopin Corp | | | 1,127 | |
| | 103,820 | | | * | | Kulicke & Soffa Industries, Inc | | | 1,381 | |
| | 1,786,938 | | | * | | Lam Research Corp | | | 97,299 | |
| | 414,781 | | | * | | Lattice Semiconductor Corp | | | 2,285 | |
| | 16,892 | | | | | LEENO Industrial Inc | | | 373 | |
| | 292,726 | | | | | Lextar Electronics Corp | | | 309 | |
| | 1,580,961 | | | | | Linear Technology Corp | | | 72,013 | |
| | 142,000 | | | | | Lingsen Precision Industries Ltd | | | 77 | |
| | 655,000 | | | | | Lite-On Semiconductor Corp | | | 426 | |
| | 782,875 | | | | | LSI Logic Corp | | | 8,627 | |
| | 171,896 | | | * | | LTX-Credence Corp | | | 1,373 | |
| | 26,366 | | | * | | Lumens Co Ltd | | | 253 | |
| | 49,590 | | | * | | MA-COM Technology Solutions | | | 843 | |
| | 4,930,400 | | | * | | Macronix International | | | 1,111 | |
| | 2,721,387 | | | | | Marvell Technology Group Ltd | | | 39,134 | |
| | 489,520 | | | | | Maxim Integrated Products, Inc | | | 13,662 | |
| | 113,699 | | | *,e | | MaxLinear, Inc | | | 1,186 | |
| | 4,002,166 | | | | | MediaTek, Inc | | | 59,652 | |
| | 76,600 | | | | | Megachips Corp | | | 1,172 | |
| | 51,685 | | | | | Melexis NV | | | 1,649 | |
| | 13,057 | | | | | Melfas, Inc | | | 120 | |
| | 154,490 | | | | | Micrel, Inc | | | 1,525 | |
| | 733,373 | | | e | | Microchip Technology, Inc | | | 32,818 | |
| | 4,225,860 | | | * | | Micron Technology, Inc | | | 91,955 | |
| | 43,259 | | | | | Micronas Semiconductor Holdings, Inc | | | 341 | |
| | 423,083 | | | * | | Microsemi Corp | | | 10,556 | |
| | 21,900 | | | | | Mimasu Semiconductor Industry Co Ltd | | | 187 | |
| | 75,788 | | | | | Mitsui High-Tec, Inc | | | 561 | |
| | 210,292 | | | | | MKS Instruments, Inc | | | 6,296 | |
| | 122,132 | | | * | | Monolithic Power Systems, Inc | | | 4,233 | |
| | 171,187 | | | *,e | | MoSys, Inc | | | 945 | |
| | 452,000 | | | * | | Motech Industries, Inc | | | 931 | |
| | 195,199 | | | | | MStar Semiconductor, Inc | | | 2,275 | |
| | 79,697 | | | * | | Nanometrics, Inc | | | 1,518 | |
| | 673,484 | | | * | | Neo Solar Power Corp | | | 998 | |
| | 81,496 | | | * | | NeoPhotonics Corp Ltd | | | 575 | |
| | 16,406 | | | | | NEPES Corp | | | 105 | |
| | 177,710 | | | * | | Nexolon Co Ltd | | | 144 | |
| | 144,739 | | | *,e | | Nordic Semiconductor ASA | | | 661 | |
| | 1,103,126 | | | | | Novatek Microelectronics Corp Ltd | | | 4,526 | |
| | 4,200 | | | | | Nuflare Technology, Inc | | | 525 | |
| | 21,852 | | | *,e | | NVE Corp | | | 1,274 | |
| | 1,874,510 | | | | | Nvidia Corp | | | 30,030 | |
| | 1,922,396 | | | * | | NXP Semiconductors NV | | | 88,296 | |
| | 208,278 | | | * | | Omnivision Technologies, Inc | | | 3,582 | |
| | 4,354,734 | | | * | | ON Semiconductor Corp | | | 35,883 | |
COLLEGE RETIREMENT EQUITIES FUND - Stock Account
| | | | | | | | VALUE | |
| SHARES | | | | | COMPANY | | (000) | |
| | 1,366,000 | | | | | Opto Technology Corp | | $ | 584 | |
| | 129,000 | | | | | Orise Technology Co Ltd | | | 193 | |
| | 57,401 | | | | | Parade Technologies Ltd | | | 450 | |
| | 77,039 | | | * | | PDF Solutions, Inc | | | 1,974 | |
| | 80,258 | | | *,e | | Peregrine Semiconductor Corp | | | 595 | |
| | 89,097 | | | * | | Pericom Semiconductor Corp | | | 789 | |
| | 131,247 | | | | | Phison Electronics Corp | | | 840 | |
| | 232,115 | | | * | | Photronics, Inc | | | 2,096 | |
| | 132,613 | | | | | Pixart Imaging, Inc | | | 224 | |
| | 136,652 | | | * | | PLX Technology, Inc | | | 899 | |
| | 1,103,541 | | | * | | PMC - Sierra, Inc | | | 7,096 | |
| | 124,317 | | | | | Power Integrations, Inc | | | 6,939 | |
| | 710,525 | | | | | Powertech Technology, Inc | | | 1,087 | |
| | 2,807,255 | | | | | Radiant Opto-Electronics Corp | | | 10,298 | |
| | 357,660 | | | * | | Rambus, Inc | | | 3,387 | |
| | 498,240 | | | | | Realtek Semiconductor Corp | | | 1,341 | |
| | 1,529,000 | | | | | Regent Manner International Ltd | | | 267 | |
| | 2,163,385 | | | *,e | | Renewable Energy Corp AS | | | 877 | |
| | 1,659,093 | | | * | | RF Micro Devices, Inc | | | 8,561 | |
| | 212,200 | | | | | Richtek Technology Corp | | | 992 | |
| | 261,078 | | | | | Rohm Co Ltd | | | 12,735 | |
| | 65,747 | | | *,e | | Rubicon Technology, Inc | | | 654 | |
| | 118,009 | | | * | | Rudolph Technologies, Inc | | | 1,385 | |
| | 199,095 | | | | | Samsung Electronics Co Ltd | | | 259,430 | |
| | 31,773 | | | | | Samsung Electronics Co Ltd (Preference) | | | 30,556 | |
| | 133,000 | | | | | Sanken Electric Co Ltd | | | 980 | |
| | 25,890,000 | | | *,e | | Semiconductor Manufacturing International | | | 2,047 | |
| | 937,660 | | | * | | Semtech Corp | | | 23,704 | |
| | 489,753 | | | | | Seoul Semiconductor Co Ltd | | | 18,813 | |
| | 236,000 | | | | | Shindengen Electric Manufacturing Co Ltd | | | 1,439 | |
| | 269,621 | | | | | Shinko Electric Industries | | | 2,244 | |
| | 800,000 | | | * | | Shunfeng Photovoltaic International Ltd | | | 639 | |
| | 128,089 | | | * | | Sigma Designs, Inc | | | 605 | |
| | 30,680 | | | * | | Signetics Corp | | | 62 | |
| | 233,000 | | | | | Sigurd Microelectronics Corp | | | 223 | |
| | 158,190 | | | * | | Silex Systems Ltd | | | 325 | |
| | 317,491 | | | * | | Silicon Image, Inc | | | 1,953 | |
| | 1,350,000 | | | * | | Silicon Integrated Systems Corp | | | 404 | |
| | 68,216 | | | * | | Silicon Laboratories, Inc | | | 2,954 | |
| | 56,655 | | | | | Silicon Works Co Ltd | | | 1,292 | |
| | 3,120,631 | | | | | Siliconware Precision Industries Co | | | 3,728 | |
| | 22,203 | | | | | Simm Tech Co Ltd | | | 137 | |
| | 669,000 | | | * | | Sino-American Silicon Products, Inc | | | 1,141 | |
| | 153,000 | | | | | Sitronix Technology Corp | | | 237 | |
| | 443,376 | | | * | | Skyworks Solutions, Inc | | | 12,663 | |
| | 11,413 | | | | | SMA Solar Technology AG. | | | 362 | |
| | 186,140 | | | *,e | | SOITEC | | | 365 | |
| | 3,106,665 | | | * | | Solargiga Energy Holdings Ltd | | | 155 | |
COLLEGE RETIREMENT EQUITIES FUND - Stock Account
| | | | | | | | VALUE | |
| SHARES | | | | | COMPANY | | (000) | |
| | 284,450 | | | * | | Solartech Energy Corp | | $ | 274 | |
| | 401,000 | | | | | Sonix Technology Co Ltd | | | 573 | |
| | 184,374 | | | * | | Spansion, Inc | | | 2,561 | |
| | 1,094,711 | | | e | | STMicroelectronics NV | | | 8,788 | |
| | 37,592 | | | * | | STS Semiconductor & Telecommunications | | | 123 | |
| | 14,361 | | | | | Sumco Corp | | | 127 | |
| | 949,272 | | | * | | SunEdison, Inc | | | 12,388 | |
| | 1,407,000 | | | * | | Sunplus Technology Co Ltd | | | 542 | |
| | 566,458 | | | *,e | | SunPower Corp | | | 16,886 | |
| | 39,998 | | | * | | Supertex, Inc | | | 1,002 | |
| | 1,034,100 | | | * | | SVI PCL | | | 130 | |
| | 42,667,860 | | | | | Taiwan Semiconductor Manufacturing Co Ltd | | | 150,658 | |
| | 708,367 | | | | | Taiwan Surface Mounting Technology Co Ltd | | | 1,072 | |
| | 260,528 | | | *,e | | Teradyne, Inc | | | 4,590 | |
| | 209,205 | | | | | Tessera Technologies, Inc | | | 4,123 | |
| | 2,500,367 | | | | | Texas Instruments, Inc | | | 109,791 | |
| | 30,661 | | | * | | Theragen Etex Co Ltd | | | 180 | |
| | 276,790 | | | | | Tokyo Electron Ltd | | | 15,252 | |
| | 43,300 | | | | | Tokyo Seimitsu Co Ltd | | | 913 | |
| | 551,620 | | | | | Topco Scientific Co Ltd | | | 1,104 | |
| | 8,696 | | | * | | Toptec Co Ltd | | | 116 | |
| | 1 | | | * | | Tower Semiconductor Ltd | | | 0 | ^ |
| | 152,608 | | | | | Transcend Information, Inc | | | 439 | |
| | 628,930 | | | * | | Triquint Semiconductor, Inc | | | 5,245 | |
| | 1,746,000 | | | *,m | | Trony Solar Holdings Co Ltd. | | | 2 | |
| | 18,613 | | | | | U-Blox AG. | | | 2,007 | |
| | 50,700 | | | | | Ubright Optronics Corp | | | 123 | |
| | 10,200 | | | | | UKC Holdings Corp | | | 168 | |
| | 94,754 | | | * | | Ultra Clean Holdings | | | 950 | |
| | 114,635 | | | * | | Ultratech, Inc | | | 3,324 | |
| | 65,300 | | | * | | Ulvac, Inc | | | 863 | |
| | 1,325,000 | | | | | Unisem M BHD | | | 405 | |
| | 21,534,822 | | | | | United Microelectronics Corp | | | 8,995 | |
| | 408,029 | | | | | Unity Opto Technology Co Ltd | | | 410 | |
| | 698,000 | | | | | Vanguard International Semiconductor Corp | | | 831 | |
| | 147,497 | | | * | | Veeco Instruments, Inc | | | 4,854 | |
| | 413,500 | | | * | | Via Technologies, Inc | | | 389 | |
| | 321,425 | | | | | Visual Photonics Epitaxy Co Ltd | | | 328 | |
| | 298,833 | | | * | | Wafer Works Corp | | | 167 | |
| | 429,000 | | | * | | Walton Advanced Engineering, Inc | | | 154 | |
| | 754,737 | | | | | Win Semiconductors Corp | | | 704 | |
| | 3,587,000 | | | * | | Winbond Electronics Corp | | | 966 | |
| | 1,825,777 | | | | | Xilinx, Inc | | | 83,840 | |
| | 8,192,785 | | | *,e | | Xinyi Solar Holdings Ltd | | | 1,690 | |
| | 101,313 | | | | | Youngtek Electronics Corp | | | 206 | |
| | | | | | | TOTAL SEMICONDUCTORS & SEMICONDUCTOR EQUIPMENT | | | 2,806,308 | |
COLLEGE RETIREMENT EQUITIES FUND - Stock Account
| | | | | | | | VALUE | |
| SHARES | | | | | COMPANY | | (000) | |
| SOFTWARE & SERVICES - 7.9% | | | | |
| | 217,278 | | | * | | Accelrys, Inc | | $ | 2,073 | |
| | 2,816,368 | | | | | Accenture plc | | | 231,562 | |
| | 40,400 | | | *,e | | Access Co Ltd | | | 269 | |
| | 127,415 | | | * | | ACI Worldwide, Inc | | | 8,282 | |
| | 507,689 | | | | | Activision Blizzard, Inc | | | 9,052 | |
| | 6,394 | | | * | | Actoz Soft Co Ltd | | | 176 | |
| | 197,775 | | | * | | Actuate Corp | | | 1,525 | |
| | 280,139 | | | * | | Acxiom Corp | | | 10,360 | |
| | 1,898,928 | | | * | | Adobe Systems, Inc | | | 113,708 | |
| | 130,581 | | | | | Advent Software, Inc | | | 4,569 | |
| | 6,000,000 | | | * | | AGTech Holdings Ltd | | | 916 | |
| | 9,267 | | | | | Ahnlab, Inc | | | 540 | |
| | 391,771 | | | * | | Akamai Technologies, Inc | | | 18,484 | |
| | 612,294 | | | *,e | | Alliance Data Systems Corp | | | 160,990 | |
| | 287,347 | | | | | Alpha Systems, Inc | | | 4,087 | |
| | 30,008 | | | | | Alten | | | 1,362 | |
| | 172,504 | | | | | Altran Technologies S.A. | | | 1,513 | |
| | 973,393 | | | | | Amadeus IT Holding S.A. | | | 41,696 | |
| | 589,160 | | | | | Amdocs Ltd | | | 24,297 | |
| | 76,179 | | | | | American Software, Inc (Class A) | | | 752 | |
| | 146,641 | | | *,e | | Angie’s List, Inc | | | 2,222 | |
| | 627,961 | | | | | Anite plc | | | 1,031 | |
| | 216,732 | | | * | | Ansys, Inc | | | 18,899 | |
| | 316,324 | | | * | | AOL, Inc | | | 14,747 | |
| | 1,100,000 | | | * | | ASG Group Ltd | | | 403 | |
| | 548,886 | | | * | | Aspen Technology, Inc | | | 22,943 | |
| | 122,836 | | | | | Asseco Poland S.A. | | | 1,870 | |
| | 391,703 | | | | | Atos Origin S.A. | | | 35,490 | |
| | 744,506 | | | * | | Autodesk, Inc | | | 37,471 | |
| | 1,322,798 | | | | | Automatic Data Processing, Inc | | | 106,895 | |
| | 206,762 | | | | | Aveva Group plc | | | 7,422 | |
| | 139,423 | | | *,e | | AVG Technologies NV | | | 2,399 | |
| | 8,810 | | | | | Axway Software S.A. | | | 264 | |
| | 31,764 | | | | | Babylon Ltd | | | 74 | |
| | 185,776 | | | * | | Bankrate, Inc | | | 3,333 | |
| | 10,977 | | | *,e | | Barracuda Networks, Inc | | | 436 | |
| | 166,577 | | | *,e | | Bazaarvoice, Inc | | | 1,319 | |
| | 37,612 | | | | | Bechtle AG. | | | 2,564 | |
| | 16,490 | | | *,e | | Benefitfocus, Inc | | | 952 | |
| | 17,800 | | | e | | Bit-isle, Inc | | | 141 | |
| | 149,505 | | | | | Blackbaud, Inc | | | 5,629 | |
| | 43,553 | | | *,e | | Blackhawk Network Holdings, Inc | | | 1,100 | |
| | 388,457 | | | *,e | | Blinkx plc | | | 1,321 | |
| | 143,280 | | | * | | Blucora, Inc | | | 4,178 | |
| | 69,183 | | | | | Booz Allen Hamilton Holding Co | | | 1,325 | |
| | 124,619 | | | * | | Bottomline Technologies, Inc | | | 4,506 | |
COLLEGE RETIREMENT EQUITIES FUND - Stock Account
| | | | | | | | VALUE | |
| SHARES | | | | | COMPANY | | (000) | |
| | 117,087 | | | * | | Brightcove, Inc | | $ | 1,656 | |
| | 27,800 | | | * | | Broadleaf Co Ltd | | | 513 | |
| | 374,655 | | | | | Broadridge Financial Solutions, Inc | | | 14,806 | |
| | 89,605 | | | * | | BroadSoft, Inc | | | 2,450 | |
| | 1,087,594 | | | | | CA, Inc | | | 36,598 | |
| | 90,900 | | | *,e | | CACI International, Inc (Class A) | | | 6,656 | |
| | 625,995 | | | * | | Cadence Design Systems, Inc | | | 8,776 | |
| | 119,960 | | | * | | Callidus Software, Inc | | | 1,647 | |
| | 13,807 | | | | | CANCOM SE | | | 584 | |
| | 448,089 | | | | | Cap Gemini S.A. | | | 30,329 | |
| | 52,086 | | | | | Capcom Co Ltd | | | 934 | |
| | 45,297 | | | * | | Carbonite, Inc | | | 536 | |
| | 215,551 | | | * | | Cardtronics, Inc | | | 9,366 | |
| | 241,240 | | | | | carsales.com.au Ltd | | | 2,201 | |
| | 33,157 | | | e | | Cass Information Systems, Inc | | | 2,233 | |
| | 60,713 | | | * | | CD Projekt Red S.A. | | | 353 | |
| | 14,554 | | | | | Cegid Group | | | 514 | |
| | 357,604 | | | * | | CGI Group, Inc | | | 11,964 | |
| | 41,502 | | | *,e | | ChannelAdvisor Corp | | | 1,731 | |
| | 44,121 | | | *,e | | Chegg, Inc | | | 375 | |
| | 10,028,000 | | | * | | China Public Procurement Ltd | | | 525 | |
| | 1,420,000 | | | *,e | | Chinasoft International Ltd | | | 369 | |
| | 25,000 | | | | | Chinese Gamer International Corp | | | 44 | |
| | 275,686 | | | * | | Ciber, Inc | | | 1,141 | |
| | 848,473 | | | * | | Citrix Systems, Inc | | | 53,666 | |
| | 910,793 | | | * | | Cognizant Technology Solutions Corp (Class A) | | | 91,972 | |
| | 59,300 | | | *,e | | COLOPL, Inc | | | 1,670 | |
| | 6,994 | | | * | | Com2uSCorp | | | 167 | |
| | 204,399 | | | * | | Commvault Systems, Inc | | | 15,305 | |
| | 754,244 | | | | | Companhia Brasileira de Meios de Pagamento | | | 20,891 | |
| | 164,300 | | | | | Computacenter plc | | | 1,739 | |
| | 791,943 | | | | | Computer Sciences Corp | | | 44,254 | |
| | 47,447 | | | | | Computer Task Group, Inc | | | 897 | |
| | 656,766 | | | | | Computershare Ltd | | | 6,693 | |
| | 1,617,777 | | | | | Compuware Corp | | | 18,135 | |
| | 203,407 | | | * | | comScore, Inc | | | 5,819 | |
| | 93,930 | | | * | | Comverse, Inc | | | 3,645 | |
| | 103,308 | | | *,e | | Concur Technologies, Inc | | | 10,659 | |
| | 99,008 | | | *,e | | Constant Contact, Inc | | | 3,076 | |
| | 35,833 | | | | | Constellation Software, Inc | | | 7,590 | |
| | 403,524 | | | | | Convergys Corp | | | 8,494 | |
| | 137,256 | | | * | | Cornerstone OnDemand, Inc | | | 7,321 | |
| | 97,935 | | | * | | CoStar Group, Inc | | | 18,077 | |
| | 19,206 | | | * | | Covisint Corp | | | 241 | |
| | 8,647 | | | * | | Criteo S.A. (ADR) | | | 296 | |
| | 6,100 | | | e | | CROOZ, Inc | | | 240 | |
| | 1,077,869 | | | e | | CSE Global Ltd | | | 655 | |
| | 128,377 | | | | | CSG Systems International, Inc | | | 3,774 | |
COLLEGE RETIREMENT EQUITIES FUND - Stock Account
| | | | | | | | VALUE | |
| SHARES | | | | | COMPANY | | (000) | |
| | 32,113 | | | *,e | | Cvent, Inc | | $ | 1,169 | |
| | 31,433 | | | *,e | | Cyan, Inc | | | 166 | |
| | 164,567 | | | | | Cyberlink Corp | | | 470 | |
| | 15,785 | | | * | | Danal Co Ltd | | | 141 | |
| | 38,050 | | | | | Daou Technology, Inc | | | 548 | |
| | 51,717 | | | | | Dassault Systemes S.A. | | | 6,420 | |
| | 17,205 | | | | | Daum Communications | | | 1,371 | |
| | 115,516 | | | e | | Davis & Henderson Income Fund | | | 3,240 | |
| | 143,940 | | | * | | DealerTrack Holdings, Inc | | | 6,921 | |
| | 146,507 | | | *,e | | Demand Media, Inc | | | 845 | |
| | 56,807 | | | * | | Demandware, Inc | | | 3,642 | |
| | 827,566 | | | e | | Dena Co Ltd | | | 17,445 | |
| | 128,919 | | | *,e | | Dice Holdings, Inc | | | 935 | |
| | 40,200 | | | | | Digital Garage, Inc | | | 1,047 | |
| | 140,921 | | | * | | Digital River, Inc | | | 2,607 | |
| | 75,169 | | | *,e | | Diligent Board Member Services | | | 235 | |
| | 22,950 | | | | | DMRC Corp | | | 442 | |
| | 205,466 | | | | | DST Systems, Inc | | | 18,644 | |
| | 21,500 | | | | | DTS Corp | | | 378 | |
| | 11,080 | | | | | DuzonBIzon Co Ltd | | | 118 | |
| | 36,100 | | | e | | Dwango Co Ltd | | | 937 | |
| | 48,698 | | | *,e | | E2open, Inc | | | 1,164 | |
| | 405,131 | | | | | Earthlink, Inc | | | 2,054 | |
| | 5,085,081 | | | * | | eBay, Inc | | | 279,120 | |
| | 12,147 | | | e | | Ebix, Inc | | | 179 | |
| | 98,959 | | | e | | Econocom Group | | | 1,130 | |
| | 102,970 | | | * | | eGain Corp | | | 1,054 | |
| | 782,154 | | | * | | Electronic Arts, Inc | | | 17,943 | |
| | 150,190 | | | *,e | | Ellie Mae, Inc | | | 4,036 | |
| | 169,020 | | | | | Ementor ASA | | | 1,667 | |
| | 67,599 | | | * | | Endurance International Group Holdings, Inc | | | 959 | |
| | 11,336 | | | | | Engineering Ingegneria Informatica S.p.A. | | | 678 | |
| | 113,941 | | | * | | Envestnet, Inc | | | 4,592 | |
| | 118,601 | | | | | EOH Holdings Ltd | | | 910 | |
| | 75,391 | | | * | | EPAM Systems, Inc | | | 2,634 | |
| | 124,062 | | | | | EPIQ Systems, Inc | | | 2,011 | |
| | 15,048 | | | * | | ePlus, Inc | | | 855 | |
| | 95,564 | | | * | | Equinix, Inc | | | 16,958 | |
| | 159,886 | | | * | | Euronet Worldwide, Inc | | | 7,651 | |
| | 155,522 | | | | | EVERTEC, Inc | | | 3,835 | |
| | 160,131 | | | * | | ExlService Holdings, Inc | | | 4,423 | |
| | 41,600 | | | | | F@N Communications, Inc | | | 1,238 | |
| | 7,221,089 | | | * | | Facebook, Inc | | | 394,705 | |
| | 134,405 | | | e | | Factset Research Systems, Inc | | | 14,594 | |
| | 162,367 | | | | | Fair Isaac Corp | | | 10,203 | |
| | 909,269 | | | | | Fidelity National Information Services, Inc | | | 48,810 | |
| | 52,301 | | | | | Fidessa Group plc | | | 1,956 | |
| | 16,775 | | | *,e | | FireEye, Inc | | | 732 | |
COLLEGE RETIREMENT EQUITIES FUND - Stock Account
| | | | | | | | VALUE | |
| SHARES | | | | | COMPANY | | (000) | |
| | 985,855 | | | * | | First American Corp | | $ | 35,027 | |
| | 648,050 | | | * | | Fiserv, Inc | | | 38,267 | |
| | 614,583 | | | * | | FleetCor Technologies, Inc | | | 72,011 | |
| | 120,194 | | | *,e | | FleetMatics Group plc | | | 5,198 | |
| | 47,394 | | | | | Forrester Research, Inc | | | 1,813 | |
| | 1,457,407 | | | * | | Fortinet, Inc | | | 27,880 | |
| | 125,728 | | | e | | F-Secure Oyj | | | 323 | |
| | 60,400 | | | | | FUJI SOFT, Inc | | | 1,391 | |
| | 4,227,046 | | | * | | Fujitsu Ltd | | | 21,907 | |
| | 39,300 | | | | | Future Architect, Inc | | | 208 | |
| | 13,393 | | | * | | GameHi Co Ltd | | | 92 | |
| | 163,139 | | | *,e | | GameLoft | | | 1,838 | |
| | 4,843 | | | * | | Gamevil, Inc | | | 210 | |
| | 208,073 | | | * | | Gartner, Inc | | | 14,784 | |
| | 431,904 | | | * | | Genpact Ltd | | | 7,934 | |
| | 141,205 | | | *,m | | Gerber Scientific, Inc | | | 0 | ^ |
| | 71,907 | | | * | | Gigamon, Inc | | | 2,019 | |
| | 256,000 | | | * | | Global Cash Access, Inc | | | 2,557 | |
| | 70,585 | | | * | | Global Eagle Entertainment, Inc | | | 1,050 | |
| | 304,322 | | | | | Global Payments, Inc | | | 19,778 | |
| | 281,704 | | | *,e | | Globo plc | | | 279 | |
| | 218,736 | | | *,e | | Glu Mobile, Inc | | | 851 | |
| | 91,500 | | | | | GMO internet, Inc | | | 1,205 | |
| | 21,600 | | | e | | GMO Payment Gateway, Inc | | | 859 | |
| | 36,482 | | | *,e | | Gogo, Inc | | | 905 | |
| | 18,501 | | | | | Golfzon Co Ltd | | | 354 | |
| | 1,237,999 | | | * | | Google, Inc (Class A) | | | 1,387,438 | |
| | 17,000 | | | | | Gourmet Navigator, Inc | | | 506 | |
| | 350,000 | | | *,e | | Gravity Co Ltd (ADR) | | | 322 | |
| | 97,078 | | | e | | Gree, Inc | | | 958 | |
| | 36,189 | | | | | Groupe Steria SCA | | | 711 | |
| | 58,575 | | | *,e | | Guidance Software, Inc | | | 592 | |
| | 244,919 | | | * | | Guidewire Software, Inc | | | 12,018 | |
| | 1,179,900 | | | *,e | | GungHo Online Entertainment Inc | | | 8,499 | |
| | 14,999 | | | | | Haansoft, Inc | | | 289 | |
| | 96,894 | | | | | Hackett Group, Inc | | | 602 | |
| | 417,318 | | | | | HCL Technologies Ltd | | | 8,527 | |
| | 156,998 | | | e | | Heartland Payment Systems, Inc | | | 7,825 | |
| | 243,627 | | | | | Hexaware Technologies Ltd | | | 519 | |
| | 102,513 | | | *,e | | Higher One Holdings, Inc | | | 1,001 | |
| | 116,044 | | | | | HIQ International AB | | | 714 | |
| | 449,046 | | | | | IAC/InterActiveCorp | | | 30,845 | |
| | 197,346 | | | * | | iGate Corp | | | 7,925 | |
| | 68,521 | | | * | | Imperva, Inc | | | 3,298 | |
| | 498,333 | | | * | | Indian Infotech & Software Ltd. | | | 198 | |
| | 115,818 | | | | | Indra Sistemas S.A. | | | 1,939 | |
| | 21,662 | | | | | Industrial & Financial Systems | | | 519 | |
| | 580,393 | | | | | Ines Corp | | | 3,823 | |
COLLEGE RETIREMENT EQUITIES FUND - Stock Account
| | | | | | | | VALUE | |
| SHARES | | | | | COMPANY | | (000) | |
| | 250,206 | | | * | | Infoblox, Inc | | $ | 8,262 | |
| | 54,600 | | | | | Infomart Corp | | | 974 | |
| | 498,342 | | | * | | Informatica Corp | | | 20,681 | |
| | 202,400 | | | | | Information Development Co | | | 1,095 | |
| | 36,800 | | | | | Information Services International-Dentsu Ltd | | | 400 | |
| | 764,174 | | | | | Infosys Technologies Ltd | | | 43,070 | |
| | 82,205 | | | * | | Infraware, Inc | | | 855 | |
| | 5,319 | | | | | Init Innovation In Traffic Sys | | | 171 | |
| | 1,300,615 | | | * | | Innovation Group plc | | | 748 | |
| | 51,906 | | | * | | Interactive Intelligence, Inc | | | 3,496 | |
| | 210,634 | | | * | | Internap Network Services Corp | | | 1,584 | |
| | 3,735,027 | | | | | International Business Machines Corp | | | 700,579 | |
| | 42,300 | | | | | Internet Initiative Japan, Inc | | | 1,136 | |
| | 1,793,108 | | | | | Intuit, Inc | | | 136,850 | |
| | 404,768 | | | | | Iress Market Technology Ltd | | | 3,416 | |
| | 88,660 | | | | | IT Holdings Corp | | | 1,400 | |
| | 48,511 | | | e | | Itochu Techno-Science Corp | | | 1,966 | |
| | 149,932 | | | e | | j2 Global, Inc | | | 7,498 | |
| | 188,565 | | | | | Jack Henry & Associates, Inc | | | 11,165 | |
| | 7,374 | | | | | JCEntertainment Corp | | | 142 | |
| | 129,136 | | | *,e | | Jive Software, Inc | | | 1,453 | |
| | 4,799 | | | * | | Joymax Co Ltd | | | 111 | |
| | 348,123 | | | * | | Just Dial Ltd | | | 8,126 | |
| | 27,200 | | | * | | Justsystems Corp | | | 280 | |
| | 115,300 | | | | | Kakaku.com, Inc | | | 2,025 | |
| | 11,067 | | | | | Kginicis Co Ltd | | | 175 | |
| | 2,704,000 | | | *,e | | Kingdee International Software Group Co Ltd | | | 826 | |
| | 904,000 | | | e | | Kingsoft Corp Ltd | | | 2,614 | |
| | 113,895 | | | * | | Knot, Inc | | | 1,693 | |
| | 436,817 | | | e | | Konami Corp | | | 10,101 | |
| | 34,112 | | | * | | KT Hitel Co Ltd | | | 253 | |
| | 173,827 | | | e | | Leidos Holdings, Inc | | | 8,081 | |
| | 297,778 | | | | | Lender Processing Services, Inc | | | 11,131 | |
| | 217,989 | | | * | | Limelight Networks, Inc | | | 432 | |
| | 376,597 | | | * | | LinkedIn Corp | | | 81,658 | |
| | 161,500 | | | | | Linx S.A. | | | 3,280 | |
| | 239,685 | | | * | | Lionbridge Technologies | | | 1,429 | |
| | 81,023 | | | *,e | | Liquidity Services, Inc | | | 1,836 | |
| | 260,540 | | | * | | Liveperson, Inc | | | 3,861 | |
| | 14,000 | | | * | | Livesense, Inc | | | 343 | |
| | 77,402 | | | * | | LogMeIn, Inc | | | 2,597 | |
| | 19,444 | | | *,e | | Luxoft Holding, Inc | | | 739 | |
| | 44,800 | | | e | | Macromill, Inc | | | 332 | |
| | 56,290 | | | *,e | | magicJack VocalTec Ltd | | | 671 | |
| | 57,021 | | | | | Mail.ru (GDR) | | | 2,543 | |
| | 95,856 | | | * | | Manhattan Associates, Inc | | | 11,261 | |
| | 90,960 | | | e | | Mantech International Corp (Class A) | | | 2,722 | |
COLLEGE RETIREMENT EQUITIES FUND - Stock Account
| | | | | | | | VALUE | |
| SHARES | | | | | COMPANY | | (000) | |
| | 92,028 | | | * | | Marchex, Inc (Class B) | | $ | 796 | |
| | 30,732 | | | *,e | | Marin Software, Inc | | | 315 | |
| | 27,020 | | | *,e | | Marketo, Inc | | | 1,002 | |
| | 590,728 | | | | | Mastercard, Inc (Class A) | | | 493,530 | |
| | 66,035 | | | | | Matrix IT Ltd | | | 339 | |
| | 15,794 | | | * | | Mavenir Systems, Inc | | | 176 | |
| | 316,335 | | | | | MAXIMUS, Inc | | | 13,916 | |
| | 370,887 | | | | | Mentor Graphics Corp | | | 8,927 | |
| | 310,536 | | | | | Micro Focus International plc | | | 3,953 | |
| | 200,157 | | | *,e | | Micros Systems, Inc | | | 11,483 | |
| | 34,871,890 | | | | | Microsoft Corp | | | 1,305,255 | |
| | 43,847 | | | * | | MicroStrategy, Inc (Class A) | | | 5,448 | |
| | 107,458 | | | *,e | | Millennial Media, Inc | | | 781 | |
| | 14,399 | | | | | MindTree Ltd | | | 356 | |
| | 83,188 | | | *,e | | Mitek Systems, Inc | | | 494 | |
| | 12,200 | | | | | Mitsubishi Research Institute, Inc | | | 247 | |
| | 26,908 | | | *,e | | Model N, Inc | | | 317 | |
| | 147,835 | | | * | | ModusLink Global Solutions, Inc | | | 847 | |
| | 95,126 | | | * | | MoneyGram International, Inc | | | 1,977 | |
| | 1,073,643 | | | | | Moneysupermarket.com Group plc | | | 3,214 | |
| | 10,404,149 | | | * | | Monitise plc | | | 11,586 | |
| | 903,200 | | | | | Mono Technology PCL | | | 226 | |
| | 141,945 | | | | | Monotype Imaging Holdings, Inc | | | 4,522 | |
| | 426,223 | | | * | | Monster Worldwide, Inc | | | 3,039 | |
| | 129,195 | | | * | | Move, Inc | | | 2,066 | |
| | 420,800 | | | | | My EG Services BHD | | | 343 | |
| | 49,916 | | | | | NCsoft | | | 11,778 | |
| | 16,600 | | | | | NEC Fielding Ltd | | | 185 | |
| | 32,400 | | | | | NEC Networks & System Integration Corp | | | 783 | |
| | 10,877 | | | | | Nemetschek AG. | | | 754 | |
| | 15,903 | | | * | | Neowiz Games Corp | | | 267 | |
| | 1,447 | | | *,e | | Net Element International, Inc | | | 6 | |
| | 33,617 | | | | | Net Entertainment NE AB | | | 710 | |
| | 104,600 | | | e | | NET One Systems Co Ltd | | | 687 | |
| | 268,500 | | | e | | NetDragon Websoft, Inc | | | 493 | |
| | 43,500 | | | | | Netease.com (ADR) | | | 3,419 | |
| | 181,272 | | | * | | Netscout Systems, Inc | | | 5,364 | |
| | 110,732 | | | * | | NetSuite, Inc | | | 11,408 | |
| | 538,894 | | | *,e | | NeuStar, Inc (Class A) | | | 26,869 | |
| | 669,500 | | | | | Nexon Co Ltd | | | 6,186 | |
| | 45,125 | | | | | NHN Corp | | | 31,097 | |
| | 15,771 | | | * | | NHN Entertainment Corp | | | 1,441 | |
| | 209,895 | | | * | | NIC, Inc | | | 5,220 | |
| | 47,332 | | | | | Nice Systems Ltd | | | 1,936 | |
| | 11,300 | | | | | NIFTY Corp | | | 130 | |
| | 140,100 | | | | | Nihon Unisys Ltd | | | 1,231 | |
| | 17,491 | | | | | NIIT Technologies Ltd | | | 102 | |
| | 163,061 | | | | | Nintendo Co Ltd | | | 21,826 | |
COLLEGE RETIREMENT EQUITIES FUND - Stock Account
| | | | | | | | VALUE | |
| SHARES | | | | | COMPANY | | (000) | |
| | 46,100 | | | | | Nippon System Development Co Ltd | | $ | 547 | |
| | 140,511 | | | | | Nomura Research Institute Ltd | | | 4,441 | |
| | 17,400 | | | | | NS Solutions Corp | | | 385 | |
| | 184,100 | | | | | NTT Data Corp | | | 6,801 | |
| | 494,151 | | | *,e | | Nuance Communications, Inc | | | 7,511 | |
| | 11,500 | | | | | OBIC Business Consultants Ltd | | | 375 | |
| | 123,700 | | | | | Obic Co Ltd | | | 3,655 | |
| | 121,145 | | | | | Open Text Corp | | | 11,143 | |
| | 107,464 | | | *,e | | OpenTable, Inc | | | 8,529 | |
| | 260,495 | | | e | | Opera Software ASA | | | 3,571 | |
| | 133,061 | | | * | | Optimal Payments plc | | | 778 | |
| | 14,121,029 | | | | | Oracle Corp | | | 540,270 | |
| | 15,360 | | | | | Oracle Corp Japan | | | 561 | |
| | 52,032 | | | e | | Otsuka Corp | | | 6,647 | |
| | 930,700 | | | | | Pacific Online | | | 447 | |
| | 607,916 | | | * | | Pandora Media, Inc | | | 16,171 | |
| | 707,759 | | | | | Paychex, Inc | | | 32,224 | |
| | 94,832 | | | | | PC Home Online | | | 762 | |
| | 275,000 | | | | | PCA Corp | | | 3,369 | |
| | 108,996 | | | | | Pegasystems, Inc | | | 5,360 | |
| | 134,457 | | | * | | Perficient, Inc | | | 3,149 | |
| | 137,347 | | | * | | Planet Payment, Inc | | | 382 | |
| | 406,247 | | | | | Playtech Ltd | | | 4,963 | |
| | 116,000 | | | * | | Polaris Software Lab Ltd | | | 255 | |
| | 104,914 | | | | | POSDATA Co Ltd | | | 755 | |
| | 110,387 | | | * | | PRG-Schultz International, Inc | | | 742 | |
| | 204,386 | | | * | | Progress Software Corp | | | 5,279 | |
| | 99,874 | | | * | | Proofpoint, Inc | | | 3,313 | |
| | 77,434 | | | * | | PROS Holdings, Inc | | | 3,090 | |
| | 25,139 | | | | | PSI AG. Gesellschaft Fuer Produkte und Systeme der Informationstechnologie | | | 469 | |
| | 513,615 | | | * | | PTC, Inc | | | 18,177 | |
| | 24,749 | | | e | | QAD, Inc (Class A) | | | 437 | |
| | 18,166 | | | | | QIWI plc (ADR) | | | 1,017 | |
| | 637,555 | | | * | | QLIK Technologies, Inc | | | 16,978 | |
| | 87,692 | | | * | | Qualys, Inc | | | 2,027 | |
| | 11,188,641 | | | * | | Quindell Portfolio plc | | | 3,613 | |
| | 129,192 | | | * | | QuinStreet, Inc | | | 1,123 | |
| | 800,264 | | | *,e | | Rackspace Hosting, Inc | | | 31,314 | |
| | 22,463 | | | * | | Rally Software Development Corp | | | 437 | |
| | 92,717 | | | *,e | | RealNetworks, Inc | | | 700 | |
| | 150,660 | | | *,e | | RealPage, Inc | | | 3,522 | |
| | 712,206 | | | * | | Recall Holdings Ltd | | | 2,582 | |
| | 782,232 | | | * | | Red Hat, Inc | | | 43,836 | |
| | 101,000 | | | *,e | | Redknee Solutions, Inc | | | 610 | |
| | 27,151 | | | * | | Reis, Inc | | | 522 | |
| | 13,034 | | | | | Reply S.p.A. | | | 1,020 | |
| | 157,262 | | | * | | Responsys, Inc | | | 4,311 | |
COLLEGE RETIREMENT EQUITIES FUND - Stock Account
| | | | | | | | VALUE | |
| SHARES | | | | | COMPANY | | (000) | |
| | 15,649 | | | *,e | | Rocket Fuel, Inc | | $ | 962 | |
| | 33,641 | | | * | | Rosetta Stone, Inc | | | 411 | |
| | 395,772 | | | * | | Rovi Corp | | | 7,793 | |
| | 1,124,082 | | | | | Sage Group plc | | | 7,525 | |
| | 2,895,980 | | | * | | Salesforce.com, Inc | | | 159,829 | |
| | 1,839,100 | | | | | Samart Corp PCL | | | 834 | |
| | 1,663,546 | | | | | SAP AG. | | | 144,265 | |
| | 56,599 | | | e | | Sapiens International Corp NV | | | 436 | |
| | 566,460 | | | * | | Sapient Corp | | | 9,834 | |
| | 20,016 | | | | | SBSi Co Ltd | | | 296 | |
| | 163,654 | | | | | Science Applications International Corp | | | 5,412 | |
| | 69,675 | | | * | | Sciquest, Inc | | | 1,984 | |
| | 89,276 | | | | | SDL plc | | | 531 | |
| | 127,362 | | | * | | Seachange International, Inc | | | 1,549 | |
| | 241,691 | | | *,e | | ServiceNow, Inc | | | 13,537 | |
| | 194,141 | | | * | | ServiceSource International LLC | | | 1,627 | |
| | 479,630 | | | | | Shanghai Baosight Software Co Ltd | | | 916 | |
| | 25,973 | | | *,e | | Shutterstock, Inc | | | 2,172 | |
| | 22,365 | | | *,e | | Silver Spring Networks, Inc | | | 470 | |
| | 52,731 | | | | | SimCorp AS | | | 2,072 | |
| | 68,419 | | | * | | Sina Corp | | | 5,764 | |
| | 26,022 | | | | | SK C&C Co Ltd | | | 3,333 | |
| | 14,948 | | | * | | SK Communications Co Ltd | | | 77 | |
| | 11,200 | | | * | | SMS Co Ltd | | | 241 | |
| | 72,768 | | | e | | SMS Management & Technology Ltd | | | 260 | |
| | 79,295 | | | | | Software AG. | | | 2,778 | |
| | 108,540 | | | | | Soft-World International Corp | | | 263 | |
| | 246,609 | | | * | | SolarWinds, Inc | | | 9,329 | |
| | 200,922 | | | | | Solera Holdings, Inc | | | 14,217 | |
| | 1,146,667 | | | | | Sonda S.A. | | | 2,750 | |
| | 8,305 | | | | | Sopra Group S.A. | | | 840 | |
| | 64,495 | | | *,e | | Spark Networks, Inc | | | 397 | |
| | 401,483 | | | * | | Splunk, Inc | | | 27,570 | |
| | 51,351 | | | *,e | | SPS Commerce, Inc | | | 3,353 | |
| | 81,227 | | | | | Square Enix Co Ltd | | | 1,421 | |
| | 249,281 | | | * | | SS&C Technologies Holdings, Inc | | | 11,033 | |
| | 72,935 | | | * | | Stamps.com, Inc | | | 3,071 | |
| | 63,810 | | | | | Sumisho Computer Systems Corp | | | 1,675 | |
| | 1,475,000 | | | | | SUNeVision Holdings Ltd | | | 425 | |
| | 196,314 | | | * | | SupportSoft, Inc | | | 744 | |
| | 157,970 | | | * | | Sykes Enterprises, Inc | | | 3,445 | |
| | 2,441,620 | | | | | Symantec Corp | | | 57,573 | |
| | 95,869 | | | * | | Synchronoss Technologies, Inc | | | 2,979 | |
| | 505,559 | | | * | | Synopsys, Inc | | | 20,511 | |
| | 91,775 | | | * | | Syntel, Inc | | | 8,347 | |
| | 19,800 | | | | | Systena Corp | | | 140 | |
| | 356,000 | | | | | Systex Corp | | | 803 | |
| | 148,513 | | | * | | TA Indigo Holding Corp | | | 1,799 | |
COLLEGE RETIREMENT EQUITIES FUND - Stock Account
| | | | | | | | VALUE | |
| SHARES | | | | | COMPANY | | (000) | |
| | 159,152 | | | * | | Tableau Software, Inc | | $ | 10,970 | |
| | 1,065,826 | | | * | | Take-Two Interactive Software, Inc | | | 18,513 | |
| | 101,993 | | | *,e | | Tangoe, Inc | | | 1,837 | |
| | 927,245 | | | | | Tata Consultancy Services Ltd | | | 32,589 | |
| | 181,590 | | | * | | Tech Mahindra Ltd | | | 5,401 | |
| | 27,963 | | | * | | TechTarget, Inc | | | 192 | |
| | 218,375 | | | | | Tecmo Koei Holdings Co Ltd | | | 2,579 | |
| | 683,030 | | | | | Telecity Group plc | | | 8,217 | |
| | 154,883 | | | *,e | | TeleCommunication Systems, Inc (Class A) | | | 359 | |
| | 90,821 | | | * | | TeleNav, Inc | | | 599 | |
| | 80,477 | | | * | | TeleTech Holdings, Inc | | | 1,927 | |
| | 83,111 | | | | | Temenos Group AG. | | | 2,351 | |
| | 1,718,300 | | | | | Tencent Holdings Ltd | | | 110,018 | |
| | 713,811 | | | * | | Teradata Corp | | | 32,471 | |
| | 3,275 | | | | | Tessi S.A. | | | 407 | |
| | 17,424 | | | *,e | | Textura Corp | | | 522 | |
| | 660,807 | | | * | | TIBCO Software, Inc | | | 14,855 | |
| | 72,864 | | | | | Tietoenator Oyj | | | 1,650 | |
| | 883,471 | | | * | | TiVo, Inc | | | 11,591 | |
| | 797,452 | | | | | Total System Services, Inc | | | 26,539 | |
| | 132,000 | | | | | Totvus S.A. | | | 2,068 | |
| | 37,757 | | | | | Trans Cosmos, Inc/Japan | | | 723 | |
| | 2,277,999 | | | | | Travelsky Technology Ltd | | | 2,250 | |
| | 51,001 | | | * | | Travelzoo, Inc | | | 1,087 | |
| | 16,158 | | | *,e | | Tremor Video, Inc | | | 94 | |
| | 91,060 | | | e | | Trend Micro, Inc | | | 3,191 | |
| | 89,722 | | | *,e | | Trulia, Inc | | | 3,165 | |
| | 113,784 | | | *,e | | Twitter, Inc | | | 7,242 | |
| | 144,551 | | | * | | Tyler Technologies, Inc | | | 14,763 | |
| | 315,317 | | | * | | Ubisoft Entertainment | | | 4,466 | |
| | 95,401 | | | * | | Ultimate Software Group, Inc | | | 14,617 | |
| | 246,213 | | | * | | Unisys Corp | | | 8,265 | |
| | 32,418 | | | | | Unit 4 Agresso NV | | | 1,711 | |
| | 70,312 | | | | | United Internet AG. | | | 2,997 | |
| | 53,940 | | | | | United Online, Inc | | | 742 | |
| | 12,100 | | | e | | UNITED, Inc | | | 366 | |
| | 335,933 | | | *,e | | Unwired Planet, Inc | | | 464 | |
| | 283,145 | | | | | UXC Ltd | | | 253 | |
| | 292,922 | | | *,e | | Valueclick, Inc | | | 6,846 | |
| | 792,435 | | | *,e | | Vantiv, Inc | | | 25,841 | |
| | 130,190 | | | * | | Vasco Data Security International | | | 1,006 | |
| | 203,816 | | | * | | VeriFone Systems, Inc | | | 5,466 | |
| | 246,679 | | | * | | Verint Systems, Inc | | | 10,592 | |
| | 744,414 | | | *,e | | VeriSign, Inc | | | 44,501 | |
| | 136,683 | | | *,e | | VirnetX Holding Corp | | | 2,653 | |
| | 79,164 | | | * | | Virtusa Corp | | | 3,015 | |
| | 2,721,441 | | | | | Visa, Inc (Class A) | | | 606,010 | |
| | 404,185 | | | *,e | | VistaPrint Ltd | | | 22,978 | |
COLLEGE RETIREMENT EQUITIES FUND - Stock Account
| | | | | | | | VALUE | |
| SHARES | | | | | COMPANY | | (000) | |
| | 874,842 | | | * | | VMware, Inc (Class A) | | $ | 78,482 | |
| | 67,112 | | | *,e | | Vocus, Inc | | | 764 | |
| | 4,114,000 | | | *,e | | VODone Ltd | | | 558 | |
| | 273,330 | | | *,e | | Vringo, Inc | | | 809 | |
| | 36,297 | | | * | | WANdisco plc | | | 739 | |
| | 94,894 | | | *,e | | WebMD Health Corp (Class A) | | | 3,748 | |
| | 134,417 | | | * | | Website Pros, Inc | | | 4,273 | |
| | 17,589 | | | * | | Webzen, Inc | | | 124 | |
| | 11,460 | | | * | | WeMade Entertainment Co Ltd | | | 355 | |
| | 4,242,117 | | | | | Western Union Co | | | 73,177 | |
| | 925,834 | | | | | Wipro Ltd | | | 8,349 | |
| | 189,880 | | | | | Wirecard AG. | | | 7,516 | |
| | 22,057 | | | *,e | | Wix.com Ltd | | | 592 | |
| | 290,490 | | | *,e | | Workday, Inc | | | 24,157 | |
| | 484,295 | | | | | Xchanging plc | | | 1,231 | |
| | 107,705 | | | * | | Xero Ltd | | | 2,869 | |
| | 2,938 | | | | | XING AG. | | | 302 | |
| | 34,500 | | | | | X-Legend Entertainment Co Ltd | | | 155 | |
| | 26,503 | | | * | | Xoom Corp | | | 725 | |
| | 2,454,300 | | | | | Yahoo! Japan Corp | | | 13,686 | |
| | 5,198,116 | | | * | | Yahoo!, Inc | | | 210,212 | |
| | 95,959 | | | * | | Yandex NV | | | 4,141 | |
| | 166,921 | | | * | | Yelp, Inc | | | 11,509 | |
| | 14,950 | | | *,e | | YuMe, Inc | | | 111 | |
| | 74,599 | | | *,e | | Zillow, Inc | | | 6,097 | |
| | 208,637 | | | * | | Zix Corp | | | 951 | |
| | 4,115,312 | | | * | | Zynga, Inc | | | 15,638 | |
| | | | | | | TOTAL SOFTWARE & SERVICES | | | 10,029,444 | |
| | | | | | | | | | | |
| TECHNOLOGY HARDWARE & EQUIPMENT - 4.9% | | | | |
| | 644,763 | | | *,e | | 3D Systems Corp | | | 59,918 | |
| | 55,933 | | | * | | 3S Korea Co Ltd | | | 236 | |
| | 790,000 | | | e | | AAC Technologies Holdings, Inc | | | 3,844 | |
| | 1,067,292 | | | | | Accton Technology Corp | | | 565 | |
| | 2,543,274 | | | * | | Acer, Inc | | | 1,565 | |
| | 199,000 | | | | | ACES Electronic Co Ltd | | | 153 | |
| | 78,320 | | | * | | Acme Electronics Corp | | | 112 | |
| | 252,370 | | | | | Adlink Technology, Inc | | | 433 | |
| | 228,452 | | | | | Adtran, Inc | | | 6,170 | |
| | 52,403 | | | * | | ADVA AG. Optical Networking | | | 270 | |
| | 265,475 | | | | | Advantech Co Ltd | | | 1,842 | |
| | 58,835 | | | * | | Agilysys, Inc | | | 819 | |
| | 63,400 | | | | | Ai Holdings Corp | | | 790 | |
| | 9,625,105 | | | *,e | | Alcatel S.A. | | | 42,714 | |
| | 9,431,457 | | | | | Alcatel-Lucent (ADR) | | | 41,498 | |
| | 50,846 | | | e | | Alliance Fiber Optic Products, Inc | | | 765 | |
| | 688,000 | | | | | Alpha Networks, Inc | | | 499 | |
| | 191,600 | | | * | | Alps Electric Co Ltd | | | 2,181 | |
COLLEGE RETIREMENT EQUITIES FUND - Stock Account
| | | | | | | | VALUE | |
| SHARES | | | | | COMPANY | | (000) | |
| | 398,603 | | | | | Amphenol Corp (Class A) | | $ | 35,547 | |
| | 50,567 | | | * | | Anaren, Inc | | | 1,415 | |
| | 104,023 | | | * | | Anixter International, Inc | | | 9,345 | |
| | 160,900 | | | | | Anritsu Corp | | | 1,773 | |
| | 3,983,091 | | | | | Apple, Inc | | | 2,234,952 | |
| | 11,181 | | | * | | Applied Optoelectronics, Inc | | | 168 | |
| | 193,676 | | | | | Arcadyan Technology Corp | | | 293 | |
| | 76,218 | | | * | | Arima Communications Corp | | | 35 | |
| | 474,388 | | | * | | ARRIS Group, Inc | | | 11,558 | |
| | 434,332 | | | * | | Arrow Electronics, Inc | | | 23,563 | |
| | 560,675 | | | *,e | | Aruba Networks, Inc | | | 10,036 | |
| | 101,507 | | | | | Ascom Holding AG. | | | 1,709 | |
| | 108,464 | | | | | Asia Vital Components Co Ltd | | | 74 | |
| | 100,000 | | | | | ASROCK, Inc | | | 370 | |
| | 2,227,461 | | | | | Asustek Computer, Inc | | | 20,061 | |
| | 118,000 | | | | | Aten International Co Ltd | | | 356 | |
| | 9,085,153 | | | * | | AU Optronics Corp | | | 2,900 | |
| | 40,142 | | | *,e | | Audience, Inc | | | 467 | |
| | 19,295 | | | | | Austria Technologie & Systemtechnik AG. | | | 190 | |
| | 235,000 | | | | | AV Tech Corp | | | 664 | |
| | 126,367 | | | * | | Avid Technology, Inc | | | 1,030 | |
| | 35,100 | | | * | | Avigilon Corp | | | 1,016 | |
| | 370,423 | | | | | Avnet, Inc | | | 16,339 | |
| | 94,048 | | | | | AVX Corp | | | 1,310 | |
| | 81,964 | | | * | | AX Holding Corp | | | 533 | |
| | 78,927 | | | e | | Axis Communications AB | | | 2,745 | |
| | 51,262 | | | | | Badger Meter, Inc | | | 2,794 | |
| | 28,512 | | | | | Barco NV | | | 2,224 | |
| | 44,356 | | | | | Bel Fuse, Inc (Class B) | | | 945 | |
| | 146,704 | | | | | Belden CDT, Inc | | | 10,335 | |
| | 265,695 | | | * | | Benchmark Electronics, Inc | | | 6,132 | |
| | 2,325,000 | | | * | | Benq Corp | | | 573 | |
| | 62,056 | | | | | Black Box Corp | | | 1,849 | |
| | 211,013 | | | * | | Blackberry Ltd | | | 1,569 | |
| | 2,732,000 | | | | | Broad Intelligence International Pharmaceutical Holdings Ltd | | | 869 | |
| | 2,378,835 | | | * | | Brocade Communications Systems, Inc | | | 21,100 | |
| | 133,632 | | | | | Brother Industries Ltd | | | 1,828 | |
| | 103,024 | | | *,e | | Bull S.A. | | | 437 | |
| | 1,509,500 | | | *,e | | BYD Electronic International Co Ltd | | | 881 | |
| | 201,154 | | | * | | CalAmp Corp | | | 5,626 | |
| | 3,288,400 | | | | | CalComp Electronics Thailand PCL | | | 297 | |
| | 241,826 | | | * | | Calix Networks, Inc | | | 2,331 | |
| | 62,300 | | | | | Canon Electronics, Inc | | | 1,147 | |
| | 1,749,383 | | | *,e | | Canon, Inc | | | 55,820 | |
| | 372,000 | | | | | Career Technology Co Ltd | | | 354 | |
| | 2,744,853 | | | | | Catcher Technology Co Ltd | | | 17,874 | |
| | 266,000 | | | * | | Catic Shenzhen Holdings Ltd | | | 108 | |
| | 102,788 | | | e | | CDW Corp | | | 2,401 | |
COLLEGE RETIREMENT EQUITIES FUND - Stock Account
| | | | | | | | VALUE | |
| SHARES | | | | | COMPANY | | (000) | |
| | 439,385 | | | * | | Celestica, Inc | | $ | 4,567 | |
| | 219,156 | | | | | Chang Wah Electromaterials, Inc | | | 633 | |
| | 158,369 | | | * | | Checkpoint Systems, Inc | | | 2,497 | |
| | 374,402 | | | | | Cheng Uei Precision Industry Co Ltd | | | 753 | |
| | 489,949 | | | | | Chicony Electronics Co Ltd | | | 1,234 | |
| | 1,042,108 | | | | | Chimei Materials Technology Corp | | | 1,278 | |
| | 3,714,000 | | | | | China Aerospace International Holdings Ltd | | | 418 | |
| | 1,434,000 | | | e | | China All Access Holdings Ltd | | | 613 | |
| | 1,631,000 | | | e | | China ITS Holdings Co Ltd | | | 390 | |
| | 5,008,000 | | | | | China Wireless Technologies Ltd | | | 1,645 | |
| | 1,069,000 | | | | | Chin-Poon Industrial Co | | | 1,791 | |
| | 533,840 | | | | | Chroma ATE, Inc | | | 1,122 | |
| | 2,759,687 | | | *,e | | Ciena Corp | | | 66,039 | |
| | 19,894,109 | | | | | Cisco Systems, Inc | | | 446,623 | |
| | 401,179 | | | | | Citizen Watch Co Ltd | | | 3,385 | |
| | 483,073 | | | | | Clevo Co | | | 1,046 | |
| | 2,783,000 | | | * | | CMC Magnetics Corp | | | 458 | |
| | 403,688 | | | * | | Cognex Corp | | | 15,413 | |
| | 96,738 | | | * | | Coherent, Inc | | | 7,196 | |
| | 1,280,299 | | | *,e | | Comba Telecom Systems Holdings Ltd | | | 444 | |
| | 26,600 | | | * | | CommScope Holding Co, Inc | | | 503 | |
| | 225,120 | | | | | Compal Communications, Inc | | | 381 | |
| | 13,705,948 | | | | | Compal Electronics, Inc | | | 10,510 | |
| | 2,650,000 | | | | | Compeq Manufacturing Co | | | 1,556 | |
| | 67,642 | | | | | Comtech Telecommunications Corp | | | 2,132 | |
| | 11,530 | | | *,e | | Control4 Corp | | | 204 | |
| | 2,115,000 | | | | | Coretronic Corp | | | 2,093 | |
| | 3,155,837 | | | | | Corning, Inc | | | 56,237 | |
| | 161,000 | | | | | Coxon Precise Industrial Co Ltd | | | 255 | |
| | 139,368 | | | * | | Cray, Inc | | | 3,827 | |
| | 16,824 | | | * | | CrucialTec Co Ltd | | | 152 | |
| | 131,478 | | | | | CTS Corp | | | 2,618 | |
| | 315,000 | | | | | CyberTAN Technology, Inc | | | 350 | |
| | 123,380 | | | | | Daeduck Electronics Co | | | 976 | |
| | 16,040 | | | | | Daeduck GDS Co Ltd | | | 267 | |
| | 7,800 | | | e | | Dai-ichi Seiko Co Ltd | | | 94 | |
| | 889,000 | | | | | Daiwabo Co Ltd | | | 1,741 | |
| | 141,381 | | | | | Daktronics, Inc | | | 2,217 | |
| | 266,000 | | | | | Darfon Electronics Corp | | | 201 | |
| | 59,209 | | | * | | Datalink Corp | | | 645 | |
| | 8,795 | | | | | Datalogic S.p.A. | | | 100 | |
| | 309,143 | | | | | DataTec Ltd | | | 1,526 | |
| | 1,690,500 | | | | | Delta Electronics Thai PCL | | | 2,761 | |
| | 1,898,464 | | | | | Delta Electronics, Inc | | | 10,872 | |
| | 200,000 | | | | | Denki Kogyo Co Ltd | | | 1,385 | |
| | 40,832 | | | | | Dialight plc | | | 579 | |
| | 120,875 | | | e | | Diebold, Inc | | | 3,990 | |
| | 106,453 | | | * | | Digi International, Inc | | | 1,290 | |
COLLEGE RETIREMENT EQUITIES FUND - Stock Account
| | | | | | | | VALUE | |
| SHARES | | | | | COMPANY | | (000) | |
| | 1,181,000 | | | | | Digital China Holdings Ltd | | $ | 1,395 | |
| | 10,758 | | | | | Digital Multimedia Technologies S.p.A. | | | 494 | |
| | 187,444 | | | | | Diploma plc | | | 2,098 | |
| | 744,000 | | | | | D-Link Corp | | | 451 | |
| | 68,801 | | | *,e | | Dolby Laboratories, Inc (Class A) | | | 2,653 | |
| | 165,924 | | | | | Domino Printing Sciences | | | 2,104 | |
| | 61,442 | | | * | | DTS, Inc | | | 1,473 | |
| | 895,823 | | | | | Eastern Communications Co Ltd | | | 430 | |
| | 77,026 | | | * | | EchoStar Corp (Class A) | | | 3,830 | |
| | 16,971 | | | | | Eizo Nanao Corp | | | 434 | |
| | 65,375 | | | | | Electro Rent Corp | | | 1,211 | |
| | 90,497 | | | | | Electro Scientific Industries, Inc | | | 947 | |
| | 992,280 | | | | | Electrocomponents plc | | | 4,593 | |
| | 233,663 | | | * | | Electronics for Imaging, Inc | | | 9,050 | |
| | 68,654 | | | | | Elite Material Co Ltd | | | 58 | |
| | 703,080 | | | | | Elitegroup Computer Systems Co Ltd | | | 403 | |
| | 262,824 | | | * | | Ellies Holdings Ltd | | | 139 | |
| | 6,960,498 | | | | | EMC Corp | | | 175,057 | |
| | 326,797 | | | * | | Emulex Corp | | | 2,340 | |
| | 9,200 | | | | | Enplas Corp | | | 632 | |
| | 168,900 | | | * | | Entire Technology Co Ltd | | | 177 | |
| | 5,272,441 | | | | | Ericsson (LM) (B Shares) | | | 64,374 | |
| | 32,407 | | | | | Esprinet S.p.A. | | | 240 | |
| | 14,420 | | | | | EVS Broadcast Equipment S.A. | | | 934 | |
| | 31,663 | | | *,e | | Exfo Electro Optical Engineering, Inc | | | 151 | |
| | 346,261 | | | * | | Extreme Networks, Inc | | | 2,424 | |
| | 1,239,451 | | | * | | F5 Networks, Inc | | | 112,617 | |
| | 111,601 | | | * | | Fabrinet | | | 2,295 | |
| | 77,988 | | | * | | FARO Technologies, Inc | | | 4,547 | |
| | 140,176 | | | | | FEI Co | | | 12,526 | |
| | 4,538,000 | | | * | | FIH Mobile Ltd | | | 2,446 | |
| | 290,837 | | | *,e | | Fingerprint Cards AB | | | 2,471 | |
| | 1,028,459 | | | * | | Finisar Corp | | | 24,601 | |
| | 169,799 | | | | | Firich Enterprises Co Ltd | | | 709 | |
| | 11,221 | | | * | | Flexcom Inc | | | 116 | |
| | 256,034 | | | | | FLEXium Interconnect, Inc | | | 827 | |
| | 300,402 | | | | | Flir Systems, Inc | | | 9,042 | |
| | 165,508 | | | | | Flytech Technology Co Ltd | | | 652 | |
| | 905,126 | | | | | Foxconn Technology Co Ltd | | | 2,118 | |
| | 1,331,582 | | | | | Fuji Folms Holdings Corp | | | 37,797 | |
| | 273,585 | | | *,e | | Fusion-io, Inc | | | 2,438 | |
| | 247,153 | | | | | G Tech Optoelectronics Corp | | | 312 | |
| | 70,864 | | | e | | Gemalto NV | | | 7,799 | |
| | 1,124,913 | | | | | Gemtek Technology Corp | | | 1,065 | |
| | 67,252 | | | | | GeoVision, Inc | | | 424 | |
| | 319,000 | | | | | Getac Technology Corp | | | 166 | |
| | 1,782,000 | | | | | Gigabyte Technology Co Ltd | | | 2,154 | |
| | 228,986 | | | * | | Gigastorage Corp | | | 264 | |
COLLEGE RETIREMENT EQUITIES FUND - Stock Account
| | | | | | | | VALUE | |
| SHARES | | | | | COMPANY | | (000) | |
| | 547,613 | | | * | | Global Brands Manufacture Ltd | | $ | 193 | |
| | 19,200 | | | | | Global Display Co Ltd | | | 367 | |
| | 532,000 | | | * | | Great Wall Technology Co Ltd | | | 206 | |
| | 119,916 | | | * | | GSI Group, Inc | | | 1,348 | |
| | 30,300 | | | | | Hakuto Co Ltd | | | 302 | |
| | 686,297 | | | | | Halma plc | | | 6,867 | |
| | 18,741 | | | | | Hamamatsu Photonics KK | | | 750 | |
| | 102,838 | | | | | Hannstar Board Corp | | | 39 | |
| | 3,693,000 | | | * | | HannStar Display Corp | | | 1,374 | |
| | 407,064 | | | * | | Harmonic, Inc | | | 3,004 | |
| | 569,123 | | | | | Harris Corp | | | 39,730 | |
| | 244,750 | | | * | | Harris Stratex Networks, Inc (Class A) | | | 553 | |
| | 7,655,797 | | | | | Hewlett-Packard Co | | | 214,209 | |
| | 81,615 | | | | | Hexagon AB (B Shares) | | | 2,582 | |
| | 760,904 | | | | | High Tech Computer Corp | | | 3,607 | |
| | 9,100 | | | | | Hioki EE Corp | | | 120 | |
| | 323,000 | | | | | Hi-P International Ltd | | | 150 | |
| | 44,504 | | | | | Hirose Electric Co Ltd | | | 6,344 | |
| | 50,090 | | | | | Hitachi High-Technologies Corp | | | 1,261 | |
| | 205,000 | | | | | Hitachi Kokusai Electric, Inc | | | 2,889 | |
| | 14,168,407 | | | | | Hitachi Ltd | | | 107,427 | |
| | 520,100 | | | | | Holystone Enterprise Co Ltd | | | 659 | |
| | 20,395,673 | | | | | Hon Hai Precision Industry Co, Ltd | | | 55,013 | |
| | 43,095 | | | | | Horiba Ltd | | | 1,473 | |
| | 120,900 | | | | | Hosiden Corp | | | 654 | |
| | 626,196 | | | | | Hoya Corp | | | 17,416 | |
| | 13,090 | | | | | Humax Co Ltd | | | 150 | |
| | 97,066 | | | *,e | | Hutchinson Technology, Inc | | | 311 | |
| | 24,501 | | | | | Ibiden Co Ltd | | | 459 | |
| | 155,000 | | | | | Ichia Technologies, Inc | | | 85 | |
| | 9,500 | | | | | Icom, Inc | | | 229 | |
| | 203,280 | | | | | ICP Electronics, Inc | | | 284 | |
| | 27,360 | | | * | | Iljin Materials Co Ltd | | | 277 | |
| | 155,444 | | | * | | Imation Corp | | | 727 | |
| | 164,846 | | | * | | Immersion Corp | | | 1,711 | |
| | 3,964 | | | | | Inficon Holding AG. | | | 1,531 | |
| | 841,028 | | | *,e | | Infinera Corp | | | 8,225 | |
| | 404,000 | | | | | Infortrend Technology, Inc | | | 298 | |
| | 51,019 | | | e | | Ingenico | | | 4,096 | |
| | 551,061 | | | * | | Ingram Micro, Inc (Class A) | | | 12,928 | |
| | 7,288,539 | | | * | | InnoLux Display Corp | | | 2,785 | |
| | 192,216 | | | * | | Insight Enterprises, Inc | | | 4,365 | |
| | 869,000 | | | | | Inspur International Ltd | | | 173 | |
| | 9,123 | | | | | Intelligent Digital Integrated Securities Co Ltd | | | 145 | |
| | 130,893 | | | e | | InterDigital, Inc | | | 3,860 | |
| | 8,269 | | | * | | Interflex Co Ltd | | | 167 | |
COLLEGE RETIREMENT EQUITIES FUND - Stock Account
| | | | | | | | VALUE | |
| SHARES | | | | | COMPANY | | (000) | |
| | 3,206 | | | * | | Intevac, Inc | | $ | 24 | |
| | 9,822 | | | | | INTOPS Co Ltd | | | 182 | |
| | 285,607 | | | *,e | | InvenSense, Inc | | | 5,935 | |
| | 2,335,023 | | | | | Inventec Co Ltd | | | 2,068 | |
| | 54,147 | | | *,e | | IPG Photonics Corp | | | 4,202 | |
| | 9,500 | | | | | Iriso Electronics Co Ltd | | | 438 | |
| | 164,930 | | | | | IsuPetasys Co Ltd | | | 1,069 | |
| | 18,800 | | | e | | ITC Networks Corp | | | 149 | |
| | 802,357 | | | | | ITEQ Corp | | | 840 | |
| | 175,335 | | | * | | Itron, Inc | | | 7,264 | |
| | 21,751 | | | | | Ituran Location and Control Ltd | | | 475 | |
| | 184,689 | | | * | | Ixia | | | 2,458 | |
| | 607,282 | | | | | Jabil Circuit, Inc | | | 10,591 | |
| | 48,610 | | | | | Jahwa Electronics Co Ltd | | | 961 | |
| | 85,493 | | | | | Japan Aviation Electronics Industry Ltd | | | 1,099 | |
| | 15,100 | | | e | | Japan Cash Machine Co Ltd | | | 298 | |
| | 22,000 | | | | | Japan Digital Laboratory Co Ltd | | | 309 | |
| | 85,535 | | | *,e | | Japan Radio Co Ltd | | | 304 | |
| | 2,124,600 | | | | | JCY International BHD | | | 413 | |
| | 5,101,197 | | | * | | JDS Uniphase Corp | | | 66,214 | |
| | 59,096 | | | | | Jenoptik AG. | | | 1,006 | |
| | 62,700 | | | | | Jentech Precision Industrial Co Ltd | | | 170 | |
| | 153,528 | | | | | Jess-Link Products Co Ltd | | | 137 | |
| | 1,266,000 | | | e | | Ju Teng International Holdings Ltd | | | 839 | |
| | 1,637,078 | | | * | | Juniper Networks, Inc | | | 36,949 | |
| | 50,000 | | | | | Kaga Electronics Co Ltd | | | 564 | |
| | 10,700 | | | | | Kanematsu Electronics Ltd | | | 135 | |
| | 5,713 | | | e | | Kapsch TrafficCom AG. | | | 318 | |
| | 230,300 | | | | | KCE Electronics PCL | | | 165 | |
| | 170,826 | | | * | | Kemet Corp | | | 963 | |
| | 42,937 | | | | | Keyence Corp | | | 18,385 | |
| | 13,359 | | | * | | KH Vatec Co Ltd | | | 321 | |
| | 1,640,900 | | | e | | Kingboard Chemical Holdings Ltd | | | 4,295 | |
| | 1,940,500 | | | e | | Kingboard Laminates Holdings Ltd | | | 825 | |
| | 47,150 | | | | | KMC Kuei Meng International In | | | 199 | |
| | 11,443 | | | * | | KMW Co Ltd | | | 185 | |
| | 63,800 | | | | | Koa Corp | | | 655 | |
| | 10,243 | | | | | KONA I Co Ltd | | | 286 | |
| | 750,500 | | | | | Konica Minolta Holdings, Inc | | | 7,500 | |
| | 13,862 | | | * | | Korea Circuit Co Ltd | | | 172 | |
| | 99,500 | | | | | Kudelski S.A. | | | 1,521 | |
| | 50,582 | | | * | | KVH Industries, Inc | | | 659 | |
| | 267,900 | | | | | Kyocera Corp | | | 13,393 | |
| | 312,509 | | | | | Laird Group plc | | | 1,437 | |
| | 457,762 | | | | | Largan Precision Co Ltd | | | 18,710 | |
| | 954 | | | | | LEM Holding S.A. | | | 746 | |
COLLEGE RETIREMENT EQUITIES FUND - Stock Account
| | | | | | | | VALUE | |
| SHARES | | | | | COMPANY | | (000) | |
| | 16,111,400 | | | e | | Lenovo Group Ltd | | $ | 19,640 | |
| | 310,328 | | | e | | Lexmark International, Inc (Class A) | | | 11,023 | |
| | 10,900 | | | * | | LG Innotek Co Ltd | | | 867 | |
| | 243,382 | | | * | | LG.Philips LCD Co Ltd | | | 5,877 | |
| | 2,144,168 | | | | | Lite-On Technology Corp | | | 3,446 | |
| | 106,245 | | | | | Littelfuse, Inc | | | 9,873 | |
| | 177,925 | | | | | Logitech International S.A. | | | 2,443 | |
| | 69,000 | | | | | Lotes Co Ltd | | | 151 | |
| | 84,653 | | | | | LPKF Laser & Electronics AG. | | | 2,165 | |
| | 347,575 | | | | | Lumax International Corp Ltd | | | 837 | |
| | 33,700 | | | | | Macnica, Inc | | | 901 | |
| | 145,000 | | | | | Marubun Corp | | | 785 | |
| | 11,200 | | | e | | Maruwa Co Ltd | | | 378 | |
| | 89,219 | | | * | | Maxwell Technologies, Inc | | | 693 | |
| | 50,481 | | | * | | Measurement Specialties, Inc | | | 3,064 | |
| | 12,100 | | | e | | Melco Holdings, Inc | | | 156 | |
| | 128,993 | | | * | | Mercury Computer Systems, Inc | | | 1,412 | |
| | 10,909 | | | | | Mesa Laboratories, Inc | | | 857 | |
| | 133,613 | | | | | Methode Electronics, Inc | | | 4,568 | |
| | 2,667,000 | | | | | Micro-Star International Co Ltd | | | 2,172 | |
| | 211,000 | | | | | MIN AIK Technology Co Ltd | | | 1,201 | |
| | 865,500 | | | * | | Mitac Holdings Corp | | | 839 | |
| | 100,000 | | | e | | Mitsui Knowledge Industry Co Ltd | | | 146 | |
| | 237,100 | | | * | | Mitsumi Electric Co Ltd | | | 1,981 | |
| | 511,352 | | | | | Motorola, Inc | | | 34,516 | |
| | 50,297 | | | | | MTS Systems Corp | | | 3,584 | |
| | 35,367 | | | * | | Multi-Fineline Electronix, Inc | | | 491 | |
| | 581,408 | | | | | Murata Manufacturing Co Ltd | | | 51,707 | |
| | 327,000 | | | * | | Nan Ya Printed Circuit Board Corp | | | 410 | |
| | 1,150,000 | | | | | Nanjing Panda Electronics | | | 584 | |
| | 214,699 | | | | | National Instruments Corp | | | 6,875 | |
| | 616,130 | | | * | | NCR Corp | | | 20,985 | |
| | 1,440,382 | | | | | NEC Corp | | | 3,251 | |
| | 94,570 | | | *,e | | Neonode, Inc | | | 598 | |
| | 41,168 | | | e | | Neopost S.A. | | | 3,177 | |
| | 2,472,343 | | | | | NetApp, Inc | | | 101,712 | |
| | 149,970 | | | * | | Netgear, Inc | | | 4,940 | |
| | 86,526 | | | | | Newmax Technology Co Ltd | | | 187 | |
| | 156,661 | | | * | | Newport Corp | | | 2,831 | |
| | 91,926 | | | | | Nichicon Corp | | | 891 | |
| | 24,200 | | | | | Nidec Copal Electronics Corp | | | 142 | |
| | 1,448 | | | *,e | | Nimble Storage, Inc | | | 66 | |
| | 17,100 | | | e | | Nippon Ceramic Co Ltd | | | 267 | |
| | 152,000 | | | * | | Nippon Chemi-Con Corp | | | 586 | |
| | 1,731,019 | | | | | Nippon Electric Glass Co Ltd | | | 9,093 | |
| | 31,000 | | | | | Nohmi Bosai Ltd | | | 307 | |
| | 5,244,801 | | | * | | Nokia Corp | | | 42,535 | |
| | 7,004,841 | | | *,e | | Nokia Oyj | | | 56,599 | |
COLLEGE RETIREMENT EQUITIES FUND - Stock Account
| | | | | | | | VALUE | |
| SHARES | | | | | COMPANY | | (000) | |
| | 48,685 | | | | | Nolato AB (B Shares) | | $ | 1,111 | |
| | 37,027 | | | | | Nortel Networks Netas Telekomunikasyon AS | | | 93 | |
| | 55,173 | | | *,e | | Numerex Corp | | | 714 | |
| | 883,000 | | | * | | Oki Electric Industry Co Ltd | | | 2,087 | |
| | 752,272 | | | | | Omron Corp | | | 33,245 | |
| | 77,807 | | | * | | Oplink Communications, Inc | | | 1,447 | |
| | 17,052 | | | * | | OPTRON-TEC Inc | | | 174 | |
| | 160,000 | | | e | | Osaki Electric Co Ltd | | | 834 | |
| | 69,790 | | | * | | OSI Systems, Inc | | | 3,707 | |
| | 68,245 | | | | | Oxford Instruments plc | | | 2,000 | |
| | 736,815 | | | | | Pace plc | | | 3,891 | |
| | 73,985 | | | *,e | | Palo Alto Networks, Inc | | | 4,252 | |
| | 815,059 | | | | | Pan-International Industrial | | | 623 | |
| | 83,770 | | | | | Park Electrochemical Corp | | | 2,406 | |
| | 289,631 | | | *,e | | Parkervision, Inc | | | 1,318 | |
| | 8,171 | | | * | | Parrot S.A. | | | 223 | |
| | 57,412 | | | | | Partron Co Ltd | | | 777 | |
| | 577,000 | | | * | | PAX Global Technology Ltd | | | 233 | |
| | 46,455 | | | | | PC Connection, Inc | | | 1,154 | |
| | 74,389 | | | | | PC-Tel, Inc | | | 712 | |
| | 1,642,317 | | | | | Pegatron Technology Corp | | | 2,123 | |
| | 255,258 | | | | | Pinnacle Technology Holdings Ltd | | | 563 | |
| | 189,745 | | | | | Plantronics, Inc | | | 8,814 | |
| | 135,237 | | | * | | Plexus Corp | | | 5,854 | |
| | 498,367 | | | * | | Polycom, Inc | | | 5,597 | |
| | 206,000 | | | * | | Power Quotient International Co Ltd | | | 115 | |
| | 825,343 | | | | | Premier Farnell plc | | | 3,035 | |
| | 1,016,000 | | | | | Primax Electronics Ltd | | | 928 | |
| | 1,003,100 | | | * | | Prime View International Co Ltd | | | 552 | |
| | 76,619 | | | *,e | | Procera Networks, Inc | | | 1,151 | |
| | 6,913,000 | | | * | | PT Agis Tbk | | | 313 | |
| | 1,594,500 | | | | | PT Erajaya Swasembada Tbk | | | 131 | |
| | 349,954 | | | * | | QLogic Corp | | | 4,140 | |
| | 5,951,505 | | | | | Qualcomm, Inc | | | 441,899 | |
| | 2,657,032 | | | | | Quanta Computer, Inc | | | 6,214 | |
| | 1,100,000 | | | | | Quanta Storage, Inc | | | 1,138 | |
| | 815,079 | | | *,e | | Quantum Corp | | | 978 | |
| | 104,938 | | | *,e | | Rackable Systems, Inc | | | 1,407 | |
| | 94,441 | | | * | | Radisys Corp | | | 216 | |
| | 128,482 | | | *,e | | RealD, Inc | | | 1,097 | |
| | 37,087 | | | | | Redington India Ltd | | | 45 | |
| | 38,042 | | | | | Renishaw plc | | | 1,225 | |
| | 48,160 | | | | | Richardson Electronics Ltd | | | 547 | |
| | 699,878 | | | | | Ricoh Co Ltd | | | 7,443 | |
| | 43,700 | | | | | Riso Kagaku Corp | | | 899 | |
| | 3,588,000 | | | * | | Ritek Corp | | | 610 | |
| | 269,173 | | | *,e | | Riverbed Technology, Inc | | | 4,867 | |
| | 112,425 | | | * | | Rofin-Sinar Technologies, Inc | | | 3,038 | |
| | 64,069 | | | * | | Rogers Corp | | | 3,940 | |
COLLEGE RETIREMENT EQUITIES FUND - Stock Account
| | | | | | | | VALUE | |
| SHARES | | | | | COMPANY | | (000) | |
| | 11,200 | | | | | Roland DG Corp | | $ | 383 | |
| | 171,205 | | | * | | Ruckus Wireless, Inc | | | 2,431 | |
| | 86,800 | | | | | Ryosan Co Ltd | | | 1,846 | |
| | 89,500 | | | | | Ryoyo Electro Corp | | | 921 | |
| | 26,440 | | | | | Sam Young Electronics Co Ltd | | | 234 | |
| | 63,105 | | | | | Samsung Electro-Mechanics Co Ltd | | | 4,374 | |
| | 35,610 | | | | | Samsung SDI Co Ltd | | | 5,483 | |
| | 1,037,170 | | | | | SanDisk Corp | | | 73,162 | |
| | 279,413 | | | * | | Sandvine Corp | | | 779 | |
| | 325,689 | | | * | | Sanmina Corp | | | 5,439 | |
| | 33,200 | | | | | Sanshin Electronics Co Ltd | | | 230 | |
| | 96,933 | | | * | | Sapphire Technology Co Ltd | | | 3,431 | |
| | 128,514 | | | * | | Scansource, Inc | | | 5,453 | |
| | 1,442,864 | | | | | Seagate Technology, Inc | | | 81,031 | |
| | 264,171 | | | | | Seiko Epson Corp | | | 7,113 | |
| | 795,000 | | | | | Sercomm Corp | | | 1,366 | |
| | 12,421 | | | | | SFA Engineering Corp | | | 485 | |
| | 308,800 | | | * | | Shanghai Potevio Co Ltd | | | 197 | |
| | 370,300 | | | * | | Shenzhen SEG Co Ltd | | | 142 | |
| | 133,100 | | | * | | Shijiazhuang Baoshi Electronic Glass Co Ltd | | | 171 | |
| | 69,876 | | | | | Shimadzu Corp | | | 608 | |
| | 28,200 | | | | | Shinko Shoji Co Ltd | | | 235 | |
| | 268,727 | | | *,e | | ShoreTel, Inc | | | 2,494 | |
| | 37,711 | | | * | | Sierra Wireless, Inc | | | 912 | |
| | 18,400 | | | | | Siix Corp | | | 224 | |
| | 73,395 | | | | | Silitech Technology Corp | | | 88 | |
| | 298,112 | | | | | Simplo Technology Co Ltd | | | 1,323 | |
| | 787,000 | | | | | Sinbon Electronics Co Ltd | | | 1,057 | |
| | 6,498 | | | | | Sindoh Co Ltd | | | 424 | |
| | 1,089,000 | | | * | | Sintek Photronic Corp | | | 326 | |
| | 329,000 | | | | | Sirtec International Co Ltd | | | 622 | |
| | 17,642 | | | | | S-MAC Co Ltd/Korea | | | 191 | |
| | 189,000 | | | | | SMK Corp | | | 1,251 | |
| | 837,254 | | | * | | Sonus Networks, Inc | | | 2,637 | |
| | 186,839 | | | | | Spectris plc | | | 7,939 | |
| | 161,799 | | | * | | Speed Commerce, Inc | | | 756 | |
| | 837,437 | | | | | Spirent Communications plc | | | 1,444 | |
| | 264,900 | | | *,e | | Stratasys Ltd | | | 35,682 | |
| | 912,000 | | | e | | Sunny Optical Technology Group Co Ltd | | | 889 | |
| | 126,514 | | | * | | Super Micro Computer, Inc | | | 2,171 | |
| | 14,356 | | | * | | Suprema, Inc | | | 289 | |
| | 656,686 | | | * | | SVA Electron Co Ltd | | | 312 | |
| | 114,055 | | | *,e | | Synaptics, Inc | | | 5,909 | |
| | 131,916 | | | * | | SYNNEX Corp | | | 8,891 | |
| | 1,302,523 | | | | | Synnex Technology International Corp | | | 2,068 | |
| | 203,972 | | | | | Taiflex Scientific Co Ltd | | | 412 | |
| | 831,577 | | | | | Taiwan PCB Techvest Co Ltd | | | 994 | |
| | 151,303 | | | | | Taiyo Yuden Co Ltd | | | 1,977 | |
COLLEGE RETIREMENT EQUITIES FUND - Stock Account
| | | | | | | | VALUE | |
| SHARES | | | | | COMPANY | | (000) | |
| | 1,031,000 | | | * | | TCL Communication Technology Holdings Ltd | | $ | 1,057 | |
| | 128,776 | | | | | TDK Corp | | | 6,178 | |
| | 74,416 | | | * | | Tech Data Corp | | | 3,840 | |
| | 1,354,000 | | | * | | Tech Pro Technology Development Ltd | | | 662 | |
| | 21,690 | | | | | Tessco Technologies, Inc | | | 875 | |
| | 354,095 | | | | | Test Research, Inc | | | 494 | |
| | 350,773 | | | * | | Thin Film Electronics ASA | | | 344 | |
| | 107,000 | | | *,e | | Toko, Inc | | | 364 | |
| | 545,625 | | | | | Tong Hsing Electronic Industries Ltd | | | 2,531 | |
| | 7,860,000 | | | | | Tongda Group Holdings Ltd | | | 529 | |
| | 81,200 | | | | | Topcon Corp | | | 1,233 | |
| | 168,000 | | | | | Toshiba TEC Corp | | | 1,166 | |
| | 27,400 | | | | | Toyo Corp/Chuo-ku | | | 283 | |
| | 251,688 | | | | | TPK Holding Co Ltd | | | 1,489 | |
| | 1,292,000 | | | | | Tpv Technology Ltd | | | 267 | |
| | 430,473 | | | * | | Trimble Navigation Ltd | | | 14,937 | |
| | 281,932 | | | | | Tripod Technology Corp | | | 506 | |
| | 5,650,566 | | | e | | Truly International Holdings | | | 3,043 | |
| | 201,216 | | | | | TT electronics plc | | | 657 | |
| | 204,418 | | | * | | TTM Technologies, Inc | | | 1,754 | |
| | 512,039 | | | | | TXC Corp | | | 621 | |
| | 167,000 | | | | | Tyco Electronics Ltd | | | 9,203 | |
| | 138,900 | | | *,e | | Ubiquiti Networks, Inc | | | 6,384 | |
| | 211,200 | | | | | Uchi Technologies BHD | | | 88 | |
| | 11,326 | | | | | Uju Electronics Co Ltd | | | 173 | |
| | 1,240,256 | | | | | Unimicron Technology Corp | | | 942 | |
| | 29,927 | | | *,e | | Uni-Pixel, Inc | | | 300 | |
| | 253,937 | | | * | | Unitech Printed Circuit Board Corp | | | 102 | |
| | 126,563 | | | *,e | | Universal Display Corp | | | 4,349 | |
| | 393,795 | | | | | Venture Corp Ltd | | | 2,397 | |
| | 129,378 | | | * | | Viasat, Inc | | | 8,106 | |
| | 10,673 | | | *,e | | Viasystems Group, Inc | | | 146 | |
| | 44,675 | | | *,e | | Violin Memory, Inc | | | 177 | |
| | 1,138,531 | | | * | | Vishay Intertechnology, Inc | | | 15,097 | |
| | 49,723 | | | * | | Vishay Precision Group, Inc | | | 740 | |
| | 61,257 | | | | | Vivotek, Inc | | | 380 | |
| | 2,342,800 | | | | | VST Holdings Ltd | | | 596 | |
| | 204,700 | | | e | | Vtech Holdings Ltd | | | 2,659 | |
| | 176,800 | | | | | Wacom Co Ltd | | | 1,243 | |
| | 2,215,767 | | | | | Wah Lee Industrial Corp | | | 3,525 | |
| | 476,769 | | | * | | Walsin Technology Corp | | | 128 | |
| | 1,016,000 | | | | | Wasion Group Holdings Ltd | | | 622 | |
| | 436,800 | | | | | Weikeng Industrial Co Ltd | | | 337 | |
| | 144,490 | | | * | | Westell Technologies, Inc | | | 585 | |
| | 1,215,669 | | | | | Western Digital Corp | | | 101,995 | |
| | 142,800 | | | e | | Wi-Lan, Inc | | | 477 | |
| | 84,609 | | | | | Wincor Nixdorf AG. | | | 5,873 | |
| | 2,238,500 | | | * | | Wintek Corp | | | 784 | |
COLLEGE RETIREMENT EQUITIES FUND - Stock Account
| | | | | | | | VALUE | |
| SHARES | | | | | COMPANY | | (000) | |
| | 2,341,523 | | | | | Wistron Corp | | $ | 1,972 | |
| | 642,265 | | | | | Wistron NeWeb Corp | | | 1,673 | |
| | 1,409,283 | | | | | WPG Holdings Co Ltd | | | 1,624 | |
| | 747,679 | | | | | WT Microelectronics Co Ltd | | | 885 | |
| | 100,000 | | | | | Xaar plc | | | 1,859 | |
| | 6,184,965 | | | e | | Xerox Corp | | | 75,271 | |
| | 15,750 | | | *,m | | Ya Hsin Industrial Co Ltd | | | 0 | ^ |
| | 1,549,100 | | | * | | Yageo Corp | | | 560 | |
| | 74,993 | | | | | Yamatake Corp | | | 1,748 | |
| | 169,190 | | | | | Yaskawa Electric Corp | | | 2,681 | |
| | 164,085 | | | | | Yokogawa Electric Corp | | | 2,523 | |
| | 141,000 | | | | | Young Fast Optoelectronics Co Ltd | | | 151 | |
| | 119,066 | | | * | | Zebra Technologies Corp (Class A) | | | 6,439 | |
| | 223,855 | | | | | Zhen Ding Technology Holding Ltd | | | 540 | |
| | 229,000 | | | | | Zinwell Corp | | | 267 | |
| | 718,047 | | | *,e | | ZTE Corp | | | 1,431 | |
| | 68,292 | | | * | | Zygo Corp | | | 1,009 | |
| | 411,000 | | | * | | Zyxel Communications | | | 258 | |
| | | | | | | TOTAL TECHNOLOGY HARDWARE & EQUIPMENT | | | 6,159,587 | |
| | | | | | | | | | | |
| TELECOMMUNICATION SERVICES - 2.6% | | | | |
| | 373,304 | | | *,e | | 8x8, Inc | | | 3,793 | |
| | 1,497,400 | | | | | Advanced Info Service PCL | | | 9,132 | |
| | 247,474 | | | e | | AFK Sistema (GDR) | | | 7,964 | |
| | 469,648 | | | | | Amcon Telecommunications Ltd | | | 917 | |
| | 56,729,130 | | | | | America Movil S.A. de C.V. (Series L) | | | 66,129 | |
| | 938,000 | | | | | Asia Pacific Telecom Co Ltd | | | 487 | |
| | 14,089,913 | | | | | AT&T, Inc | | | 495,401 | |
| | 28,400 | | | | | Atlantic Tele-Network, Inc | | | 1,607 | |
| | 456,218 | | | *,e | | Avanti Communications Group plc | | | 1,868 | |
| | 1,308,000 | | | *,e | | Axtel SAB de CV | | | 469 | |
| | 618,830 | | | e | | BCE, Inc | | | 26,798 | |
| | 525,331 | | | | | Belgacom S.A. | | | 15,546 | |
| | 184,654 | | | e | | Bell Aliant Regional Communications Income Fund | | | 4,647 | |
| | 8,023,572 | | | | | Bezeq Israeli Telecommunication Corp Ltd | | | 13,607 | |
| | 1,143,629 | | | | | Bharti Airtel Ltd | | | 6,114 | |
| | 75,956 | | | *,e | | Boingo Wireless, Inc | | | 487 | |
| | 14,143,007 | | | | | BT Group plc | | | 89,185 | |
| | 4,121,180 | | | | | Cable & Wireless plc | | | 3,845 | |
| | 165,570 | | | * | | Cbeyond Communications, Inc | | | 1,142 | |
| | 165,319 | | | | | Cellcom Israel Ltd | | | 2,278 | |
| | 1,086,912 | | | | | CenturyTel, Inc | | | 34,618 | |
| | 3,385,421 | | | | | China Communications Services Corp Ltd | | | 2,099 | |
| | 9,713,390 | | | | | China Mobile Hong Kong Ltd | | | 101,178 | |
| | 15,533,289 | | | | | China Telecom Corp Ltd | | | 7,848 | |
| | 6,193,301 | | | e | | China Unicom Ltd | | | 9,309 | |
| | 512,885 | | | e | | Chorus Ltd | | | 608 | |
| | 8,605,137 | | | | | Chunghwa Telecom Co Ltd | | | 26,863 | |
COLLEGE RETIREMENT EQUITIES FUND - Stock Account
| | | | | | | | VALUE | |
| SHARES | | | | | COMPANY | | (000) | |
| | 792,833 | | | * | | Cincinnati Bell, Inc | | $ | 2,822 | |
| | 1,970,000 | | | e | | Citic 1616 Holdings Ltd | | | 634 | |
| | 3,282,000 | | | * | | Citic 21CN Co Ltd | | | 237 | |
| | 149,989 | | | | | Cogent Communications Group, Inc | | | 6,061 | |
| | 520,850 | | | * | | Colt Telecom Group S.A. | | | 1,107 | |
| | 151,747 | | | e | | Consolidated Communications Holdings, Inc | | | 2,979 | |
| | 972,717 | | | * | | Crown Castle International Corp | | | 71,427 | |
| | 1,988,251 | | | | | Deutsche Telekom AG. | | | 34,258 | |
| | 5,110,900 | | | | | Digi.Com BHD | | | 7,745 | |
| | 160,674 | | | | | Drillisch AG. | | | 4,662 | |
| | 49,028 | | | | | Elisa Oyj (Series A) | | | 1,299 | |
| | 224,589 | | | | | Empresa Nacional de Telecomunicaciones S.A. | | | 3,048 | |
| | 77,064 | | | *,e | | Fairpoint Communications, Inc | | | 872 | |
| | 1,692,919 | | | | | Far EasTone Telecommunications Co Ltd | | | 3,719 | |
| | 1,172,226 | | | | | France Telecom S.A. | | | 14,553 | |
| | 270,878 | | | | | Freenet AG. | | | 8,139 | |
| | 1,404,131 | | | e | | Frontier Communications Corp | | | 6,529 | |
| | 106,403 | | | * | | General Communication, Inc (Class A) | | | 1,186 | |
| | 31,245 | | | | | Globe Telecom, Inc | | | 1,157 | |
| | 35,307 | | | *,e | | Hawaiian Telcom Holdco, Inc | | | 1,037 | |
| | 1,308,140 | | | * | | Hellenic Telecommunications Organization S.A. | | | 17,423 | |
| | 42,705 | | | | | HickoryTech Corp | | | 548 | |
| | 1,834,593 | | | e | | HKT Trust and HKT Ltd | | | 1,815 | |
| | 1,970,651 | | | e | | Hutchison Telecommunications Hong Kong Holdings Ltd | | | 748 | |
| | 961,300 | | | | | Idea Cellular Ltd | | | 2,598 | |
| | 127,425 | | | | | IDT Corp (Class B) | | | 2,277 | |
| | 477,363 | | | e | | iiNET Ltd | | | 2,783 | |
| | 2,841 | | | | | Iliad S.A. | | | 582 | |
| | 176,313 | | | * | | inContact, Inc | | | 1,377 | |
| | 147,876 | | | | | Inmarsat plc | | | 1,854 | |
| | 210,231 | | | | | Inteliquent, Inc | | | 2,401 | |
| | 44,400 | | | *,e | | Intelsat S.A. | | | 1,001 | |
| | 239,670 | | | *,e | | Iridium Communications, Inc | | | 1,500 | |
| | 5,225,500 | | | | | Jasmine International PCL | | | 1,071 | |
| | 156,700 | | | | | Jaymart PCL | | | 96 | |
| | 517,592 | | | * | | Jazztel plc | | | 5,546 | |
| | 1,098,064 | | | | | Kcom Group plc | | | 1,791 | |
| | 575,050 | | | | | KDDI Corp | | | 35,432 | |
| | 237,942 | | | | | KT Corp | | | 7,128 | |
| | 204,085 | | | *,e | | Leap Wireless International, Inc | | | 3,551 | |
| | 29,374 | | | | | Let’s GOWEX SA | | | 527 | |
| | 1,620,140 | | | *,e | | Level 3 Communications, Inc | | | 53,740 | |
| | 246,326 | | | * | | LG Telecom Ltd | | | 2,511 | |
| | 50,575 | | | | | Lumos Networks Corp | | | 1,062 | |
| | 188,488 | | | e | | M2 Telecommunications Group Ltd | | | 1,058 | |
| | 492,398 | | | e | | Magyar Telekom | | | 716 | |
| | 50,774 | | | e | | Manitoba Telecom Services, Inc | | | 1,419 | |
| | 2,399,000 | | | | | Maxis BHD | | | 5,328 | |
COLLEGE RETIREMENT EQUITIES FUND - Stock Account
| | | | | | | | VALUE | |
| SHARES | | | | | COMPANY | | (000) | |
| | 76,141 | | | | | MegaFon OAO (ADR) | | $ | 2,555 | |
| | 1,076,424 | | | * | | Midas S.A. | | | 235 | |
| | 38,072 | | | | | Millicom International Cellular S.A. | | | 3,794 | |
| | 824,638 | | | | | Mobile TeleSystems (ADR) | | | 17,837 | |
| | 947,809 | | | e | | MobileOne Ltd | | | 2,461 | |
| | 40,222 | | | | | Mobistar S.A. | | | 765 | |
| | 2,736,135 | | | | | MTN Group Ltd | | | 56,669 | |
| | 780,341 | | | * | | Netia S.A. | | | 1,358 | |
| | 160,920 | | | *,e | | NEXTDC Ltd | | | 311 | |
| | 668,028 | | | *,e | | NII Holdings, Inc (Class B) | | | 1,837 | |
| | 788,511 | | | | | Nippon Telegraph & Telephone Corp | | | 42,470 | |
| | 138,252 | | | | | NTELOS Holdings Corp | | | 2,797 | |
| | 1,434,400 | | | | | NTT DoCoMo, Inc | | | 23,619 | |
| | 825,985 | | | | | Oi S.A.(Preference) | | | 1,257 | |
| | 3,166,553 | | | * | | Orascom Telecom Holding SAE | | | 2,164 | |
| | 4,830,036 | | | | | Orascom Telecom Media And Technology Holding SAE | | | 538 | |
| | 146,238 | | | * | | Orbcomm, Inc | | | 927 | |
| | 99,318 | | | * | | Partner Communications | | | 927 | |
| | 9,028,161 | | | | | PCCW Ltd | | | 4,040 | |
| | 46,557 | | | | | Philippine Long Distance Telephone Co | | | 2,801 | |
| | 932,961 | | | e | | Portugal Telecom SGPS S.A. | | | 4,062 | |
| | 203,045 | | | * | | Premiere Global Services, Inc | | | 2,353 | |
| | 2,515,500 | | | | | PT Excelcomindo Pratama | | | 1,076 | |
| | 55,076 | | | | | PT Indosat Tbk | | | 19 | |
| | 52,527,605 | | | | | PT Telekomunikasi Indonesia Persero Tbk | | | 9,297 | |
| | 109,837 | | | e | | QSC AG. | | | 649 | |
| | 578,093 | | | * | | Reliance Communication Ventures Ltd | | | 1,218 | |
| | 25,811 | | | *,e | | RingCentral, Inc | | | 474 | |
| | 486,717 | | | e | | Rogers Communications, Inc (Class B) | | | 22,025 | |
| | 259,824 | | | e | | Rostelecom (ADR) | | | 5,372 | |
| | 1,029,661 | | | * | | Royal KPN NV | | | 3,327 | |
| | 150,000 | | | | | Samart Telcoms PCL | | | 59 | |
| | 820,440 | | | * | | SBA Communications Corp (Class A) | | | 73,708 | |
| | 87,617 | | | | | Shenandoah Telecom Co | | | 2,249 | |
| | 7,643,773 | | | e | | Singapore Telecommunications Ltd | | | 22,229 | |
| | 185,866 | | | * | | SK Broadband Co Ltd | | | 772 | |
| | 58,567 | | | | | SK Telecom Co Ltd | | | 12,817 | |
| | 473,966 | | | e | | SmarTone Telecommunications Holding Ltd | | | 542 | |
| | 2,169,132 | | | | | Softbank Corp | | | 190,343 | |
| | 205,680 | | | | | Sonaecom - SGPS S.A. | | | 728 | |
| | 1,459,823 | | | * | | Sprint Corp | | | 15,693 | |
| | 502,924 | | | e | | StarHub Ltd | | | 1,714 | |
| | 51,142 | | | * | | Straight Path Communications, Inc | | | 419 | |
| | 48,883 | | | | | Swisscom AG. | | | 25,834 | |
| | 1,770,543 | | | | | Taiwan Mobile Co Ltd | | | 5,723 | |
| | 646,168 | | | | | TalkTalk Telecom Group plc | | | 3,281 | |
| | 3,983,244 | | | | | TDC AS | | | 38,637 | |
| | 296,686 | | | | | Tele2 AB | | | 3,370 | |
COLLEGE RETIREMENT EQUITIES FUND - Stock Account
| | | | | | | | VALUE | |
| SHARES | | | | | COMPANY | | (000) | |
| | 2,187,752 | | | e | | Telecom Corp of New Zealand Ltd | | $ | 4,153 | |
| | 414,835 | | | | | Telecom Egypt | | | 885 | |
| | 8,052,492 | | | | | Telecom Italia RSP | | | 6,318 | |
| | 6,603,662 | | | | | Telecom Italia S.p.A. | | | 6,585 | |
| | 536,917 | | | | | Telefonica Brasil S.A. | | | 10,184 | |
| | 934,764 | | | | | Telefonica Deutschland Holding AG. | | | 7,725 | |
| | 381,072 | | | | | Telefonica O2 Czech Republic AS | | | 5,661 | |
| | 3,867,987 | | | | | Telefonica S.A. | | | 63,245 | |
| | 26,389 | | | | | Telekom Austria AG. | | | 200 | |
| | 4,283,400 | | | | | Telekom Malaysia BHD | | | 7,260 | |
| | 777,518 | | | * | | Telekomunikacja Polska S.A. | | | 2,522 | |
| | 1,267,457 | | | | | Telenor ASA | | | 30,284 | |
| | 890,053 | | | | | Telephone & Data Systems, Inc | | | 22,946 | |
| | 5,111,059 | | | | | TeliaSonera AB | | | 42,628 | |
| | 305,847 | | | * | | Telkom S.A. Ltd | | | 818 | |
| | 9,879,379 | | | | | Telstra Corp Ltd | | | 46,370 | |
| | 249,658 | | | | | TELUS Corp | | | 8,593 | |
| | 625,000 | | | | | Thaicom PCL | | | 775 | |
| | 944,708 | | | | | Tim Participacoes S.A. | | | 4,943 | |
| | 754,720 | | | * | | Time dotCom BHD | | | 818 | |
| | 2,751,400 | | | | | TM International BHD | | | 5,802 | |
| | 5,562,544 | | | * | | T-Mobile US, Inc | | | 187,124 | |
| | 170,000 | | | | | Total Access Communication PCL (NVDR) | | | 504 | |
| | 1,095,500 | | | | | Tower Bersama Infrastructure | | | 523 | |
| | 221,736 | | | *,e | | Towerstream Corp | | | 656 | |
| | 808,163 | | | | | TPG Telecom Ltd | | | 3,854 | |
| | 5,802,900 | | | * | | True Corp PCL | | | 1,332 | |
| | 523,153 | | | | | Turk Telekomunikasyon AS | | | 1,451 | |
| | 908,082 | | | * | | Turkcell Iletisim Hizmet AS | | | 4,813 | |
| | 126,081 | | | * | | tw telecom inc (Class A) | | | 3,842 | |
| | 60,380 | | | | | US Cellular Corp | | | 2,525 | |
| | 97,107 | | | | | USA Mobility, Inc | | | 1,387 | |
| | 11,403,254 | | | | | Verizon Communications, Inc | | | 560,356 | |
| | 1,842,095 | | | | | Vivendi Universal S.A. | | | 48,590 | |
| | 904,932 | | | e | | Vodacom Group Pty Ltd | | | 11,473 | |
| | 71,086,520 | | | | | Vodafone Group plc | | | 279,881 | |
| | 1,092,376 | | | | | Vodafone Group plc (ADR) | | | 42,941 | |
| | 601,896 | | | * | | Vonage Holdings Corp | | | 2,004 | |
| | 1,339,313 | | | e | | Windstream Holdings, Inc | | | 10,688 | |
| | 307,822 | | | | | Ziggo NV | | | 14,076 | |
| | | | | | | TOTAL TELECOMMUNICATION SERVICES | | | 3,339,380 | |
| | | | | | | | | | | |
| TRANSPORTATION - 2.5% | | | | |
| | 529,357 | | | | | Abertis Infraestructuras S.A. (Continuous) | | | 11,774 | |
| | 26,423 | | | | | Aeroports de Paris | | | 3,000 | |
| | 53,088 | | | *,e | | Air Berlin plc | | | 121 | |
| | 8,081,300 | | | e | | Air China Ltd | | | 6,051 | |
| | 46,514 | | | *,e | | Air France-KLM | | | 486 | |
COLLEGE RETIREMENT EQUITIES FUND - Stock Account
| | | | | | | | VALUE | |
| SHARES | | | | | COMPANY | | (000) | |
| | 2,101,213 | | | e | | Air New Zealand Ltd | | $ | 2,837 | |
| | 202,390 | | | * | | Air Transport Services Group, Inc | | | 1,637 | |
| | 2,759,500 | | | | | AirAsia BHD | | | 1,856 | |
| | 587,300 | | | * | | AirAsia X BHD | | | 179 | |
| | 1,502,600 | | | | | Airports of Thailand PCL | | | 7,273 | |
| | 299,870 | | | | | Alaska Air Group, Inc | | | 22,001 | |
| | 500,052 | | | | | All America Latina Logistica S.A. | | | 1,398 | |
| | 507,831 | | | e | | All Nippon Airways Co Ltd | | | 1,015 | |
| | 47,366 | | | * | | Allegiant Travel Co | | | 4,994 | |
| | 46,082 | | | * | | Amerco, Inc | | | 10,960 | |
| | 839,975 | | | *,e | | American Airlines Group, Inc | | | 21,209 | |
| | 634,771 | | | *,b,m | | AMR Corp (Escrow) | | | 7,406 | |
| | 624,000 | | | | | Anhui Expressway Co | | | 346 | |
| | 2,373,729 | | | | | Ansaldo STS S.p.A. | | | 25,594 | |
| | 1,220 | | | | | AP Moller - Maersk AS (Class A) | | | 12,567 | |
| | 4,156 | | | | | AP Moller - Maersk AS (Class B) | | | 44,976 | |
| | 99,954 | | | | | Arkansas Best Corp | | | 3,366 | |
| | 693,417 | | | | | Asciano Group | | | 3,575 | |
| | 228,710 | | | * | | Asiana Airlines | | | 1,070 | |
| | 101,453 | | | * | | Atlas Air Worldwide Holdings, Inc | | | 4,175 | |
| | 1,699,759 | | | | | Auckland International Airport Ltd | | | 4,936 | |
| | 80,073 | | | | | Autostrada Torino-Milano S.p.A. | | | 1,267 | |
| | 604,500 | | | e | | Autostrade S.p.A. | | | 13,541 | |
| | 200,000 | | | | | Avianca Holdings S.A. | | | 383 | |
| | 25,000 | | | * | | Avianca Holdings S.A. (ADR) | | | 386 | |
| | 275,310 | | | * | | Avis Budget Group, Inc | | | 11,128 | |
| | 870,100 | | | | | Bangkok Expressway PCL | | | 890 | |
| | 7,400,000 | | | * | | Bangkok Metro PCL | | | 229 | |
| | 810,670 | | | | | BBA Aviation plc | | | 4,314 | |
| | 2,486,400 | | | e | | Beijing Capital International Airport Co Ltd | | | 1,952 | |
| | 71,058 | | | | | bpost S.A. | | | 1,392 | |
| | 4,519,707 | | | * | | British Airways plc | | | 30,114 | |
| | 1,042,128 | | | * | | Brockman Mining Ltd | | | 70 | |
| | 32,429,600 | | | | | BTS Group Holdings PCL | | | 8,611 | |
| | 4,906,000 | | | | | BTS Group Holdings PCL (Foreign) | | | 1,303 | |
| | 1,476,870 | | | e | | Canadian National Railway Co | | | 84,198 | |
| | 181,529 | | | | | Canadian Pacific Railway Ltd | | | 27,469 | |
| | 1,014,532 | | | e | | Canadian Pacific Railway Ltd (Toronto) | | | 153,433 | |
| | 3,311,830 | | | e | | Cathay Pacific Airways Ltd | | | 7,017 | |
| | 240,240 | | | | | Cebu Air, Inc | | | 254 | |
| | 73,373 | | | | | Celadon Group, Inc | | | 1,429 | |
| | 208,200 | | | | | Central Japan Railway Co | | | 24,537 | |
| | 179,769 | | | e | | CH Robinson Worldwide, Inc | | | 10,488 | |
| | 1,654,715 | | | * | | China Airlines | | | 609 | |
| | 1,283,324 | | | | | China Merchants Holdings International Co Ltd | | | 4,701 | |
COLLEGE RETIREMENT EQUITIES FUND - Stock Account
| | | | | | | | VALUE | |
| SHARES | | | | | COMPANY | | (000) | |
| | 5,388,000 | | | *,e | | China Shipping Container Lines Co Ltd | | $ | 1,409 | |
| | 3,569,000 | | | *,e | | China Shipping Development Co Ltd | | | 2,781 | |
| | 95,500 | | | e | | China Southern Airlines Co Ltd | | | 37 | |
| | 13,300,000 | | | *,e | | China Timber Resources Group Ltd | | | 584 | |
| | 254,000 | | | | | Chinese Maritime Transport Ltd | | | 345 | |
| | 986,248 | | | | | Cia de Concessoes Rodoviarias | | | 7,449 | |
| | 69,200 | | | | | Cia de Locacao das Americas | | | 207 | |
| | 20,368 | | | e | | Clarkson plc | | | 675 | |
| | 2,996,710 | | | | | ComfortDelgro Corp Ltd | | | 4,792 | |
| | 12,985 | | | | | Compagnie Maritime Belge S.A. | | | 404 | |
| | 8,170,245 | | | * | | Compania SudAmericana de Vapores S.A. | | | 430 | |
| | 672,414 | | | | | Con-Way, Inc | | | 26,702 | |
| | 213,233 | | | | | Copa Holdings S.A. (Class A) | | | 34,141 | |
| | 3,253,575 | | | *,e | | COSCO Holdings | | | 1,591 | |
| | 4,720,707 | | | | | COSCO Pacific Ltd | | | 6,498 | |
| | 350,000 | | | | | Costamare, Inc | | | 6,394 | |
| | 2,475,100 | | | | | CSX Corp | | | 71,209 | |
| | 293,000 | | | | | CWT Ltd | | | 315 | |
| | 33,566 | | | | | D/S Norden | | | 1,767 | |
| | 173,000 | | | *,e | | Daiichi Chuo Kisen Kaisha | | | 204 | |
| | 314,315 | | | | | Dart Group plc | | | 1,280 | |
| | 892,050 | | | | | Dazhong Transportation Group Co Ltd | | | 592 | |
| | 5,839,822 | | | | | Delta Air Lines, Inc | | | 160,420 | |
| | 220,375 | | | * | | Deutsche Lufthansa AG. | | | 4,671 | |
| | 1,949,794 | | | | | Deutsche Post AG. | | | 71,216 | |
| | 19,585 | | | | | Dfds AS | | | 1,578 | |
| | 135,979 | | | | | DSV AS | | | 4,464 | |
| | 559,325 | | | | | East Japan Railway Co | | | 44,555 | |
| | 1,522,417 | | | | | easyJet plc | | | 38,802 | |
| | 63,095 | | | *,e | | Echo Global Logistics, Inc | | | 1,355 | |
| | 177,134 | | | | | EcoRodovias Infraestrutura e Logistica S.A. | | | 1,115 | |
| | 1,014,519 | | | * | | Eva Airways Corp | | | 566 | |
| | 294,000 | | | | | Evergreen International Storage & Transport Corp | | | 206 | |
| | 1,703,222 | | | * | | Evergreen Marine Corp Tawain Ltd | | | 1,041 | |
| | 7,300 | | | e | | Exchange Income Corp | | | 155 | |
| | 736,037 | | | | | Expeditors International of Washington, Inc | | | 32,570 | |
| | 1,983,757 | | | | | FedEx Corp | | | 285,205 | |
| | 1,459,329 | | | | | Firstgroup plc | | | 2,992 | |
| | 22,304 | | | | | Flughafen Wien AG. | | | 1,872 | |
| | 4,711 | | | | | Flughafen Zuerich AG. | | | 2,755 | |
| | 155,278 | | | | | Forward Air Corp | | | 6,818 | |
| | 31,334 | | | | | Fraport AG. Frankfurt Airport Services Worldwide | | | 2,348 | |
| | 278,083 | | | | | Freightways Ltd | | | 1,081 | |
| | 163,000 | | | e | | Fukuyama Transporting Co Ltd | | | 895 | |
| | 6,917 | | | | | Gateway Distriparks Ltd | | | 16 | |
| | 88,772 | | | * | | Genesee & Wyoming, Inc (Class A) | | | 8,527 | |
| | 15,408 | | | | | GLOVIS Co Ltd | | | 3,377 | |
COLLEGE RETIREMENT EQUITIES FUND - Stock Account
| | | | | | | | VALUE | |
| SHARES | | | | | COMPANY | | (000) | |
| | 85,745 | | | | | Go-Ahead Group plc | | $ | 2,502 | |
| | 161,706 | | | * | | Gol Linhas Aereas Inteligentes S.A. | | | 724 | |
| | 373,470 | | | e | | Golden Ocean Group Ltd | | | 899 | |
| | 570,602 | | | | | Grindrod Ltd | | | 1,525 | |
| | 413,473 | | | | | Groupe Eurotunnel S.A. | | | 4,347 | |
| | 485,500 | | | *,e | | Grupo Aeromexico SAB de C.V. | | | 668 | |
| | 209,900 | | | e | | Grupo Aeroportuario del Centro Norte Sab de C.V. | | | 703 | |
| | 910,091 | | | | | Grupo Aeroportuario del Pacifico S.A. de C.V. (B Shares) | | | 4,865 | |
| | 540,700 | | | e | | Grupo Aeroportuario del Sureste S.A. de C.V. (Class B) | | | 6,760 | |
| | 303,560 | | | | | Guangdong Provincial Expressway Development Co Ltd | | | 101 | |
| | 1,700,000 | | | | | Guangshen Railway Co Ltd | | | 789 | |
| | 1,214,000 | | | e | | GZI Transportation Ltd | | | 636 | |
| | 132,000 | | | | | Hainan Meilan International Airport Co Ltd | | | 131 | |
| | 33,821 | | | | | Hamburger Hafen und Logistik AG. | | | 828 | |
| | 40,762 | | | * | | Hanjin Kal Corp | | | 633 | |
| | 119,890 | | | * | | Hanjin Shipping Co Ltd | | | 872 | |
| | 4,330 | | | | | Hanjin Transportation Co Ltd | | | 78 | |
| | 180,000 | | | | | Hankyu Hanshin Holdings, Inc | | | 973 | |
| | 200,928 | | | *,e | | Hawaiian Holdings, Inc | | | 1,935 | |
| | 243,440 | | | | | Heartland Express, Inc | | | 4,776 | |
| | 4,141,374 | | | * | | Hertz Global Holdings, Inc | | | 118,526 | |
| | 52,200 | | | | | Hitachi Transport System Ltd | | | 780 | |
| | 1,496,327 | | | e | | Hopewell Highway Infrastructure Ltd | | | 712 | |
| | 173,641 | | | * | | Hub Group, Inc (Class A) | | | 6,925 | |
| | 4,765,040 | | | e | | Hutchison Port Holdings Trust | | | 3,220 | |
| | 52,841 | | | * | | Hyundai Merchant Marine Co Ltd | | | 572 | |
| | 203,757 | | | | | Iino Kaiun Kaisha Ltd | | | 1,261 | |
| | 4,254 | | | * | | Integer.pl S.A. | | | 455 | |
| | 1,157,673 | | | * | | International Consolidated Airlines | | | 7,712 | |
| | 2,266,150 | | | | | International Container Term Services, Inc | | | 5,217 | |
| | 22,576 | | | | | International Shipholding Corp | | | 666 | |
| | 31,636 | | | | | Irish Continental Group plc | | | 1,151 | |
| | 629,889 | | | | | J.B. Hunt Transport Services, Inc | | | 48,690 | |
| | 218,800 | | | | | Japan Airlines Co Ltd | | | 10,794 | |
| | 43,155 | | | | | Japan Airport Terminal Co Ltd | | | 977 | |
| | 106,137 | | | * | | Jet Airways India Ltd | | | 502 | |
| | 903,936 | | | *,e | | JetBlue Airways Corp | | | 7,729 | |
| | 1,667,800 | | | e | | Jiangsu Express | | | 2,050 | |
| | 166,000 | | | | | Jinzhou Port Co Ltd | | | 67 | |
| | 99,500 | | | | | Julio Simoes Logistica S.A. | | | 677 | |
| | 515,587 | | | | | Kamigumi Co Ltd | | | 4,731 | |
| | 695,786 | | | | | Kansas City Southern Industries, Inc | | | 86,159 | |
| | 3,170,400 | | | | | Kawasaki Kisen Kaisha Ltd | | | 8,030 | |
| | 373,555 | | | e | | Keihin Electric Express Railway Co Ltd | | | 3,080 | |
| | 91,107 | | | | | Keio Corp | | | 607 | |
| | 39,032 | | | | | Keisei Electric Railway Co Ltd | | | 359 | |
| | 607,537 | | | * | | Kerry Logistics Network Ltd | | | 863 | |
| | 1,344,185 | | | | | Kintetsu Corp | | | 4,717 | |
COLLEGE RETIREMENT EQUITIES FUND - Stock Account
| | | | | | | | VALUE | |
| SHARES | | | | | COMPANY | | (000) | |
| | 19,400 | | | | | Kintetsu World Express, Inc | | $ | 781 | |
| | 162,451 | | | * | | Kirby Corp | | | 16,123 | |
| | 199,699 | | | | | Knight Transportation, Inc | | | 3,662 | |
| | 25,460 | | | * | | Korean Air Lines Co Ltd | | | 757 | |
| | 20,644 | | | | | Kuehne & Nagel International AG. | | | 2,713 | |
| | 300,381 | | | | | Lan Airlines S.A. | | | 4,736 | |
| | 170,393 | | | * | | Landstar System, Inc | | | 9,789 | |
| | 165,000 | | | e | | Latam Airlines Group S.A. (ADR) | | | 2,691 | |
| | 1,329,232 | | | * | | LLX Logistica S.A. | | | 609 | |
| | 287,771 | | | | | Localiza Rent A Car | | | 4,059 | |
| | 42,200 | | | * | | Log-in Logistica Intermodal S.A. | | | 147 | |
| | 1,032,480 | | | e | | Macquarie Atlas Roads Group | | | 2,541 | |
| | 153,014 | | | | | Mainfreight Ltd | | | 1,507 | |
| | 406,005 | | | | | Malaysia Airports Holdings BHD | | | 1,116 | |
| | 9,180,300 | | | * | | Malaysian Airline System BHD | | | 871 | |
| | 246,800 | | | | | Malaysian Bulk Carriers BHD | | | 134 | |
| | 87,793 | | | | | Marten Transport Ltd | | | 1,773 | |
| | 68,000 | | | | | Maruzen Showa Unyu Co Ltd | | | 235 | |
| | 203,679 | | | | | Matson, Inc | | | 5,318 | |
| | 251,118 | | | | | Mermaid Marine Australia Ltd | | | 762 | |
| | 1,233,200 | | | * | | MISC BHD | | | 2,148 | |
| | 17,349 | | | | | Mitsubishi Logistics Corp | | | 275 | |
| | 1,570,358 | | | * | | Mitsui OSK Lines Ltd | | | 7,087 | |
| | 308,610 | | | | | Mitsui-Soko Co Ltd | | | 1,436 | |
| | 927,608 | | | | | MTR Corp | | | 3,516 | |
| | 556,158 | | | | | Mundra Port and Special Economic Zone Ltd | | | 1,400 | |
| | 559,696 | | | | | National Express Group plc | | | 2,555 | |
| | 1,221,718 | | | *,e | | Neptune Orient Lines Ltd | | | 1,092 | |
| | 532,641 | | | | | Nippon Express Co Ltd | | | 2,578 | |
| | 97,200 | | | | | Nippon Konpo Unyu Soko Co Ltd | | | 1,749 | |
| | 3,720,669 | | | | | Nippon Yusen Kabushiki Kaisha | | | 11,897 | |
| | 96,000 | | | | | Nissin Corp | | | 270 | |
| | 253,400 | | | | | Nok Airlines PCL | | | 147 | |
| | 849,655 | | | | | Norfolk Southern Corp | | | 78,873 | |
| | 194,782 | | | | | Northgate plc | | | 1,659 | |
| | 44,458 | | | *,e | | Norwegian Air Shuttle AS | | | 1,386 | |
| | 113,942 | | | e | | Odakyu Electric Railway Co Ltd | | | 1,030 | |
| | 75,859 | | | | | Oesterreichische Post AG. | | | 3,640 | |
| | 1,959,400 | | | *,e | | OHL Mexico SAB de CV | | | 5,017 | |
| | 257,682 | | | * | | Old Dominion Freight Line | | | 13,662 | |
| | 259,500 | | | e | | Orient Overseas International Ltd | | | 1,306 | |
| | 162,214 | | | * | | Pacer International, Inc | | | 1,340 | |
| | 2,203,290 | | | | | Pacific Basin Shipping Ltd | | | 1,581 | |
| | 14,713 | | | | | Panalpina Welttransport Holding AG. | | | 2,467 | |
| | 32,151 | | | * | | Park-Ohio Holdings Corp | | | 1,685 | |
| | 24,954 | | | * | | Patriot Transportation Holding, Inc | | | 1,036 | |
| | 922,800 | | | | | Pos Malaysia & Services Holdings BHD | | | 1,545 | |
| | 550,600 | | | | | Precious Shipping PCL | | | 358 | |
COLLEGE RETIREMENT EQUITIES FUND - Stock Account
| | | | | | | | VALUE | |
| SHARES | | | | | COMPANY | | (000) | |
| | 12,753,500 | | | *,m | | PT Berlian Laju Tanker Tbk | | $ | 0 | ^ |
| | 6,069,500 | | | | | PT Cardig Aero Services Tbk | | | 409 | |
| | 1,652,000 | | | * | | PT Citra Marga Nusaphala Persada Tbk | | | 455 | |
| | 9,680,800 | | | | | PT Express Transindo Utama Tbk | | | 1,161 | |
| | 9,555,000 | | | * | | PT Garuda Indonesia Tbk | | | 393 | |
| | 2,298,000 | | | | | PT Jasa Marga Tbk | | | 894 | |
| | 6,339,000 | | | * | | PT Nusantara Infrastructure Tbk | | | 133 | |
| | 7,139,000 | | | * | | PT Trada Maritime Tbk | | | 934 | |
| | 1,509,492 | | | * | | Qantas Airways Ltd | | | 1,481 | |
| | 2,633,673 | | | | | QR National Ltd | | | 11,503 | |
| | 101,337 | | | * | | Quality Distribution, Inc | | | 1,300 | |
| | 598,739 | | | | | Qube Logistics Holdings Ltd | | | 1,109 | |
| | 246,175 | | | *,e | | Republic Airways Holdings, Inc | | | 2,632 | |
| | 458,000 | | | | | Road King Infrastructure | | | 439 | |
| | 62,064 | | | * | | Roadrunner Transportation Services Holdings, Inc | | | 1,673 | |
| | 8,938,185 | | | * | | Royal Mail plc | | | 84,367 | |
| | 46,434 | | | * | | Ryanair Holdings plc | | | 400 | |
| | 226,731 | | | * | | Ryanair Holdings plc (ADR) | | | 10,640 | |
| | 133,969 | | | | | Ryder System, Inc | | | 9,884 | |
| | 498,000 | | | | | Sagami Railway Co Ltd | | | 1,706 | |
| | 87,502 | | | * | | Saia, Inc | | | 2,804 | |
| | 96 | | | *,m | | SAir Group | | | 0 | ^ |
| | 334,000 | | | | | Sankyu, Inc | | | 1,303 | |
| | 64,300 | | | | | Santos Brasil Participacoes S.A. | | | 515 | |
| | 876,834 | | | *,e | | SAS AB | | | 2,245 | |
| | 13,108 | | | | | SAVE S.p.A. | | | 224 | |
| | 7,680 | | | | | Sebang Co Ltd | | | 137 | |
| | 358,287 | | | | | Seino Holdings Corp | | | 3,770 | |
| | 274,000 | | | | | Senko Co Ltd | | | 1,420 | |
| | 229,100 | | | | | Shanghai Jinjiang International Investment Holdings Co | | | 208 | |
| | 141,400 | | | | | Shenzhen Chiwan Petroleum | | | 291 | |
| | 259,100 | | | | | Shenzhen Chiwan Wharf Holdings Ltd | | | 486 | |
| | 876,000 | | | | | Shenzhen Expressway Co Ltd | | | 395 | |
| | 14,295,000 | | | e | | Shenzhen International Holdings | | | 1,794 | |
| | 58,000 | | | | | Shibusawa Warehouse Co Ltd | | | 230 | |
| | 388,006 | | | | | Shih Wei Navigation Co Ltd | | | 275 | |
| | 118,000 | | | * | | Shinwa Kaiun Kaisha Ltd | | | 347 | |
| | 3,547,097 | | | e | | Shun TAK Holdings Ltd | | | 2,090 | |
| | 2,618,000 | | | e | | Sichuan Expressway Co Ltd | | | 774 | |
| | 480,000 | | | | | Sincere Navigation | | | 457 | |
| | 250,590 | | | e | | Singapore Airlines Ltd | | | 2,070 | |
| | 1,397,000 | | | | | Singapore Airport Terminal Services Ltd | | | 3,580 | |
| | 3,466,419 | | | | | Singapore Post Ltd | | | 3,642 | |
| | 5,293,000 | | | | | Sinotrans Ltd | | | 2,003 | |
| | 2,700,000 | | | | | Sinotrans Shipping Ltd | | | 987 | |
| | 1,402,000 | | | | | SITC International Co Ltd | | | 618 | |
| | 39,187 | | | | | Sixt AG. | | | 1,263 | |
| | 40,243 | | | | | Sixt AG. (Preference) | | | 1,065 | |
COLLEGE RETIREMENT EQUITIES FUND - Stock Account
| | | | | | | | VALUE | |
| SHARES | | | | | COMPANY | | (000) | |
| | 132,768 | | | | | Skymark Airlines, Inc | | $ | 487 | |
| | 201,351 | | | | | Skywest, Inc | | | 2,986 | |
| | 1,131,000 | | | e | | SMRT Corp Ltd | | | 1,040 | |
| | 13,065,075 | | | | | Sociedad Matriz SAAM S.A. | | | 1,182 | |
| | 155,987 | | | e | | Societa Iniziative Autostradali e Servizi S.p.A. | | | 1,552 | |
| | 3,546,565 | | | | | Southwest Airlines Co | | | 66,817 | |
| | 395,333 | | | * | | Spirit Airlines, Inc | | | 17,952 | |
| | 973,865 | | | | | Stagecoach Group plc | | | 6,110 | |
| | 394,593 | | | e | | Stobart Group Ltd | | | 908 | |
| | 50,065 | | | | | Stolt-Nielsen S.A. | | | 1,378 | |
| | 77,400 | | | e | | Student Transportation, Inc | | | 479 | |
| | 94,590 | | | *,m | | STX Pan Ocean Co Ltd | | | 68 | |
| | 151,767 | | | | | Sumitomo Warehouse Co Ltd | | | 877 | |
| | 575,874 | | | *,e | | Swift Transportation Co, Inc | | | 12,790 | |
| | 1,291,379 | | | | | Sydney Airport | | | 4,389 | |
| | 328,000 | | | | | T.Join Transportation Co | | | 511 | |
| | 214,000 | | | | | Taiwan Navigation Co Ltd | | | 203 | |
| | 449,146 | | | | | TAV Havalimanlari Holding AS | | | 3,234 | |
| | 55,000 | | | | | Tegma Gestao Logistica | | | 420 | |
| | 1,473,300 | | | | | Thai Airways International PCL | | | 622 | |
| | 97,580 | | | | | Thoresen Thai Agencies PCL | | | 52 | |
| | 6,720,000 | | | | | Tianjin Port Development Holdings Ltd | | | 1,156 | |
| | 696,000 | | | *,e | | Tiger Airways Holdings Ltd | | | 282 | |
| | 266,744 | | | | | TNT Express NV | | | 2,481 | |
| | 524,566 | | | * | | TNT NV | | | 2,999 | |
| | 378,534 | | | | | Tobu Railway Co Ltd | | | 1,835 | |
| | 1,727,058 | | | | | Tokyu Corp | | | 11,190 | |
| | 589,376 | | | | | Toll Holdings Ltd | | | 2,998 | |
| | 117,500 | | | | | TPI-Triunfo Participacoes e Investimentos S.A. | | | 471 | |
| | 208,000 | | | | | Transasia Airways Corp | | | 89 | |
| | 375,773 | | | e | | TransForce, Inc | | | 8,936 | |
| | 1,087,367 | | | | | Transurban Group | | | 6,650 | |
| | 1,173,696 | | | | | Turk Hava Yollari | | | 3,519 | |
| | 1,691,366 | | | * | | UAL Corp | | | 63,984 | |
| | 55,023 | | | *,e | | Ultrapetrol Bahamas Ltd | | | 206 | |
| | 437,800 | | | | | U-Ming Marine Transport Corp | | | 786 | |
| | 2,789,380 | | | | | Union Pacific Corp | | | 468,616 | |
| | 2,183,704 | | | | | United Parcel Service, Inc (Class B) | | | 229,464 | |
| | 17,606 | | | | | Universal Truckload Services, Inc | | | 537 | |
| | 693,606 | | | | | UTI Worldwide, Inc | | | 12,180 | |
| | 1,220,317 | | | * | | Virgin Australia Holdings Ltd | | | 414 | |
| | 67,336 | | | *,m | | Virgin Australia Int Holdings | | | 0 | ^ |
| | 23,321 | | | | | VTG AG. | | | 482 | |
| | 275,357 | | | | | Wan Hai Lines Ltd | | | 143 | |
| | 173,341 | | | e | | Werner Enterprises, Inc | | | 4,287 | |
| | 163,388 | | | * | | Wesco Aircraft Holdings, Inc | | | 3,581 | |
| | 436,292 | | | | | West Japan Railway Co | | | 18,904 | |
| | 100,200 | | | | | Westshore Terminals Investment Corp | | | 3,265 | |
COLLEGE RETIREMENT EQUITIES FUND - Stock Account
| | | | | | | | VALUE | |
| SHARES | | | | | COMPANY | | (000) | |
| | 108,457 | | | | | Wilh. Wilhelmsen ASA | | $ | 1,015 | |
| | 364,927 | | | | | Wisdom Marine Lines Co Ltd | | | 428 | |
| | 6,934,000 | | | | | Xiamen International Port Co Ltd | | | 1,013 | |
| | 500,000 | | | * | | Xiangyu Dredging Holdings Ltd | | | 162 | |
| | 104,110 | | | *,e | | XPO Logistics, Inc | | | 2,737 | |
| | 159,431 | | | | | Yamato Transport Co Ltd | | | 3,224 | |
| | 1,286,515 | | | * | | Yang Ming Marine Transport | | | 603 | |
| | 79,918 | | | *,e | | YRC Worldwide, Inc | | | 1,388 | |
| | 17,900 | | | | | Yusen Air & Sea Service Co Ltd | | | 226 | |
| | 4,307,400 | | | | | Zhejiang Expressway Co Ltd | | | 4,078 | |
| | | | | | | TOTAL TRANSPORTATION | | | 3,172,848 | |
| | | | | | | | | | | |
| UTILITIES - 2.7% | | | | |
| | 1,698,254 | | | | | A2A S.p.A. | | | 1,988 | |
| | 3,799,031 | | | | | Aboitiz Power Corp | | | 2,915 | |
| | 30,516 | | | e | | Acciona S.A. | | | 1,758 | |
| | 150,644 | | | | | ACEA S.p.A. | | | 1,710 | |
| | 78,161 | | | *,e | | Actelios S.p.A. | | | 139 | |
| | 3,120,355 | | | | | AES Corp | | | 45,276 | |
| | 2,599,473 | | | | | AES Gener S.A. | | | 1,439 | |
| | 121,644 | | | | | AES Tiete S.A. | | | 984 | |
| | 348,364 | | | *,m | | AET&D Holdings No 1 Ptd Ltd | | | 0 | ^ |
| | 532,051 | | | | | AGL Energy Ltd | | | 7,152 | |
| | 243,384 | | | | | AGL Resources, Inc | | | 11,495 | |
| | 2,739,420 | | | | | Aguas Andinas S.A. | | | 1,769 | |
| | 42,810 | | | * | | Akenerji Elektrik Uretim AS | | | 24 | |
| | 192,025 | | | e | | Algonquin Power & Utilities Corp | | | 1,327 | |
| | 160,984 | | | | | Allete, Inc | | | 8,030 | |
| | 454,737 | | | | | Alliant Energy Corp | | | 23,464 | |
| | 100,000 | | | * | | Alupar Investimento S.A. | | | 689 | |
| | 235,047 | | | | | Ameren Corp | | | 8,499 | |
| | 1,881,590 | | | | | American Electric Power Co, Inc | | | 87,946 | |
| | 217,948 | | | | | American States Water Co | | | 6,262 | |
| | 1,103,119 | | | | | American Water Works Co, Inc | | | 46,618 | |
| | 782,731 | | | | | APA Group | | | 4,201 | |
| | 192,504 | | | | | Aqua America, Inc | | | 4,541 | |
| | 31,088 | | | | | Artesian Resources Corp | | | 713 | |
| | 172,052 | | | e | | Ascopiave S.p.A. | | | 424 | |
| | 134,746 | | | e | | Atco Ltd | | | 5,919 | |
| | 546,319 | | | e | | Atlantic Power Corp | | | 1,901 | |
| | 292,179 | | | e | | Atlantic Power Corp (Toronto) | | | 1,020 | |
| | 363,954 | | | | | Atmos Energy Corp | | | 16,531 | |
| | 285,195 | | | | | Avista Corp | | | 8,040 | |
| | 3,538,000 | | | e | | Beijing Enterprises Water Group Ltd | | | 2,228 | |
| | 2,324,000 | | | * | | Binhai Investment Co Ltd | | | 142 | |
| | 27,565 | | | | | BKW S.A. | | | 885 | |
| | 171,832 | | | | | Black Hills Corp | | | 9,023 | |
| | 30,295 | | | * | | Boralex, Inc | | | 309 | |
COLLEGE RETIREMENT EQUITIES FUND - Stock Account
| | | | | | | | VALUE | |
| SHARES | | | | | COMPANY | | (000) | |
| | 212,928 | | | | | California Water Service Group | | $ | 4,912 | |
| | 5,458,091 | | | * | | Calpine Corp | | | 106,487 | |
| | 219,859 | | | e | | Canadian Utilities Ltd | | | 7,383 | |
| | 134,600 | | | e | | Capital Power Corp | | | 2,699 | |
| | 4,776,245 | | | | | Centerpoint Energy, Inc | | | 110,713 | |
| | 279,941 | | | | | Centrais Eletricas Brasileiras S.A. | | | 699 | |
| | 257,824 | | | | | Centrais Eletricas Brasileiras S.A. (Preference) | | | 1,087 | |
| | 16,900 | | | * | | Centrais Eletricas de Santa Catarina S.A. | | | 131 | |
| | 6,259,444 | | | | | Centrica plc | | | 36,096 | |
| | 36,864 | | | * | | CESC Ltd | | | 278 | |
| | 205,087 | | | | | CEZ AS | | | 5,350 | |
| | 43,479 | | | | | Chesapeake Utilities Corp | | | 2,610 | |
| | 653,344 | | | e | | Cheung Kong Infrastructure Holdings Ltd | | | 4,130 | |
| | 3,390,000 | | | e | | China Datang Corp Renewable Power Co Ltd | | | 719 | |
| | 6,568,100 | | | e | | China Gas Holdings Ltd | | | 9,669 | |
| | 3,479,500 | | | | | China Longyuan Power Group Corp | | | 4,487 | |
| | 5,300,000 | | | e | | China Oil and Gas Group Ltd | | | 980 | |
| | 7,898,000 | | | e | | China Power International Development Ltd | | | 2,816 | |
| | 8,540,000 | | | *,e | | China Power New Energy Development Co Ltd | | | 586 | |
| | 2,310,800 | | | | | China Resources Gas Group Ltd | | | 8,059 | |
| | 2,298,899 | | | | | China Resources Power Holdings Co | | | 5,456 | |
| | 2,302,000 | | | | | China Water Affairs Group Ltd | | | 853 | |
| | 4,810,000 | | | * | | China WindPower Group Ltd | | | 386 | |
| | 902,486 | | | | | Chubu Electric Power Co, Inc | | | 11,667 | |
| | 382,091 | | | | | Chugoku Electric Power Co, Inc | | | 5,949 | |
| | 693,819 | | | | | Cia de Saneamento Basico do Estado de Sao Paulo | | | 7,785 | |
| | 67,800 | | | | | Cia de Saneamento de Minas Gerais-COPASA | | | 1,069 | |
| | 818,117 | | | | | Cia Energetica de Minas Gerais | | | 4,856 | |
| | 597,671 | | | | | Cia Energetica de Sao Paulo (Class B) | | | 5,680 | |
| | 43,100 | | | | | Cia Energetica do Ceara | | | 767 | |
| | 271,619 | | | | | Cia Paranaense de Energia | | | 3,531 | |
| | 233,944 | | | | | Cleco Corp | | | 10,906 | |
| | 1,568,859 | | | e | | CLP Holdings Ltd | | | 12,409 | |
| | 846,999 | | | | | CMS Energy Corp | | | 22,674 | |
| | 8,857,504 | | | | | Colbun S.A. | | | 2,022 | |
| | 43,041 | | | | | Connecticut Water Service, Inc | | | 1,528 | |
| | 513,013 | | | | | Consolidated Edison, Inc | | | 28,359 | |
| | 59,357 | | | | | Consolidated Water Co, Inc | | | 837 | |
| | 2,756,772 | | | e | | Contact Energy Ltd | | | 11,640 | |
| | 259,840 | | | | | CPFL Energia S.A. | | | 2,103 | |
| | 6,984,900 | | | | | Datang International Power Generation Co Ltd | | | 3,230 | |
| | 28,233 | | | | | Delta Natural Gas Co, Inc | | | 632 | |
| | 1,980,409 | | | | | Dominion Resources, Inc | | | 128,113 | |
| | 2,070,770 | | | | | Drax Group plc | | | 27,476 | |
| | 616,260 | | | | | DTE Energy Co | | | 40,913 | |
| | 2,019,822 | | | | | DUET Group | | | 3,609 | |
| | 2,876,248 | | | | | Duke Energy Corp | | | 198,490 | |
| | 388,662 | | | *,e | | Dynegy, Inc | | | 8,364 | |
COLLEGE RETIREMENT EQUITIES FUND - Stock Account
| | | | | | | | VALUE | |
| SHARES | | | | | COMPANY | | (000) | |
| | 3,683,179 | | | | | E.ON AG. | | $ | 68,094 | |
| | 6,799 | | | | | E1 Corp | | | 431 | |
| | 1,544,619 | | | | | Edison International | | | 71,516 | |
| | 665,601 | | | | | EDP - Energias do Brasil S.A. | | | 3,202 | |
| | 158,112 | | | | | El Paso Electric Co | | | 5,551 | |
| | 179,861 | | | | | Electric Power Development Co | | | 5,244 | |
| | 2,181,159 | | | | | Electricite de France | | | 77,163 | |
| | 36,186 | | | | | Elia System Operator S.A. | | | 1,678 | |
| | 195,646 | | | | | Empire District Electric Co | | | 4,439 | |
| | 578,826 | | | | | Empresa Electrica del Norte Grande S.A. | | | 748 | |
| | 4,280,317 | | | | | Empresa Nacional de Electricidad S.A. | | | 6,372 | |
| | 173,609 | | | e | | Enagas | | | 4,535 | |
| | 648,674 | | | *,e | | Endesa S.A. | | | 20,808 | |
| | 146,936 | | | | | Enea S.A. | | | 662 | |
| | 1,344,227 | | | | | Enel Green Power S.p.A | | | 3,382 | |
| | 2,327,821 | | | | | Enel S.p.A. | | | 10,157 | |
| | 716,089 | | | * | | Energa S.A. | | | 3,776 | |
| | 1,179,875 | | | | | Energias de Portugal S.A. | | | 4,334 | |
| | 1,024,060 | | | *,e | | Energy World Corp Ltd | | | 348 | |
| | 42,718,929 | | | | | Enersis S.A. | | | 12,813 | |
| | 425,526 | | | * | | Eneva S.A. | | | 539 | |
| | 486,137 | | | | | Entergy Corp | | | 30,758 | |
| | 2,342,457 | | | | | Envestra Ltd | | | 2,387 | |
| | 732,000 | | | *,e | | Epure International Ltd | | | 408 | |
| | 227,030 | | | | | Equatorial Energia S.A. | | | 2,228 | |
| | 50,345 | | | e | | EVN AG. | | | 799 | |
| | 2,384,390 | | | | | Exelon Corp | | | 65,308 | |
| | 3,235,200 | | | | | First Gen Corp | | | 954 | |
| | 700,930 | | | | | First Philippine Holdings Corp | | | 849 | |
| | 997,856 | | | | | FirstEnergy Corp | | | 32,909 | |
| | 269,707 | | | e | | Fortis, Inc | | | 7,731 | |
| | 1,592,307 | | | | | Fortum Oyj | | | 36,429 | |
| | 434,570 | | | | | GAIL India Ltd | | | 2,407 | |
| | 797,400 | | | | | Gas Malaysia BHD | | | 943 | |
| | 1,592,545 | | | | | Gas Natural SDG S.A. | | | 40,991 | |
| | 2,552,911 | | | | | Gaz de France | | | 60,043 | |
| | 59,089 | | | *,e | | Genie Energy Ltd | | | 603 | |
| | 558,600 | | | | | Glow Energy PCL | | | 1,202 | |
| | 323,449 | | | | | Great Plains Energy, Inc | | | 7,840 | |
| | 140,000 | | | | | Great Taipei Gas Co Ltd | | | 106 | |
| | 8,685,100 | | | e | | Guangdong Investments Ltd | | | 8,497 | |
| | 2,050 | | | | | Gujarat Gas Co Ltd | | | 9 | |
| | 194,239 | | | | | Gujarat State Petronet Ltd | | | 192 | |
| | 2,353,042 | | | * | | GVK Power & Infrastructure Ltd | | | 360 | |
| | 49,120 | | | | | Hanjin Heavy Industries & Construction Holdings Co Ltd | | | 445 | |
| | 81,265 | | | e | | Hawaiian Electric Industries, Inc | | | 2,118 | |
| | 1,439,470 | | | | | Hera S.p.A. | | | 3,269 | |
| | 129,071 | | | * | | Hokkaido Electric Power Co, Inc | | | 1,485 | |
COLLEGE RETIREMENT EQUITIES FUND - Stock Account
| | | | | | | | VALUE | |
| SHARES | | | | | COMPANY | | (000) | |
| | 256,290 | | | | | Hokuriku Electric Power Co | | $ | 3,481 | |
| | 4,700,276 | | | | | Hong Kong & China Gas Ltd | | | 10,792 | |
| | 3,342,819 | | | | | Hong Kong Electric Holdings Ltd | | | 26,610 | |
| | 1,137,130 | | | * | | Huadian Energy Co Ltd | | | 344 | |
| | 9,058,000 | | | e | | Huadian Fuxin Energy Corp Ltd | | | 3,593 | |
| | 2,300,000 | | | e | | Huadian Power International Co | | | 900 | |
| | 12,588,200 | | | | | Huaneng Power International, Inc | | | 11,413 | |
| | 5,074,000 | | | e | | Huaneng Renewables Corp Ltd | | | 2,442 | |
| | 681,000 | | | e | | Hyflux Ltd | | | 632 | |
| | 3,995,276 | | | | | Iberdrola S.A. | | | 25,497 | |
| | 193,633 | | | e | | Idacorp, Inc | | | 10,038 | |
| | 115,000 | | | * | | IDGC Holding JSC (GDR) | | | 554 | |
| | 71,572 | | | * | | Indiabulls Infrastructure and Power Ltd | | | 4 | |
| | 63,672 | | | * | | Indraprastha Gas Ltd | | | 277 | |
| | 1,884,668 | | | | | Infratil Ltd | | | 3,520 | |
| | 198,223 | | | e | | Innergex Renewable Energy, Inc | | | 1,978 | |
| | 66,776 | | | | | Integrys Energy Group, Inc | | | 3,633 | |
| | 623,771 | | | | | Interconexion Electrica S.A. | | | 2,941 | |
| | 552,247 | | | | | Inversiones Aguas Metropolitanas S.A. | | | 938 | |
| | 1,585,218 | | | | | Iride S.p.A. | | | 2,431 | |
| | 670,319 | | | | | Isagen S.A. ESP | | | 1,129 | |
| | 108,257 | | | | | ITC Holdings Corp | | | 10,373 | |
| | 167,325 | | | e | | Just Energy Income Fund | | | 1,197 | |
| | 1,833,004 | | | * | | Kansai Electric Power Co, Inc | | | 21,097 | |
| | 73,000 | | | m | | Kanto Natural Gas Development Ltd | | | 495 | |
| | 3,193 | | | | | Korea District Heating Corp | | | 260 | |
| | 296,530 | | | * | | Korea Electric Power Corp | | | 9,793 | |
| | 29,092 | | | | | Korea Gas Corp | | | 1,839 | |
| | 4,902 | | | | | KyungDong City Gas Co Ltd | | | 456 | |
| | 397,505 | | | * | | Kyushu Electric Power Co, Inc | | | 5,077 | |
| | 127,791 | | | | | Laclede Group, Inc | | | 5,820 | |
| | 241,400 | | | | | Light S.A. | | | 2,271 | |
| | 152,871 | | | e | | Macquarie Power & Infrastructure Income Fund | | | 512 | |
| | 1,428,200 | | | | | Manila Water Co, Inc | | | 709 | |
| | 588,869 | | | | | MDU Resources Group, Inc | | | 17,990 | |
| | 99,249 | | | | | MGE Energy, Inc | | | 5,747 | |
| | 66,089 | | | | | Middlesex Water Co | | | 1,384 | |
| | 1,574,001 | | | | | Mighty River Power Ltd | | | 2,760 | |
| | 247,638 | | | | | National Fuel Gas Co | | | 17,681 | |
| | 8,907,127 | | | | | National Grid plc | | | 116,498 | |
| | 164,617 | | | | | New Jersey Resources Corp | | | 7,612 | |
| | 2,547,053 | | | | | NextEra Energy, Inc | | | 218,079 | |
| | 795,448 | | | | | NiSource, Inc | | | 26,154 | |
| | 1,019,747 | | | | | Northeast Utilities | | | 43,227 | |
| | 128,959 | | | e | | Northland Power Income Fund | | | 1,879 | |
| | 115,526 | | | e | | Northwest Natural Gas Co | | | 4,947 | |
| | 149,276 | | | | | NorthWestern Corp | | | 6,467 | |
| | 1,356,014 | | | | | NRG Energy, Inc | | | 38,945 | |
COLLEGE RETIREMENT EQUITIES FUND - Stock Account
| | | | | | | | VALUE | |
| SHARES | | | | | COMPANY | | (000) | |
| | 367,189 | | | e | | NRG Yield, Inc | | $ | 14,691 | |
| | 1,595,678 | | | | | NTPC Ltd | | | 3,538 | |
| | 1,660,243 | | | | | OGE Energy Corp | | | 56,282 | |
| | 105,500 | | | | | Okinawa Electric Power Co, Inc | | | 3,551 | |
| | 1,314,204 | | | | | Oneok, Inc | | | 81,717 | |
| | 69,917 | | | e | | Ormat Technologies, Inc | | | 1,902 | |
| | 3,806,568 | | | | | Osaka Gas Co Ltd | | | 14,951 | |
| | 142,569 | | | | | Otter Tail Corp | | | 4,173 | |
| | 234,074 | | | *,e | | Pattern Energy Group, Inc | | | 7,095 | |
| | 546,821 | | | | | Pennon Group plc | | | 5,975 | |
| | 206,896 | | | e | | Pepco Holdings, Inc | | | 3,958 | |
| | 668,700 | | | | | Petronas Gas BHD | | | 4,961 | |
| | 1,538,058 | | | | | PG&E Corp | | | 61,953 | |
| | 339,164 | | | | | Piedmont Natural Gas Co, Inc | | | 11,247 | |
| | 606,014 | | | | | Pinnacle West Capital Corp | | | 32,070 | |
| | 306,217 | | | | | PNM Resources, Inc | | | 7,386 | |
| | 8,981,750 | | | | | PNOC Energy Development Corp | | | 1,081 | |
| | 1,798,565 | | | | | Polska Grupa Energetyczna S.A. | | | 9,686 | |
| | 294,926 | | | | | Portland General Electric Co | | | 8,907 | |
| | 1,767,216 | | | | | Power Grid Corp of India Ltd | | | 2,856 | |
| | 1,135,461 | | | | | PPL Corp | | | 34,166 | |
| | 12,758,200 | | | | | PT Perusahaan Gas Negara | | | 4,703 | |
| | 435,227 | | | * | | PTC India Ltd | | | 467 | |
| | 198,826 | | | | | Public Power Corp | | | 2,955 | |
| | 1,121,723 | | | | | Public Service Enterprise Group, Inc | | | 35,940 | |
| | 1,076,200 | | | | | Puncak Niaga Holding BHD | | | 1,069 | |
| | 57,670 | | | *,e | | Pure Cycle Corp | | | 365 | |
| | 292,131 | | | | | Questar Corp | | | 6,716 | |
| | 61,339 | | | e | | Red Electrica de Espana | | | 4,095 | |
| | 157,984 | | | | | Redes Energeticas Nacionais S.A. | | | 486 | |
| | 137,445 | | | * | | Reliance Energy Ltd | | | 949 | |
| | 634,826 | | | * | | Reliance Power Ltd | | | 753 | |
| | 36,795 | | | | | Rubis | | | 2,330 | |
| | 1,377,614 | | | | | RusHydro (ADR) | | | 2,382 | |
| | 140,836 | | | | | RWE AG. | | | 5,160 | |
| | 551 | | | | | RWE AG. (Preference) | | | 18 | |
| | 8,162 | | | | | Samchully Co Ltd | | | 982 | |
| | 113,935 | | | | | SCANA Corp | | | 5,347 | |
| | 164,543 | | | | | Scottish & Southern Energy plc | | | 3,739 | |
| | 41,478 | | | | | Sechilienne-Sidec | | | 962 | |
| | 1,747,751 | | | | | Sempra Energy | | | 156,878 | |
| | 247,511 | | | | | Severn Trent plc | | | 6,998 | |
| | 125,278 | | | * | | Shikoku Electric Power Co, Inc | | | 1,879 | |
| | 106,400 | | | | | Shizuoka Gas Co Ltd | | | 633 | |
| | 67,965 | | | e | | SJW Corp | | | 2,025 | |
| | 1,922,794 | | | | | Snam Rete Gas S.p.A. | | | 10,747 | |
COLLEGE RETIREMENT EQUITIES FUND - Stock Account
| | | | | | | | VALUE | |
| SHARES | | | | | COMPANY | | (000) | |
| | 122,067 | | | | | South Jersey Industries, Inc | | $ | 6,831 | |
| | 980,160 | | | | | Southern Co | | | 40,294 | |
| | 183,366 | | | | | Southwest Gas Corp | | | 10,252 | |
| | 2,690,359 | | | | | SP AusNet | | | 2,996 | |
| | 1,584,296 | | | | | Spark Infrastructure Group | | | 2,302 | |
| | 323,100 | | | * | | SPCG PCL | | | 188 | |
| | 346,086 | | | | | Suez Environnement S.A. | | | 6,206 | |
| | 309,334 | | | e | | Superior Plus Corp | | | 3,596 | |
| | 1,085,450 | | | | | Taiwan Cogeneration Corp | | | 634 | |
| | 1,554,103 | | | | | Tata Power Co Ltd | | | 2,298 | |
| | 2,331,610 | | | | | Tauron Polska Energia S.A. | | | 3,379 | |
| | 179,492 | | | e | | TECO Energy, Inc | | | 3,094 | |
| | 113,855 | | | | | Telecom Plus plc | | | 3,337 | |
| | 7,374,118 | | | | | Tenaga Nasional BHD | | | 25,644 | |
| | 167,476 | | | | | Terna Rete Elettrica Nazionale S.p.A. | | | 836 | |
| | 3,045,800 | | | | | Thai Tap Water Supply PCL | | | 930 | |
| | 363,223 | | | e | | Toho Gas Co Ltd | | | 1,768 | |
| | 340,598 | | | * | | Tohoku Electric Power Co, Inc | | | 3,837 | |
| | 1,314,306 | | | * | | Tokyo Electric Power Co, Inc | | | 6,476 | |
| | 7,388,285 | | | | | Tokyo Gas Co Ltd | | | 36,415 | |
| | 1,289,000 | | | | | Towngas China Co Ltd | | | 1,497 | |
| | 177,320 | | | | | Tractebel Energia S.A. | | | 2,703 | |
| | 361,369 | | | e | | TransAlta Corp | | | 4,586 | |
| | 27,200 | | | e | | TransAlta Renewables, Inc | | | 281 | |
| | 115,100 | | | | | Transmissora Alianca de Energia Eletrica S.A. | | | 890 | |
| | 488,019 | | | | | UGI Corp | | | 20,233 | |
| | 264,211 | | | | | UIL Holdings Corp | | | 10,238 | |
| | 511,484 | | | | | United Utilities Group plc | | | 5,695 | |
| | 66,843 | | | | | Unitil Corp | | | 2,038 | |
| | 199,795 | | | | | UNS Energy Corp | | | 11,958 | |
| | 67,562 | | | | | Valener, Inc | | | 969 | |
| | 168,190 | | | | | Vectren Corp | | | 5,971 | |
| | 358,488 | | | | | Veolia Environnement | | | 5,855 | |
| | 299,037 | | | | | Westar Energy, Inc | | | 9,620 | |
| | 201,345 | | | | | WGL Holdings, Inc | | | 8,066 | |
| | 615,819 | | | | | Wisconsin Energy Corp | | | 25,458 | |
| | 902,527 | | | | | Xcel Energy, Inc | | | 25,217 | |
| | 1,813,800 | | | e | | Xinao Gas Holdings Ltd | | | 13,443 | |
| | 4,770 | | | | | YESCO Co Ltd | | | 169 | |
| | 41,556 | | | e | | York Water Co | | | 870 | |
| | 10,527,782 | | | | | YTL Corp BHD | | | 5,212 | |
| | 3,755,308 | | | * | | YTL Power International BHD | | | 2,169 | |
| | 16,000 | | | | | Zespol Elektrowni Patnow Adamow Konin S.A. | | | 132 | |
| | 1,407,253 | | | * | | Zorlu Enerji Elektrik Uretim AS | | | 682 | |
| | | | | | | TOTAL UTILITIES | | | 3,432,023 | |
| | | | | | | | | | | |
| | | | | | | TOTAL COMMON STOCKS | | | 125,638,491 | |
| | | | | | | (Cost $100,742,614) | | | | |
COLLEGE RETIREMENT EQUITIES FUND - Stock Account
| SHARES | | | | | COMPANY | | VALUE
(000) | |
| PREFERRED STOCKS - 0.0% | | | | |
| | | | | | | | | | | |
| BANKS - 0.0% | | | | |
| | 4,022,934 | | | * | | ITAUSA Investimentos Itau PR | | $ | 15,198 | |
| | | | | | | TOTAL BANKS | | | 15,198 | |
| | | | | | | | | | | |
| DIVERSIFIED FINANCIALS - 0.0% | | | | |
| | 300,000 | | | | | Daishin Securities Co Ltd Pref 2 | | | 1,435 | |
| | | | | | | TOTAL DIVERSIFIED FINANCIALS | | | 1,435 | |
| REAL ESTATE - 0.0% | | | | |
| | 8,497,223 | | | *,m | | Ayala Land, Inc (Preferred B) | | | 19 | |
| | | | | | | TOTAL REAL ESTATE | | | 19 | |
| | | | | | | | | | | |
| | | | | | | TOTAL PREFERRED STOCKS | | | 16,652 | |
| | | | | | | (Cost $22,738) | | | | |
| | | | | | | | | | | |
| RIGHTS / WARRANTS - 0.0% | | | | |
| | | | | | | | | | | |
| BANKS - 0.0% | | | | |
| | 2,183,192 | | | | | Piraeus Bank S.A. | | | 2,292 | |
| | 5,927,291 | | | m | | PT Bank Bukopin Tbk | | | 0 | ^ |
| | | | | | | TOTAL BANKS | | | 2,292 | |
| | | | | | | | | | | |
| CAPITAL GOODS - 0.0% | | | | |
| | 43,120 | | | | | Genting Plantations BHD | | | 46 | |
| | 3,758,804 | | | m | | Polimex-Mostostal S.A. | | | 0 | ^ |
| | | | | | | TOTAL CAPITAL GOODS | | | 46 | |
| | | | | | | | | | | |
| CONSUMER SERVICES - 0.0% | | | | |
| | 4,088 | | | e | | Corporate Travel Management Ltd | | | 3 | |
| | | | | | | TOTAL CONSUMER SERVICES | | | 3 | |
| | | | | | | | | | | |
| DIVERSIFIED FINANCIALS - 0.0% | | | | |
| | 611,609 | | | m | | Citadel Capital SAE | | | 0 | ^ |
| | 47,320 | | | | | Deutsche Bank, John Keells | | | 15 | |
| | 47,320 | | | | | Deutsche Bank, John Keells | | | 12 | |
| | 903,551 | | | | | Genting BHD | | | 863 | |
| | 422,950 | | | | | Malaysia Building Society BHD | | | 67 | |
| | | | | | | TOTAL DIVERSIFIED FINANCIALS | | | 957 | |
| | | | | | | | | | | |
| ENERGY - 0.0% | | | | |
| | 123,722 | | | | | Etablissements Maurel et Prom CW14 | | | 15 | |
| | 2,179,112 | | | | | EXCO Resources, Inc | | | 349 | |
| | 64,082 | | | m | | Magnum Hunter Resources Corp | | | 0 | ^ |
COLLEGE RETIREMENT EQUITIES FUND - Stock Account
| SHARES | | | | | COMPANY | | RATE | | MATURITY
DATE | | VALUE
(000) | |
| | 1,694,523 | | | m | | Norwegian Energy Co ASA | | | | | | | $ | 28 | |
| | 1,503,512 | | | | | Repsol S.A. | | | | | | | | 1,026 | |
| | | | | | | TOTAL ENERGY | | | | | | | | 1,418 | |
| | | | | | | | | | | | | | | | |
| FOOD, BEVERAGE & TOBACCO - 0.0% | | | | | | | | | |
| | 15,482 | | | | | Olam International Ltd | | | | | | | | 4 | |
| | | | | | | TOTAL FOOD, BEVERAGE & TOBACCO | | | | | | | | 4 | |
| | | | | | | | | | | | | | | | |
| HEALTH CARE EQUIPMENT & SERVICES - 0.0% | | | | | | | | | |
| | 54,573 | | | | | KPJ Healthcare BHD | | | | | | | | 34 | |
| | | | | | | TOTAL HEALTH CARE EQUIPMENT & SERVICES | | | | | 34 | |
| | | | | | | | | | | | | | | | |
| MATERIALS - 0.0% | | | | | | | | | |
| | 1,558 | | | | | Kinross Gold Corp | | | | | | | | 0 | ^ |
| | 651,967 | | | | | Turquoise Hill Resources Ltd | | | | | | | | 614 | |
| | | | | | | TOTAL MATERIALS | | | | | | | | 614 | |
| | | | | | | | | | | | | | | | |
| PHARMACEUTICALS, BIOTECHNOLOGY & LIFE SCIENCES - 0.0% | | | | | | | | | |
| | 13,858 | | | e | | Cubist Pharmaceuticals, Inc | | | | | | | | 19 | |
| | 288,574 | | | | | Faes Farma S.A. | | | | | | | | 17 | |
| | 628 | | | m | | Hanmi Pharm Co Ltd | | | | | | | | 11 | |
| | 63,400 | | | e | | Nichi-iko Pharmaceutical Co Ltd | | | | | | | | 283 | |
| | 228,016 | | | m | | Trius Therapeutics, Inc | | | | | | | | 30 | |
| | | | | | | TOTAL PHARMACEUTICALS, BIOTECHNOLOGY & LIFE SCIENCES | | | 360 | |
| | | | | | | | | | | | | | | | |
| REAL ESTATE - 0.0% | | | | | | | | | |
| | 6,677 | | | | | Tejon Ranch Co | | | | | | | | 36 | |
| | | | | | | TOTAL REAL ESTATE | | | | | | | | 36 | |
| | | | | | | | | | | | | | | | |
| UTILITIES - 0.0% | | | | | | | | | |
| | 26,189 | | | m | | JB Financial Group Co Ltd | | | | | | | | 34 | |
| | | | | | | TOTAL UTILITIES | | | | | | | | 34 | |
| | | | | | | | | | | | | | | | |
| | | | | | | TOTAL RIGHTS / WARRANTS | | | | | | | | 5,798 | |
| | | | | | | (Cost $4,747) | | | | | | | | | |
| | | | | | | | | | | | | | | | |
| PRINCIPAL | | | | | ISSUER | | | | | | | | | |
| SHORT-TERM INVESTMENTS - 4.3% | | | | | | | | | |
| | | | | | | | | | |
| GOVERNMENT AGENCY DEBT - 0.2% | | | | | | | | | |
| $ | 8,685,000 | | | | | Federal Home Loan Bank (FHLB) | | 0.050 | % | | 01/03/14 | | | 8,685 | |
| | 50,000,000 | | | | | FHLB | | 0.035 | | | 01/17/14 | | | 49,999 | |
| | 20,000,000 | | | | | FHLB | | 0.065 | | | 02/05/14 | | | 19,999 | |
| | 50,000,000 | | | | | FHLB | | 0.070 | | | 02/07/14 | | | 49,996 | |
| | 72,500,000 | | | | | FHLB | | 0.080 | | | 02/19/14 | | | 72,492 | |
COLLEGE RETIREMENT EQUITIES FUND - Stock Account
| | | | | | | | | | | MATURITY | | VALUE | |
| PRINCIPAL | | | | | ISSUER | | RATE | | DATE | | (000) | |
| $ | 30,000,000 | | | | | FHLB | | 0.065 | % | | 02/26/14 | | $ | 29,997 | |
| | 50,000,000 | | | | | Federal Home Loan Mortgage Corp (FHLMC) | | 0.060 | | | 03/10/14 | | | 49,997 | |
| | | | | | | TOTAL GOVERNMENT AGENCY DEBT | | | | | | | | 281,165 | |
| | | | | | | | | | | | | | | | |
| TREASURY DEBT - 0.2% | | | | | | | | | |
| | 2,000,000 | | | | | United States Treasury Bill | | 0.070 | | | 03/06/14 | | | 2,000 | |
| | 1,000,000 | | | | | United States Treasury Bill | | 0.065 | | | 03/20/14 | | | 1,000 | |
| | 20,000,000 | | | | | United States Treasury Bill | | 0.071 | | | 04/03/14 | | | 19,997 | |
| | 12,600,000 | | | | | United States Treasury Bill | | 0.075 | | | 04/10/14 | | | 12,598 | |
| | 14,000,000 | | | | | United States Treasury Bill | | 0.076-0.077 | | | 04/24/14 | | | 13,997 | |
| | 1,000,000 | | | | | United States Treasury Bill | | 0.088 | | | 05/29/14 | | | 1,000 | |
| | 11,000,000 | | | | | United States Treasury Bill | | 0.070 | | | 06/19/14 | | | 10,996 | |
| | 20,700,000 | | | | | United States Treasury Bill | | 0.088-0.101 | | | 06/26/14 | | | 20,692 | |
| | 4,000,000 | | | | | United States Treasury Bill | | 0.101-0.103 | | | 07/24/14 | | | 3,998 | |
| | 28,000,000 | | | | | United States Treasury Bill | | 0.091-0.095 | | | 08/21/14 | | | 27,987 | |
| | 30,000,000 | | | | | United States Treasury Note | | 0.250 | | | 04/30/14 | | | 30,015 | |
| | | | | | | TOTAL TREASURY DEBT | | | | | | | | 144,280 | |
| | | | | | | | | | | | | | | | |
| INVESTMENT OF CASH COLLATERAL FOR SECURITIES LOANED - 3.9% | | | | | | | |
| | | | | | | | |
| REPURCHASE AGREEMENT - 3.4% | | | | | | | | | |
| | 200,000,000 | | | n | | Bank of Nova Scotia | | 0.010 | | | 01/02/14 | | | 200,000 | |
| | 800,000,000 | | | o | | Barclays | | 0.010 | | | 01/02/14 | | | 800,000 | |
| | 200,000,000 | | | p | | BNP | | 0.005 | | | 01/02/14 | | | 200,000 | |
| | 700,000,000 | | | q | | Calyon | | 0.020 | | | 01/02/14 | | | 700,000 | |
| | 440,000,000 | | | r | | Citigroup | | 0.010 | | | 01/02/14 | | | 440,000 | |
| | 50,000,000 | | | s | | CSFB | | 0.005 | | | 01/02/14 | | | 50,000 | |
| | 74,000,000 | | | t | | Deutsche Bank | | 0.020 | | | 01/02/14 | | | 74,000 | |
| | 600,000,000 | | | u | | Merrill Lynch | | 0.010-0.050 | | | 01/02/14 | | | 600,000 | |
| | 235,000,000 | | | v | | Morgan Stanley | | 0.020 | | | 01/02/14 | | | 235,000 | |
| | 951,000,000 | | | x | | Royal Bank of Scotland | | 0.010 | | | 01/02/14 | | | 951,000 | |
| | 100,000,000 | | | y | | Societe Generale | | 0.010 | | | 01/02/14 | | | 100,000 | |
| | | | | | | TOTAL REPURCHASE AGREEMENT | | | | | | | | 4,350,000 | |
| TREASURY DEBT - 0.1% | | | | | | | | | |
| | 10,000,000 | | | | | United States Treasury Bill | | 0.010 | | | 01/02/14 | | | 10,000 | |
| | 85,000,000 | | | | | United States Treasury Bill | | 0.010 | | | 01/09/14 | | | 85,000 | |
| | 45,000,000 | | | | | United States Treasury Bill | | 0.010 | | | 01/16/14 | | | 45,000 | |
| | | | | | | TOTAL TREASURY DEBT | | | | | | | | 140,000 | |
| | | | | | | | | | | | | | | | |
| VARIABLE RATE SECURITIES - 0.4% | | | | | | | | | |
| | 75,000,000 | | | i | | CIBC Bank and Trust Co | | 0.010 | | | 01/02/14 | | | 75,000 | |
| | 11,079,323 | | | i | | Granite Master Issuer plc 2006 | | 0.367 | | | 12/20/50 | | | 10,954 | |
| | 8,760,395 | | | i | | Granite Master Issuer plc 2007 | | 0.367 | | | 12/20/50 | | | 8,661 | |
| | 4,942,749 | | | i | | Medallion Trust 2005 | | 0.278 | | | 08/22/36 | | | 4,924 | |
| | 4,240,910 | | | i | | Nelnet Student Loan Trust 2007 | | 0.496 | | | 09/25/18 | | | 4,241 | |
| | 9,073,350 | | | i | | Puma Finance Ltd | | 0.379 | | | 02/21/38 | | | 8,990 | |
| | 176,000,000 | | | i | | Royal Bank of Canada Trust | | 0.010 | | | 01/02/14 | | | 176,000 | |
COLLEGE RETIREMENT EQUITIES FUND - Stock Account
| | | | | | | | | | | MATURITY | | VALUE | |
| PRINCIPAL | | | | | ISSUER | | RATE | | DATE | | (000) | |
| $ | 170,000,000 | | | i | | SLM Student Loan Trust 2007 | | 0.278 | % | | 01/25/19 | | $ | 167,514 | |
| | 18,214,771 | | | i | | SLM Student Loan Trust 2008 | | 0.588 | | | 10/25/16 | | | 18,213 | |
| | | | | | | TOTAL VARIABLE RATE SECURITIES | | | | | | | | 474,497 | |
| | | | | | | | | | | | | | | | |
| | | | | | | TOTAL INVESTMENT OF CASH COLLATERAL FOR SECURITIES LOANED | | | 4,964,497 | |
| | | | | | | | | | | | | | | | |
| | | | | | | TOTAL SHORT-TERM INVESTMENTS | | | | | | | | 5,389,942 | |
| | | | | | | (Cost $5,391,872) | | | | | | | | | |
| | | | | | | TOTAL INVESTMENTS - 103.8% | | | | | | | | 131,053,063 | |
| | | | | | | (Cost $106,164,248) | | | | | | | | | |
| | | | | | | OTHER ASSETS & LIABILITIES, NET - (3.8)% | | | | | | | | (4,709,701 | ) |
| | | | | | | NET ASSETS - 100.0% | | | | | | | $ | 126,343,362 | |
| | | | | | | | |
| | | | | | | Abbreviation(s): |
| | ADR | | | | | American Depositary Receipt |
| | ETF | | | | | Exchange Traded Fund |
| | GDR | | | | | Global Depositary Receipt |
| | NVDR | | | | | Non Voting Depository Receipt |
| | REIT | | | | | Real Estate Investment Trust |
| | SPDR | | | | | Standard & Poor’s Depository Receipts |
| | * | | | | | Non-income producing. |
| | ^ | | | | | Amount represents less than $1,000. |
| | a | | | | | Affiliated holding. |
| | b | | | | | In bankruptcy |
| | e | | | | | All or a portion of these securities are out on loan. The aggregate value of securities on loan is $4,975,468,000. |
| | f | | | | | Restricted security. At 12/31/2013, the aggregate value of these securities amounted to $409,000, or 0.0% of net assets. |
| | g | | | | | Security is exempt from registration under Rule 144(A) of the Securities Act of 1933 and may be resold in transactions exempt from registration to qualified institutional buyers. At December 31, 2013, the aggregate value of these securities amounted to $6,690,000, or 0.0% of net assets. |
| | i | | | | | Floating or variable rate security. Coupon rate reflects the rate at period end. |
| | j | | | | | Zero coupon |
| | m | | | | | Indicates a security that has been deemed illiquid. |
| | n | | | | | Agreement with Bank of Nova Scotia, 0.01% dated 12/31/13 to be repurchased at $200,000,000 on 1/2/14, collateralized by U.S. Government Agency Securities valued at $204,000,000. |
| | o | | | | | Agreement with Barclays, 0.01% dated 12/31/13 to be repurchased at $800,000,000 on 1/2/14, collateralized by U.S. Government Agency Securities valued at $816,422,000. |
| | p | | | | | Agreement with BNP, 0.01% dated 12/31/13 to be repurchased at $200,000,000 on 1/2/14, collateralized by U.S. Government Agency Securities valued at $204,000,000. |
| | q | | | | | Agreement with Calyon, 0.02% dated 12/31/13 to be repurchased at $700,000,000 on 1/2/14, collateralized by U.S. Government Agency Securities valued at $714,000,000. |
| | r | | | | | Agreement with Citigroup, 0.01% dated 12/31/13 to be repurchased at $440,000,000 on 1/2/14, collateralized by U.S. Government Agency Securities valued at $448,800,000. |
| | s | | | | | Agreement with CSFB, 0.01% dated 12/31/13 to be repurchased at $50,002,000 on 1/2/14, collateralized by U.S. Government Agency Securities valued at $51,002,000. |
| | | | | | | | |
COLLEGE RETIREMENT EQUITIES FUND - Stock Account
| | | t | | | | Agreement with Deutsche Bank, 0.02% dated 12/31/13 to be repurchased at $74,000,000 on 1/2/14, collateralized by U.S. Government Agency Securities valued at $75,480,000. |
| | | u | | | | Agreements with Merrill Lynch, 0.01-0.05% dated 12/31/13 to be repurchased at $600,001,000 on 1/2/14, collateralized by U.S. Government Agency Securities valued at $612,000,000. |
| | | v | | | | Agreement with Morgan Stanley, 0.02% dated 12/31/13 to be repurchased at $235,000,000 on 1/2/14, collateralized by U.S. Government Agency Securities valued at $239,700,000. |
| | | x | | | | Agreement with Royal Bank of Scotland, 0.01% dated 12/31/13 to be repurchased at $951,003,000 on 1/2/14, collateralized by U.S. Government Agency Securities valued at $970,023,000. |
| | | y | | | | Agreement with Societe Generale, 0.01% dated 12/31/13 to be repurchased at $100,000,000 on 1/2/14, collateralized by U.S. Government Agency Securities valued at $102,000,000. |
| | | | | | | |
| | | | | | | Cost amounts are in thousands. |
COLLEGE RETIREMENT EQUITIES FUND
STOCK ACCOUNT
SUMMARY OF MARKET VALUES BY COUNTRY
December 31, 2013
| Country | | Value
(000) | | | % of total
portfolio | |
| DOMESTIC | | | | | | | | |
| | | | | | | | | |
| UNITED STATES | | $ | 92,283,454 | | | | 70.4 | % |
| TOTAL DOMESTIC | | | 92,283,454 | | | | 70.4 | |
| FOREIGN | | | | | | | | |
| | | | | | | | | |
| ARGENTINA | | | 1,097 | | | | 0.0 | |
| AUSTRALIA | | | 1,579,882 | | | | 1.2 | |
| AUSTRIA | | | 131,406 | | | | 0.1 | |
| BELGIUM | | | 248,061 | | | | 0.2 | |
| BERMUDA | | | 69,703 | | | | 0.1 | |
| BRAZIL | | | 796,018 | | | | 0.6 | |
| CAMBODIA | | | 2,294 | | | | 0.0 | |
| CANADA | | | 2,818,620 | | | | 2.2 | |
| CAYMAN ISLANDS | | | 31,038 | | | | 0.0 | |
| CHILE | | | 108,930 | | | | 0.1 | |
| CHINA | | | 1,600,220 | | | | 1.2 | |
| COLOMBIA | | | 76,126 | | | | 0.1 | |
| CYPRUS | | | 13,249 | | | | 0.0 | |
| CZECH REPUBLIC | | | 24,992 | | | | 0.0 | |
| DENMARK | | | 328,240 | | | | 0.3 | |
| EGYPT | | | 16,761 | | | | 0.0 | |
| FAROE ISLANDS | | | 786 | | | | 0.0 | |
| FINLAND | | | 306,668 | | | | 0.2 | |
| FRANCE | | | 3,094,433 | | | | 2.4 | |
| GEORGIA | | | 3,894 | | | | 0.0 | |
| GERMANY | | | 2,611,758 | | | | 2.0 | |
| GIBRALTAR | | | 1,681 | | | | 0.0 | |
| GREECE | | | 104,253 | | | | 0.1 | |
| GUERNSEY, C.I. | | | 2,398 | | | | 0.0 | |
| HONG KONG | | | 880,916 | | | | 0.7 | |
| HUNGARY | | | 17,478 | | | | 0.0 | |
| INDIA | | | 567,485 | | | | 0.4 | |
| INDONESIA | | | 170,025 | | | | 0.1 | |
| IRELAND | | | 369,674 | | | | 0.3 | |
| ISLE OF MAN | | | 5,502 | | | | 0.0 | |
| ISRAEL | | | 103,485 | | | | 0.1 | |
| ITALY | | | 525,080 | | | | 0.4 | |
| JAPAN | | | 5,782,017 | | | | 4.4 | |
| JERSEY, C.I. | | | 4,870 | | | | 0.0 | |
| KOREA, REPUBLIC OF | | | 1,285,907 | | | | 1.0 | |
| LUXEMBOURG | | | 45,207 | | | | 0.0 | |
| MACAU | | | 26,528 | | | | 0.0 | |
| MALAYSIA | | | 275,133 | | | | 0.2 | |
| MEXICO | | | 407,296 | | | | 0.3 | |
| MONACO | | | 1,744 | | | | 0.0 | |
COLLEGE RETIREMENT EQUITIES FUND - Stock Account
| Country | | Value
(000) | | | % of total
portfolio | |
| NETHERLANDS | | $ | 1,267,340 | | | | 1.0 | % |
| NEW ZEALAND | | | 90,557 | | | | 0.1 | |
| NORWAY | | | 263,659 | | | | 0.2 | |
| PANAMA | | | 37,307 | | | | 0.0 | |
| PERU | | | 22,899 | | | | 0.0 | |
| PHILIPPINES | | | 98,837 | | | | 0.1 | |
| POLAND | | | 132,587 | | | | 0.1 | |
| PORTUGAL | | | 40,364 | | | | 0.0 | |
| PUERTO RICO | | | 7,632 | | | | 0.0 | |
| ROMANIA | | | 596 | | | | 0.0 | |
| RUSSIA | | | 416,966 | | | | 0.3 | |
| SINGAPORE | | | 420,210 | | | | 0.3 | |
| SOUTH AFRICA | | | 538,412 | | | | 0.4 | |
| SPAIN | | | 500,520 | | | | 0.4 | |
| SWEDEN | | | 905,527 | | | | 0.7 | |
| SWITZERLAND | | | 2,383,614 | | | | 1.8 | |
| TAIWAN | | | 1,007,805 | | | | 0.8 | |
| THAILAND | | | 191,498 | | | | 0.1 | |
| TURKEY | | | 136,188 | | | | 0.1 | |
| UKRAINE | | | 2,962 | | | | 0.0 | |
| UNITED ARAB EMIRATES | | | 26,230 | | | | 0.0 | |
| UNITED KINGDOM | | | 5,837,044 | | | | 4.5 | |
| TOTAL FOREIGN | | | 38,769,609 | | | | 29.6 | |
| | | | | | | | | |
| TOTAL PORTFOLIO | | $ | 131,053,063 | | | | 100.0 | % |
COLLEGE RETIREMENT EQUITIES FUND - Global Equities Account
COLLEGE RETIREMENT EQUITIES FUND
GLOBAL EQUITIES ACCOUNT
SCHEDULE OF INVESTMENTS
December 31, 2013
| | | | | | | VALUE | |
| SHARES | | | | | COMPANY | | (000) | |
| COMMON STOCKS - 98.7% | | | | |
| | | | | | | | | | | |
| AUSTRALIA - 2.1% | | | | |
| | 163,257 | | | | | AGL Energy Ltd | | $ | 2,195 | |
| | 38,310 | | | e | | ALS Ltd | | | 302 | |
| | 821,298 | | | * | | Alumina Ltd | | | 815 | |
| | 508,242 | | | | | Amcor Ltd | | | 4,801 | |
| | 1,043,819 | | | | | AMP Ltd | | | 4,103 | |
| | 83,313 | | | | | APA Group | | | 447 | |
| | 217,586 | | | | | Asciano Group | | | 1,122 | |
| | 1,231,091 | | | | | Australia & New Zealand Banking Group Ltd | | | 35,539 | |
| | 58,495 | | | | | Australian Stock Exchange Ltd | | | 1,924 | |
| | 32,439 | | | | | Bank of Queensland Ltd | | | 353 | |
| | 58,247 | | | | | Bendigo Bank Ltd | | | 612 | |
| | 681,005 | | | *,m | | BGP Holdings plc | | | 0 | ^ |
| | 2,183,307 | | | | | BHP Billiton Ltd | | | 74,436 | |
| | 126,480 | | | * | | BlueScope Steel Ltd | | | 660 | |
| | 112,790 | | | | | Boral Ltd | | | 482 | |
| | 375,169 | | | | | Brambles Ltd | | | 3,074 | |
| | 19,276 | | | | | Caltex Australia Ltd | | | 346 | |
| | 299,781 | | | | | CFS Gandel Retail Trust | | | 522 | |
| | 800,000 | | | | | Challenger Financial Services Group Ltd | | | 4,443 | |
| | 188,867 | | | | | Coca-Cola Amatil Ltd | | | 2,032 | |
| | 5,820 | | | e | | Cochlear Ltd | | | 307 | |
| | 445,398 | | | | | Commonwealth Bank of Australia | | | 31,034 | |
| | 153,521 | | | | | Computershare Ltd | | | 1,564 | |
| | 425,371 | | | | | Crown Ltd | | | 6,418 | |
| | 159,620 | | | | | CSL Ltd | | | 9,840 | |
| | 799,457 | | | e | | David Jones Ltd | | | 2,161 | |
| | 690,069 | | | | | DB RREEF Trust | | | 621 | |
| | 70,491 | | | | | DuluxGroup Ltd | | | 338 | |
| | 2,503,937 | | | | | Echo Entertainment Group Ltd | | | 5,516 | |
| | 140,519 | | | | | Federation Centres | | | 295 | |
| | 155,174 | | | e | | Flight Centre Ltd | | | 6,609 | |
| | 156,894 | | | e | | Fortescue Metals Group Ltd | | | 820 | |
| | 254,897 | | | | | GPT Group (ASE) | | | 775 | |
| | 71,155 | | | e | | Harvey Norman Holdings Ltd | | | 201 | |
| | 42,685 | | | e | | Iluka Resources Ltd | | | 331 | |
| | 338,253 | | | | | Incitec Pivot Ltd | | | 811 | |
| | 678,304 | | | | | Insurance Australia Group Ltd | | | 3,532 | |
| | 3,092,546 | | | e | | John Fairfax Holdings Ltd | | | 1,773 | |
| | 49,341 | | | e | | Leighton Holdings Ltd | | | 713 | |
| | 199,766 | | | | | Lend Lease Corp Ltd | | | 1,994 | |
| | 228,949 | | | | | Macquarie Goodman Group | | | 970 | |
| | 118,812 | | | | | Macquarie Group Ltd | | | 5,832 | |
| | 119,767 | | | e | | Metcash Ltd | | | 338 | |
| | 1,165,131 | | | e | | Mirvac Group | | | 1,752 | |
COLLEGE RETIREMENT EQUITIES FUND - Global Equities Account
| SHARES | | | | | COMPANY | | VALUE
(000) | |
| | 1,057,074 | | | | | National Australia Bank Ltd | | $ | 32,993 | |
| | 485,955 | | | | | Newcrest Mining Ltd | | | 3,412 | |
| | 321,889 | | | | | OneSteel Ltd | | | 505 | |
| | 121,208 | | | | | Orica Ltd | | | 2,592 | |
| | 378,804 | | | | | Origin Energy Ltd | | | 4,774 | |
| | 385,302 | | | * | | Orora Ltd | | | 399 | |
| | 87,299 | | | | | Oxiana Ltd | | | 247 | |
| | 152,328 | | | * | | Qantas Airways Ltd | | | 149 | |
| | 470,808 | | | | | QBE Insurance Group Ltd | | | 4,857 | |
| | 203,087 | | | | | QR National Ltd | | | 887 | |
| | 13,266 | | | | | Ramsay Health Care Ltd | | | 513 | |
| | 43,306 | | | * | | Recall Holdings Ltd | | | 157 | |
| | 204,174 | | | | | Rio Tinto Ltd | | | 12,497 | |
| | 321,180 | | | | | Santos Ltd | | | 4,209 | |
| | 32,818 | | | | | Seek Ltd | | | 395 | |
| | 52,514 | | | | | Shopping Centres Australasia Property Group | | | 72 | |
| | 7,271 | | | *,e | | Sims Group Ltd | | | 71 | |
| | 38,272 | | | | | Sonic Healthcare Ltd | | | 568 | |
| | 228,269 | | | | | SP AusNet | | | 254 | |
| | 850,086 | | | e | | Stockland Trust Group | | | 2,748 | |
| | 474,303 | | | | | Suncorp-Metway Ltd | | | 5,567 | |
| | 241,822 | | | | | Sydney Airport | | | 822 | |
| | 103,088 | | | | | Tabcorp Holdings Ltd | | | 335 | |
| | 202,242 | | | | | Tattersall’s Ltd | | | 561 | |
| | 1,647,665 | | | | | Telstra Corp Ltd | | | 7,733 | |
| | 262,747 | | | | | Toll Holdings Ltd | | | 1,336 | |
| | 394,333 | | | | | Transurban Group | | | 2,411 | |
| | 64,872 | | | | | Treasury Wine Estates Ltd | | | 280 | |
| | 366,230 | | | | | Wesfarmers Ltd | | | 14,420 | |
| | 2,166,342 | | | | | Westfield Group | | | 19,556 | |
| | 1,440,116 | | | | | Westfield Retail Trust | | | 3,826 | |
| | 790,738 | | | | | Westpac Banking Corp | | | 22,922 | |
| | 219,868 | | | | | Woodside Petroleum Ltd | | | 7,658 | |
| | 389,079 | | | | | Woolworths Ltd | | | 11,782 | |
| | 42,914 | | | | | WorleyParsons Ltd | | | 638 | |
| | | | | | | TOTAL AUSTRALIA | | | 394,899 | |
| | | | | | | | | | | |
| AUSTRIA - 0.1% | | | | |
| | 98,883 | | | | | Andritz AG. | | | 6,197 | |
| | 23,188 | | | | | Erste Bank der Oesterreichischen Sparkassen AG. | | | 808 | |
| | 65,989 | | | *,e,m | | Immoeast AG. | | | 0 | ^ |
| | 47,916 | | | | | Immofinanz Immobilien Anlagen AG. | | | 222 | |
| | 3,623 | | | | | Oest Elektrizitatswirts AG. (Class A) | | | 77 | |
| | 170,000 | | | | | Oesterreichische Post AG. | | | 8,157 | |
| | 14,794 | | | | | OMV AG. | | | 708 | |
| | 5,009 | | | e | | Raiffeisen International Bank Holding AG. | | | 177 | |
| | 27,660 | | | | | Telekom Austria AG. | | | 209 | |
| | 11,166 | | | | | Voestalpine AG. | | | 537 | |
| | 3,853 | | | | | Wiener Staedtische Allgemeine Versicherung AG. | | | 193 | |
| | | | | | | TOTAL AUSTRIA | | | 17,285 | |
COLLEGE RETIREMENT EQUITIES FUND - Global Equities Account
| | | | | | | VALUE | |
| SHARES | | | | | COMPANY | | (000) | |
| BELGIUM - 0.3% | | | | |
| | 22,696 | | | | | Ageas | | $ | 968 | |
| | 198,142 | | | | | Anheuser-Busch InBev NV (ADR) | | | 21,094 | |
| | 31,925 | | | *,m | | Anheuser-Busch InBev NV (Strip VVPR) | | | 0 | ^ |
| | 15,142 | | | | | Belgacom S.A. | | | 448 | |
| | 7,459 | | | | | Colruyt S.A. | | | 417 | |
| | 10,052 | | | | | Delhaize Group | | | 598 | |
| | 8,016 | | | | | Groupe Bruxelles Lambert S.A. | | | 736 | |
| | 477 | | | *,m | | Groupe Bruxelles Lambert S.A. - (Strip VVPR) | | | 0 | ^ |
| | 80,995 | | | | | InBev NV | | | 8,613 | |
| | 20,544 | | | | | KBC Groep NV | | | 1,168 | |
| | 1,411 | | | | | Mobistar S.A. | | | 27 | |
| | 5,933 | | | | | Solvay S.A. | | | 939 | |
| | 2,685 | | | | | Telenet Group Holding NV | | | 160 | |
| | 271,170 | | | | | UCB S.A. | | | 20,203 | |
| | 11,496 | | | | | Umicore | | | 537 | |
| | | | | | | TOTAL BELGIUM | | | 55,908 | |
| | | | | | | | | | | |
| BERMUDA - 0.1% | | | | |
| | 894,597 | | | * | | Third Point Reinsurance Ltd | | | 16,577 | |
| | | | | | | TOTAL BERMUDA | | | 16,577 | |
| | | | | | | | | | | |
| BRAZIL - 0.1% | | | | |
| | 244,700 | | | | | Cia Brasileira de Distribuicao Grupo Pao de Acucar | | | 10,892 | |
| | 50,000 | | | e | | Cia Brasileira de Distribuicao Grupo Pao de Acucar (ADR) | | | 2,234 | |
| | | | | | | TOTAL BRAZIL | | | 13,126 | |
| | | | | | | | | | | |
| CANADA - 3.5% | | | | |
| | 27,259 | | | | | Agnico-Eagle Mines Ltd | | | 719 | |
| | 39,953 | | | | | Agrium, Inc (Toronto) | | | 3,655 | |
| | 300,126 | | | | | Alimentation Couche Tard, Inc | | | 22,569 | |
| | 57,226 | | | e | | AltaGas Income Trust | | | 2,196 | |
| | 279,921 | | | e | | ARC Energy Trust | | | 7,792 | |
| | 14,081 | | | | | Atco Ltd | | | 618 | |
| | 227,350 | | | *,e | | Athabasca Oil Corp | | | 1,387 | |
| | 247,604 | | | e | | Bank of Montreal (Toronto) | | | 16,505 | |
| | 454,551 | | | e | | Bank of Nova Scotia | | | 28,426 | |
| | 556,835 | | | | | Barrick Gold Corp (Canada) | | | 9,808 | |
| | 71,896 | | | e | | Baytex Energy Trust | | | 2,818 | |
| | 245,811 | | | e | | BCE, Inc | | | 10,645 | |
| | 55,867 | | | e | | Bell Aliant Regional Communications Income Fund | | | 1,406 | |
| | 5,600 | | | * | | Blackberry Ltd | | | 42 | |
| | 847,113 | | | e | | Bombardier, Inc | | | 3,676 | |
| | 162,888 | | | e | | Brookfield Asset Management, Inc | | | 6,321 | |
| | 127,372 | | | | | CAE, Inc | | | 1,620 | |
| | 84,437 | | | e | | Cameco Corp | | | 1,752 | |
| | 208,546 | | | e | | Canadian Imperial Bank of Commerce/Canada | | | 17,811 | |
| | 663,004 | | | | | Canadian National Railway Co | | | 37,799 | |
| | 469,925 | | | e | | Canadian Natural Resources Ltd (Canada) | | | 15,899 | |
| | 228,991 | | | | | Canadian Oil Sands Trust | | | 4,307 | |
| | 177,180 | | | | | Canadian Pacific Railway Ltd (Toronto) | | | 26,796 | |
| | 89,637 | | | e | | Canadian Tire Corp Ltd | | | 8,395 | |
COLLEGE RETIREMENT EQUITIES FUND - Global Equities Account
| | | | | | | VALUE | |
| SHARES | | | | | COMPANY | | (000) | |
| | 24,512 | | | | | Canadian Utilities Ltd | | $ | 823 | |
| | 200,000 | | | * | | Canfor Corp | | | 5,020 | |
| | 390,000 | | | * | | Celestica, Inc | | | 4,053 | |
| | 231,115 | | | | | Cenovus Energy, Inc (Toronto) | | | 6,614 | |
| | 115,689 | | | * | | CGI Group, Inc | | | 3,871 | |
| | 38,756 | | | e | | CI Financial Corp | | | 1,290 | |
| | 173,515 | | | e | | Crescent Point Energy Corp | | | 6,738 | |
| | 213,225 | | | | | Dollarama, Inc | | | 17,706 | |
| | 445,770 | | | | | Eldorado Gold Corp | | | 2,530 | |
| | 7,471 | | | | | Empire Co Ltd | | | 510 | |
| | 247,305 | | | e | | Enbridge, Inc | | | 10,805 | |
| | 200,579 | | | e | | EnCana Corp | | | 3,622 | |
| | 30,239 | | | e | | Enerplus Resources Fund | | | 549 | |
| | 2,088 | | | | | Fairfax Financial Holdings Ltd | | | 834 | |
| | 98,266 | | | e | | Finning International, Inc | | | 2,512 | |
| | 39,959 | | | | | First Capital Realty, Inc | | | 666 | |
| | 277,580 | | | | | First Quantum Minerals Ltd | | | 5,002 | |
| | 96,138 | | | e | | Fortis, Inc | | | 2,756 | |
| | 82,052 | | | | | Franco-Nevada Corp | | | 3,344 | |
| | 11,015 | | | e | | George Weston Ltd | | | 804 | |
| | 66,223 | | | | | Gildan Activewear, Inc | | | 3,529 | |
| | 229,513 | | | | | Goldcorp, Inc | | | 4,978 | |
| | 145,254 | | | | | Great-West Lifeco, Inc | | | 4,478 | |
| | 81,680 | | | | | H&R Real Estate Investment Trust | | | 1,646 | |
| | 162,675 | | | e | | Husky Energy, Inc | | | 5,161 | |
| | 16,200 | | | | | IAMGOLD Corp | | | 54 | |
| | 53,140 | | | e | | IGM Financial, Inc | | | 2,806 | |
| | 135,978 | | | e | | Imperial Oil Ltd | | | 6,022 | |
| | 21,718 | | | | | Industrial Alliance Insurance and Financial Services, Inc | | | 960 | |
| | 24,984 | | | | | ING Canada, Inc | | | 1,632 | |
| | 68,745 | | | e | | Keyera Facilities Income Fund | | | 4,137 | |
| | 425,761 | | | | | Kinross Gold Corp | | | 1,864 | |
| | 130,000 | | | | | Linamar Corp | | | 5,408 | |
| | 17,989 | | | e | | Loblaw Cos Ltd | | | 718 | |
| | 11,728 | | | *,e | | Lululemon Athletica, Inc | | | 692 | |
| | 80,000 | | | | | Magna International, Inc - Class A (NY) | | | 6,565 | |
| | 70,507 | | | | | Magna International, Inc (Class A) | | | 5,781 | |
| | 586,477 | | | | | Manulife Financial Corp | | | 11,572 | |
| | 16,723 | | | * | | MEG Energy Corp | | | 482 | |
| | 25,054 | | | | | Methanex Corp | | | 1,482 | |
| | 136,175 | | | e | | Metro, Inc | | | 8,320 | |
| | 73,210 | | | | | National Bank of Canada | | | 6,092 | |
| | 255,724 | | | * | | New Gold, Inc | | | 1,338 | |
| | 24,048 | | | | | Onex Corp | | | 1,298 | |
| | 71,046 | | | | | Open Text Corp | | | 6,535 | |
| | 3,901 | | | | | Pan American Silver Corp | | | 46 | |
| | 88,609 | | | e | | Pembina Pipeline Income Fund | | | 3,121 | |
| | 94,232 | | | e | | Pengrowth Energy Trust | | | 583 | |
| | 80,223 | | | e | | Penn West Energy Trust | | | 670 | |
| | 678,188 | | | e | | Peyto Energy Trust | | | 20,756 | |
| | 353,146 | | | e | | Potash Corp of Saskatchewan (Toronto) | | | 11,642 | |
| | 84,105 | | | e | | Power Corp Of Canada | | | 2,530 | |
COLLEGE RETIREMENT EQUITIES FUND - Global Equities Account
| SHARES | | | | | COMPANY | | VALUE
(000) | |
| | 58,370 | | | e | | Power Financial Corp | | $ | 1,978 | |
| | 101,664 | | | | | RioCan Real Estate Investment Trust | | | 2,371 | |
| | 4,658 | | | | | Ritchie Bros Auctioneers, Inc | | | 107 | |
| | 109,634 | | | e | | Rogers Communications, Inc (Class B) | | | 4,961 | |
| | 537,166 | | | | | Royal Bank of Canada (Toronto) | | | 36,111 | |
| | 66,555 | | | | | Saputo, Inc | | | 3,032 | |
| | 84,533 | | | e | | Shaw Communications, Inc (B Shares) | | | 2,057 | |
| | 49,750 | | | e | | Shoppers Drug Mart Corp | | | 2,725 | |
| | 65,441 | | | | | Silver Wheaton Corp | | | 1,321 | |
| | 25,100 | | | | | SNC-Lavalin Group, Inc | | | 1,129 | |
| | 179,385 | | | | | Sun Life Financial, Inc | | | 6,336 | |
| | 1,024,337 | | | | | Suncor Energy, Inc | | | 35,911 | |
| | 957,026 | | | | | Talisman Energy, Inc (Toronto) | | | 11,127 | |
| | 254,159 | | | e | | Teck Cominco Ltd | | | 6,616 | |
| | 51,457 | | | | | TELUS Corp | | | 1,771 | |
| | 100,482 | | | e | | Thomson Corp (Toronto) | | | 3,800 | |
| | 79,758 | | | | | Tim Hortons, Inc (Toronto) | | | 4,654 | |
| | 540,735 | | | | | Toronto-Dominion Bank | | | 50,961 | |
| | 188,644 | | | * | | Tourmaline Oil Corp | | | 7,938 | |
| | 149,098 | | | e | | TransAlta Corp | | | 1,892 | |
| | 431,052 | | | e | | TransCanada Corp | | | 19,697 | |
| | 322,540 | | | e | | TransForce, Inc | | | 7,670 | |
| | 276,340 | | | *,e | | Turquoise Hill Resources Ltd | | | 913 | |
| | 47,221 | | | e | | Vermilion Energy Trust | | | 2,772 | |
| | 180,000 | | | | | Westjet Airlines Ltd | | | 4,731 | |
| | 128,953 | | | | | Yamana Gold, Inc | | | 1,112 | |
| | | | | | | TOTAL CANADA | | | 669,602 | |
| | | | | | | | | | | |
| CAYMAN ISLANDS - 0.0% | | | | |
| | 41,607 | | | e | | Herbalife Ltd | | | 3,274 | |
| | | | | | | TOTAL CAYMAN ISLANDS | | | 3,274 | |
| | | | | | | | | | | |
| CHINA - 1.1% | | | | |
| | 8,651 | | | * | | 58.COM, Inc (ADR) | | | 332 | |
| | 6,712,000 | | | | | Agile Property Holdings Ltd | | | 7,217 | |
| | 794,000 | | | | | Agricultural Bank of China | | | 392 | |
| | 600,000 | | | e | | Anhui Conch Cement Co Ltd | | | 2,232 | |
| | 2,708,700 | | | | | Bank of Communications Co Ltd | | | 1,917 | |
| | 2,199,448 | | | | | BOC Hong Kong Holdings Ltd | | | 7,064 | |
| | 1,122,000 | | | | | China Aoyuan Property Group Ltd | | | 236 | |
| | 5,000,000 | | | | | China Construction Bank | | | 3,786 | |
| | 20,738,400 | | | | | China Everbright International Ltd | | | 27,860 | |
| | 4,734,000 | | | | | China Gas Holdings Ltd | | | 6,969 | |
| | 3,119,500 | | | | | China Merchants Bank Co Ltd | | | 6,671 | |
| | 3,875,000 | | | * | | China Modern Dairy Holdings | | | 2,103 | |
| | 1,300,255 | | | * | | China New Town Development Co Ltd | | | 114 | |
| | 6,000,000 | | | e | | China Railway Construction Corp | | | 5,990 | |
| | 12,000,000 | | | | | China Railway Group Ltd | | | 6,213 | |
| | 1,818,900 | | | | | China South Locomotive and Rolling Stock Corp | | | 1,496 | |
| | 7,000,000 | | | e | | Chongqing Rural Commercial Bank | | | 3,406 | |
| | 203,000 | | | | | CNOOC Ltd | | | 377 | |
| | 7,000,000 | | | | | Country Garden Holdings Co Ltd | | | 4,243 | |
COLLEGE RETIREMENT EQUITIES FUND - Global Equities Account
| | | | | | | VALUE | |
| SHARES | | | | | COMPANY | | (000) | |
| | 40,000 | | | * | | Ctrip.com International Ltd (ADR) | | $ | 1,985 | |
| | 5,121,000 | | | e | | Dah Chong Hong Holdings Ltd | | | 3,839 | |
| | 11,900,000 | | | | | Datang International Power Generation Co Ltd | | | 5,503 | |
| | 209,000 | | | *,e | | Glorious Property Holdings Ltd | | | 45 | |
| | 2,000,000 | | | e | | Golden Eagle Retail Group Ltd | | | 2,648 | |
| | 1,450,000 | | | e | | Great Wall Motor Co Ltd | | | 8,034 | |
| | 2,250,000 | | | | | Guangzhou R&F Properties Co Ltd | | | 3,301 | |
| | 1,000,000 | | | * | | Hisense Kelon Electrical Holdings Co Ltd | | | 1,519 | |
| | 15,000,000 | | | e | | Huadian Power International Co | | | 5,873 | |
| | 6,000,000 | | | | | Huaneng Power International, Inc | | | 5,440 | |
| | 16,910,000 | | | | | Huaneng Renewables Corp Ltd | | | 8,139 | |
| | 12,556,000 | | | | | Industrial & Commercial Bank of China | | | 8,514 | |
| | 11,074,000 | | | | | KWG Property Holding Ltd | | | 6,158 | |
| | 227,800 | | | *,e | | Qunar Cayman Islands Ltd (ADR) | | | 6,043 | |
| | 27,500 | | | * | | Sina Corp | | | 2,317 | |
| | 2,259,948 | | | | | Sino-Ocean Land Holdings Ltd | | | 1,487 | |
| | 2,900,000 | | | | | Sinopec Engineering Group Co Ltd | | | 4,348 | |
| | 222,800 | | | | | Tencent Holdings Ltd | | | 14,265 | |
| | 1,550,000 | | | | | Xinao Gas Holdings Ltd | | | 11,488 | |
| | 8,500,000 | | | * | | Xinyi Solar Holdings Ltd | | | 1,754 | |
| | 179,000 | | | e | | Yangzijiang Shipbuilding | | | 168 | |
| | 8,057,000 | | | e | | Yanlord Land Group Ltd | | | 7,842 | |
| | 3,521,000 | | | | | Zhuzhou CSR Times Electric Co Ltd | | | 12,700 | |
| | | | | | | TOTAL CHINA | | | 212,028 | |
| | | | | | | | | | | |
| COLOMBIA - 0.0% | | | | |
| | 168,044 | | | | | Pacific Rubiales Energy Corp (Toronto) | | | 2,901 | |
| | | | | | | TOTAL COLOMBIA | | | 2,901 | |
| | | | | | | | | | | |
| DENMARK - 0.4% | | | | |
| | 55 | | | | | AP Moller - Maersk AS (Class A) | | | 567 | |
| | 121 | | | | | AP Moller - Maersk AS (Class B) | | | 1,309 | |
| | 10,627 | | | | | Carlsberg AS (Class B) | | | 1,176 | |
| | 203,300 | | | | | Christian Hansen Holding | | | 8,059 | |
| | 11,107 | | | | | Coloplast AS | | | 736 | |
| | 56,021 | | | * | | Danske Bank AS | | | 1,287 | |
| | 19,509 | | | | | DSV AS | | | 641 | |
| | 300,000 | | | | | GN Store Nord | | | 7,373 | |
| | 184,167 | | | | | Novo Nordisk AS (Class B) | | | 33,758 | |
| | 38,008 | | | | | Novozymes AS | | | 1,606 | |
| | 741,798 | | | | | TDC AS | | | 7,195 | |
| | 300,000 | | | * | | Topdanmark AS | | | 7,906 | |
| | 2,454 | | | | | TrygVesta AS | | | 237 | |
| | 2,513 | | | *,e | | William Demant Holding | | | 244 | |
| | | | | | | TOTAL DENMARK | | | 72,094 | |
| | | | | | | | | | | |
| FINLAND - 0.4% | | | | |
| | 13,255 | | | | | Elisa Oyj (Series A) | | | 351 | |
| | 574,747 | | | | | Fortum Oyj | | | 13,149 | |
| | 3,021 | | | | | Kesko Oyj (B Shares) | | | 111 | |
| | 30,829 | | | | | Kone Oyj (Class B) | | | 1,390 | |
| | 12,739 | | | | | Metso Oyj | | | 545 | |
COLLEGE RETIREMENT EQUITIES FUND - Global Equities Account
| | | | | | | VALUE | |
| SHARES | | | | | COMPANY | | (000) | |
| | 12,112 | | | e | | Neste Oil Oyj | | $ | 240 | |
| | 4,811,845 | | | *,e | | Nokia Oyj | | | 38,880 | |
| | 10,843 | | | | | Nokian Renkaat Oyj | | | 520 | |
| | 413,786 | | | | | OKO Bank (Class A) | | | 8,297 | |
| | 5,034 | | | | | Orion Oyj (Class B) | | | 141 | |
| | 41,750 | | | | | Sampo Oyj (A Shares) | | | 2,052 | |
| | 55,717 | | | | | Stora Enso Oyj (R Shares) | | | 560 | |
| | 51,884 | | | | | UPM-Kymmene Oyj | | | 880 | |
| | 17,145 | | | | | Wartsila Oyj (B Shares) | | | 845 | |
| | | | | | | TOTAL FINLAND | | | 67,961 | |
| | | | | | | | | | | |
| FRANCE - 4.2% | | | | |
| | 398,642 | | | | | Accor S.A. | | | 18,828 | |
| | 2,921 | | | | | Aeroports de Paris | | | 332 | |
| | 57,693 | | | | | Air Liquide | | | 8,166 | |
| | 1,888,503 | | | * | | Alcatel S.A. | | | 8,381 | |
| | 594,900 | | | | | Alcatel-Lucent (ADR) | | | 2,618 | |
| | 21,029 | | | | | Alstom RGPT | | | 767 | |
| | 3,303 | | | | | Arkema | | | 386 | |
| | 278,603 | | | | | Atos Origin S.A. | | | 25,242 | |
| | 167,214 | | | | | AXA S.A. | | | 4,657 | |
| | 1,129,791 | | | | | BNP Paribas | | | 88,132 | |
| | 9,855 | | | e | | Bouygues S.A. | | | 373 | |
| | 20,546 | | | | | Bureau Veritas S.A. | | | 600 | |
| | 14,480 | | | | | Cap Gemini S.A. | | | 980 | |
| | 61,831 | | | | | Carrefour S.A. | | | 2,454 | |
| | 5,531 | | | | | Casino Guichard Perrachon S.A. | | | 638 | |
| | 1 | | | * | | CGG (ADR) | | | 0 | ^ |
| | 2,852 | | | | | Christian Dior S.A. | | | 540 | |
| | 15,482 | | | | | CNP Assurances | | | 317 | |
| | 348,874 | | | | | Compagnie de Saint-Gobain | | | 19,218 | |
| | 15,133 | | | * | | Compagnie Generale de Geophysique S.A. | | | 263 | |
| | 20,226 | | | | | Compagnie Generale d’Optique Essilor International S.A. | | | 2,152 | |
| | 93,651 | | | * | | Credit Agricole S.A. | | | 1,201 | |
| | 9,604 | | | * | | Criteo S.A. (ADR) | | | 328 | |
| | 6,320 | | | | | Dassault Systemes S.A. | | | 785 | |
| | 714,416 | | | | | Edenred | | | 23,920 | |
| | 885,481 | | | | | Electricite de France | | | 31,326 | |
| | 3,245 | | | | | Eurazeo | | | 255 | |
| | 933,585 | | | | | European Aeronautic Defence and Space Co | | | 71,671 | |
| | 7,716 | | | | | Eutelsat Communications | | | 241 | |
| | 631,229 | | | *,e | | Faurecia | | | 24,083 | |
| | 2,529 | | | | | Fonciere Des Regions | | | 218 | |
| | 115,139 | | | | | France Telecom S.A. | | | 1,429 | |
| | 678,301 | | | *,e | | GameLoft | | | 7,642 | |
| | 135,901 | | | | | Gaz de France | | | 3,196 | |
| | 1,986 | | | | | Gecina S.A. | | | 263 | |
| | 55,707 | | | | | Groupe Danone | | | 4,019 | |
| | 29,565 | | | | | Groupe Eurotunnel S.A. | | | 311 | |
| | 2,648 | | | | | Icade | | | 247 | |
| | 1,271 | | | | | Iliad S.A. | | | 260 | |
COLLEGE RETIREMENT EQUITIES FUND - Global Equities Account
| | | | | | | VALUE | |
| SHARES | | | | | COMPANY | | (000) | |
| | 3,391 | | | | | Imerys S.A. | | $ | 295 | |
| | 731,688 | | | | | JC Decaux S.A. | | | 30,206 | |
| | 9,447 | | | | | Klepierre | | | 438 | |
| | 375,167 | | | | | Lafarge S.A. | | | 28,160 | |
| | 5,826 | | | | | Lagardere S.C.A. | | | 217 | |
| | 18,509 | | | | | Legrand S.A. | | | 1,020 | |
| | 164,922 | | | | | L’Oreal S.A. | | | 28,962 | |
| | 175,956 | | | | | LVMH Moet Hennessy Louis Vuitton S.A. | | | 32,146 | |
| | 13,190 | | | | | Michelin (C.G.D.E.) (Class B) | | | 1,403 | |
| | 87,019 | | | | | Natixis | | | 512 | |
| | 123,998 | | | * | | Numericable SAS | | | 4,503 | |
| | 18,322 | | | | | Pernod-Ricard S.A. | | | 2,087 | |
| | 6,563 | | | | | PPR | | | 1,387 | |
| | 9,443 | | | | | Publicis Groupe S.A. | | | 865 | |
| | 153,470 | | | | | Remy Cointreau S.A. | | | 12,892 | |
| | 401,714 | | | | | Renault S.A. | | | 32,328 | |
| | 1,266,508 | | | | | Rexel S.A. | | | 33,238 | |
| | 22,454 | | | | | Safran S.A. | | | 1,561 | |
| | 609,648 | | | | | Sanofi-Aventis | | | 65,107 | |
| | 49,717 | | | | | Schneider Electric S.A. | | | 4,337 | |
| | 155,825 | | | | | SCOR | | | 5,700 | |
| | 2,724 | | | | | Societe BIC S.A. | | | 334 | |
| | 639,119 | | | | | Societe Generale | | | 37,165 | |
| | 5,004 | | | | | Sodexho Alliance S.A. | | | 507 | |
| | 274,479 | | | | | Suez Environnement S.A. | | | 4,922 | |
| | 10,208 | | | | | Technip S.A. | | | 983 | |
| | 314,852 | | | | | Teleperformance | | | 19,202 | |
| | 8,896 | | | | | Thales S.A. | | | 573 | |
| | 1,197,130 | | | | | Total S.A. | | | 73,479 | |
| | 8,919 | | | | | Unibail-Rodamco | | | 2,286 | |
| | 153,793 | | | | | Valeo S.A. | | | 17,044 | |
| | 10,683 | | | | | Vallourec | | | 583 | |
| | 17,689 | | | | | Veolia Environnement | | | 289 | |
| | 44,748 | | | | | Vinci S.A. | | | 2,941 | |
| | 119,716 | | | | | Vivendi Universal S.A. | | | 3,158 | |
| | 1,741 | | | | | Wendel | | | 254 | |
| | 1,713 | | | | | Zodiac S.A. | | | 304 | |
| | | | | | | TOTAL FRANCE | | | 807,827 | |
| | | | | | | | | | | |
| GERMANY - 4.2% | | | | |
| | 11,009 | | | | | Adidas-Salomon AG. | | | 1,404 | |
| | 501,168 | | | | | Allianz AG. | | | 90,173 | |
| | 1,999 | | | | | Axel Springer AG. | | | 129 | |
| | 91,431 | | | | | BASF AG. | | | 9,759 | |
| | 971,305 | | | | | Bayer AG. | | | 136,382 | |
| | 102,488 | | | | | Bayerische Motoren Werke AG. | | | 12,035 | |
| | 535 | | | | | Bayerische Motoren Werke AG. (Preference) | | | 46 | |
| | 697,946 | | | | | Beiersdorf AG. | | | 70,761 | |
| | 2,602 | | | | | Brenntag AG. | | | 483 | |
| | 8,417 | | | e | | Celesio AG. | | | 267 | |
| | 69,399 | | | * | | Commerzbank AG. | | | 1,120 | |
| | 133,603 | | | | | Continental AG. | | | 29,351 | |
COLLEGE RETIREMENT EQUITIES FUND - Global Equities Account
| | | | | | | VALUE | |
| SHARES | | | | | COMPANY | | (000) | |
| | 753,970 | | | | | Daimler AG. (Reg) | | $ | 65,433 | |
| | 881,170 | | | | | Deutsche Bank AG. | | | 42,333 | |
| | 19,330 | | | | | Deutsche Boerse AG. | | | 1,602 | |
| | 22,509 | | | * | | Deutsche Lufthansa AG. | | | 477 | |
| | 1,747,751 | | | | | Deutsche Post AG. | | | 63,837 | |
| | 281,411 | | | | | Deutsche Telekom AG. | | | 4,849 | |
| | 14,804 | | | | | Deutsche Wohnen AG. | | | 286 | |
| | 65,000 | | | | | Duerr AG. | | | 5,808 | |
| | 177,616 | | | | | E.ON AG. | | | 3,284 | |
| | 3,577 | | | | | Fraport AG. Frankfurt Airport Services Worldwide | | | 268 | |
| | 180,000 | | | | | Freenet AG. | | | 5,408 | |
| | 20,326 | | | | | Fresenius Medical Care AG. | | | 1,450 | |
| | 11,713 | | | | | Fresenius SE | | | 1,801 | |
| | 1,764 | | | | | Fuchs Petrolub AG. (Preference) | | | 173 | |
| | 9,382 | | | | | GEA Group AG. | | | 447 | |
| | 76,019 | | | | | Hannover Rueckversicherung AG. | | | 6,535 | |
| | 13,997 | | | | | HeidelbergCement AG. | | | 1,063 | |
| | 12,936 | | | | | Henkel KGaA | | | 1,349 | |
| | 17,762 | | | | | Henkel KGaA (Preference) | | | 2,065 | |
| | 1,746 | | | | | Hochtief AG. | | | 149 | |
| | 1,524 | | | | | Hugo Boss AG. | | | 217 | |
| | 107,372 | | | | | Infineon Technologies AG. | | | 1,147 | |
| | 17,513 | | | e | | K&S AG. | | | 540 | |
| | 1,118 | | | | | Kabel Deutschland Holding AG. | | | 145 | |
| | 59,080 | | | | | Lanxess AG. | | | 3,948 | |
| | 17,600 | | | | | Linde AG. | | | 3,685 | |
| | 1,933 | | | | | MAN AG. | | | 237 | |
| | 3,406 | | | | | Merck KGaA | | | 611 | |
| | 12,255 | | | | | Metro AG. | | | 594 | |
| | 101,156 | | | * | | Morphosys AG. | | | 7,799 | |
| | 48,133 | | | | | Muenchener Rueckver AG. | | | 10,617 | |
| | 357,338 | | | * | | Osram Licht AG. | | | 20,155 | |
| | 15,185 | | | | | Porsche AG. | | | 1,585 | |
| | 621,529 | | | * | | Premiere AG. | | | 6,870 | |
| | 675,508 | | | | | ProSiebenSat. Media AG. | | | 33,543 | |
| | 187,961 | | | | | RTL Group | | | 24,328 | |
| | 34,904 | | | | | RWE AG. | | | 1,279 | |
| | 2,667 | | | | | RWE AG. (Preference) | | | 85 | |
| | 1,835 | | | | | Salzgitter AG. | | | 78 | |
| | 285,090 | | | | | SAP AG. | | | 24,723 | |
| | 303,399 | | | | | Siemens AG. | | | 41,602 | |
| | 7,270 | | | | | Suedzucker AG. | | | 196 | |
| | 14,624 | | | | | Telefonica Deutschland Holding AG. | | | 121 | |
| | 36,294 | | | * | | ThyssenKrupp AG. | | | 885 | |
| | 5,255 | | | | | United Internet AG. | | | 224 | |
| | 63,806 | | | | | Volkswagen AG. | | | 17,324 | |
| | 118,263 | | | | | Volkswagen AG. (Preference) | | | 33,281 | |
| | 300,046 | | | | | Wirecard AG. | | | 11,877 | |
| | | | | | | TOTAL GERMANY | | | 808,223 | |
| | | | | | | | | | | |
| GREECE - 0.0% | | | | |
| | 381,000 | | | | | OPAP S.A. | | | 5,073 | |
| | | | | | | TOTAL GREECE | | | 5,073 | |
COLLEGE RETIREMENT EQUITIES FUND - Global Equities Account
| | | | | | | VALUE | |
| SHARES | | | | | COMPANY | | (000) | |
| HONG KONG - 1.3% | | | | |
| | 11,693,900 | | | | | AIA Group Ltd | | $ | 58,861 | |
| | 22,258 | | | e | | ASM Pacific Technology | | | 186 | |
| | 127,046 | | | | | Bank of East Asia Ltd | | | 539 | |
| | 111,237 | | | | | Cathay Pacific Airways Ltd | | | 236 | |
| | 641,111 | | | | | Cheung Kong Holdings Ltd | | | 10,143 | |
| | 61,661 | | | | | Cheung Kong Infrastructure Holdings Ltd | | | 390 | |
| | 511,456 | | | | | CLP Holdings Ltd | | | 4,045 | |
| | 1,370,331 | | | | | Esprit Holdings Ltd | | | 2,648 | |
| | 238,567 | | | | | First Pacific Co | | | 272 | |
| | 213,000 | | | * | | Galaxy Entertainment Group Ltd | | | 1,918 | |
| | 14,890,000 | | | *,e | | Goldpoly New Energy Holdings Ltd | | | 2,924 | |
| | 1,811,517 | | | | | Hang Lung Group Ltd | | | 9,164 | |
| | 8,480,337 | | | | | Hang Lung Properties Ltd | | | 26,882 | |
| | 369,470 | | | | | Hang Seng Bank Ltd | | | 6,001 | |
| | 384,290 | | | | | Henderson Land Development Co Ltd | | | 2,197 | |
| | 217,000 | | | | | HKT Trust and HKT Ltd | | | 215 | |
| | 1,898,144 | | | | | Hong Kong & China Gas Ltd | | | 4,358 | |
| | 310,279 | | | | | Hong Kong Electric Holdings Ltd | | | 2,470 | |
| | 294,639 | | | | | Hong Kong Exchanges and Clearing Ltd | | | 4,925 | |
| | 52,903 | | | | | Hopewell Holdings | | | 179 | |
| | 623,416 | | | | | Hutchison Whampoa Ltd | | | 8,495 | |
| | 64,519 | | | | | Hysan Development Co Ltd | | | 278 | |
| | 4,000,000 | | | e | | iShares Asia Trust - iShares FTSE/Xinhua A50 China Tracker | | | 4,818 | |
| | 7,250 | | | * | �� | Kerry Logistics Network Ltd | | | 10 | |
| | 1,541,927 | | | | | Kerry Properties Ltd | | | 5,369 | |
| | 1,938,638 | | | e | | Li & Fung Ltd | | | 2,506 | |
| | 1,803,500 | | | | | Lifestyle International Holdings Ltd | | | 3,340 | |
| | 2,505,557 | | | | | Link Real Estate Investment Trust | | | 12,152 | |
| | 451,415 | | | | | MTR Corp | | | 1,711 | |
| | 1,196,266 | | | | | New World Development Ltd | | | 1,515 | |
| | 428,750 | | | e | | Noble Group Ltd | | | 365 | |
| | 143,771 | | | | | NWS Holdings Ltd | | | 219 | |
| | 383,749 | | | | | PCCW Ltd | | | 172 | |
| | 2,262,600 | | | e | | Samsonite International | | | 6,901 | |
| | 1,110,200 | | | | | Sands China Ltd | | | 9,098 | |
| | 2,770,286 | | | * | | Shanghai Real Estate Ltd | | | 95 | |
| | 153,345 | | | | | Shangri-La Asia Ltd | | | 299 | |
| | 3,000,000 | | | | | Shimao Property Holdings Ltd | | | 6,916 | |
| | 302,371 | | | | | Sino Land Co | | | 415 | |
| | 198,000 | | | | | SJM Holdings Ltd | | | 666 | |
| | 1,462,775 | | | | | Sun Hung Kai Properties Ltd | | | 18,591 | |
| | 165,293 | | | | | Swire Pacific Ltd (Class A) | | | 1,942 | |
| | 185,356 | | | | | Swire Properties Ltd | | | 469 | |
| | 1,284,662 | | | | | Wharf Holdings Ltd | | | 9,841 | |
| | 93,780 | | | | | Wheelock & Co Ltd | | | 432 | |
| | 8,500,000 | | | e | | Xinyi Glass Holdings Co Ltd | | | 7,519 | |
| | 70,089 | | | | | Yue Yuen Industrial Holdings | | | 234 | |
| | | | | | | TOTAL HONG KONG | | | 242,921 | |
COLLEGE RETIREMENT EQUITIES FUND - Global Equities Account
| | | | | | | VALUE | |
| SHARES | | | | | COMPANY | | (000) | |
| INDIA - 0.3% | | | | |
| | 2,006,779 | | | * | | DEN Networks Ltd | | $ | 5,225 | |
| | 1,530,483 | | | * | | Dhanalakshmi Bank Ltd | | | 1,009 | |
| | 5,036,983 | | | | | DLF Ltd | | | 13,605 | |
| | 110,200 | | | | | Dr Reddy’s Laboratories Ltd | | | 4,510 | |
| | 383,004 | | | * | | Hathway Cables and Datacom Pvt Ltd | | | 1,757 | |
| | 38,021 | | | | | ING Vysya Bank Ltd | | | 377 | |
| | 283,431 | | | * | | Jyothy Laboratories Ltd | | | 871 | |
| | 454,322 | | | * | | LIC Housing Finance Ltd | | | 1,614 | |
| | 410,000 | | | * | | Lupin Ltd | | | 6,023 | |
| | 90,834 | | | | | Prestige Estates Projects Ltd | | | 239 | |
| | 1,371,039 | | | * | | Puravankara Projects Ltd | | | 1,800 | |
| | 800,000 | | | | | Sun Pharmaceutical Industries Ltd | | | 7,349 | |
| | 813,513 | | | * | | Sunteck Realty Ltd | | | 3,974 | |
| | 22,938,522 | | | * | | Unitech Ltd | | | 5,682 | |
| | 415,054 | | | | | Yes Bank Ltd | | | 2,494 | |
| | 3,190,700 | | | * | | Zee Entertainment Enterprises Ltd | | | 3,134 | |
| | | | | | | TOTAL INDIA | | | 59,663 | |
| | | | | | | | | | | |
| INDONESIA - 0.0% | | | | |
| | 41,374,500 | | | | | PT Express Transindo Utama Tbk | | | 4,964 | |
| | 1,591,277 | | | | | PT MNC Sky Vision Tbk | | | 262 | |
| | 2,348,000 | | | | | PT Perusahaan Gas Negara | | | 865 | |
| | | | | | | TOTAL INDONESIA | | | 6,091 | |
| | | | | | | | | | | |
| IRELAND - 0.9% | | | | |
| | 1,113,675 | | | * | | Bank of Ireland | | | 388 | |
| | 1,507,219 | | | | | CRH plc | | | 38,196 | |
| | 99,360 | | | | | CRH plc (Ireland) | | | 2,523 | |
| | 60,000 | | | | | DCC plc | | | 2,950 | |
| | 2,163,653 | | | * | | Green REIT plc | | | 4,292 | |
| | 4,159,400 | | | * | | Hibernia REIT plc | | | 6,695 | |
| | 147,992 | | | *,m | | Irish Bank Resolution Corp Ltd | | | 0 | ^ |
| | 65,358 | | | | | James Hardie Industries NV | | | 759 | |
| | 303,942 | | | | | Kerry Group plc (Class A) | | | 21,116 | |
| | 521 | | | *,e | | Prothena Corp plc | | | 14 | |
| | 14,350 | | | * | | Ryanair Holdings plc | | | 123 | |
| | 471,898 | | | * | | Ryanair Holdings plc (ADR) | | | 22,146 | |
| | 698,158 | | | | | Shire Ltd | | | 32,902 | |
| | 108,119 | | | | | Shire plc (ADR) | | | 15,276 | |
| | 977,088 | | | | | Smurfit Kappa Group plc | | | 23,979 | |
| | 72,750 | | | | | XL Capital Ltd | | | 2,316 | |
| | | | | | | TOTAL IRELAND | | | 173,675 | |
| | | | | | | | | | | |
| ISLE OF MAN - 0.0% | | | | |
| | 3,631,384 | | | * | | Unitech Corporate Parks plc | | | 2,466 | |
| | | | | | | TOTAL ISLE OF MAN | | | 2,466 | |
| | | | | | | | | | | |
| ISRAEL - 0.1% | | | | |
| | 54,184 | | | | | Bank Hapoalim Ltd | | | 304 | |
| | 67,062 | | | * | | Bank Leumi Le-Israel | | | 274 | |
COLLEGE RETIREMENT EQUITIES FUND - Global Equities Account
| | | | | | | VALUE | |
| SHARES | | | | | COMPANY | | (000) | |
| | 97,633 | | | | | Bezeq Israeli Telecommunication Corp Ltd | | $ | 166 | |
| | 186 | | | | | Delek Group Ltd | | | 71 | |
| | 23,614 | | | | | Israel Chemicals Ltd | | | 197 | |
| | 128 | | | * | | Israel Corp Ltd | | | 67 | |
| | 6,282 | | | | | Mizrahi Tefahot Bank Ltd | | | 82 | |
| | 2,963 | | | | | Nice Systems Ltd | | | 121 | |
| | 44,867 | | | | | Teva Pharmaceutical Industries Ltd | | | 1,795 | |
| | 195,146 | | | | | Teva Pharmaceutical Industries Ltd (ADR) | | | 7,821 | |
| | | | | | | TOTAL ISRAEL | | | 10,898 | |
| | | | | | | | | | | |
| ITALY - 1.0% | | | | |
| | 4,000,000 | | | | | A2A S.p.A. | | | 4,682 | |
| | 228,506 | | | | | ACEA S.p.A. | | | 2,593 | |
| | 116,762 | | | | | Assicurazioni Generali S.p.A. | | | 2,743 | |
| | 4,780 | | | * | | Autogrill S.p.A. | | | 40 | |
| | 32,321 | | | e | | Autostrade S.p.A. | | | 724 | |
| | 200,000 | | | | | Azimut Holding S.p.A. | | | 5,457 | |
| | 13,134,978 | | | | | Banca Intesa S.p.A. | | | 32,308 | |
| | 43,804 | | | | | Banca Intesa S.p.A. RSP | | | 88 | |
| | 528,763 | | | *,e | | Banca Monte dei Paschi di Siena S.p.A. | | | 127 | |
| | 71,415 | | | | | Banche Popolari Unite Scpa | | | 484 | |
| | 30,267 | | | * | | Banco Popolare Scarl | | | 58 | |
| | 290,124 | | | | | Brunello Cucinelli S.p.A | | | 10,314 | |
| | 384,451 | | | | | De’Longhi S.p.A. | | | 6,265 | |
| | 90,381 | | | | | Enel Green Power S.p.A | | | 227 | |
| | 346,744 | | | | | Enel S.p.A. | | | 1,513 | |
| | 641,022 | | | | | ENI S.p.A. | | | 15,490 | |
| | 118,124 | | | | | Exor S.p.A. | | | 4,695 | |
| | 82,515 | | | * | | Fiat S.p.A. | | | 675 | |
| | 40,229 | | | * | | Finmeccanica S.p.A. | | | 305 | |
| | 591,785 | | | | | Lottomatica S.p.A. | | | 18,036 | |
| | 462,631 | | | | | Luxottica Group S.p.A. | | | 24,793 | |
| | 33,194 | | | * | | Mediaset S.p.A. | | | 158 | |
| | 2,197,961 | | | * | | Mediobanca S.p.A. | | | 19,221 | |
| | 600,000 | | | | | Mediolanum S.p.A. | | | 5,199 | |
| | 58,466 | | | * | | Moncler S.p.A | | | 1,271 | |
| | 23,661 | | | | | Pirelli & C S.p.A. | | | 409 | |
| | 15,237 | | | | | Prysmian S.p.A. | | | 392 | |
| | 26,540 | | | | | Saipem S.p.A. | | | 569 | |
| | 101,267 | | | | | Snam Rete Gas S.p.A. | | | 566 | |
| | 315,193 | | | | | Telecom Italia RSP | | | 247 | |
| | 798,964 | | | | | Telecom Italia S.p.A. | | | 797 | |
| | 75,416 | | | | | Terna Rete Elettrica Nazionale S.p.A. | | | 377 | |
| | 396,813 | | | | | UniCredit S.p.A | | | 2,927 | |
| | 4,780 | | | * | | World Duty Free S.p.A | | | 60 | |
| | 444,209 | | | * | | Yoox S.p.A | | | 19,917 | |
| | | | | | | TOTAL ITALY | | | 183,727 | |
| | | | | | | | | | | |
| JAPAN - 8.2% | | | | |
| | 2,000 | | | | | ABC-Mart, Inc | | | 87 | |
| | 32,400 | | | * | | Acom Co Ltd | | | 110 | |
| | 400 | | | | | Activia Properties Inc | | | 3,152 | |
COLLEGE RETIREMENT EQUITIES FUND - Global Equities Account
| | | | | | | VALUE | |
| SHARES | | | | | COMPANY | | (000) | |
| | 2,090 | | | | | Advance Residence Investment Corp | | $ | 4,509 | |
| | 19,243 | | | e | | Advantest Corp | | | 240 | |
| | 227,009 | | | | | Aeon Co Ltd | | | 3,077 | |
| | 9,103 | | | | | Aeon Credit Service Co Ltd | | | 244 | |
| | 12,800 | | | | | Aeon Mall Co Ltd | | | 359 | |
| | 13,000 | | | | | Air Water, Inc | | | 176 | |
| | 299,542 | | | | | Aisin Seiki Co Ltd | | | 12,178 | |
| | 48,529 | | | | | Ajinomoto Co, Inc | | | 703 | |
| | 5,057 | | | | | Alfresa Holdings Corp | | | 251 | |
| | 88,435 | | | e | | All Nippon Airways Co Ltd | | | 177 | |
| | 28,744 | | | | | Amada Co Ltd | | | 254 | |
| | 2,593,848 | | | | | Aozora Bank Ltd | | | 7,351 | |
| | 86,000 | | | e | | Aruze Corp | | | 1,593 | |
| | 325,007 | | | | | Asahi Breweries Ltd | | | 9,172 | |
| | 80,773 | | | | | Asahi Glass Co Ltd | | | 503 | |
| | 678,134 | | | | | Asahi Kasei Corp | | | 5,319 | |
| | 12,700 | | | | | Asics Corp | | | 217 | |
| | 184,941 | | | | | Astellas Pharma, Inc | | | 10,965 | |
| | 25,105 | | | | | Bank of Kyoto Ltd | | | 210 | |
| | 392,971 | | | | | Bank of Yokohama Ltd | | | 2,192 | |
| | 9,153 | | | | | Benesse Corp | | | 368 | |
| | 538,604 | | | e | | Bridgestone Corp | | | 20,406 | |
| | 29,385 | | | | | Brother Industries Ltd | | | 402 | |
| | 45,800 | | | | | Calbee, Inc | | | 1,112 | |
| | 273,397 | | | *,e | | Canon, Inc | | | 8,724 | |
| | 28,823 | | | | | Casio Computer Co Ltd | | | 353 | |
| | 55,900 | | | | | Central Japan Railway Co | | | 6,588 | |
| | 296,323 | | | | | Chiba Bank Ltd | | | 2,000 | |
| | 118,100 | | | | | Chiyoda Corp | | | 1,714 | |
| | 83,966 | | | | | Chubu Electric Power Co, Inc | | | 1,085 | |
| | 87,858 | | | e | | Chugai Pharmaceutical Co Ltd | | | 1,945 | |
| | 12,800 | | | | | Chugoku Bank Ltd | | | 163 | |
| | 43,053 | | | | | Chugoku Electric Power Co, Inc | | | 670 | |
| | 21,142 | | | | | Citizen Watch Co Ltd | | | 178 | |
| | 7,471 | | | | | Coca-Cola West Japan Co Ltd | | | 158 | |
| | 28,000 | | | * | | Cosmo Oil Co Ltd | | | 53 | |
| | 12,655 | | | | | Credit Saison Co Ltd | | | 334 | |
| | 1,200 | | | e | | Crescendo Investment Corp | | | 923 | |
| | 71,076 | | | | | Dai Nippon Printing Co Ltd | | | 755 | |
| | 23,630 | | | | | Daicel Chemical Industries Ltd | | | 193 | |
| | 34,698 | | �� | | | Daido Steel Co Ltd | | | 173 | |
| | 264,290 | | | | | Daihatsu Motor Co Ltd | | | 4,483 | |
| | 99,100 | | | | | Dai-ichi Mutual Life Insurance Co | | | 1,658 | |
| | 99,397 | | | | | Daiichi Sankyo Co Ltd | | | 1,817 | |
| | 85,746 | | | | | Daikin Industries Ltd | | | 5,351 | |
| | 1,600,000 | | | | | Dainippon Ink and Chemicals, Inc | | | 4,878 | |
| | 20,263 | | | | | Dainippon Sumitomo Pharma Co Ltd | | | 317 | |
| | 20,911 | | | | | Daito Trust Construction Co Ltd | | | 1,955 | |
| | 257,556 | | | | | Daiwa House Industry Co Ltd | | | 4,990 | |
| | 1,655,400 | | | | | Daiwa Securities Group, Inc | | | 16,580 | |
| | 11,400 | | | e | | Dena Co Ltd | | | 240 | |
| | 22,000 | | | | | Denki Kagaku Kogyo KK | | | 91 | |
COLLEGE RETIREMENT EQUITIES FUND - Global Equities Account
| | | | | | | | VALUE | |
| SHARES | | | | | COMPANY | | (000) | |
| | 291,745 | | | | | Denso Corp | | $ | 15,412 | |
| | 25,055 | | | | | Dentsu, Inc | | | 1,025 | |
| | 84,200 | | | | | Don Quijote Co Ltd | | | 5,104 | |
| | 143,252 | | | | | East Japan Railway Co | | | 11,411 | |
| | 95,617 | | | | | Eisai Co Ltd | | | 3,706 | |
| | 42,493 | | | | | Electric Power Development Co | | | 1,239 | |
| | 7,344 | | | e | | FamilyMart Co Ltd | | | 336 | |
| | 20,443 | | | | | Fanuc Ltd | | | 3,746 | |
| | 17,418 | | | | | Fast Retailing Co Ltd | | | 7,194 | |
| | 45,300 | | | | | Fields Corp | | | 876 | |
| | 1,194,822 | | | | | Fuji Electric Holdings Co Ltd | | | 5,598 | |
| | 470,484 | | | | | Fuji Folms Holdings Corp | | | 13,355 | |
| | 733,842 | | | | | Fuji Heavy Industries Ltd | | | 21,090 | |
| | 60,000 | | | | | Fuji Television Network, Inc | | | 1,229 | |
| | 1,376,091 | | | * | | Fujitsu Ltd | | | 7,132 | |
| | 61,663 | | | | | Fukuoka Financial Group, Inc | | | 271 | |
| | 30,000 | | | | | Furukawa Electric Co Ltd | | | 75 | |
| | 98,900 | | | | | Glory Ltd | | | 2,567 | |
| | 79,700 | | | | | GMO Payment Gateway, Inc | | | 3,171 | |
| | 10,000 | | | e | | Gree, Inc | | | 99 | |
| | 18,000 | | | | | GS Yuasa Corp | | | 104 | |
| | 27,400 | | | *,e | | GungHo Online Entertainment Inc | | | 197 | |
| | 30,879 | | | | | Gunma Bank Ltd | | | 173 | |
| | 33,842 | | | | | Hachijuni Bank Ltd | | | 198 | |
| | 29,600 | | | | | Hakuhodo DY Holdings, Inc | | | 229 | |
| | 5,637 | | | | | Hamamatsu Photonics KK | | | 226 | |
| | 92,000 | | | | | Hankyu Hanshin Holdings, Inc | | | 497 | |
| | 700,000 | | | * | | Haseko Corp | | | 5,333 | |
| | 80,082 | | | | | Hino Motors Ltd | | | 1,261 | |
| | 10,587 | | | | | Hirose Electric Co Ltd | | | 1,509 | |
| | 40,000 | | | | | Hiroshima Bank Ltd | | | 166 | |
| | 7,967 | | | | | Hisamitsu Pharmaceutical Co, Inc | | | 401 | |
| | 12,952 | | | | | Hitachi Chemical Co Ltd | | | 207 | |
| | 8,422 | | | | | Hitachi Construction Machinery Co Ltd | | | 180 | |
| | 23,500 | | | | | Hitachi High-Technologies Corp | | | 592 | |
| | 200,000 | | | | | Hitachi Kokusai Electric, Inc | | | 2,819 | |
| | 4,911,285 | | | | | Hitachi Ltd | | | 37,238 | |
| | 23,000 | | | | | Hitachi Metals Ltd | | | 325 | |
| | 22,784 | | | *,e | | Hokkaido Electric Power Co, Inc | | | 262 | |
| | 90,000 | | | | | Hokuhoku Financial Group, Inc | | | 180 | |
| | 21,931 | | | | | Hokuriku Electric Power Co | | | 298 | |
| | 682,968 | | | | | Honda Motor Co Ltd | | | 28,191 | |
| | 582,853 | | | | | Hoya Corp | | | 16,210 | |
| | 15,466 | | | | | Ibiden Co Ltd | | | 290 | |
| | 3,052 | | | | | Ichigo Real Estate Investment Corp | | | 1,870 | |
| | 138,988 | | | | | Idemitsu Kosan Co Ltd | | | 3,164 | |
| | 10,500 | | | * | | Iida Group Holdings Co Ltd | | | 210 | |
| | 100 | | | e | | Industrial & Infrastructure Fund Investment Corp | | | 833 | |
| | 103,800 | | | | | Inpex Holdings, Inc | | | 1,331 | |
| | 175,981 | | | | | Isetan Mitsukoshi Holdings Ltd | | | 2,505 | |
| | 1,812,878 | | | | | Ishikawajima-Harima Heavy Industries Co Ltd | | | 7,840 | |
| | 151,169 | | | | | Isuzu Motors Ltd | | | 943 | |
COLLEGE RETIREMENT EQUITIES FUND - Global Equities Account
| | | | | | | | VALUE | |
| SHARES | | | | | COMPANY | | (000) | |
| | 1,075,570 | | | | | Itochu Corp | | $ | 13,297 | |
| | 13,662 | | | e | | Itochu Techno-Science Corp | | | 554 | |
| | 19,752 | | | | | Iyo Bank Ltd | | | 194 | |
| | 1,756,750 | | | | | J Front Retailing Co Ltd | | | 13,327 | |
| | 31,700 | | | | | Japan Airlines Co Ltd | | | 1,564 | |
| | 3,900 | | | | | Japan Petroleum Exploration Co | | | 148 | |
| | 170,000 | | | | | Japan Pile Corp | | | 1,667 | |
| | 87 | | | e | | Japan Prime Realty Investment Corp | | | 278 | |
| | 138 | | | | | Japan Real Estate Investment Corp | | | 738 | |
| | 732 | | | | | Japan Retail Fund Investment Corp | | | 1,489 | |
| | 25,560 | | | | | Japan Steel Works Ltd | | | 143 | |
| | 574,600 | | | | | Japan Tobacco, Inc | | | 18,697 | |
| | 177,904 | | | | | JFE Holdings, Inc | | | 4,239 | |
| | 76,978 | | | | | JGC Corp | | | 3,021 | |
| | 122,900 | | | e | | Jin Co Ltd | | | 5,199 | |
| | 53,624 | | | | | Joyo Bank Ltd | | | 274 | |
| | 22,953 | | | | | JSR Corp | | | 445 | |
| | 435,403 | | | | | JTEKT Corp | | | 7,429 | |
| | 881,500 | | | | | JX Holdings, Inc | | | 4,539 | |
| | 106,372 | | | | | Kajima Corp | | | 400 | |
| | 11,900 | | | | | Kakaku.com, Inc | | | 209 | |
| | 211,252 | | | | | Kamigumi Co Ltd | | | 1,938 | |
| | 25,000 | | | | | Kanamoto Co Ltd | | | 636 | |
| | 33,900 | | | | | Kaneka Corp | | | 223 | |
| | 293,874 | | | * | | Kansai Electric Power Co, Inc | | | 3,382 | |
| | 27,480 | | | | | Kansai Paint Co Ltd | | | 406 | |
| | 42,253 | | | | | Kao Corp | | | 1,330 | |
| | 542,212 | | | | | Kawasaki Heavy Industries Ltd | | | 2,277 | |
| | 28,000 | | | | | Kawasaki Kisen Kaisha Ltd | | | 71 | |
| | 213,600 | | | | | KDDI Corp | | | 13,161 | |
| | 170,622 | | | e | | Keihin Electric Express Railway Co Ltd | | | 1,407 | |
| | 211,910 | | | | | Keio Corp | | | 1,412 | |
| | 33,426 | | | | | Keisei Electric Railway Co Ltd | | | 308 | |
| | 1,454 | | | | | Kenedix Realty Investment Corp | | | 6,901 | |
| | 13,505 | | | | | Keyence Corp | | | 5,783 | |
| | 12,795 | | | | | Kikkoman Corp | | | 242 | |
| | 16,131 | | | | | Kinden Corp | | | 169 | |
| | 403,914 | | | e | | Kintetsu Corp | | | 1,417 | |
| | 108,849 | | | | | Kirin Brewery Co Ltd | | | 1,568 | |
| | 317,084 | | | * | | Kobe Steel Ltd | | | 544 | |
| | 8,000 | | | | | Koito Manufacturing Co Ltd | | | 153 | |
| | 221,022 | | | | | Komatsu Ltd | | | 4,538 | |
| | 8,073 | | | | | Konami Corp | | | 187 | |
| | 60,613 | | | | | Konica Minolta Holdings, Inc | | | 606 | |
| | 856,258 | | | | | Kubota Corp | | | 14,203 | |
| | 27,274 | | | | | Kuraray Co Ltd | | | 326 | |
| | 9,045 | | | | | Kurita Water Industries Ltd | | | 188 | |
| | 114,400 | | | | | Kyocera Corp | | | 5,719 | |
| | 31,045 | | | e | | Kyowa Hakko Kogyo Co Ltd | | | 343 | |
| | 53,484 | | | * | | Kyushu Electric Power Co, Inc | | | 683 | |
| | 21,851 | | | | | Lawson, Inc | | | 1,635 | |
| | 579,823 | | | | | LIXIL Group Corp | | | 15,917 | |
COLLEGE RETIREMENT EQUITIES FUND - Global Equities Account
| | | | | | | | VALUE | |
| SHARES | | | | | COMPANY | | (000) | |
| | 51,516 | | | | | Mabuchi Motor Co Ltd | | $ | 3,066 | |
| | 53,336 | | | | | Makita Corp | | | 2,805 | |
| | 1,213,872 | | | | | Marubeni Corp | | | 8,739 | |
| | 17,509 | | | | | Marui Co Ltd | | | 178 | |
| | 5,496 | | | | | Maruichi Steel Tube Ltd | | | 139 | |
| | 790,700 | | | | | Matsui Securities Co Ltd | | | 10,156 | |
| | 178,855 | | | | | Matsushita Electric Industrial Co Ltd | | | 2,085 | |
| | 6,660,950 | | | * | | Mazda Motor Corp | | | 34,517 | |
| | 5,300 | | | e | | McDonald’s Holdings Co Japan Ltd | | | 135 | |
| | 17,412 | | | | | Mediceo Paltac Holdings Co Ltd | | | 230 | |
| | 4,849 | | | | | MEIJI Holdings Co Ltd | | | 312 | |
| | 603,064 | | | | | Millea Holdings, Inc | | | 20,184 | |
| | 17,300 | | | | | Miraca Holdings, Inc | | | 816 | |
| | 192,719 | | | | | Mitsubishi Chemical Holdings Corp | | | 892 | |
| | 498,295 | | | | | Mitsubishi Corp | | | 9,566 | |
| | 845,814 | | | | | Mitsubishi Electric Corp | | | 10,636 | |
| | 155,705 | | | | | Mitsubishi Estate Co Ltd | | | 4,660 | |
| | 305,160 | | | | | Mitsubishi Gas Chemical Co, Inc | | | 2,250 | |
| | 1,065,150 | | | | | Mitsubishi Heavy Industries Ltd | | | 6,597 | |
| | 15,262 | | | | | Mitsubishi Logistics Corp | | | 242 | |
| | 139,293 | | | | | Mitsubishi Materials Corp | | | 515 | |
| | 52,900 | | | *,e | | Mitsubishi Motors Corp | | | 569 | |
| | 5,812,054 | | | | | Mitsubishi UFJ Financial Group, Inc | | | 38,588 | |
| | 72,400 | | | | | Mitsubishi UFJ Lease & Finance Co Ltd | | | 445 | |
| | 601,404 | | | | | Mitsui & Co Ltd | | | 8,384 | |
| | 1,009,087 | | | | | Mitsui Chemicals, Inc | | | 2,440 | |
| | 1,281,700 | | | | | Mitsui Engineering & Shipbuilding Co Ltd | | | 2,647 | |
| | 503,437 | | | | | Mitsui Fudosan Co Ltd | | | 18,159 | |
| | 2,007,499 | | | * | | Mitsui OSK Lines Ltd | | | 9,060 | |
| | 263,207 | | | | | Mitsui Sumitomo Insurance Group Holdings, Inc | | | 7,075 | |
| | 1,303,918 | | | | | Mitsui Trust Holdings, Inc | | | 6,899 | |
| | 9,482,956 | | | | | Mizuho Financial Group, Inc | | | 20,588 | |
| | 110,000 | | | | | Monex Beans Holdings, Inc | | | 494 | |
| | 215,300 | | | e | | MonotaRO Co Ltd | | | 4,383 | |
| | 117,620 | | | | | Murata Manufacturing Co Ltd | | | 10,460 | |
| | 8,700 | | | | | Nabtesco Corp | | | 201 | |
| | 14,006 | | | | | Namco Bandai Holdings, Inc | | | 311 | |
| | 197,615 | | | | | NEC Corp | | | 446 | |
| | 8,800 | | | | | Nexon Co Ltd | | | 81 | |
| | 427,200 | | | | | Next Co Ltd | | | 4,538 | |
| | 56,179 | | | | | NGK Insulators Ltd | | | 1,069 | |
| | 20,988 | | | | | NGK Spark Plug Co Ltd | | | 497 | |
| | 19,638 | | | | | NHK Spring Co Ltd | | | 222 | |
| | 38,485 | | | e | | Nidec Corp | | | 3,791 | |
| | 704,400 | | | | | Nihon Nohyaku Co Ltd | | | 10,093 | |
| | 99,481 | | | | | Nikon Corp | | | 1,901 | |
| | 31,858 | | | | | Nintendo Co Ltd | | | 4,264 | |
| | 478 | | | | | Nippon Building Fund, Inc | | | 2,777 | |
| | 46,184 | | | | | Nippon Electric Glass Co Ltd | | | 243 | |
| | 104,441 | | | | | Nippon Express Co Ltd | | | 506 | |
| | 116,200 | | | | | Nippon Kayaku Co Ltd | | | 1,652 | |
| | 98,900 | | | | | Nippon Konpo Unyu Soko Co Ltd | | | 1,780 | |
COLLEGE RETIREMENT EQUITIES FUND - Global Equities Account
| | | | | | | | VALUE | |
| SHARES | | | | | COMPANY | | (000) | |
| | 14,944 | | | | | Nippon Meat Packers, Inc | | $ | 257 | |
| | 14,000 | | | | | Nippon Paint Co Ltd | | | 233 | |
| | 4,400 | | | e | | Nippon Paper Industries Co Ltd | | | 82 | |
| | 515 | | | | | Nippon ProLogis REIT, Inc | | | 4,933 | |
| | 2,625,606 | | | | | Nippon Steel Corp | | | 8,806 | |
| | 288,530 | | | | | Nippon Telegraph & Telephone Corp | | | 15,540 | |
| | 551,308 | | | | | Nippon Yusen Kabushiki Kaisha | | | 1,763 | |
| | 54,721 | | | | | Nishi-Nippon City Bank Ltd | | | 147 | |
| | 1,181,543 | | | | | Nissan Motor Co Ltd | | | 9,901 | |
| | 25,800 | | | e | | Nisshin Seifun Group, Inc | | | 267 | |
| | 3,200 | | | | | Nisshin Steel Holdings Co Ltd | | | 38 | |
| | 7,935 | | | | | Nissin Food Products Co Ltd | | | 335 | |
| | 242,400 | | | | | Nissin Kogyo Co Ltd | | | 5,141 | |
| | 2,756 | | | | | Nitori Co Ltd | | | 261 | |
| | 156,837 | | | | | Nitto Denko Corp | | | 6,632 | |
| | 44,000 | | | | | NKSJ Holdings, Inc | | | 1,225 | |
| | 12,951 | | | | | NOK Corp | | | 212 | |
| | 1,330,163 | | | | | Nomura Holdings, Inc | | | 10,279 | |
| | 13,774 | | | | | Nomura Real Estate Holdings, Inc | | | 310 | |
| | 41 | | | | | Nomura Real Estate Office Fund, Inc | | | 191 | |
| | 308,564 | | | | | Nomura Research Institute Ltd | | | 9,751 | |
| | 36,911 | | | | | NSK Ltd | | | 460 | |
| | 18,700 | | | | | NTT Data Corp | | | 691 | |
| | 568,900 | | | | | NTT DoCoMo, Inc | | | 9,368 | |
| | 15,000 | | | | | NTT Urban Development Corp | | | 173 | |
| | 81,259 | | | | | Obayashi Corp | | | 463 | |
| | 230,098 | | | e | | Odakyu Electric Railway Co Ltd | | | 2,081 | |
| | 100,797 | | | | | OJI Paper Co Ltd | | | 517 | |
| | 263,100 | | | | | Okabe Co Ltd | | | 3,105 | |
| | 15,100 | | | | | Okinawa Electric Power Co, Inc | | | 508 | |
| | 648,100 | | | * | | Olympus Corp | | | 20,556 | |
| | 75,802 | | | | | Omron Corp | | | 3,350 | |
| | 167,598 | | | | | Ono Pharmaceutical Co Ltd | | | 14,691 | |
| | 2,903 | | | | | Oracle Corp Japan | | | 106 | |
| | 75,517 | | | | | Oriental Land Co Ltd | | | 10,891 | |
| | 2,188,100 | | | * | | ORIX Corp | | | 38,449 | |
| | 1,176,581 | | | | | Osaka Gas Co Ltd | | | 4,621 | |
| | 20,400 | | | | | Osaka Securities Exchange Co Ltd | | | 580 | |
| | 3,187 | | | | | Otsuka Corp | | | 407 | |
| | 139,900 | | | | | Otsuka Holdings KK | | | 4,039 | |
| | 88,800 | | | | | Park24 Co Ltd | | | 1,675 | |
| | 231,900 | | | | | Rakuten, Inc | | | 3,461 | |
| | 1,649,030 | | | | | Resona Holdings, Inc | | | 8,414 | |
| | 80,581 | | | | | Ricoh Co Ltd | | | 857 | |
| | 2,699 | | | | | Rinnai Corp | | | 210 | |
| | 21,224 | | | | | Rohm Co Ltd | | | 1,035 | |
| | 4,180 | | | | | Sankyo Co Ltd | | | 193 | |
| | 264,700 | | | e | | Sanrio Co Ltd | | | 11,146 | |
| | 9,587 | | | | | Santen Pharmaceutical Co Ltd | | | 447 | |
| | 212,000 | | | | | Sapporo Holdings Ltd | | | 892 | |
| | 144,800 | | | | | Sawai Pharmaceutical Co Ltd | | | 9,350 | |
| | 16,080 | | | | | SBI Holdings, Inc | | | 244 | |
COLLEGE RETIREMENT EQUITIES FUND - Global Equities Account
| | | | | | | | VALUE | |
| SHARES | | | | | COMPANY | | (000) | |
| | 26,634 | | | | | Secom Co Ltd | | $ | 1,607 | |
| | 161,543 | | | | | Sega Sammy Holdings, Inc | | | 4,117 | |
| | 272,551 | | | | | Sekisui Chemical Co Ltd | | | 3,345 | |
| | 243,420 | | | | | Sekisui House Ltd | | | 3,406 | |
| | 385,781 | | | | | Seven & I Holdings Co Ltd | | | 15,360 | |
| | 45,400 | | | | | Seven Bank Ltd | | | 178 | |
| | 115,106 | | | * | | Sharp Corp | | | 366 | |
| | 22,519 | | | * | | Shikoku Electric Power Co, Inc | | | 338 | |
| | 30,982 | | | | | Shimadzu Corp | | | 270 | |
| | 1,797 | | | | | Shimamura Co Ltd | | | 168 | |
| | 6,381 | | | | | Shimano, Inc | | | 548 | |
| | 72,062 | | | | | Shimizu Corp | | | 364 | |
| | 198,700 | | | | | Shin-Etsu Chemical Co Ltd | | | 11,622 | |
| | 130,649 | | | | | Shinsei Bank Ltd | | | 320 | |
| | 44,133 | | | | | Shionogi & Co Ltd | | | 958 | |
| | 36,385 | | | | | Shiseido Co Ltd | | | 585 | |
| | 44,301 | | | | | Shizuoka Bank Ltd | | | 473 | |
| | 582,800 | | | | | Shoei Co Ltd | | | 8,625 | |
| | 183,654 | | | e | | Showa Denko KK | | | 260 | |
| | 23,073 | | | | | Showa Shell Sekiyu KK | | | 235 | |
| | 6,688 | | | | | SMC Corp | | | 1,688 | |
| | 737,160 | | | | | Softbank Corp | | | 64,686 | |
| | 2,556,636 | | | | | Sojitz Holdings Corp | | | 4,552 | |
| | 354 | | | | | So-net M3, Inc | | | 887 | |
| | 1,332,482 | | | e | | Sony Corp | | | 22,970 | |
| | 22,200 | | | | | Sony Financial Holdings, Inc | | | 404 | |
| | 315,915 | | | | | Stanley Electric Co Ltd | | | 7,243 | |
| | 14,576 | | | | | Sumco Corp | | | 129 | |
| | 190,883 | | | | | Sumitomo Chemical Co Ltd | | | 749 | |
| | 400,263 | | | | | Sumitomo Corp | | | 5,031 | |
| | 76,076 | | | | | Sumitomo Electric Industries Ltd | | | 1,272 | |
| | 1,421,625 | | | | | Sumitomo Heavy Industries Ltd | | | 6,551 | |
| | 67,464 | | | | | Sumitomo Metal Mining Co Ltd | | | 884 | |
| | 1,222,979 | | | | | Sumitomo Mitsui Financial Group, Inc | | | 63,599 | |
| | 353,996 | | | | | Sumitomo Realty & Development Co Ltd | | | 17,639 | |
| | 21,363 | | | | | Sumitomo Rubber Industries, Inc | | | 304 | |
| | 9,800 | | | * | | Suntory Beverage & Food Ltd | | | 313 | |
| | 251,654 | | | | | Suruga Bank Ltd | | | 4,519 | |
| | 8,887 | | | | | Suzuken Co Ltd | | | 288 | |
| | 29,222 | | | | | Suzuki Motor Corp | | | 787 | |
| | 21,500 | | | | | Sysmex Corp | | | 1,270 | |
| | 80,400 | | | | | T&D Holdings, Inc | | | 1,125 | |
| | 92,000 | | | | | Taiheiyo Cement Corp | | | 354 | |
| | 1,096,143 | | | e | | Taisei Corp | | | 4,988 | |
| | 4,023 | | | | | Taisho Pharmaceutical Holdings Co Ltd | | | 277 | |
| | 30,357 | | | | | Taiyo Nippon Sanso Corp | | | 216 | |
| | 34,718 | | | | | Takashimaya Co Ltd | | | 346 | |
| | 115,248 | | | | | Takeda Pharmaceutical Co Ltd | | | 5,286 | |
| | 80,881 | | | | | Tanabe Seiyaku Co Ltd | | | 1,128 | |
| | 46,927 | | | | | TDK Corp | | | 2,251 | |
| | 1,223,613 | | | | | Teijin Ltd | | | 2,725 | |
| | 12,226 | | | | | Terumo Corp | | | 590 | |
COLLEGE RETIREMENT EQUITIES FUND - Global Equities Account
| | | | | | | | VALUE | |
| SHARES | | | | | COMPANY | | (000) | |
| | 61,076 | | | | | THK Co Ltd | | $ | 1,525 | |
| | 347,878 | | | | | Tobu Railway Co Ltd | | | 1,687 | |
| | 14,275 | | | | | Toho Co Ltd | | | 314 | |
| | 54,000 | | | e | | Toho Gas Co Ltd | | | 263 | |
| | 65,815 | | | * | | Tohoku Electric Power Co, Inc | | | 741 | |
| | 207,060 | | | * | | Tokyo Electric Power Co, Inc | | | 1,020 | |
| | 51,110 | | | | | Tokyo Electron Ltd | | | 2,816 | |
| | 2,006,924 | | | | | Tokyo Gas Co Ltd | | | 9,892 | |
| | 350,300 | | | | | Tokyo Tatemono Co Ltd | | | 3,895 | |
| | 578,852 | | | | | Tokyu Corp | | | 3,750 | |
| | 62,400 | | | * | | Tokyu Fudosan Holdings Corp | | | 587 | |
| | 374,126 | | | e | | TonenGeneral Sekiyu KK | | | 3,433 | |
| | 70,427 | | | | | Toppan Printing Co Ltd | | | 564 | |
| | 492,664 | | | | | Toray Industries, Inc | | | 3,413 | |
| | 2,085,481 | | | | | Toshiba Corp | | | 8,779 | |
| | 924,000 | | | | | Tosoh Corp | | | 4,305 | |
| | 35,681 | | | | | Toto Ltd | | | 566 | |
| | 19,839 | | | | | Toyo Seikan Kaisha Ltd | | | 427 | |
| | 181,099 | | | | | Toyo Suisan Kaisha Ltd | | | 5,440 | |
| | 187,997 | | | | | Toyoda Gosei Co Ltd | | | 4,379 | |
| | 8,000 | | | e | | Toyota Boshoku Corp | | | 100 | |
| | 21,461 | | | | | Toyota Industries Corp | | | 970 | |
| | 2,214,848 | | | | | Toyota Motor Corp | | | 135,051 | |
| | 31,394 | | | | | Toyota Tsusho Corp | | | 779 | |
| | 8,328 | | | | | Trend Micro, Inc | | | 292 | |
| | 120,000 | | | | | TS Tech Co Ltd | | | 4,050 | |
| | 7,423 | | | e | | Tsumura & Co | | | 197 | |
| | 131,932 | | | | | UBE Industries Ltd | | | 283 | |
| | 90,951 | | | | | Uni-Charm Corp | | | 5,190 | |
| | 186,900 | | | | | United Arrows Ltd | | | 6,994 | |
| | 200 | | | | | United Urban Investment Corp | | | 287 | |
| | 145,200 | | | | | Ushio, Inc | | | 1,930 | |
| | 17,330 | | | | | USS Co Ltd | | | 238 | |
| | 44,700 | | | | | West Japan Railway Co | | | 1,937 | |
| | 798,400 | | | | | Yahoo! Japan Corp | | | 4,452 | |
| | 44,077 | | | | | Yakult Honsha Co Ltd | | | 2,227 | |
| | 73,090 | | | | | Yamada Denki Co Ltd | | | 239 | |
| | 17,406 | | | | | Yamaguchi Financial Group, Inc | | | 161 | |
| | 12,588 | | | | | Yamaha Corp | | | 200 | |
| | 31,783 | | | | | Yamaha Motor Co Ltd | | | 478 | |
| | 5,300 | | | | | Yamato Kogyo Co Ltd | | | 169 | |
| | 47,755 | | | | | Yamato Transport Co Ltd | | | 966 | |
| | 15,553 | | | | | Yamazaki Baking Co Ltd | | | 160 | |
| | 378,384 | | | | | Yaskawa Electric Corp | | | 5,996 | |
| | 27,710 | | | | | Yokogawa Electric Corp | | | 426 | |
| | 16,000 | | | | | Yokohama Rubber Co Ltd | | | 157 | |
| | | | | | | TOTAL JAPAN | | | 1,562,126 | |
| | | | | | | | | | | |
| JERSEY, C.I. - 0.0% | | | | |
| | 8,795 | | | | | Randgold Resources Ltd | | | 553 | |
| | | | | | | TOTAL JERSEY, C.I. | | | 553 | |
COLLEGE RETIREMENT EQUITIES FUND - Global Equities Account
| | | | | | | | VALUE | |
| SHARES | | | | | COMPANY | | (000) | |
| KOREA, REPUBLIC OF - 0.2% | | | | |
| | 174,800 | | | * | | Hynix Semiconductor, Inc | | $ | 6,114 | |
| | 73,131 | | | | | KB Financial Group, Inc | | | 2,956 | |
| | 47,000 | | | | | Kia Motors Corp | | | 2,503 | |
| | 10,837 | | | | | Samsung Electronics Co Ltd | | | 14,121 | |
| | 196,300 | | | | | Seoul Semiconductor Co Ltd | | | 7,540 | |
| | 20,000 | | | | | SK Telecom Co Ltd | | | 4,377 | |
| | | | | | | TOTAL KOREA, REPUBLIC OF | | | 37,611 | |
| | | | | | | | | | | |
| LUXEMBOURG - 0.0% | | | | |
| | 92,485 | | | | | ArcelorMittal | | | 1,652 | |
| | 7,122 | | | | | Millicom International Cellular S.A. | | | 710 | |
| | 29,309 | | | | | SES Global S.A. | | | 950 | |
| | 46,826 | | | | | Tenaris S.A. | | | 1,020 | |
| | | | | | | TOTAL LUXEMBOURG | | | 4,332 | |
| | | | | | | | | | | |
| MACAU - 0.1% | | | | |
| | 93,600 | | | | | MGM China Holdings Ltd | | | 400 | |
| | 2,957,300 | | | | | Wynn Macau Ltd | | | 13,443 | |
| | | | | | | TOTAL MACAU | | | 13,843 | |
| | | | | | | | | | | |
| MALAYSIA - 0.0% | | | | |
| | 1,151,800 | | | | | Public Bank BHD | | | 6,827 | |
| | 33,959 | | | | | YNH Property BHD | | | 19 | |
| | | | | | | TOTAL MALAYSIA | | | 6,846 | |
| | | | | | | | | | | |
| MEXICO - 0.0% | | | | |
| | 9,694 | | | | | Fresnillo plc | | | 121 | |
| | 1,800,000 | | | * | | Genomma Lab Internacional S.A. de C.V. | | | 5,048 | |
| | 700,000 | | | *,e | | Gruma SAB de C.V. | | | 5,296 | |
| | | | | | | TOTAL MEXICO | | | 10,465 | |
| | | | | | | | | | | |
| NETHERLANDS - 1.9% | | | | |
| | 200,000 | | | | | Aalberts Industries NV | | | 6,384 | |
| | 168,013 | | | | | Aegon NV | | | 1,592 | |
| | 12,597 | | | | | Akzo Nobel NV | | | 977 | |
| | 568,084 | | | | | ASML Holding NV | | | 53,208 | |
| | 44,600 | | | e | | ASML Holding NV (ADR) | | | 4,179 | |
| | 6,420 | | | | | Boskalis Westminster | | | 340 | |
| | 84,335 | | | * | | CNH Industrial NV | | | 961 | |
| | 6,144 | | | | | Corio NV | | | 276 | |
| | 9,968 | | | | | Delta Lloyd NV | | | 248 | |
| | 526,250 | | | | | DSM NV | | | 41,415 | |
| | 6,760 | | | e | | Fugro NV | | | 403 | |
| | 97,135 | | | e | | Gemalto NV | | | 10,690 | |
| | 10,531 | | | | | Heineken Holding NV | | | 667 | |
| | 23,637 | | | | | Heineken NV | | | 1,598 | |
| | 5,893,293 | | | * | | ING Groep NV | | | 82,321 | |
| | 1,158,562 | | | *,e | | ING Groep NV (ADR) | | | 16,231 | |
| | 509,715 | | | | | Koninklijke Ahold NV | | | 9,160 | |
| | 97,904 | | | | | Koninklijke Philips Electronics NV | | | 3,605 | |
COLLEGE RETIREMENT EQUITIES FUND - Global Equities Account
| | | | | | | | VALUE | |
| SHARES | | | | | COMPANY | | (000) | |
| | 3,777 | | | | | Koninklijke Vopak NV | | $ | 221 | |
| | 531,273 | | | * | | NXP Semiconductors NV | | | 24,401 | |
| | 4,736 | | | * | | OCI | | | 213 | |
| | 23,172 | | | * | | Qiagen NV | | | 541 | |
| | 11,188 | | | | | Randstad Holdings NV | | | 726 | |
| | 543,018 | | | | | Reed Elsevier NV | | | 11,541 | |
| | 1,683,735 | | | | | Royal Dutch Shell plc (A Shares) | | | 60,342 | |
| | 431,837 | | | | | Royal Dutch Shell plc (B Shares) | | | 16,289 | |
| | 226,682 | | | * | | Royal KPN NV | | | 732 | |
| | 7,052 | | | * | | SBM Offshore NV | | | 144 | |
| | 35,403 | | | | | TNT Express NV | | | 329 | |
| | 225,836 | | | | | Unilever NV | | | 9,080 | |
| | 29,412 | | | | | Wolters Kluwer NV | | | 840 | |
| | 7,330 | | | | | Ziggo NV | | | 335 | |
| | | | | | | TOTAL NETHERLANDS | | | 359,989 | |
| | | | | | | | | | | |
| NEW ZEALAND - 0.0% | | | | |
| | 144,475 | | | | | Auckland International Airport Ltd | | | 420 | |
| | 51,054 | | | | | Contact Energy Ltd | | | 215 | |
| | 97,689 | | | | | Fletcher Building Ltd | | | 685 | |
| | 37,846 | | | | | Ryman Healthcare Ltd | | | 244 | |
| | 27,049 | | | | | Sky City Entertainment Group Ltd | | | 83 | |
| | 273,297 | | | e | | Telecom Corp of New Zealand Ltd | | | 519 | |
| | 228,591 | | | * | | Xero Ltd | | | 6,089 | |
| | | | | | | TOTAL NEW ZEALAND | | | 8,255 | |
| | | | | | | | | | | |
| NORWAY - 0.4% | | | | |
| | 7,127 | | | | | Aker Kvaerner ASA | | | 128 | |
| | 158,851 | | | * | | Algeta ASA | | | 9,397 | |
| | 2,638,671 | | | | | DNB NOR Holding ASA | | | 47,359 | |
| | 10,684 | | | | | Gjensidige Forsikring BA | | | 204 | |
| | 108,908 | | | e | | Norsk Hydro ASA | | | 487 | |
| | 77,497 | | | | | Orkla ASA | | | 606 | |
| | 32,206 | | | | | Seadrill Ltd (Oslo Exchange) | | | 1,320 | |
| | 499,739 | | | | | Statoil ASA | | | 12,152 | |
| | 75,050 | | | | | Telenor ASA | | | 1,793 | |
| | 18,991 | | | | | Yara International ASA | | | 819 | |
| | | | | | | TOTAL NORWAY | | | 74,265 | |
| | | | | | | | | | | |
| PANAMA - 0.1% | | | | |
| | 82,488 | | | | | Copa Holdings S.A. (Class A) | | | 13,207 | |
| | | | | | | TOTAL PANAMA | | | 13,207 | |
| | | | | | | | | | | |
| PHILIPPINES - 0.1% | | | | |
| | 4,500,000 | | | | | Alliance Global Group, Inc | | | 2,626 | |
| | 3,603,093 | | | | | Metropolitan Bank & Trust | | | 6,159 | |
| | 5,171,850 | | | * | | Robinsons Retail Holdings, Inc | | | 6,432 | |
| | | | | | | TOTAL PHILIPPINES | | | 15,217 | |
| | | | | | | | | | | |
| PORTUGAL - 0.0% | | | | |
| | 1,904,345 | | | * | | Banco Espirito Santo S.A. | | | 2,720 | |
COLLEGE RETIREMENT EQUITIES FUND - Global Equities Account
| | | | | | | | VALUE | |
| SHARES | | | | | COMPANY | | (000) | |
| | 100,951 | | | | | Energias de Portugal S.A. | | $ | 371 | |
| | 24,696 | | | | | Galp Energia SGPS S.A. | | | 405 | |
| | 23,389 | | | e | | Jeronimo Martins SGPS S.A. | | | 457 | |
| | 61,630 | | | e | | Portugal Telecom SGPS S.A. | | | 268 | |
| | | | | | | TOTAL PORTUGAL | | | 4,221 | |
| | | | | | | | | | | |
| RUSSIA - 0.1% | | | | |
| | 105,700 | | | | | Magnit OAO (GDR) | | | 7,020 | |
| | 20,472 | | | | | QIWI plc (ADR) | | | 1,147 | |
| | 550,000 | | | | | Sberbank of Russian Federation (ADR) | | | 6,939 | |
| | | | | | | TOTAL RUSSIA | | | 15,106 | |
| | | | | | | | | | | |
| SINGAPORE - 0.6% | | | | |
| | 275,473 | | | | | Ascendas Real Estate Investment Trust | | | 482 | |
| | 201,000 | | | e | | CapitaCommercial Trust | | | 231 | |
| | 913,082 | | | e | | CapitaLand Ltd | | | 2,201 | |
| | 767,362 | | | e | | CapitaMall Trust | | | 1,161 | |
| | 133,000 | | | | | CapitaMalls Asia Ltd | | | 207 | |
| | 162,868 | | | e | | City Developments Ltd | | | 1,244 | |
| | 202,028 | | | | | ComfortDelgro Corp Ltd | | | 323 | |
| | 679,025 | | | | | DBS Group Holdings Ltd | | | 9,228 | |
| | 650,497 | | | * | | Flextronics International Ltd | | | 5,054 | |
| | 34,727,484 | | | | | Genting International plc | | | 41,297 | |
| | 4,515,500 | | | | | Global Logistic Properties | | | 10,358 | |
| | 716,497 | | | | | Golden Agri-Resources Ltd | | | 310 | |
| | 514,000 | | | | | Hotel Properties Ltd | | | 1,268 | |
| | 544,700 | | | e | | Hutchison Port Holdings Trust | | | 368 | |
| | 11,082 | | | | | Jardine Cycle & Carriage Ltd | | | 317 | |
| | 428,425 | | | | | Keppel Corp Ltd | | | 3,806 | |
| | 721,000 | | | | | Keppel Land Ltd | | | 1,914 | |
| | 26,000 | | | | | K-Green Trust | | | 21 | |
| | 78,567 | | | e | | K-REIT Asia | | | 74 | |
| | 140,155 | | | e | | Olam International Ltd | | | 171 | |
| | 1,172,699 | | | | | Oversea-Chinese Banking Corp | | | 9,505 | |
| | 99,609 | | | | | SembCorp Industries Ltd | | | 435 | |
| | 367,857 | | | e | | SembCorp Marine Ltd | | | 1,301 | |
| | 157,492 | | | e | | Singapore Airlines Ltd | | | 1,301 | |
| | 277,560 | | | | | Singapore Exchange Ltd | | | 1,601 | |
| | 532,963 | | | e | | Singapore Press Holdings Ltd | | | 1,742 | |
| | 490,896 | | | | | Singapore Technologies Engineering Ltd | | | 1,545 | |
| | 2,832,704 | | | | | Singapore Telecommunications Ltd | | | 8,238 | |
| | 56,274 | | | | | StarHub Ltd | | | 192 | |
| | 351,022 | | | | | United Overseas Bank Ltd | | | 5,928 | |
| | 1,068,965 | | | | | United Overseas Land Ltd | | | 5,261 | |
| | 194,230 | | | | | Wilmar International Ltd | | | 528 | |
| | | | | | | TOTAL SINGAPORE | | | 117,612 | |
| | | | | | | | | | | |
| SPAIN - 0.6% | | | | |
| | 34,950 | | | | | Abertis Infraestructuras S.A. (Continuous) | | | 777 | |
| | 1,189 | | | e | | Acciona S.A. | | | 69 | |
| | 6,596 | | | e | | Acerinox S.A. | | | 84 | |
| | 15,024 | | | | | ACS Actividades Cons y Servicios S.A. | | | 518 | |
COLLEGE RETIREMENT EQUITIES FUND - Global Equities Account
| | | | | | | | VALUE | |
| SHARES | | | | | COMPANY | | (000) | |
| | 608,619 | | | | | Amadeus IT Holding S.A. | | $ | 26,070 | |
| | 471,026 | | | | | Banco Bilbao Vizcaya Argentaria S.A. | | | 5,827 | |
| | 220,183 | | | e | | Banco de Sabadell S.A. | | | 575 | |
| | 77,626 | | | * | | Banco Popular Espanol S.A. | | | 469 | |
| | 986,686 | | | | | Banco Santander Central Hispano S.A. | | | 8,873 | |
| | 47,829 | | | * | | Bankia S.A. | | | 81 | |
| | 41,721 | | | | | Cintra Concesiones de Infraestructuras de Transporte S.A. | | | 808 | |
| | 89,425 | | | | | Corp Mapfre S.A. | | | 384 | |
| | 134,255 | | | | | Criteria Caixacorp S.A. | | | 699 | |
| | 1,855,204 | | | | | Distribuidora Internacional de Alimentacion S.A. | | | 16,611 | |
| | 10,274 | | | e | | Enagas | | | 268 | |
| | 125,000 | | | *,e | | Endesa S.A. | | | 4,010 | |
| | 218,959 | | | | | Gas Natural SDG S.A. | | | 5,636 | |
| | 13,381 | | | | | Grifols S.A. | | | 640 | |
| | 234 | | | | | Grifols S.A. (Class B) | | | 8 | |
| | 444,249 | | | | | Iberdrola S.A. | | | 2,835 | |
| | 21,804 | | | | | Inditex S.A. | | | 3,600 | |
| | 110,000 | | | e | | Obrascon Huarte Lain S.A. | | | 4,463 | |
| | 5,834 | | | e | | Red Electrica de Espana | | | 390 | |
| | 721,127 | | | | | Repsol YPF S.A. | | | 18,196 | |
| | 728,647 | | | | | Telefonica S.A. | | | 11,914 | |
| | 15,064 | | | e | | Zardoya Otis S.A. | | | 273 | |
| | | | | | | TOTAL SPAIN | | | 114,078 | |
| | | | | | | | | | | |
| SWEDEN - 1.1% | | | | |
| | 33,371 | | | | | Alfa Laval AB | | | 857 | |
| | 38,000 | | | * | | Arcam AB | | | 5,671 | |
| | 112,341 | | | | | Assa Abloy AB (Class B) | | | 5,948 | |
| | 66,614 | | | | | Atlas Copco AB (A Shares) | | | 1,850 | |
| | 38,801 | | | | | Atlas Copco AB (B Shares) | | | 986 | |
| | 827,200 | | | * | | Biovitrum AB | | | 8,582 | |
| | 13,980 | | | | | Boliden AB | | | 214 | |
| | 669,870 | | | | | Electrolux AB (Series B) | | | 17,505 | |
| | 19,317 | | | e | | Elekta AB (B Shares) | | | 296 | |
| | 2,104,032 | | | | | Ericsson (LM) (B Shares) | | | 25,689 | |
| | 713,900 | | | *,e | | Fingerprint Cards AB | | | 6,065 | |
| | 19,943 | | | | | Getinge AB (B Shares) | | | 684 | |
| | 450,267 | | | | | Hennes & Mauritz AB (B Shares) | | | 20,738 | |
| | 12,502 | | | | | Hexagon AB (B Shares) | | | 395 | |
| | 2,486 | | | | | Holmen AB (B Shares) | | | 90 | |
| | 40,216 | | | | | Husqvarna AB (B Shares) | | | 242 | |
| | 5,902 | | | | | Industrivarden AB | | | 112 | |
| | 613,283 | | | | | Intrum Justitia AB | | | 17,168 | |
| | 45,314 | | | | | Investor AB (B Shares) | | | 1,562 | |
| | 100,000 | | | | | JM AB | | | 2,825 | |
| | 964,675 | | | | | Kinnevik Investment AB (Series B) | | | 44,723 | |
| | 11,757 | | | * | | Lundin Petroleum AB | | | 229 | |
| | 330,000 | | | | | Meda AB (A Shares) | | | 4,191 | |
| | 200,000 | | | e | | NCC AB (B Shares) | | | 6,532 | |
| | 311,292 | | | | | Nordea Bank AB | | | 4,197 | |
| | 103,131 | | | | | Sandvik AB | | | 1,456 | |
COLLEGE RETIREMENT EQUITIES FUND - Global Equities Account
| | | | | | | | VALUE | |
| SHARES | | | | | COMPANY | | (000) | |
| | 32,035 | | | | | Scania AB (B Shares) | | $ | 628 | |
| | 29,416 | | | | | Securitas AB (B Shares) | | | 313 | |
| | 151,320 | | | | | Skandinaviska Enskilda Banken AB (Class A) | | | 1,999 | |
| | 39,275 | | | | | Skanska AB (B Shares) | | | 804 | |
| | 39,104 | | | | | SKF AB (B Shares) | | | 1,026 | |
| | 8,386 | | | | | Ssab Svenskt Stal AB (Series A) | | | 64 | |
| | 706,567 | | | | | Svenska Cellulosa AB (B Shares) | | | 21,768 | |
| | 49,421 | | | | | Svenska Handelsbanken (A Shares) | | | 2,430 | |
| | 271,527 | | | | | Swedbank AB (A Shares) | | | 7,649 | |
| | 22,563 | | | | | Swedish Match AB | | | 725 | |
| | 31,056 | | | | | Tele2 AB | | | 353 | |
| | 227,694 | | | | | TeliaSonera AB | | | 1,899 | |
| | 130,325 | | | | | Volvo AB (B Shares) | | | 1,715 | |
| | | | | | | TOTAL SWEDEN | | | 220,180 | |
| | | | | | | | | | | |
| SWITZERLAND - 4.1% | | | | |
| | 168,451 | | | | | ABB Ltd | | | 4,454 | |
| | 70,976 | | | | | Actelion Ltd | | | 6,020 | |
| | 324,896 | | | | | Adecco S.A. | | | 25,792 | |
| | 8,284 | | | | | Aryzta AG. | | | 637 | |
| | 56,891 | | | | | Baloise Holding AG. | | | 7,254 | |
| | 110 | | | | | Barry Callebaut AG. | | | 138 | |
| | 431,434 | | | | | Cie Financiere Richemont S.A. | | | 43,099 | |
| | 18,790 | | | | | Coca-Cola HBC AG. | | | 550 | |
| | 984,977 | | | | | Credit Suisse Group | | | 30,400 | |
| | 393 | | | | | EMS-Chemie Holding AG. | | | 140 | |
| | 406,687 | | | * | | Foster Wheeler AG. | | | 13,429 | |
| | 3,951 | | | | | Geberit AG. | | | 1,199 | |
| | 8,000 | | | | | Georg Fischer AG. | | | 5,632 | |
| | 792 | | | | | Givaudan S.A. | | | 1,133 | |
| | 854,741 | | | | | Glencore Xstrata plc | | | 4,447 | |
| | 10,000 | | | | | Helvetia Holding AG. | | | 5,020 | |
| | 457,990 | | | | | Holcim Ltd | | | 34,242 | |
| | 11,856 | | | | | Julius Baer Group Ltd | | | 570 | |
| | 5,397 | | | | | Kuehne & Nagel International AG. | | | 709 | |
| | 85 | | | | | Lindt & Spruengli AG. | | | 383 | |
| | 10 | | | | | Lindt & Spruengli AG. (Registered) | | | 539 | |
| | 360,663 | | | | | Lonza Group AG. | | | 34,275 | |
| | 1,090,163 | | | | | Nestle S.A. | | | 79,898 | |
| | 1,699,712 | | | | | Novartis AG. | | | 136,231 | |
| | 305,511 | | | | | Novartis AG. (ADR) | | | 24,557 | |
| | 2,567 | | | | | Pargesa Holding S.A. | | | 207 | |
| | 849 | | | | | Partners Group | | | 226 | |
| | 4,836 | | | | | Phonak Holding AG. | | | 652 | |
| | 568,069 | | | | | Roche Holding AG. | | | 159,131 | |
| | 2,368 | | | | | Schindler Holding AG. | | | 349 | |
| | 1,135 | | | | | Schindler Holding AG. (Reg) | | | 168 | |
| | 513 | | | | | SGS S.A. | | | 1,181 | |
| | 112 | | | | | Sika AG. | | | 399 | |
| | 66,175 | | | e | | STMicroelectronics NV | | | 531 | |
| | 368 | | | | | Straumann Holding AG. | | | 69 | |
| | 1,301 | | | | | Sulzer AG. | | | 210 | |
COLLEGE RETIREMENT EQUITIES FUND - Global Equities Account
| | | | | | | | VALUE | |
| SHARES | | | | | COMPANY | | (000) | |
| | 3,295 | | | | | Swatch Group AG. | | $ | 2,184 | |
| | 3,084 | | | | | Swatch Group AG. Reg | | | 348 | |
| | 3,067 | | | | | Swiss Life Holding | | | 638 | |
| | 2,819 | | | | | Swiss Prime Site AG. | | | 218 | |
| | 560,178 | | | | | Swiss Re Ltd | | | 51,642 | |
| | 2,360 | | | | | Swisscom AG. | | | 1,247 | |
| | 8,440 | | | | | Syngenta AG. | | | 3,365 | |
| | 623,363 | | | | | Tyco Electronics Ltd | | | 34,354 | |
| | 3,492,375 | | | | | UBS AG. | | | 66,869 | |
| | 14,667 | | | | | Zurich Financial Services AG. | | | 4,254 | |
| | | | | | | TOTAL SWITZERLAND | | | 788,990 | |
| | | | | | | | | | | |
| TAIWAN - 0.3% | | | | |
| | 1,753,000 | | | | | Advanced Semiconductor Engineering, Inc | | | 1,638 | |
| | 346,120 | | | | | Eclat Textile Co Ltd | | | 3,908 | |
| | 364,000 | | | | | Ginko International Co Ltd | | | 6,876 | |
| | 3,873,685 | | | | | Hota Industrial Manufacturing Co Ltd | | | 5,997 | |
| | 3,500,000 | | | * | | Inotera Memories, Inc | | | 2,594 | |
| | 3,000,000 | | | | | Inventec Co Ltd | | | 2,656 | |
| | 861,000 | | | | | King Slide Works Co Ltd | | | 9,726 | |
| | 125,000 | | | | | Largan Precision Co Ltd | | | 5,109 | |
| | 474,000 | | | | | MediaTek, Inc | | | 7,065 | |
| | 15,247,263 | | | | | Taishin Financial Holdings Co Ltd | | | 7,510 | |
| | 360,000 | | | | | Taiwan Semiconductor Manufacturing Co Ltd | | | 1,271 | |
| | | | | | | TOTAL TAIWAN | | | 54,350 | |
| | | | | | | | | | | |
| THAILAND - 0.1% | | | | |
| | 469,000 | | | | | Advanced Info Service PCL | | | 2,860 | |
| | 850,000 | | | | | Bangkok Bank PCL (ADR) | | | 4,630 | |
| | 3,000,000 | | | | | Delta Electronics Thai PCL | | | 4,901 | |
| | | | | | | TOTAL THAILAND | | | 12,391 | |
| | | | | | | | | | | |
| TURKEY - 0.1% | | | | |
| | 1,177,700 | | | | | TAV Havalimanlari Holding AS | | | 8,479 | |
| | 930,000 | | | | | Tofas Turk Otomobil Fabrik | | | 5,806 | |
| | 180,000 | | | | | Turk Traktor ve Ziraat Makineleri AS | | | 5,156 | |
| | | | | | | TOTAL TURKEY | | | 19,441 | |
| | | | | | | | | | | |
| UKRAINE - 0.0% | | | | |
| | 407,456 | | | | | MHP SA (GDR) | | | 6,947 | |
| | | | | | | TOTAL UKRAINE | | | 6,947 | |
| | | | | | | | | | | |
| UNITED ARAB EMIRATES - 0.0% | | | | |
| | 950,000 | | | | | First Gulf Bank PJSC | | | 4,871 | |
| | | | | | | TOTAL UNITED ARAB EMIRATES | | | 4,871 | |
| | | | | | | | | | | |
| UNITED KINGDOM - 7.9% | | | | |
| | 96,643 | | | | | 3i Group plc | | | 618 | |
| | 49,708 | | | | | Aberdeen Asset Management plc | | | 413 | |
| | 14,354 | | | | | Acergy S.A. | | | 275 | |
| | 19,133 | | | | | Admiral Group plc | | | 416 | |
COLLEGE RETIREMENT EQUITIES FUND - Global Equities Account
| | | | | | | | VALUE | |
| SHARES | | | | | COMPANY | | (000) | |
| | 14,394 | | | | | Aggreko plc | | $ | 408 | |
| | 15,797 | | | | | AMEC plc | | | 285 | |
| | 134,720 | | | | | Anglo American plc (London) | | | 2,948 | |
| | 39,757 | | | | | Antofagasta plc | | | 545 | |
| | 77,837 | | | | | Aon plc | | | 6,530 | |
| | 1,604,461 | | | | | ARM Holdings plc | | | 29,174 | |
| | 2,693,305 | | | | | Ashtead Group plc | | �� | 33,975 | |
| | 450,797 | | | * | | ASOS plc | | | 45,931 | |
| | 138,476 | | | | | Associated British Foods plc | | | 5,616 | |
| | 124,438 | | | | | AstraZeneca plc | | | 7,383 | |
| | 8,852 | | | | | AstraZeneca plc (ADR) | | | 526 | |
| | 387,990 | | | | | Aveva Group plc | | | 13,927 | |
| | 284,049 | | | | | Aviva plc | | | 2,125 | |
| | 18,740 | | | | | Babcock International Group | | | 421 | |
| | 334,268 | | | | | BAE Systems plc | | | 2,412 | |
| | 32,213 | | | | | Balfour Beatty plc | | | 153 | |
| | 23,399,325 | | | | | Barclays plc | | | 105,809 | |
| | 1,519,262 | | | | | BG Group plc | | | 32,692 | |
| | 178,109 | | | | | BHP Billiton plc | | | 5,527 | |
| | 4,312,578 | | | | | BP plc | | | 34,950 | |
| | 22,139 | | | | | BP plc (ADR) | | | 1,076 | |
| | 8,470,318 | | | * | | British Airways plc | | | 56,436 | |
| | 177,625 | | | | | British American Tobacco plc | | | 9,534 | |
| | 439,579 | | | | | British Land Co plc | | | 4,583 | |
| | 2,803,936 | | | | | British Sky Broadcasting plc | | | 39,188 | |
| | 2,064,173 | | | | | Britvic plc | | | 23,698 | |
| | 623,716 | | | | | BT Group plc | | | 3,933 | |
| | 16,987 | | | | | Bunzl plc | | | 408 | |
| | 41,896 | | | | | Burberry Group plc | | | 1,056 | |
| | 34,546 | | | | | Capita Group plc | | | 595 | |
| | 9,878 | | | | | Carnival plc | | | 409 | |
| | 519,554 | | | | | Centrica plc | | | 2,996 | |
| | 54,995 | | | | | Cobham plc | | | 250 | |
| | 581,357 | | | | | Compass Group plc | | | 9,334 | |
| | 1,261,296 | | | | | Countrywide plc | | | 12,427 | |
| | 7,193 | | | | | Croda International plc | | | 293 | |
| | 400,000 | | | e | | Daily Mail & General Trust | | | 6,372 | |
| | 720,790 | | | | | Delphi Automotive plc | | | 43,341 | |
| | 243,530 | | | | | Diageo plc | | | 8,070 | |
| | 54,459 | | | | | Direct Line Insurance Group plc | | | 225 | |
| | 1,656,733 | | | | | easyJet plc | | | 42,225 | |
| | 58,254 | | | | | Experian Group Ltd | | | 1,076 | |
| | 83,956 | | | | | GKN plc | | | 520 | |
| | 1,835,843 | | | | | GlaxoSmithKline plc | | | 49,049 | |
| | 134,506 | | | | | Group 4 Securicor plc | | | 585 | |
| | 70,363 | | | | | Hammerson plc | | | 586 | |
| | 11,537 | | | | | Hargreaves Lansdown plc | | | 259 | |
| | 6,178,010 | | | | | HSBC Holdings plc | | | 67,798 | |
| | 53,870 | | | | | ICAP plc | | | 403 | |
| | 16,817 | | | | | IMI plc | | | 426 | |
| | 220,645 | | | | | Imperial Tobacco Group plc | | | 8,554 | |
| | 200,000 | | | | | Inchcape plc | | | 2,042 | |
COLLEGE RETIREMENT EQUITIES FUND - Global Equities Account
| | | | | | | | VALUE | |
| SHARES | | | | | COMPANY | | (000) | |
| | 23,945 | | | | | Inmarsat plc | | $ | 300 | |
| | 25,635 | | | | | InterContinental Hotels Group plc | | | 855 | |
| | 72,791 | | | * | | International Consolidated Airlines | | | 485 | |
| | 400,000 | | | | | International Personal Finance plc | | | 3,309 | |
| | 8,539 | | | | | Intertek Group plc | | | 446 | |
| | 34,273 | | | | | Invensys plc | | | 290 | |
| | 50,643 | | | | | Investec plc | | | 368 | |
| | 190,542 | | | | | ITV plc | | | 613 | |
| | 119,993 | | | | | J Sainsbury plc | | | 726 | |
| | 10,733 | | | | | Johnson Matthey plc | | | 584 | |
| | 124,714 | | | | | Kingfisher plc | | | 796 | |
| | 77,929 | | | | | Land Securities Group plc | | | 1,245 | |
| | 11,231,269 | | | | | Legal & General Group plc | | | 41,516 | |
| | 18,045 | | | * | | Liberty Global plc | | | 1,522 | |
| | 63,590 | | | * | | Liberty Global plc (Class A) | | | 5,659 | |
| | 57,900 | | | | | Liberty International plc | | | 297 | |
| | 37,298,893 | | | * | | Lloyds TSB Group plc | | | 48,943 | |
| | 16,448 | | | | | London Stock Exchange Group plc | | | 473 | |
| | 81,128 | | | | | Man Group plc | | | 115 | |
| | 84,421 | | | | | Marks & Spencer Group plc | | | 606 | |
| | 40,354 | | | | | Meggitt plc | | | 353 | |
| | 65,166 | | | | | Melrose Industries plc | | | 331 | |
| | 600,000 | | | | | MFI Furniture plc | | | 3,433 | |
| | 540,000 | | | | | Mondi plc | | | 9,374 | |
| | 13,530,554 | | | * | | Monitise plc | | | 15,067 | |
| | 354,257 | | | | | National Grid plc | | | 4,633 | |
| | 950,000 | | | | | New Carphone Warehouse plc | | | 4,271 | |
| | 401,124 | | | | | Next plc | | | 36,258 | |
| | 476,145 | | | | | Old Mutual plc | | | 1,494 | |
| | 70,891 | | | | | Pearson plc | | | 1,581 | |
| | 15,489 | | | | | Persimmon plc | | | 318 | |
| | 23,519 | | | | | Petrofac Ltd | | | 477 | |
| | 3,255,075 | | | | | Prudential plc | | | 72,731 | |
| | 62,250 | | | | | Reckitt Benckiser Group plc | | | 4,945 | |
| | 61,455 | | | | | Reed Elsevier plc | | | 917 | |
| | 79,063 | | | | | Resolution Ltd | | | 464 | |
| | 78,761 | | | | | Rexam plc | | | 693 | |
| | 264,462 | | | | | Rightmove plc | | | 12,010 | |
| | 775,734 | | | | | Rio Tinto plc | | | 43,836 | |
| | 1,749,126 | | | | | Rolls-Royce Group plc | | | 36,996 | |
| | 351,868 | | | | | Royal & Sun Alliance Insurance Group plc | | | 533 | |
| | 193,420 | | | * | | Royal Bank of Scotland Group plc | | | 1,089 | |
| | 5,149,049 | | | * | | Royal Mail plc | | | 48,601 | |
| | 497,761 | | | | | SABMiller plc | | | 25,622 | |
| | 118,308 | | | | | Sage Group plc | | | 792 | |
| | 11,036 | | | | | Schroders plc | | | 476 | |
| | 94,112 | | | | | Scottish & Southern Energy plc | | | 2,139 | |
| | 73,142 | | | | | Segro plc | | | 405 | |
| | 50,640 | | | | | Serco Group plc | | | 419 | |
| | 23,677 | | | | | Severn Trent plc | | | 669 | |
| | 89,395 | | | | | Smith & Nephew plc | | | 1,277 | |
| | 171,451 | | | | | Smiths Group plc | | | 4,210 | |
COLLEGE RETIREMENT EQUITIES FUND - Global Equities Account
| | | | | | | | VALUE | |
| SHARES | | | | | COMPANY | | (000) | |
| | 631,939 | | | * | | Sports Direct International plc | | $ | 7,502 | |
| | 1,157,846 | | | | | Standard Chartered plc | | | 26,152 | |
| | 228,178 | | | | | Standard Life plc | | | 1,363 | |
| | 243,474 | | | * | | SuperGroup plc | | | 5,709 | |
| | 24,292 | | | | | Tate & Lyle plc | | | 326 | |
| | 3,706,649 | | | | | Taylor Woodrow plc | | | 6,865 | |
| | 674,077 | | | | | Tesco plc | | | 3,743 | |
| | 1,308,170 | | | | | Travis Perkins plc | | | 40,637 | |
| | 1,148,492 | | | | | TUI Travel plc | | | 7,872 | |
| | 48,019 | | | | | Tullow Oil plc | | | 682 | |
| | 370,990 | | | | | Unilever plc | | | 15,265 | |
| | 68,296 | | | | | United Utilities Group plc | | | 760 | |
| | 26,056,268 | | | | | Vodafone Group plc | | | 102,589 | |
| | 32,612 | | | | | Vodafone Group plc (ADR) | | | 1,282 | |
| | 187,900 | | | * | | WANdisco plc | | | 3,827 | |
| | 11,373 | | | | | Weir Group plc | | | 403 | |
| | 381,872 | | | | | Whitbread plc | | | 23,766 | |
| | 42,312 | | | | | William Hill plc | | | 282 | |
| | 214,157 | | | | | WM Morrison Supermarkets plc | | | 927 | |
| | 515,191 | | | | | Wolseley plc | | | 29,290 | |
| | 2,251,489 | | | | | WPP plc | | | 51,568 | |
| | 125,000 | | | | | Xaar plc | | | 2,323 | |
| | | | | | | TOTAL UNITED KINGDOM | | | 1,509,501 | |
| | | | | | | | | | | |
| UNITED STATES - 52.7% | | | | |
| | 415,248 | | | | | 3M Co | | | 58,239 | |
| | 70,000 | | | | | A.O. Smith Corp | | | 3,776 | |
| | 1,786,750 | | | | | Abbott Laboratories | | | 68,486 | |
| | 458,694 | | | | | AbbVie, Inc | | | 24,224 | |
| | 27,878 | | | e | | Abercrombie & Fitch Co (Class A) | | | 917 | |
| | 7,639 | | | *,e | | Acceleron Pharma, Inc | | | 303 | |
| | 201,640 | | | | | Accenture plc | | | 16,579 | |
| | 679,286 | | | | | ACE Ltd | | | 70,326 | |
| | 173,591 | | | * | | Actavis plc | | | 29,163 | |
| | 49,033 | | | | | Activision Blizzard, Inc | | | 874 | |
| | 256,545 | | | * | | Adobe Systems, Inc | | | 15,362 | |
| | 275,221 | | | e | | ADT Corp | | | 11,138 | |
| | 8,402 | | | | | Advance Auto Parts, Inc | | | 930 | |
| | 250,000 | | | * | | AerCap Holdings NV | | | 9,587 | |
| | 291,928 | | | | | AES Corp | | | 4,236 | |
| | 393,781 | | | | | Aetna, Inc | | | 27,009 | |
| | 66,876 | | | * | | Affiliated Managers Group, Inc | | | 14,504 | |
| | 84,215 | | | | | Aflac, Inc | | | 5,626 | |
| | 100,870 | | | | | AGCO Corp | | | 5,970 | |
| | 468,058 | | | | | Agilent Technologies, Inc | | | 26,768 | |
| | 31,278 | | | | | Air Products & Chemicals, Inc | | | 3,496 | |
| | 7,567 | | | | | Airgas, Inc | | | 846 | |
| | 19,396 | | | * | | Akamai Technologies, Inc | | | 915 | |
| | 64,200 | | | | | Alaska Air Group, Inc | | | 4,710 | |
| | 8,977 | | | | | Albemarle Corp | | | 569 | |
| | 118,768 | | | e | | Alcoa, Inc | | | 1,263 | |
| | 426,485 | | | * | | Alexion Pharmaceuticals, Inc | | | 56,748 | |
COLLEGE RETIREMENT EQUITIES FUND - Global Equities Account
| | | | | | | | VALUE | |
| SHARES | | | | | COMPANY | | (000) | |
| | 1,976 | | | * | | Alleghany Corp | | $ | 790 | |
| | 68,066 | | | * | | Allegion plc | | | 3,008 | |
| | 135,875 | | | | | Allergan, Inc | | | 15,093 | |
| | 79,239 | | | *,e | | Alliance Data Systems Corp | | | 20,834 | |
| | 62,184 | | | | | Alliant Energy Corp | | | 3,209 | |
| | 23,800 | | | | | Allied World Assurance Co Holdings Ltd | | | 2,685 | |
| | 281,460 | | | | | Allstate Corp | | | 15,351 | |
| | 34,660 | | | | | Altera Corp | | | 1,127 | |
| | 1,561,589 | | | | | Altria Group, Inc | | | 59,949 | |
| | 151,149 | | | * | | Amazon.com, Inc | | | 60,277 | |
| | 122,105 | | | * | | AMC Entertainment Holdings, Inc | | | 2,509 | |
| | 90,000 | | | * | | AMC Networks, Inc | | | 6,130 | |
| | 9,878 | | | * | | Amerco, Inc | | | 2,349 | |
| | 37,060 | | | | | Ameren Corp | | | 1,340 | |
| | 44,511 | | | | | American Capital Agency Corp | | | 859 | |
| | 86,233 | | | | | American Electric Power Co, Inc | | | 4,031 | |
| | 422,022 | | | | | American Express Co | | | 38,290 | |
| | 113,900 | | | | | American Financial Group, Inc | | | 6,574 | |
| | 296,719 | | | | | American International Group, Inc | | | 15,148 | |
| | 103,570 | | | | | American Tower Corp | | | 8,267 | |
| | 79,437 | | | | | American Water Works Co, Inc | | | 3,357 | |
| | 202,649 | | | | | Ameriprise Financial, Inc | | | 23,315 | |
| | 79,666 | | | | | AmerisourceBergen Corp | | | 5,601 | |
| | 87,716 | | | | | Ametek, Inc | | | 4,620 | |
| | 377,075 | | | | | Amgen, Inc | | | 43,047 | |
| | 63,827 | | | | | Amphenol Corp (Class A) | | | 5,692 | |
| | 441,040 | | | | | Anadarko Petroleum Corp | | | 34,983 | |
| | 49,325 | | | | | Analog Devices, Inc | | | 2,512 | |
| | 426,525 | | | * | | Ann Taylor Stores Corp | | | 15,594 | |
| | 130,112 | | | | | Annaly Capital Management, Inc | | | 1,297 | |
| | 9,898 | | | * | | Ansys, Inc | | | 863 | |
| | 89,669 | | | | | Apache Corp | | | 7,706 | |
| | 568,407 | | | | | Apple, Inc | | | 318,939 | |
| | 730,611 | | | | | Applied Materials, Inc | | | 12,925 | |
| | 59,080 | | | * | | Arch Capital Group Ltd | | | 3,526 | |
| | 220,642 | | | | | Archer Daniels Midland Co | | | 9,576 | |
| | 22,837 | | | * | | Arrow Electronics, Inc | | | 1,239 | |
| | 8,094 | | | | | Ashland, Inc | | | 785 | |
| | 22,755 | | | | | Assurant, Inc | | | 1,510 | |
| | 1,283,805 | | | | | AT&T, Inc | | | 45,139 | |
| | 170,364 | | | * | | Autodesk, Inc | | | 8,574 | |
| | 19,948 | | | e | | Autoliv, Inc | | | 1,831 | |
| | 79,218 | | | | | Automatic Data Processing, Inc | | | 6,402 | |
| | 11,384 | | | * | | AutoZone, Inc | | | 5,441 | |
| | 549,230 | | | | | Avago Technologies Ltd | | | 29,049 | |
| | 17,263 | | | | | AvalonBay Communities, Inc | | | 2,041 | |
| | 21,398 | | | | | Avery Dennison Corp | | | 1,074 | |
| | 30,897 | | | | | Avnet, Inc | | | 1,363 | |
| | 112,373 | | | | | Avon Products, Inc | | | 1,935 | |
| | 166,701 | | | | | Axiall Corp | | | 7,908 | |
| | 217,956 | | | | | Axis Capital Holdings Ltd | | | 10,368 | |
| | 417,662 | | | | | Baker Hughes, Inc | | | 23,080 | |
COLLEGE RETIREMENT EQUITIES FUND - Global Equities Account
| | | | | | | | VALUE | |
| SHARES | | | | | COMPANY | | (000) | |
| | 24,080 | | | | | Ball Corp | | $ | 1,244 | |
| | 90,000 | | | * | | Bally Technologies, Inc | | | 7,060 | |
| | 3,680,587 | | | | | Bank of America Corp | | | 57,307 | |
| | 211,341 | | | | | Bank of New York Mellon Corp | | | 7,384 | |
| | 8,393 | | | | | Bard (C.R.), Inc | | | 1,124 | |
| | 144,486 | | | | | Baxter International, Inc | | | 10,049 | |
| | 77,835 | | | | | BB&T Corp | | | 2,905 | |
| | 40,989 | | | * | | BE Aerospace, Inc | | | 3,567 | |
| | 123,184 | | | | | Beam, Inc | | | 8,384 | |
| | 60,862 | | | | | Becton Dickinson & Co | | | 6,725 | |
| | 78,837 | | | * | | Bed Bath & Beyond, Inc | | | 6,331 | |
| | 294,847 | | | * | | Berkshire Hathaway, Inc (Class B) | | | 34,957 | |
| | 110,000 | | | * | | Berry Plastics Group, Inc | | | 2,617 | |
| | 399,771 | | | | | Best Buy Co, Inc | | | 15,943 | |
| | 159,223 | | | * | | Biogen Idec, Inc | | | 44,543 | |
| | 14,836 | | | * | | BioMarin Pharmaceuticals, Inc | | | 1,043 | |
| | 110,597 | | | * | | Biovail Corp (Toronto) | | | 12,975 | |
| | 25,908 | | | | | BlackRock, Inc | | | 8,199 | |
| | 110,000 | | | | | Blackstone Group LP | | | 3,465 | |
| | 234,808 | | | | | Boeing Co | | | 32,049 | |
| | 48,752 | | | | | BorgWarner, Inc | | | 2,726 | |
| | 23,332 | | | | | Boston Properties, Inc | | | 2,342 | |
| | 222,414 | | | * | | Boston Scientific Corp | | | 2,673 | |
| | 41,500 | | | | | Brinker International, Inc | | | 1,923 | |
| | 401,894 | | | | | Bristol-Myers Squibb Co | | | 21,361 | |
| | 751,196 | | | | | Broadcom Corp (Class A) | | | 22,273 | |
| | 160,000 | | | | | Broadridge Financial Solutions, Inc | | | 6,323 | |
| | 500,000 | | | * | | Brocade Communications Systems, Inc | | | 4,435 | |
| | 145,467 | | | | | Brookfield Office Properties, Inc (Toronto) | | | 2,800 | |
| | 1,312 | | | | | Brookfield Property Partners LP | | | 26 | |
| | 69,877 | | | | | Brown-Forman Corp (Class B) | | | 5,281 | |
| | 265,077 | | | | | Bunge Ltd | | | 21,765 | |
| | 174,479 | | | | | CA, Inc | | | 5,871 | |
| | 35,146 | | | e | | Cablevision Systems Corp (Class A) | | | 630 | |
| | 634,285 | | | | | Cabot Oil & Gas Corp | | | 24,585 | |
| | 97,000 | | | *,e | | CACI International, Inc (Class A) | | | 7,102 | |
| | 77,281 | | | * | | Calpine Corp | | | 1,508 | |
| | 9,910 | | | | | Camden Property Trust | | | 564 | |
| | 37,135 | | | * | | Cameron International Corp | | | 2,211 | |
| | 22,041 | | | e | | Campbell Soup Co | | | 954 | |
| | 74,746 | | | | | Capital One Financial Corp | | | 5,726 | |
| | 97,212 | | | | | Cardinal Health, Inc | | | 6,495 | |
| | 251,019 | | | * | | CareFusion Corp | | | 9,996 | |
| | 25,400 | | | | | Carlisle Cos, Inc | | | 2,017 | |
| | 196,043 | | | * | | Carmax, Inc | | | 9,218 | |
| | 603,483 | | | | | Carnival Corp | | | 24,242 | |
| | 127,653 | | | * | | Catamaran Corp | | | 6,061 | |
| | 64,827 | | | * | | Catamaran Corp (Toronto) | | | 3,079 | |
| | 149,284 | | | | | Caterpillar, Inc | | | 13,556 | |
| | 72,564 | | | * | | CBRE Group, Inc | | | 1,908 | |
| | 191,507 | | | | | CBS Corp (Class B) | | | 12,207 | |
| | 144,121 | | | | | Celanese Corp (Series A) | | | 7,971 | |
COLLEGE RETIREMENT EQUITIES FUND - Global Equities Account
| | | | | | | | VALUE | |
| SHARES | | | | | COMPANY | | (000) | |
| | 474,935 | | | * | | Celgene Corp | | $ | 80,245 | |
| | 494,092 | | | | | Centerpoint Energy, Inc | | | 11,453 | |
| | 155,703 | | | | | CenturyTel, Inc | | | 4,959 | |
| | 65,342 | | | * | | Cerner Corp | | | 3,642 | |
| | 69,272 | | | | | CF Industries Holdings, Inc | | | 16,143 | |
| | 27,583 | | | e | | CH Robinson Worldwide, Inc | | | 1,609 | |
| | 274,339 | | | | | Charles Schwab Corp | | | 7,133 | |
| | 6,601 | | | * | | Charter Communications, Inc | | | 903 | |
| | 199,213 | | | * | | Cheniere Energy, Inc | | | 8,590 | |
| | 77,102 | | | | | Chesapeake Energy Corp | | | 2,093 | |
| | 925,721 | | | | | Chevron Corp | | | 115,632 | |
| | 53,321 | | | | | Chicago Bridge & Iron Co NV | | | 4,433 | |
| | 15,725 | | | * | | Chipotle Mexican Grill, Inc (Class A) | | | 8,378 | |
| | 28,283 | | | | | Chubb Corp | | | 2,733 | |
| | 69,068 | | | | | Church & Dwight Co, Inc | | | 4,578 | |
| | 734,579 | | | *,e | | Ciena Corp | | | 17,578 | |
| | 214,263 | | | | | Cigna Corp | | | 18,744 | |
| | 19,028 | | | | | Cimarex Energy Co | | | 1,996 | |
| | 37,527 | | | | | Cincinnati Financial Corp | | | 1,965 | |
| | 11,743 | | | | | Cintas Corp | | | 700 | |
| | 1,957,216 | | | | | Cisco Systems, Inc | | | 43,939 | |
| | 61,682 | | | | | CIT Group, Inc | | | 3,215 | |
| | 2,547,732 | | | | | Citigroup, Inc | | | 132,762 | |
| | 20,987 | | | * | | Citrix Systems, Inc | | | 1,327 | |
| | 133,800 | | | e | | Cliffs Natural Resources, Inc | | | 3,507 | |
| | 27,468 | | | e | | Clorox Co | | | 2,548 | |
| | 44,979 | | | | | CME Group, Inc | | | 3,529 | |
| | 112,237 | | | | | CMS Energy Corp | | | 3,005 | |
| | 102,217 | | | | | Coach, Inc | | | 5,737 | |
| | 54,431 | | | * | | Cobalt International Energy, Inc | | | 895 | |
| | 1,230,311 | | | | | Coca-Cola Co | | | 50,824 | |
| | 144,210 | | | | | Coca-Cola Enterprises, Inc | | | 6,364 | |
| | 378,952 | | | * | | Cognizant Technology Solutions Corp (Class A) | | | 38,267 | |
| | 55,579 | | | e | | Cole Real Estate Investment, Inc | | | 780 | |
| | 378,159 | | | | | Colgate-Palmolive Co | | | 24,660 | |
| | 2,374,975 | | | | | Comcast Corp (Class A) | | | 123,416 | |
| | 186,990 | | | | | Comcast Corp (Special Class A) | | | 9,327 | |
| | 50,176 | | | | | Comerica, Inc | | | 2,385 | |
| | 134,870 | | | | | Computer Sciences Corp | | | 7,537 | |
| | 600,611 | | | | | ConAgra Foods, Inc | | | 20,241 | |
| | 142,519 | | | * | | Concho Resources, Inc | | | 15,392 | |
| | 870,175 | | | | | ConocoPhillips | | | 61,478 | |
| | 300,000 | | | | | Conseco, Inc | | | 5,307 | |
| | 49,212 | | | | | Consol Energy, Inc | | | 1,872 | |
| | 34,432 | | | | | Consolidated Edison, Inc | | | 1,903 | |
| | 35,784 | | | * | | Constellation Brands, Inc (Class A) | | | 2,518 | |
| | 26,776 | | | *,e | | Continental Resources, Inc | | | 3,013 | |
| | 10,077 | | | | | Core Laboratories NV | | | 1,924 | |
| | 247,050 | | | | | Corning, Inc | | | 4,402 | |
| | 371,544 | | | | | Costco Wholesale Corp | | | 44,217 | |
| | 444,817 | | | | | Covidien plc | | | 30,292 | |
| | 70,000 | | | | | Crane Co | | | 4,707 | |
COLLEGE RETIREMENT EQUITIES FUND - Global Equities Account
| | | | | | | | VALUE | |
| SHARES | | | | | COMPANY | | (000) | |
| | 26,056 | | | * | | Cree, Inc | | $ | 1,630 | |
| | 292,732 | | | * | | Crown Castle International Corp | | | 21,495 | |
| | 21,753 | | | * | | Crown Holdings, Inc | | | 970 | |
| | 257,908 | | | | | CSX Corp | | | 7,420 | |
| | 131,220 | | | | | Cummins, Inc | | | 18,498 | |
| | 763,997 | | | | | CVS Corp | | | 54,679 | |
| | 202,561 | | | | | Cytec Industries, Inc | | | 18,871 | |
| | 300,000 | | | | | Dana Holding Corp | | | 5,886 | |
| | 590,415 | | | | | Danaher Corp | | | 45,580 | |
| | 147,437 | | | | | Darden Restaurants, Inc | | | 8,016 | |
| | 30,812 | | | * | | DaVita, Inc | | | 1,953 | |
| | 57,539 | | | | | Deere & Co | | | 5,255 | |
| | 781,527 | | | | | Delta Air Lines, Inc | | | 21,469 | |
| | 110,000 | | | | | Deluxe Corp | | | 5,741 | |
| | 551,055 | | | * | | Denbury Resources, Inc | | | 9,054 | |
| | 23,414 | | | | | Dentsply International, Inc | | | 1,135 | |
| | 70,611 | | | | | Devon Energy Corp | | | 4,369 | |
| | 11,625 | | | e | | Diamond Offshore Drilling, Inc | | | 662 | |
| | 10,940 | | | | | Dick’s Sporting Goods, Inc | | | 636 | |
| | 13,475 | | | e | | Digital Realty Trust, Inc | | | 662 | |
| | 97,385 | | | | | Dillard’s, Inc (Class A) | | | 9,467 | |
| | 402,456 | | | * | | DIRECTV | | | 27,806 | |
| | 385,286 | | | | | Discover Financial Services | | | 21,557 | |
| | 82,683 | | | * | | Discovery Communications, Inc (Class A) | | | 7,476 | |
| | 22,072 | | | * | | Discovery Communications, Inc (Class C) | | | 1,851 | |
| | 87,877 | | | * | | DISH Network Corp (Class A) | | | 5,090 | |
| | 44,336 | | | * | | Dollar General Corp | | | 2,674 | |
| | 25,249 | | | * | | Dollar Tree, Inc | | | 1,425 | |
| | 547,780 | | | | | Dominion Resources, Inc | | | 35,436 | |
| | 60,086 | | | | | Dover Corp | | | 5,801 | |
| | 1,224,272 | | | | | Dow Chemical Co | | | 54,358 | |
| | 278,490 | | | * | | DR Horton, Inc | | | 6,216 | |
| | 34,323 | | | | | Dr Pepper Snapple Group, Inc | | | 1,672 | |
| | 70,961 | | | | | DTE Energy Co | | | 4,711 | |
| | 181,647 | | | | | Du Pont (E.I.) de Nemours & Co | | | 11,802 | |
| | 226,450 | | | | | Duke Energy Corp | | | 15,627 | |
| | 78,102 | | | | | Duke Realty Corp | | | 1,175 | |
| | 4,142 | | | | | Dun & Bradstreet Corp | | | 508 | |
| | 128,999 | | | | | East West Bancorp, Inc | | | 4,511 | |
| | 16,527 | | | | | Eastman Chemical Co | | | 1,334 | |
| | 551,289 | | | | | Eaton Corp | | | 41,964 | |
| | 13,944 | | | | | Eaton Vance Corp | | | 597 | |
| | 993,867 | | | * | | eBay, Inc | | | 54,553 | |
| | 129,186 | | | | | Ecolab, Inc | | | 13,470 | |
| | 78,759 | | | | | Edison International | | | 3,647 | |
| | 12,434 | | | * | | Edwards Lifesciences Corp | | | 818 | |
| | 67,123 | | | * | | Electronic Arts, Inc | | | 1,540 | |
| | 172,223 | | | | | Eli Lilly & Co | | | 8,783 | |
| | 1,411,011 | | | | | EMC Corp | | | 35,487 | |
| | 457,068 | | | | | Emerson Electric Co | | | 32,077 | |
| | 129,000 | | | *,e | | Endo Pharmaceuticals Holdings, Inc | | | 8,702 | |
| | 15,187 | | | | | Energen Corp | | | 1,074 | |
COLLEGE RETIREMENT EQUITIES FUND - Global Equities Account
| | | | | | | | VALUE | |
| SHARES | | | | | COMPANY | | (000) | |
| | 53,304 | | | | | Energizer Holdings, Inc | | $ | 5,770 | |
| | 1,784 | | | * | | Engility Holdings, Inc | | | 60 | |
| | 24,647 | | | | | Ensco plc | | | 1,409 | |
| | 32,491 | | | | | Entergy Corp | | | 2,056 | |
| | 27,760 | | | * | | Envision Healthcare Holdings, Inc | | | 986 | |
| | 107,635 | | | | | EOG Resources, Inc | | | 18,065 | |
| | 12,983 | | | | | Equifax, Inc | | | 897 | |
| | 5,369 | | | * | | Equinix, Inc | | | 953 | |
| | 68,042 | | | | | Equitable Resources, Inc | | | 6,109 | |
| | 50,567 | | | | | Equity Residential | | | 2,623 | |
| | 26,354 | | | | | Estee Lauder Cos (Class A) | | | 1,985 | |
| | 50,000 | | | * | | Esterline Technologies Corp | | | 5,098 | |
| | 27,421 | | | | | Everest Re Group Ltd | | | 4,274 | |
| | 280,000 | | | | | Exelis, Inc | | | 5,337 | |
| | 159,213 | | | | | Exelon Corp | | | 4,361 | |
| | 318,175 | | | | | Expedia, Inc | | | 22,164 | |
| | 22,332 | | | | | Expeditors International of Washington, Inc | | | 988 | |
| | 200,000 | | | * | | Express Parent LLC | | | 3,734 | |
| | 198,087 | | | * | | Express Scripts Holding Co | | | 13,914 | |
| | 630,654 | | | * | | Extended Stay America, Inc | | | 16,561 | |
| | 1,931,332 | | | d | | Exxon Mobil Corp | | | 195,451 | |
| | 218,613 | | | * | | F5 Networks, Inc | | | 19,863 | |
| | 643,387 | | | * | | Facebook, Inc | | | 35,168 | |
| | 11,887 | | | | | Family Dollar Stores, Inc | | | 772 | |
| | 31,954 | | | e | | Fastenal Co | | | 1,518 | |
| | 14,329 | | | | | Federal Realty Investment Trust | | | 1,453 | |
| | 111,998 | | | | | FedEx Corp | | | 16,102 | |
| | 73,058 | | | | | Fidelity National Information Services, Inc | | | 3,922 | |
| | 36,163 | | | | | Fidelity National Title Group, Inc (Class A) | | | 1,173 | |
| | 181,868 | | | | | Fifth Third Bancorp | | | 3,825 | |
| | 3,584 | | | *,e | | FireEye, Inc | | | 156 | |
| | 110,000 | | | * | | First American Corp | | | 3,908 | |
| | 21,571 | | | | | First Republic Bank | | | 1,129 | |
| | 50,940 | | | | | FirstEnergy Corp | | | 1,680 | |
| | 112,280 | | | * | | Fiserv, Inc | | | 6,630 | |
| | 70,407 | | | * | | FleetCor Technologies, Inc | | | 8,250 | |
| | 16,911 | | | | | Flir Systems, Inc | | | 509 | |
| | 75,109 | | | | | Flowserve Corp | | | 5,921 | |
| | 252,982 | | | | | Fluor Corp | | | 20,312 | |
| | 371,452 | | | | | FMC Corp | | | 28,030 | |
| | 46,189 | | | * | | FMC Technologies, Inc | | | 2,412 | |
| | 1,387,253 | | | | | Ford Motor Co | | | 21,405 | |
| | 394,685 | | | * | | Forest Laboratories, Inc | | | 23,693 | |
| | 113,800 | | | | | Fortune Brands Home & Security, Inc | | | 5,201 | |
| | 31,179 | | | * | | Fossil Group, Inc | | | 3,740 | |
| | 45,595 | | | | | Franklin Resources, Inc | | | 2,632 | |
| | 924,815 | | | | | Freeport-McMoRan Copper & Gold, Inc (Class B) | | | 34,903 | |
| | 138,143 | | | e | | Frontier Communications Corp | | | 642 | |
| | 273,724 | | | e | | GameStop Corp (Class A) | | | 13,484 | |
| | 193,890 | | | * | | Gaming and Leisure Properties, Inc | | | 9,852 | |
| | 125,789 | | | | | Gap, Inc | | | 4,916 | |
| | 12,284 | | | e | | Garmin Ltd | | | 568 | |
COLLEGE RETIREMENT EQUITIES FUND - Global Equities Account
| | | | | | | | VALUE | |
| SHARES | | | | | COMPANY | | (000) | |
| | 100,000 | | | | | Generac Holdings, Inc | | $ | 5,664 | |
| | 45,991 | | | | | General Dynamics Corp | | | 4,394 | |
| | 6,061,404 | | | | | General Electric Co | | | 169,901 | |
| | 51,438 | | | | | General Growth Properties, Inc | | | 1,032 | |
| | 103,874 | | | | | General Mills, Inc | | | 5,184 | |
| | 61,921,000 | | | *,e,m | | General Motors Co | | | 0 | ^ |
| | 13,592,224 | | | *,m | | General Motors Co | | | 0 | ^ |
| | 69,850,000 | | | *,m | | General Motors Co | | | 0 | ^ |
| | 4,461,000 | | | *,m | | General Motors Co | | | 0 | ^ |
| | 530,757 | | | *,m | | General Motors Co | | | 0 | ^ |
| | 18,159,000 | | | *,m | | General Motors Co | | | 0 | ^ |
| | 19,417,463 | | | *,m | | General Motors Co | | | 0 | ^ |
| | 18,106,794 | | | *,e,m | | General Motors Co | | | 0 | ^ |
| | 29,845,445 | | | *,m | | General Motors Co | | | 0 | ^ |
| | 26,439,985 | | | *,m | | General Motors Co | | | 0 | ^ |
| | 1,642,697 | | | * | | General Motors Co | | | 67,137 | |
| | 33,190 | | | | | Genuine Parts Co | | | 2,761 | |
| | 1,622,088 | | | * | | Gilead Sciences, Inc | | | 121,900 | |
| | 120,000 | | | | | Global Payments, Inc | | | 7,799 | |
| | 130,900 | | | | | GNC Holdings, Inc | | | 7,651 | |
| | 477,240 | | | | | Goldman Sachs Group, Inc | | | 84,596 | |
| | 381,900 | | | | | Goodyear Tire & Rubber Co | | | 9,108 | |
| | 184,166 | | | * | | Google, Inc (Class A) | | | 206,397 | |
| | 14,696 | | | *,e | | Green Mountain Coffee Roasters, Inc | | | 1,111 | |
| | 29,161 | | | | | H&R Block, Inc | | | 847 | |
| | 1 | | | | | H.B. Fuller Co | | | 0 | ^ |
| | 360,970 | | | | | Halliburton Co | | | 18,319 | |
| | 135,000 | | | | | Hanesbrands, Inc | | | 9,486 | |
| | 72,461 | | | | | Harley-Davidson, Inc | | | 5,017 | |
| | 23,915 | | | | | Harris Corp | | | 1,670 | |
| | 649,106 | | | | | Hartford Financial Services Group, Inc | | | 23,517 | |
| | 177,364 | | | | | Hasbro, Inc | | | 9,757 | |
| | 101,780 | | | * | | HCA Holdings, Inc | | | 4,856 | |
| | 61,684 | | | | | HCP, Inc | | | 2,240 | |
| | 30,786 | | | | | Health Care REIT, Inc | | | 1,649 | |
| | 160,000 | | | * | | Health Net, Inc | | | 4,747 | |
| | 170,000 | | | | | Healthsouth Corp | | | 5,664 | |
| | 49,696 | | | | | Helmerich & Payne, Inc | | | 4,178 | |
| | 18,897 | | | * | | Henry Schein, Inc | | | 2,159 | |
| | 111,206 | | | | | Hershey Co | | | 10,813 | |
| | 756,861 | | | * | | Hertz Global Holdings, Inc | | | 21,661 | |
| | 122,469 | | | | | Hess Corp | | | 10,165 | |
| | 685,973 | | | | | Hewlett-Packard Co | | | 19,194 | |
| | 116,000 | | | | | Hillshire Brands Co | | | 3,879 | |
| | 20,683 | | | | | Holly Corp | | | 1,028 | |
| | 41,812 | | | * | | Hologic, Inc | | | 934 | |
| | 1,363,673 | | | | | Home Depot, Inc | | | 112,285 | |
| | 1,061,991 | | | | | Honeywell International, Inc | | | 97,034 | |
| | 15,607 | | | | | Hormel Foods Corp | | | 705 | |
| | 25,699 | | | * | | Hospira, Inc | | | 1,061 | |
| | 281,553 | | | | | Host Marriott Corp | | | 5,473 | |
| | 80,134 | | | | | Hudson City Bancorp, Inc | | | 756 | |
COLLEGE RETIREMENT EQUITIES FUND - Global Equities Account
| | | | | | | | VALUE | |
| SHARES | | | | | COMPANY | | (000) | |
| | 107,714 | | | | | Humana, Inc | | $ | 11,118 | |
| | 1,016,300 | | | | | Huntington Bancshares, Inc | | | 9,807 | |
| | 135,900 | | | | | IAC/InterActiveCorp | | | 9,335 | |
| | 60,000 | | | | | Icahn Enterprises LP | | | 6,565 | |
| | 6,289 | | | * | | IHS, Inc (Class A) | | | 753 | |
| | 99,180 | | | | | Illinois Tool Works, Inc | | | 8,339 | |
| | 84,722 | | | *,e | | Illumina, Inc | | | 9,372 | |
| | 272,197 | | | | | Ingersoll-Rand plc | | | 16,767 | |
| | 9,385 | | | | | Integrys Energy Group, Inc | | | 511 | |
| | 1,606,763 | | | | | Intel Corp | | | 41,712 | |
| | 13,719 | | | | | IntercontinentalExchange Group, Inc | | | 3,086 | |
| | 291,596 | | | | | International Business Machines Corp | | | 54,695 | |
| | 9,102 | | | | | International Flavors & Fragrances, Inc | | | 783 | |
| | 367,368 | | | | | International Game Technology | | | 6,671 | |
| | 221,146 | | | | | International Paper Co | | | 10,843 | |
| | 162,399 | | | | | Interpublic Group of Cos, Inc | | | 2,874 | |
| | 359,857 | | | | | Intuit, Inc | | | 27,464 | |
| | 14,138 | | | * | | Intuitive Surgical, Inc | | | 5,430 | |
| | 80,473 | | | | | Invesco Ltd | | | 2,929 | |
| | 16,974 | | | | | Iron Mountain, Inc | | | 515 | |
| | 150,000 | | | e | | iShares China Large-Cap ETF | | | 5,752 | |
| | 444,274 | | | e | | iShares MSCI Canada Index Fund | | | 12,955 | |
| | 1,284,436 | | | | | iShares MSCI EAFE Index Fund | | | 86,134 | |
| | 140,000 | | | | | ITT Corp | | | 6,079 | |
| | 28,000 | | | *,e | | ITT Educational Services, Inc | | | 940 | |
| | 10,668 | | | | | J.B. Hunt Transport Services, Inc | | | 825 | |
| | 34,496 | | | | | J.M. Smucker Co | | | 3,574 | |
| | 33,854 | | | * | | Jacobs Engineering Group, Inc | | | 2,132 | |
| | 790,151 | | | * | | Jarden Corp | | | 48,476 | |
| | 70,000 | | | * | | Jazz Pharmaceuticals plc | | | 8,859 | |
| | 453,400 | | | * | | JDS Uniphase Corp | | | 5,885 | |
| | 1,232,714 | | | | | Johnson & Johnson | | | 112,904 | |
| | 173,179 | | | | | Johnson Controls, Inc | | | 8,884 | |
| | 159,237 | | | e | | Joy Global, Inc | | | 9,314 | |
| | 1,591,540 | | | | | JPMorgan Chase & Co | | | 93,073 | |
| | 748,552 | | | * | | Juniper Networks, Inc | | | 16,895 | |
| | 95,439 | | | | | Kansas City Southern Industries, Inc | | | 11,818 | |
| | 15,860 | | | | | KBR, Inc | | | 506 | |
| | 38,713 | | | | | Kellogg Co | | | 2,364 | |
| | 468,347 | | | | | Kennametal, Inc | | | 24,387 | |
| | 195,405 | | | | | Keycorp | | | 2,622 | |
| | 89,029 | | | | | Kimberly-Clark Corp | | | 9,300 | |
| | 56,423 | | | | | Kimco Realty Corp | | | 1,114 | |
| | 12,057 | | | * | | Kinder Morgan Management LLC | | | 912 | |
| | 74,265 | | | | | Kinder Morgan, Inc | | | 2,674 | |
| | 33,089 | | | | | Kla-Tencor Corp | | | 2,133 | |
| | 22,993 | | | | | Kohl’s Corp | | | 1,305 | |
| | 495,449 | | | | | Kraft Foods Group, Inc | | | 26,715 | |
| | 486,524 | | | | | Kroger Co | | | 19,232 | |
| | 102,846 | | | | | L Brands, Inc | | | 6,361 | |
| | 20,579 | | | | | L-3 Communications Holdings, Inc | | | 2,199 | |
| | 9,939 | | | * | | Laboratory Corp of America Holdings | | | 908 | |
COLLEGE RETIREMENT EQUITIES FUND - Global Equities Account
| | | | | | | | VALUE | |
| SHARES | | | | | COMPANY | | (000) | |
| | 457,863 | | | * | | Lam Research Corp | | $ | 24,931 | |
| | 254,140 | | | | | Las Vegas Sands Corp | | | 20,044 | |
| | 95,000 | | | | | Lear Corp | | | 7,692 | |
| | 25,287 | | | e | | Legg Mason, Inc | | | 1,099 | |
| | 16,973 | | | e | | Leggett & Platt, Inc | | | 525 | |
| | 15,356 | | | e | | Leidos Holdings, Inc | | | 714 | |
| | 129,700 | | | | | Lender Processing Services, Inc | | | 4,848 | |
| | 18,534 | | | e | | Lennar Corp (Class A) | | | 733 | |
| | 35,091 | | | | | Leucadia National Corp | | | 994 | |
| | 16,328 | | | * | | Level 3 Communications, Inc | | | 542 | |
| | 130,000 | | | e | | Lexmark International, Inc (Class A) | | | 4,618 | |
| | 55,657 | | | * | | Liberty Interactive Corp | | | 1,634 | |
| | 31,440 | | | * | | Liberty Media Corp | | | 4,604 | |
| | 20,579 | | | | | Liberty Property Trust | | | 697 | |
| | 31,031 | | | * | | Life Technologies Corp | | | 2,352 | |
| | 225,530 | | | | | Lincoln National Corp | | | 11,642 | |
| | 90,256 | | | | | Linear Technology Corp | | | 4,111 | |
| | 40,712 | | | * | | LinkedIn Corp | | | 8,828 | |
| | 200,000 | | | *,e | | Lions Gate Entertainment Corp | | | 6,332 | |
| | 64,140 | | | * | | LKQ Corp | | | 2,110 | |
| | 46,308 | | | | | Lockheed Martin Corp | | | 6,884 | |
| | 45,669 | | | | | Loews Corp | | | 2,203 | |
| | 114,489 | | | | | Lorillard, Inc | | | 5,802 | |
| | 251,320 | | | | | Lowe’s Companies, Inc | | | 12,453 | |
| | 59,804 | | | | | LSI Logic Corp | | | 659 | |
| | 457,378 | | | | | LyondellBasell Industries AF S.C.A | | | 36,718 | |
| | 13,086 | | | e | | M&T Bank Corp | | | 1,523 | |
| | 19,051 | | | | | Macerich Co | | | 1,122 | |
| | 651,167 | | | | | Macy’s, Inc | | | 34,772 | |
| | 1 | | | * | | Madison Square Garden, Inc | | | 0 | ^ |
| | 3,125 | | | * | | Mallinckrodt plc | | | 163 | |
| | 17,129 | | | | | Manpower, Inc | | | 1,471 | |
| | 383,196 | | | | | Marathon Oil Corp | | | 13,527 | |
| | 158,345 | | | | | Marathon Petroleum Corp | | | 14,525 | |
| | 647,155 | | | | | Marriott International, Inc (Class A) | | | 31,944 | |
| | 991,320 | | | | | Marsh & McLennan Cos, Inc | | | 47,940 | |
| | 4,978 | | | | | Martin Marietta Materials, Inc | | | 498 | |
| | 462,975 | | | | | Marvell Technology Group Ltd | | | 6,658 | |
| | 162,856 | | | | | Masco Corp | | | 3,708 | |
| | 120,000 | | | * | | Mastec, Inc | | | 3,926 | |
| | 35,011 | | | | | Mastercard, Inc (Class A) | | | 29,250 | |
| | 38,121 | | | | | Mattel, Inc | | | 1,814 | |
| | 31,573 | | | | | Maxim Integrated Products, Inc | | | 881 | |
| | 26,635 | | | | | McCormick & Co, Inc | | | 1,836 | |
| | 234,485 | | | | | McDonald’s Corp | | | 22,752 | |
| | 42,563 | | | | | McGraw-Hill Cos, Inc | | | 3,328 | |
| | 384,464 | | | | | McKesson Corp | | | 62,052 | |
| | 679 | | | * | | MDC Holdings, Inc | | | 22 | |
| | 36,390 | | | | | MDU Resources Group, Inc | | | 1,112 | |
| | 43,426 | | | | | Mead Johnson Nutrition Co | | | 3,637 | |
| | 37,751 | | | | | MeadWestvaco Corp | | | 1,394 | |
| | 728,740 | | | | | Medtronic, Inc | | | 41,822 | |
COLLEGE RETIREMENT EQUITIES FUND - Global Equities Account
| | | | | | | | VALUE | |
| SHARES | | | | | COMPANY | | (000) | |
| | 190,000 | | | | | Mentor Graphics Corp | | $ | 4,573 | |
| | 680,497 | | | | | Merck & Co, Inc | | | 34,059 | |
| | 903,389 | | | | | Metlife, Inc | | | 48,711 | |
| | 6,367 | | | * | | Mettler-Toledo International, Inc | | | 1,545 | |
| | 43,809 | | | * | | MGM Mirage | | | 1,030 | |
| | 111,252 | | | * | | Michael Kors Holdings Ltd | | | 9,033 | |
| | 21,090 | | | e | | Microchip Technology, Inc | | | 944 | |
| | 342,293 | | | * | | Micron Technology, Inc | | | 7,448 | |
| | 3,819,249 | | | | | Microsoft Corp | | | 142,954 | |
| | 25,259 | | | * | | Mohawk Industries, Inc | | | 3,761 | |
| | 16,264 | | | | | Molson Coors Brewing Co (Class B) | | | 913 | |
| | 507,346 | | | | | Mondelez International, Inc | | | 17,909 | |
| | 250,758 | | | | | Monsanto Co | | | 29,226 | |
| | 58,241 | | | * | | Monster Beverage Corp | | | 3,947 | |
| | 22,310 | | | | | Moody’s Corp | | | 1,751 | |
| | 514,463 | | | | | Morgan Stanley | | | 16,134 | |
| | 33,367 | | | | | Mosaic Co | | | 1,577 | |
| | 36,166 | | | | | Motorola, Inc | | | 2,441 | |
| | 35,807 | | | | | Murphy Oil Corp | | | 2,323 | |
| | 1,750 | | | * | | Murphy USA, Inc | | | 73 | |
| | 493,415 | | | * | | Mylan Laboratories, Inc | | | 21,414 | |
| | 49,680 | | | | | Nabors Industries Ltd | | | 844 | |
| | 25,703 | | | | | Nasdaq Stock Market, Inc | | | 1,023 | |
| | 126,009 | | | | | National Oilwell Varco, Inc | | | 10,021 | |
| | 213,252 | | | | | NetApp, Inc | | | 8,773 | |
| | 17,038 | | | * | | NetFlix, Inc | | | 6,273 | |
| | 16,967 | | | * | | NetSuite, Inc | | | 1,748 | |
| | 100,000 | | | * | | NeuStar, Inc (Class A) | | | 4,986 | |
| | 62,346 | | | e | | New York Community Bancorp, Inc | | | 1,051 | |
| | 781,198 | | | | | Newell Rubbermaid, Inc | | | 25,319 | |
| | 54,931 | | | | | Newmont Mining Corp | | | 1,265 | |
| | 41,496 | | | * | | News Corp | | | 748 | |
| | 499,185 | | | | | NextEra Energy, Inc | | | 42,740 | |
| | 696,069 | | | | | Nielsen Holdings NV | | | 31,943 | |
| | 273,749 | | | | | Nike, Inc (Class B) | | | 21,528 | |
| | 1,582 | | | *,e | | Nimble Storage, Inc | | | 72 | |
| | 131,135 | | | | | NiSource, Inc | | | 4,312 | |
| | 119,772 | | | | | Noble Corp plc | | | 4,488 | |
| | 138,961 | | | | | Noble Energy, Inc | | | 9,465 | |
| | 34,143 | | | | | Nordstrom, Inc | | | 2,110 | |
| | 58,371 | | | | | Norfolk Southern Corp | | | 5,419 | |
| | 108,963 | | | | | Northeast Utilities | | | 4,619 | |
| | 75,618 | | | | | Northern Trust Corp | | | 4,680 | |
| | 129,389 | | | | | Northrop Grumman Corp | | | 14,829 | |
| | 85,570 | | | | | NRG Energy, Inc | | | 2,458 | |
| | 45,000 | | | | | Nu Skin Enterprises, Inc (Class A) | | | 6,220 | |
| | 25,598 | | | *,e | | Nuance Communications, Inc | | | 389 | |
| | 101,009 | | | | | Nucor Corp | | | 5,392 | |
| | 127,949 | | | | | Nvidia Corp | | | 2,050 | |
| | 12,345 | | | * | | NVR, Inc | | | 12,666 | |
| | 42,193 | | | | | Oaktree Capital Group LLC | | | 2,483 | |
| | 637,226 | | | | | Occidental Petroleum Corp | | | 60,600 | |
COLLEGE RETIREMENT EQUITIES FUND - Global Equities Account
| | | | | | | | VALUE | |
| SHARES | | | | | COMPANY | | (000) | |
| | 56,579 | | | | | Oceaneering International, Inc | | $ | 4,463 | |
| | 118,407 | | | * | | Ocwen Financial Corp | | | 6,566 | |
| | 92,088 | | | | | OGE Energy Corp | | | 3,122 | |
| | 123,561 | | | | | Omnicare, Inc | | | 7,458 | |
| | 68,254 | | | | | Omnicom Group, Inc | | | 5,076 | |
| | 121,101 | | | | | Oneok, Inc | | | 7,530 | |
| | 2,414,075 | | | | | Oracle Corp | | | 92,363 | |
| | 37,042 | | | * | | O’Reilly Automotive, Inc | | | 4,768 | |
| | 436,043 | | | * | | Orient-Express Hotels Ltd (Class A) | | | 6,589 | |
| | 130,000 | | | | | Oshkosh Truck Corp | | | 6,549 | |
| | 142,621 | | | * | | Owens Corning, Inc | | | 5,808 | |
| | 37,647 | | | * | | Owens-Illinois, Inc | | | 1,347 | |
| | 55,649 | | | | | Paccar, Inc | | | 3,293 | |
| | 90,000 | | | | | Packaging Corp of America | | | 5,695 | |
| | 17,856 | | | | | Pall Corp | | | 1,524 | |
| | 90,000 | | | * | | Parexel International Corp | | | 4,066 | |
| | 52,315 | | | | | Parker Hannifin Corp | | | 6,730 | |
| | 54,708 | | | | | PartnerRe Ltd | | | 5,768 | |
| | 16,345 | | | | | Patterson Cos, Inc | | | 673 | |
| | 42,756 | | | | | Paychex, Inc | | | 1,947 | |
| | 60,170 | | | | | Peabody Energy Corp | | | 1,175 | |
| | 193,890 | | | * | | Penn National Gaming, Inc | | | 2,778 | |
| | 126,374 | | | | | Pentair Ltd | | | 9,815 | |
| | 53,177 | | | | | People’s United Financial, Inc | | | 804 | |
| | 38,550 | | | e | | Pepco Holdings, Inc | | | 737 | |
| | 928,717 | | | | | PepsiCo, Inc | | | 77,028 | |
| | 55,476 | | | e | | Perrigo Co plc | | | 8,513 | |
| | 50,110 | | | | | Petsmart, Inc | | | 3,646 | |
| | 4,833,385 | | | | | Pfizer, Inc | | | 148,047 | |
| | 48,918 | | | | | PG&E Corp | | | 1,970 | |
| | 12,942 | | | * | | Pharmacyclics, Inc | | | 1,369 | |
| | 773,910 | | | | | Philip Morris International, Inc | | | 67,431 | |
| | 191,425 | | | | | Phillips 66 | | | 14,765 | |
| | 144,010 | | | | | Phillips-Van Heusen Corp | | | 19,588 | |
| | 400,000 | | | * | | Pilgrim’s Pride Corp | | | 6,500 | |
| | 73,011 | | | | | Pinnacle West Capital Corp | | | 3,864 | |
| | 43,548 | | | | | Pioneer Natural Resources Co | | | 8,016 | |
| | 10,800 | | | e | | Pitney Bowes, Inc | | | 252 | |
| | 27,228 | | | | | Plum Creek Timber Co, Inc | | | 1,266 | |
| | 90,296 | | | | | PNC Financial Services Group, Inc | | | 7,005 | |
| | 32,313 | | | | | Polaris Industries, Inc | | | 4,706 | |
| | 75,000 | | | * | | Portfolio Recovery Associates, Inc | | | 3,963 | |
| | 68,270 | | | | | PPG Industries, Inc | | | 12,948 | |
| | 67,614 | | | | | PPL Corp | | | 2,035 | |
| | 87,209 | | | | | Praxair, Inc | | | 11,340 | |
| | 81,311 | | | | | Precision Castparts Corp | | | 21,897 | |
| | 462,817 | | | * | | Premier, Inc | | | 17,013 | |
| | 17,144 | | | * | | Priceline.com, Inc | | | 19,928 | |
| | 116,024 | | | | | Principal Financial Group | | | 5,721 | |
| | 1,333,860 | | | | | Procter & Gamble Co | | | 108,590 | |
| | 61,922 | | | | | Progressive Corp | | | 1,689 | |
| | 173,114 | | | | | Prologis, Inc | | | 6,397 | |
COLLEGE RETIREMENT EQUITIES FUND - Global Equities Account
| | | | | | | | VALUE | |
| SHARES | | | | | COMPANY | | (000) | |
| | 205,608 | | | | | Prudential Financial, Inc | | $ | 18,961 | |
| | 77,317 | | | | | Public Service Enterprise Group, Inc | | | 2,477 | |
| | 58,931 | | | | | Public Storage, Inc | | | 8,870 | |
| | 673,751 | | | | | Pulte Homes, Inc | | | 13,724 | |
| | 656,986 | | | | | Qualcomm, Inc | | | 48,781 | |
| | 23,110 | | | * | | Quanta Services, Inc | | | 729 | |
| | 17,086 | | | e | | Quest Diagnostics, Inc | | | 915 | |
| | 27,499 | | | | | Questar Market Resources, Inc | | | 843 | |
| | 130,000 | | | | | Questcor Pharmaceuticals, Inc | | | 7,079 | |
| | 12,417 | | | *,e | | Rackspace Hosting, Inc | | | 486 | |
| | 6,661 | | | | | Ralph Lauren Corp | | | 1,176 | |
| | 68,727 | | | | | Range Resources Corp | | | 5,794 | |
| | 12,343 | | | | | Raymond James Financial, Inc | | | 644 | |
| | 27,471 | | | | | Rayonier, Inc | | | 1,157 | |
| | 51,637 | | | | | Raytheon Co | | | 4,683 | |
| | 5,344 | | | | | REA Group Ltd | | | 181 | |
| | 639,346 | | | * | | Realogy Holdings Corp | | | 31,628 | |
| | 20,562 | | | e | | Realty Income Corp | | | 768 | |
| | 20,826 | | | * | | Red Hat, Inc | | | 1,167 | |
| | 14,267 | | | | | Regency Centers Corp | | | 661 | |
| | 16,565 | | | * | | Regeneron Pharmaceuticals, Inc | | | 4,559 | |
| | 177,279 | | | | | Regions Financial Corp | | | 1,753 | |
| | 60,000 | | | | | Reliance Steel & Aluminum Co | | | 4,550 | |
| | 10,336 | | | | | RenaissanceRe Holdings Ltd | | | 1,006 | |
| | 53,758 | | | | | Republic Services, Inc | | | 1,785 | |
| | 15,195 | | | e | | Resmed, Inc | | | 715 | |
| | 112,337 | | | | | Reynolds American, Inc | | | 5,616 | |
| | 1,400,000 | | | * | | Rite Aid Corp | | | 7,084 | |
| | 16,433 | | | | | Robert Half International, Inc | | | 690 | |
| | 85,234 | | | | | Rock-Tenn Co (Class A) | | | 8,950 | |
| | 77,287 | | | | | Rockwell Automation, Inc | | | 9,132 | |
| | 198,198 | | | | | Rockwell Collins, Inc | | | 14,651 | |
| | 87,863 | | | | | Roper Industries, Inc | | | 12,185 | |
| | 29,426 | | | | | Ross Stores, Inc | | | 2,205 | |
| | 220,000 | | | * | | Rovi Corp | | | 4,332 | |
| | 20,417 | | | * | | Rowan Cos plc | | | 722 | |
| | 119,645 | | | | | Royal Caribbean Cruises Ltd | | | 5,674 | |
| | 26,217 | | | | | Safeway, Inc | | | 854 | |
| | 494,065 | | | * | | Salesforce.com, Inc | | | 27,267 | |
| | 55,000 | | | * | | Salix Pharmaceuticals Ltd | | | 4,947 | |
| | 181,503 | | | | | SanDisk Corp | | | 12,803 | |
| | 64,700 | | | * | | SBA Communications Corp (Class A) | | | 5,813 | |
| | 20,937 | | | | | SCANA Corp | | | 983 | |
| | 861,127 | | | | | Schlumberger Ltd | | | 77,596 | |
| | 193 | | | | | Science Applications International Corp | | | 6 | |
| | 40,341 | | | | | Scripps Networks Interactive (Class A) | | | 3,486 | |
| | 323,306 | | | | | Seagate Technology, Inc | | | 18,157 | |
| | 166,916 | | | | | Sealed Air Corp | | | 5,683 | |
| | 4,757 | | | *,e | | Sears Holdings Corp | | | 233 | |
| | 31,298 | | | | | SEI Investments Co | | | 1,087 | |
| | 316,498 | | | | | Sempra Energy | | | 28,409 | |
| | 14,717 | | | * | | Sensata Technologies Holding BV | | | 571 | |
COLLEGE RETIREMENT EQUITIES FUND - Global Equities Account
| | | | | | | | VALUE | |
| SHARES | | | | | COMPANY | | (000) | |
| | 400,000 | | | | | Service Corp International | | $ | 7,252 | |
| | 13,304 | | | * | | ServiceNow, Inc | | | 745 | |
| | 28,298 | | | | | Sherwin-Williams Co | | | 5,193 | |
| | 13,300 | | | | | Sigma-Aldrich Corp | | | 1,250 | |
| | 31,586 | | | | | Silgan Holdings, Inc | | | 1,517 | |
| | 251,783 | | | | | Simon Property Group, Inc | | | 38,311 | |
| | 338,734 | | | *,e | | Sirius XM Holdings, Inc | | | 1,182 | |
| | 19,607 | | | | | SL Green Realty Corp | | | 1,811 | |
| | 96,001 | | | | | SLM Corp | | | 2,523 | |
| | 164,479 | | | | | Southern Co | | | 6,762 | |
| | 42,171 | | | | | Southwest Airlines Co | | | 795 | |
| | 55,665 | | | * | | Southwestern Energy Co | | | 2,189 | |
| | 111,633 | | | | | SPDR Trust Series 1 | | | 20,615 | |
| | 410,100 | | | | | Spectra Energy Corp | | | 14,608 | |
| | 120,000 | | | * | | Spirit Airlines, Inc | | | 5,449 | |
| | 188,303 | | | * | | Sprint Corp | | | 2,024 | |
| | 4,281 | | | | | SPX Corp | | | 426 | |
| | 80,366 | | | | | St. Jude Medical, Inc | | | 4,979 | |
| | 282,430 | | | | | Stanley Works | | | 22,789 | |
| | 177,172 | | | | | Staples, Inc | | | 2,815 | |
| | 337,921 | | | | | Starbucks Corp | | | 26,490 | |
| | 134,405 | | | | | Starwood Hotels & Resorts Worldwide, Inc | | | 10,678 | |
| | 120,000 | | | | | Starwood Property Trust, Inc | | | 3,324 | |
| | 642,523 | | | | | State Street Corp | | | 47,155 | |
| | 79,799 | | | * | | Stericycle, Inc | | | 9,270 | |
| | 105,143 | | | * | | Stratasys Ltd | | | 14,163 | |
| | 58,739 | | | | | Stryker Corp | | | 4,414 | |
| | 57,381 | | | | | SunTrust Banks, Inc | | | 2,112 | |
| | 19,601 | | | * | | Superior Energy Services | | | 522 | |
| | 250,000 | | | *,e | | Swift Transportation Co, Inc | | | 5,553 | |
| | 668,052 | | | | | Symantec Corp | | | 15,753 | |
| | 17,932 | | | * | | Synopsys, Inc | | | 728 | |
| | 222,157 | | | | | Synovus Financial Corp | | | 800 | |
| | 65,355 | | | | | Sysco Corp | | | 2,359 | |
| | 350,442 | | | | | T Rowe Price Group, Inc | | | 29,357 | |
| | 102,666 | | | | | Target Corp | | | 6,496 | |
| | 812,884 | | | | | TCF Financial Corp | | | 13,209 | |
| | 49,313 | | | | | TD Ameritrade Holding Corp | | | 1,511 | |
| | 100,000 | | | * | | Tenneco, Inc | | | 5,657 | |
| | 22,664 | | | * | | Teradata Corp | | | 1,031 | |
| | 29,895 | | | *,e | | Tesla Motors, Inc | | | 4,496 | |
| | 60,007 | | | | | Tesoro Corp | | | 3,510 | |
| | 234,150 | | | | | Texas Instruments, Inc | | | 10,282 | |
| | 84,789 | | | | | Textron, Inc | | | 3,117 | |
| | 117,818 | | | | | Thermo Electron Corp | | | 13,119 | |
| | 16,155 | | | | | Tiffany & Co | | | 1,499 | |
| | 355,114 | | | | | Time Warner Cable, Inc | | | 48,118 | |
| | 488,613 | | | | | Time Warner, Inc | | | 34,066 | |
| | 242,246 | | | | | TJX Companies, Inc | | | 15,438 | |
| | 215,108 | | | * | | T-Mobile US, Inc | | | 7,236 | |
| | 16,754 | | | * | | Toll Brothers, Inc | | | 620 | |
| | 53,313 | | | | | Torchmark Corp | | | 4,166 | |
COLLEGE RETIREMENT EQUITIES FUND - Global Equities Account
| | | | | | | | VALUE | |
| SHARES | | | | | COMPANY | | (000) | |
| | 35,495 | | | | | Total System Services, Inc | | $ | 1,181 | |
| | 7,065 | | | * | | Towers Watson & Co | | | 902 | |
| | 107,179 | | | | | Tractor Supply Co | | | 8,315 | |
| | 5,670 | | | | | TransDigm Group, Inc | | | 913 | |
| | 18,949 | | | | | Transocean Ltd | | | 927 | |
| | 55,000 | | | e | | Transocean Ltd (NYSE) | | | 2,718 | |
| | 56,282 | | | | | Travelers Cos, Inc | | | 5,096 | |
| | 193,395 | | | *,e | | TRI Pointe Homes, Inc | | | 3,854 | |
| | 62,500 | | | * | | Tribune Co | | | 4,838 | |
| | 29,627 | | | * | | Trimble Navigation Ltd | | | 1,028 | |
| | 120,000 | | | | | Trinity Industries, Inc | | | 6,542 | |
| | 45,728 | | | * | | TripAdvisor, Inc | | | 3,788 | |
| | 116,866 | | | * | | TRW Automotive Holdings Corp | | | 8,694 | |
| | 271,465 | | | * | | Tumi Holdings, Inc | | | 6,122 | |
| | 75,211 | | | | | Tupperware Corp | | | 7,110 | |
| | 490,714 | | | | | Twenty-First Century Fox, Inc | | | 17,263 | |
| | 47,019 | | | | | Twenty-First Century Fox, Inc (Class B) | | | 1,627 | |
| | 34,612 | | | *,e | | Twitter, Inc | | | 2,203 | |
| | 471,725 | | | | | Tyco International Ltd | | | 19,360 | |
| | 311,820 | | | | | Tyson Foods, Inc (Class A) | | | 10,433 | |
| | 19,924 | | | * | | UAL Corp | | | 754 | |
| | 29,335 | | | | | UDR, Inc | | | 685 | |
| | 28,070 | | | * | | Ulta Salon Cosmetics & Fragrance, Inc | | | 2,709 | |
| | 7,700 | | | *,e | | Ultra Petroleum Corp | | | 167 | |
| | 9,051 | | | * | | Under Armour, Inc (Class A) | | | 790 | |
| | 470,883 | | | | | Union Pacific Corp | | | 79,108 | |
| | 170,883 | | | | | United Parcel Service, Inc (Class B) | | | 17,956 | |
| | 423,056 | | | | | United Technologies Corp | | | 48,144 | |
| | 626,750 | | | | | UnitedHealth Group, Inc | | | 47,194 | |
| | 18,719 | | | | | Universal Health Services, Inc (Class B) | | | 1,521 | |
| | 59,599 | | | | | UnumProvident Corp | | | 2,091 | |
| | 15,392 | | | * | | Urban Outfitters, Inc | | | 571 | |
| | 40,000 | | | | | URS Corp | | | 2,120 | |
| | 390,877 | | | | | US Bancorp | | | 15,791 | |
| | 658,101 | | | *,e | | USG Corp | | | 18,677 | |
| | 645,429 | | | | | Valero Energy Corp | | | 32,530 | |
| | 128,980 | | | | | Validus Holdings Ltd | | | 5,197 | |
| | 13,335 | | | * | | Vantiv, Inc | | | 435 | |
| | 11,866 | | | * | | Varian Medical Systems, Inc | | | 922 | |
| | 2,748 | | | *,e | | Veeva Systems, Inc | | | 88 | |
| | 123,222 | | | | | Ventas, Inc | | | 7,058 | |
| | 90,000 | | | * | | Verint Systems, Inc | | | 3,865 | |
| | 16,685 | | | *,e | | VeriSign, Inc | | | 997 | |
| | 459,697 | | | * | | Verisk Analytics, Inc | | | 30,211 | |
| | 1,892,737 | | | | | Verizon Communications, Inc | | | 93,009 | |
| | 26,019 | | | * | | Vertex Pharmaceuticals, Inc | | | 1,933 | |
| | 201,324 | | | | | VF Corp | | | 12,551 | |
| | 675,907 | | | | | Viacom, Inc (Class B) | | | 59,034 | |
| | 478,145 | | | | | Visa, Inc (Class A) | | | 106,473 | |
| | 200,000 | | | * | | Vishay Intertechnology, Inc | | | 2,652 | |
| | 70,000 | | | * | | Visteon Corp | | | 5,732 | |
| | 80,348 | | | * | | VMware, Inc (Class A) | | | 7,208 | |
COLLEGE RETIREMENT EQUITIES FUND - Global Equities Account
| | | | | | | | VALUE | |
| SHARES | | | | | COMPANY | | (000) | |
| | 24,838 | | | | | Vornado Realty Trust | | $ | 2,205 | |
| | 13,824 | | | | | Vulcan Materials Co | | | 821 | |
| | 62,626 | | | | | W.R. Berkley Corp | | | 2,717 | |
| | 19,559 | | | | | W.W. Grainger, Inc | | | 4,996 | |
| | 158,892 | | | | | Walgreen Co | | | 9,127 | |
| | 400,127 | | | | | Wal-Mart Stores, Inc | | | 31,486 | |
| | 1,154,441 | | | * | | Walt Disney Co | | | 88,199 | |
| | 163,800 | | | e | | Walter Energy, Inc | | | 2,724 | |
| | 49,250 | | | | | Waste Management, Inc | | | 2,210 | |
| | 9,242 | | | * | | Waters Corp | | | 924 | |
| | 1,025,990 | | | * | | Weatherford International Ltd | | | 15,893 | |
| | 27,899 | | | * | | WellCare Health Plans, Inc | | | 1,965 | |
| | 211,234 | | | | | WellPoint, Inc | | | 19,516 | |
| | 4,117,630 | | | | | Wells Fargo & Co | | | 186,940 | |
| | 105,458 | | | | | Western Digital Corp | | | 8,848 | |
| | 159,141 | | | | | Western Union Co | | | 2,745 | |
| | 50,000 | | | | | Westlake Chemical Corp | | | 6,104 | |
| | 61,748 | | | | | Weyerhaeuser Co | | | 1,949 | |
| | 92,190 | | | | | Whirlpool Corp | | | 14,461 | |
| | 25,008 | | | * | | Whiting Petroleum Corp | | | 1,547 | |
| | 151,777 | | | | | Whole Foods Market, Inc | | | 8,777 | |
| | 281,193 | | | | | Williams Cos, Inc | | | 10,846 | |
| | 18,267 | | | | | Willis Group Holdings plc | | | 819 | |
| | 62,168 | | | e | | Windstream Holdings, Inc | | | 496 | |
| | 102,904 | | | | | Wisconsin Energy Corp | | | 4,254 | |
| | 150,000 | | | e | | WisdomTree Japan Hedged Equity Fund | | | 7,626 | |
| | 100,000 | | | | | Wolverine World Wide, Inc | | | 3,396 | |
| | 46,440 | | | * | | Workday, Inc | | | 3,862 | |
| | 50,000 | | | * | | WR Grace & Co | | | 4,943 | |
| | 64,798 | | | | | Wyndham Worldwide Corp | | | 4,775 | |
| | 13,149 | | | | | Wynn Resorts Ltd | | | 2,554 | |
| | 108,053 | | | | | Xcel Energy, Inc | | | 3,019 | |
| | 1,143,911 | | | | | Xerox Corp | | | 13,921 | |
| | 29,676 | | | | | Xilinx, Inc | | | 1,363 | |
| | 28,035 | | | | | Xylem, Inc | | | 970 | |
| | 972,087 | | | * | | Yahoo!, Inc | | | 39,311 | |
| | 151,842 | | | | | Yum! Brands, Inc | | | 11,481 | |
| | 51,828 | | | | | Zimmer Holdings, Inc | | | 4,830 | |
| | 659,037 | | | | | Zoetis Inc | | | 21,544 | |
| | 3,167 | | | *,e | | zulily, Inc | | | 131 | |
| | 650,000 | | | * | | Zynga, Inc | | | 2,470 | |
| | | | | | | TOTAL UNITED STATES | | | 10,079,877 | |
| | | | | | | | | | | |
| | | | | | | TOTAL COMMON STOCKS | | | 18,880,493 | |
| | | | | | | (Cost $14,987,646) | | | | |
| | | | | | | | | | | |
| RIGHTS / WARRANTS - 0.0% | | | | |
| | | | | |
| CANADA - 0.0% | | | | |
| | 215,640 | | | | | Turquoise Hill Resources Ltd | | | 203 | |
| | | | | | | TOTAL CANADA | | | 203 | |
| | | | | | | | | | | |
| SINGAPORE - 0.0% | | | | |
| | 14,354 | | | | | Olam International Ltd | | | 4 | |
| | | | | | | TOTAL SINGAPORE | | | 4 | |
COLLEGE RETIREMENT EQUITIES FUND - Global Equities Account
| | | | | | | | | | | MATURITY | | VALUE | |
| SHARES | | | | | COMPANY | | RATES | | DATE | | (000) | |
| SPAIN - 0.0% | | | | | | | | | |
| | 721,127 | | | | | Repsol S.A. | | | | | | | $ | 492 | |
| | | | | | | TOTAL SPAIN | | | | | | | | 492 | |
| | | | | | | | | | | | | | | | |
| UNITED STATES - 0.0% | | | | | | | | | |
| | 21,280 | | | | | Kinder Morgan, Inc | | | | | | | | 86 | |
| | | | | | | TOTAL UNITED STATES | | | | | | | | 86 | |
| | | | | | | | | | | | | | | | |
| | | | | | | TOTAL RIGHTS / WARRANTS | | | | | | | | 785 | |
| | | | | | | (Cost $841) | | | | | | | | | |
| | | | | | | | | | | | | | | | |
| | | | | | | | | | | | | | | | |
| PRINCIPAL | | | | | ISSUER | | | | | | | | | |
| SHORT-TERM INVESTMENTS - 3.4% | | | | | | | | | |
| | | | | | | | | | |
| GOVERNMENT AGENCY DEBT - 0.1% | | | | | | | | | |
| | | | | | | Federal Home Loan Bank (FHLB) | | | | | | | | | |
| $ | 10,000,000 | | | | | FHLB | | 0.065 | % | | 02/26/14 | | | 9,999 | |
| | 10,000,000 | | | | | Federal Home Loan Bank (FHLB) | | 0.090 | | | 03/14/14 | | | 9,999 | |
| | | | | | | TOTAL GOVERNMENT AGENCY DEBT | | | | | | | | 19,998 | |
| | | | | | | | | | | | | | | | |
| TREASURY DEBT - 1.1% | | | | | | | | | |
| | 2,800,000 | | | | | United States Treasury Bill | | 0.051 | | | 02/06/14 | | | 2,800 | |
| | 1,900,000 | | | | | United States Treasury Bill | | 0.071 | | | 02/20/14 | | | 1,900 | |
| | 2,100,000 | | | | | United States Treasury Bill | | 0.056 | | | 02/27/14 | | | 2,100 | |
| | 58,300,000 | | | d | | United States Treasury Bill | | 0.076-0.081 | | | 03/06/14 | | | 58,295 | |
| | 30,650,000 | | | | | United States Treasury Bill | | 0.053-0.066 | | | 03/13/14 | | | 30,647 | |
| | 4,400,000 | | | | | United States Treasury Bill | | 0.071 | | | 04/03/14 | | | 4,399 | |
| | 13,400,000 | | | | | United States Treasury Bill | | 0.075 | | | 04/10/14 | | | 13,398 | |
| | 10,800,000 | | | | | United States Treasury Bill | | 0.060-0.063 | | | 04/17/14 | | | 10,799 | |
| | 58,000,000 | | | d | | United States Treasury Bill | | 0.065-0.077 | | | 04/24/14 | | | 57,989 | |
| | 5,000,000 | | | | | United States Treasury Bill | | 0.088 | | | 05/29/14 | | | 4,999 | |
| | 9,500,000 | | | d | | United States Treasury Bill | | 0.098 | | | 06/26/14 | | | 9,496 | |
| | 14,000,000 | | | d | | United States Treasury Bill | | 0.095-0.103 | | | 08/21/14 | | | 13,994 | |
| | | | | | | TOTAL TREASURY DEBT | | | | | | | | 210,816 | |
| | | | | | | | | | | | | | | | |
| INVESTMENT OF CASH COLLATERAL FOR SECURITIES LOANED - 2.2% | | | | | |
| | | | | | | | | | | | | | |
| REPURCHASE AGREEMENT - 1.7% | | | | | | | | | |
| | 50,000,000 | | | n | | BNP | | 0.005 | | | 01/02/14 | | | 50,000 | |
| | 142,000,000 | | | o | | Calyon | | 0.020 | | | 01/02/14 | | | 142,000 | |
| | 49,000,000 | | | p | | Royal Bank of Scotland | | 0.010 | | | 01/02/14 | | | 49,000 | |
| | 79,000,000 | | | q | | Societe Generale | | 0.010 | | | 01/02/14 | | | 79,000 | |
| | | | | | | TOTAL REPURCHASE AGREEMENT | | | | | | | | 320,000 | |
| | | | | | | | | | | | | | | | |
| VARIABLE RATE SECURITIES - 0.5% | | | | | | | | | |
| | 25,000,000 | | | i | | CIBC Bank and Trust Co | | 0.010 | | | 01/02/14 | | | 25,000 | |
| | 1,803,610 | | | i | | Granite Master Issuer plc 2006 | | 0.367 | | | 12/20/50 | | | 1,783 | |
| | 1,545,952 | | | i | | Granite Master Issuer plc 2007 | | 0.367 | | | 12/20/50 | | | 1,529 | |
| | 941,476 | | | i | | Medallion Trust 2005 | | 0.278 | | | 08/22/36 | | | 938 | |
| | 471,212 | | | i | | Nelnet Student Loan Trust 2007 | | 0.496 | | | 09/25/18 | | | 471 | |
COLLEGE RETIREMENT EQUITIES FUND - Global Equities Account
| | | | | | | | | | | MATURITY | | VALUE | |
| PRINCIPAL | | | | | ISSUER | | RATE | | DATE | | (000) | |
| $ | 1,535,490 | | | i | | Puma Finance Ltd | | 0.379 | % | | 02/21/38 | | $ | 1,521 | |
| | 24,000,000 | | | i | | Royal Bank of Canada Trust Co | | 0.010 | | | 01/02/14 | | | 24,000 | |
| | 30,000,000 | | | i | | SLM Student Loan Trust 2007 | | 0.278 | | | 01/25/19 | | | 29,562 | |
| | 3,388,795 | | | i | | SLM Student Loan Trust 2008 | | 0.588 | | | 10/25/16 | | | 3,388 | |
| | | | | | | TOTAL VARIABLE RATE SECURITIES | | | | | | | | 88,192 | |
| | | | | | | | | | | | | | | | |
| | | | | | | TOTAL INVESTMENT OF CASH COLLATERAL FOR SECURITIES LOANED | | | 408,192 | |
| | | | | | | | | | | | | | | | |
| | | | | | | TOTAL SHORT-TERM INVESTMENTS | | | | | | | | 639,006 | |
| | | | | | | (Cost $639,334) | | | | | | | | | |
| | | | | | | TOTAL INVESTMENTS - 102.1% | | | | | | | | 19,520,284 | |
| | | | | | | (Cost $15,627,821) | | | | | | | | | |
| | | | | | | OTHER ASSETS & LIABILITIES, NET - (2.1)% | | | | | | | | (392,565 | ) |
| | | | | | | NET ASSETS - 100.0% | | | | | | | $ | 19,127,719 | |
| | | | | | | | |
| | | | | | | Abbreviation(s): |
| | ADR | | | | | American Depositary Receipt |
| | ETF | | | | | Exchange Traded Fund |
| | GDR | | | | | Global Depositary Receipt |
| | REIT | | | | | Real Estate Investment Trust |
| | SPDR | | | | | Standard & Poor’s Depository Receipts |
| | * | | | | | Non-income producing. |
| | ^ | | | | | Amount represents less than $1,000. |
| | d | | | | | All or a portion of these securities have been segregated by the custodian to cover margin or other requirements on open futures transactions. |
| | e | | | | | All or a portion of these securities are out on loan. The aggregate value of securities on loan is $498,279,000. |
| | i | | | | | Floating or variable rate security. Coupon rate reflects the rate at period end. |
| | m | | | | | Indicates a security that has been deemed illiquid. |
| | n | | | | | Agreement with BNP, 0.01% dated 12/31/13 to be repurchased at $50,000,000 on 1/2/14, collateralized by U.S. Government Agency Securities valued at $51,000,000. |
| | o | | | | | Agreement with Calyon, 0.02% dated 12/31/13 to be repurchased at $142,000,000 on 1/2/14, collateralized by U.S. Government Agency Securities valued at $144,840,000. |
| | p | | | | | Agreement with Royal Bank of Scotland 0.01% dated 12/31/13 to be repurchased at $49,001,000 on 1/2/14, collateralized by U.S. Government Agency Securities valued at $49,981,000. |
| | q | | | | | Agreement with Societe Generale, 0.01% dated 12/31/13 to be repurchased at $79,000,000 on 1/2/14, collateralized by U.S. Government Agency Securities valued at $80,580,000. |
| | | | | | | |
| | | | | | | Cost amounts are in thousands. |
COLLEGE RETIREMENT EQUITIES FUND
GLOBAL EQUITIES ACCOUNT
SUMMARY OF MARKET VALUES BY SECTOR
December 31, 2013
| | | VALUE | | | % OF | |
| SECTOR | | (000) | | | NET ASSETS | |
| FINANCIALS | | $ | 3,888,816 | | | | 20.4 | % |
| CONSUMER DISCRETIONARY | | | 3,113,034 | | | | 16.3 | |
| INFORMATION TECHNOLOGY | | | 2,509,440 | | | | 13.1 | |
| INDUSTRIALS | | | 2,494,584 | | | | 13.0 | |
| HEALTH CARE | | | 2,300,075 | | | | 12.0 | |
| CONSUMER STAPLES | | | 1,398,289 | | | | 7.3 | |
| ENERGY | | | 1,386,284 | | | | 7.3 | |
| MATERIALS | | | 906,980 | | | | 4.7 | |
| TELECOMMUNICATION SERVICES | | | 479,220 | | | | 2.5 | |
| UTILITIES | | | 404,556 | | | | 2.1 | |
| SHORT - TERM INVESTMENTS | | | 639,006 | | | | 3.4 | |
| OTHER ASSETS & LIABILITIES, NET | | | (392,565 | ) | | | (2.1 | ) |
| | | | | | | | | |
| NET ASSETS | | $ | 19,127,719 | | | | 100.0 | % |
COLLEGE RETIREMENT EQUITIES FUND - Growth Account
COLLEGE RETIREMENT EQUITIES FUND
GROWTH ACCOUNT
SCHEDULE OF INVESTMENTS
December 31, 2013
| SHARES | | | | | COMPANY | | VALUE
(000) | |
| COMMON STOCKS - 99.0% | | | | |
| | | | | | | | | | | |
| AUTOMOBILES & COMPONENTS - 2.7% | | | | |
| | 2,380 | | | | | Allison Transmission Holdings, Inc | | $ | 66 | |
| | 554,508 | | | | | BorgWarner, Inc | | | 31,003 | |
| | 362,600 | | | | | Dana Holding Corp | | | 7,114 | |
| | 1,336,166 | | | | | Delphi Automotive plc | | | 80,344 | |
| | 2,298,955 | | | | | Ford Motor Co | | | 35,473 | |
| | 2,700,333 | | | * | | General Motors Co | | | 110,362 | |
| | 598,695 | | | | | Gentex Corp | | | 19,751 | |
| | 1,112,865 | | | | | Goodyear Tire & Rubber Co | | | 26,542 | |
| | 307,147 | | | | | Harley-Davidson, Inc | | | 21,267 | |
| | 101,800 | | | | | Icahn Enterprises LP | | | 11,138 | |
| | 586,590 | | | | | Lear Corp | | | 47,496 | |
| | 220,400 | | | | | Magna International, Inc - Class A (NY) | | | 18,086 | |
| | 110,000 | | | | | Renault S.A. | | | 8,852 | |
| | 309,600 | | | * | | Tenneco, Inc | | | 17,514 | |
| | 251,513 | | | *,e | | Tesla Motors, Inc | | | 37,822 | |
| | 22,290 | | | | | Thor Industries, Inc | | | 1,231 | |
| | 158,700 | | | | | Toyota Motor Corp | | | 9,677 | |
| | 198,500 | | | * | | TRW Automotive Holdings Corp | | | 14,766 | |
| | 203,941 | | | * | | Visteon Corp | | | 16,701 | |
| | | | | | | TOTAL AUTOMOBILES & COMPONENTS | | | 515,205 | |
| | | | | | | | | | | |
| BANKS - 0.3% | | | | |
| | 1,606,300 | | | | | Huntington Bancshares, Inc | | | 15,501 | |
| | 255,600 | | | *,e | | Nationstar Mortgage Holdings, Inc | | | 9,447 | |
| | 50,147 | | | * | | Ocwen Financial Corp | | | 2,781 | |
| | 2,339 | | | * | | Signature Bank | | | 251 | |
| | 548,500 | | | | | Wells Fargo & Co | | | 24,902 | |
| | | | | | | TOTAL BANKS | | | 52,882 | |
| | | | | | | | | | | |
| CAPITAL GOODS - 7.3% | | | | |
| | 522,935 | | | | | 3M Co | | | 73,342 | |
| | 16,536 | | | | | A.O. Smith Corp | | | 892 | |
| | 403,270 | | | * | | Aecom Technology Corp | | | 11,868 | |
| | 161,557 | | | * | | Allegion plc | | | 7,139 | |
| | 37,000 | | | | | Alliant Techsystems, Inc | | | 4,502 | |
| | 118,077 | | | | | Ametek, Inc | | | 6,219 | |
| | 11,593 | | | * | | Armstrong World Industries, Inc | | | 668 | |
| | 142,946 | | | | | Babcock & Wilcox Co | | | 4,887 | |
COLLEGE RETIREMENT EQUITIES FUND - Growth Account
| SHARES | | | | | COMPANY | | VALUE
(000) | |
| | 45,253 | | | * | | BE Aerospace, Inc | | $ | 3,938 | |
| | 1,761,298 | | | | | Boeing Co | | | 240,400 | |
| | 63,846 | | | | | Carlisle Cos, Inc | | | 5,069 | |
| | 57,224 | | | | | Caterpillar, Inc | | | 5,197 | |
| | 118,944 | | | | | Chicago Bridge & Iron Co NV | | | 9,889 | |
| | 42,601 | | | * | | Colfax Corp | | | 2,713 | |
| | 150,631 | | | | | Crane Co | | | 10,130 | |
| | 353,722 | | | | | Cummins, Inc | | | 49,864 | |
| | 59,761 | | | | | Danaher Corp | | | 4,614 | |
| | 187,991 | | | | | Deere & Co | | | 17,169 | |
| | 66,230 | | | | | Donaldson Co, Inc | | | 2,878 | |
| | 62,215 | | | | | Dover Corp | | | 6,006 | |
| | 260,779 | | | | | Emerson Electric Co | | | 18,301 | |
| | 170,000 | | | | | European Aeronautic Defence and Space Co | | | 13,051 | |
| | 143,245 | | | | | Fastenal Co | | | 6,806 | |
| | 112,253 | | | | | Flowserve Corp | | | 8,849 | |
| | 228,437 | | | | | Fluor Corp | | | 18,341 | |
| | 517,341 | | | | | Fortune Brands Home & Security, Inc | | | 23,642 | |
| | 94,200 | | | | | General Dynamics Corp | | | 9,001 | |
| | 848,270 | | | | | General Electric Co | | | 23,777 | |
| | 29,878 | | | | | Graco, Inc | | | 2,334 | |
| | 18,940 | | | * | | HD Supply Holdings, Inc | | | 455 | |
| | 107,518 | | | * | | Hexcel Corp | | | 4,805 | |
| | 1,243,074 | | | | | Honeywell International, Inc | | | 113,580 | |
| | 80,621 | | | | | Hubbell, Inc (Class B) | | | 8,780 | |
| | 189,685 | | | | | Huntington Ingalls | | | 17,074 | |
| | 37,075 | | | | | IDEX Corp | | | 2,738 | |
| | 68,031 | | | | | Illinois Tool Works, Inc | | | 5,720 | |
| | 484,673 | | | | | Ingersoll-Rand plc | | | 29,856 | |
| | 45,001 | | | | | ITT Corp | | | 1,954 | |
| | 264,934 | | | e | | Joy Global, Inc | | | 15,496 | |
| | 43,000 | | | | | L-3 Communications Holdings, Inc | | | 4,595 | |
| | 107,705 | | | | | Lennox International, Inc | | | 9,161 | |
| | 335,708 | | | | | Lincoln Electric Holdings, Inc | | | 23,949 | |
| | 211,877 | | | | | Lockheed Martin Corp | | | 31,498 | |
| | 60,739 | | | | | Manitowoc Co, Inc | | | 1,416 | |
| | 789,193 | | | | | Masco Corp | | | 17,970 | |
| | 147,343 | | | * | | MRC Global, Inc | | | 4,753 | |
| | 70,361 | | | | | MSC Industrial Direct Co (Class A) | | | 5,690 | |
| | 3,700 | | | *,e | | Navistar International Corp | | | 141 | |
| | 30,540 | | | | | Nordson Corp | | | 2,269 | |
| | 39,500 | | | | | Northrop Grumman Corp | | | 4,527 | |
| | 203,300 | | | | | Oshkosh Truck Corp | | | 10,242 | |
| | 22,107 | | | | | Paccar, Inc | | | 1,308 | |
| | 193,238 | | | | | Pall Corp | | | 16,493 | |
| | 420,941 | | | | | Precision Castparts Corp | | | 113,359 | |
| | 22,133 | | | * | | Quanta Services, Inc | | | 699 | |
| | 198,828 | | | | | Rockwell Automation, Inc | | | 23,494 | |
COLLEGE RETIREMENT EQUITIES FUND - Growth Account
| SHARES | | | | | COMPANY | | VALUE
(000) | |
| | 58,155 | | | | | Rockwell Collins, Inc | | $ | 4,299 | |
| | 396,329 | | | | | Roper Industries, Inc | | | 54,963 | |
| | 215,000 | | | | | Safran S.A. | | | 14,949 | |
| | 75,173 | | | | | Snap-On, Inc | | | 8,233 | |
| | 11,353 | | | * | | SolarCity Corp | | | 645 | |
| | 140,641 | | | * | | Spirit Aerosystems Holdings, Inc (Class A) | | | 4,793 | |
| | 6,834 | | | | | Stanley Works | | | 551 | |
| | 670,200 | | | | | Textron, Inc | | | 24,637 | |
| | 78,658 | | | | | Toro Co | | | 5,003 | |
| | 25,333 | | | | | TransDigm Group, Inc | | | 4,079 | |
| | 196,400 | | | | | Trinity Industries, Inc | | | 10,708 | |
| | 79,708 | | | | | Triumph Group, Inc | | | 6,063 | |
| | 45,319 | | | *,e | | United Rentals, Inc | | | 3,533 | |
| | 563,902 | | | | | United Technologies Corp | | | 64,172 | |
| | 113,600 | | | | | URS Corp | | | 6,020 | |
| | 318,600 | | | *,e | | USG Corp | | | 9,042 | |
| | 67,912 | | | e | | Valmont Industries, Inc | | | 10,127 | |
| | 422,917 | | | | | W.W. Grainger, Inc | | | 108,021 | |
| | 120,905 | | | * | | WABCO Holdings, Inc | | | 11,294 | |
| | 46,798 | | | | | Westinghouse Air Brake Technologies Corp | | | 3,476 | |
| | 5,678 | | | | | Xylem, Inc | | | 196 | |
| | | | | | | TOTAL CAPITAL GOODS | | | 1,418,312 | |
| | | | | | | | | | | |
| COMMERCIAL & PROFESSIONAL SERVICES - 1.5% | | | | |
| | 128,000 | | | e | | ADT Corp | | | 5,180 | |
| | 12,564 | | | | | Cintas Corp | | | 749 | |
| | 28,438 | | | * | | Clean Harbors, Inc | | | 1,705 | |
| | 649,228 | | | * | | CNH Industrial NV (NYSE) | | | 7,369 | |
| | 53,345 | | | * | | Copart, Inc | | | 1,955 | |
| | 35,738 | | | | | Corrections Corp of America | | | 1,146 | |
| | 18,244 | | | | | Dun & Bradstreet Corp | | | 2,239 | |
| | 160,224 | | | | | Equifax, Inc | | | 11,070 | |
| | 31,779 | | | * | | IHS, Inc (Class A) | | | 3,804 | |
| | 73,866 | | | | | Iron Mountain, Inc | | | 2,242 | |
| | 13,595 | | | | | KAR Auction Services, Inc | | | 402 | |
| | 118,700 | | | | | Manpower, Inc | | | 10,192 | |
| | 1,941,551 | | | | | Nielsen Holdings NV | | | 89,098 | |
| | 353,419 | | | e | | Pitney Bowes, Inc | | | 8,235 | |
| | 48,657 | | | e | | R.R. Donnelley & Sons Co | | | 987 | |
| | 67,683 | | | | | Robert Half International, Inc | | | 2,842 | |
| | 30,863 | | | | | Rollins, Inc | | | 935 | |
| | 376,193 | | | * | | Stericycle, Inc | | | 43,702 | |
| | 256,000 | | | | | Tyco International Ltd | | | 10,506 | |
| | 1,231,226 | | | * | | Verisk Analytics, Inc | | | 80,916 | |
| | 56,164 | | | | | Waste Connections, Inc | | | 2,450 | |
| | 18,902 | | | | | Waste Management, Inc | | | 848 | |
| | | | | | | TOTAL COMMERCIAL & PROFESSIONAL SERVICES | | | 288,572 | |
COLLEGE RETIREMENT EQUITIES FUND - Growth Account
| SHARES | | | | | COMPANY | | VALUE
(000) | |
| CONSUMER DURABLES & APPAREL - 2.8% | | | | |
| | 28,392 | | | | | Carter’s, Inc | | $ | 2,038 | |
| | 257,134 | | | | | Coach, Inc | | | 14,433 | |
| | 5,784 | | | *,e | | Deckers Outdoor Corp | | | 489 | |
| | 212,887 | | | * | | Fossil Group, Inc | | | 25,534 | |
| | 716,253 | | | | | Hanesbrands, Inc | | | 50,331 | |
| | 378,376 | | | | | Hasbro, Inc | | | 20,814 | |
| | 847,928 | | | * | | Jarden Corp | | | 52,020 | |
| | 1,012,280 | | | | | Luxottica Group S.p.A. | | | 54,249 | |
| | 368,100 | | | | | LVMH Moet Hennessy Louis Vuitton S.A. | | | 67,250 | |
| | 167,368 | | | | | Mattel, Inc | | | 7,963 | |
| | 195,733 | | | * | | Michael Kors Holdings Ltd | | | 15,892 | |
| | 36,080 | | | * | | Moncler S.p.A | | | 784 | |
| | 84,312 | | | | | Newell Rubbermaid, Inc | | | 2,733 | |
| | 1,194,398 | | | | | Nike, Inc (Class B) | | | 93,928 | |
| | 29,224 | | | * | | NVR, Inc | | | 29,984 | |
| | 34,566 | | | | | Phillips-Van Heusen Corp | | | 4,702 | |
| | 50,176 | | | | | Polaris Industries, Inc | | | 7,308 | |
| | 2,036,697 | | | | | Pulte Homes, Inc | | | 41,488 | |
| | 28,993 | | | | | Ralph Lauren Corp | | | 5,119 | |
| | 356,100 | | | e | | Sony Corp (ADR) | | | 6,157 | |
| | 13,442 | | | * | | Taylor Morrison Home Corp | | | 302 | |
| | 29,266 | | | * | | Tempur-Pedic International, Inc | | | 1,579 | |
| | 115,531 | | | | | Tupperware Corp | | | 10,921 | |
| | 40,737 | | | * | | Under Armour, Inc (Class A) | | | 3,556 | |
| | 169,592 | | | | | VF Corp | | | 10,572 | |
| | 137,677 | | | | | Whirlpool Corp | | | 21,596 | |
| | | | | | | TOTAL CONSUMER DURABLES & APPAREL | | | 551,742 | |
| | | | | | | | | | | |
| CONSUMER SERVICES - 3.4% | | | | |
| | 288,770 | | | * | | Bally Technologies, Inc | | | 22,654 | |
| | 33,746 | | | | | Brinker International, Inc | | | 1,564 | |
| | 49,450 | | | | | Burger King Worldwide, Inc | | | 1,130 | |
| | 85,303 | | | * | | Chipotle Mexican Grill, Inc (Class A) | | | 45,448 | |
| | 1,329 | | | e | | Choice Hotels International, Inc | | | 65 | |
| | 40,591 | | | | | Darden Restaurants, Inc | | | 2,207 | |
| | 143,142 | | | | | Domino’s Pizza, Inc | | | 9,970 | |
| | 52,659 | | | | | Dunkin Brands Group, Inc | | | 2,538 | |
| | 188,806 | | | * | | Extended Stay America, Inc | | | 4,958 | |
| | 130,691 | | | | | H&R Block, Inc | | | 3,795 | |
| | 271,322 | | | * | | Hilton Worldwide Holdings, Inc | | | 6,037 | |
| | 227,025 | | | * | | Hyatt Hotels Corp | | | 11,229 | |
| | 1,689,145 | | | | | International Game Technology | | | 30,675 | |
| | 393,000 | | | | | Interval Leisure Group, Inc | | | 12,144 | |
| | 2,201,973 | | | | | Las Vegas Sands Corp | | | 173,670 | |
| | 101,280 | | | | | Marriott International, Inc (Class A) | | | 4,999 | |
| | 816,291 | | | | | McDonald’s Corp | | | 79,205 | |
| | 3,200,000 | | | *,g | | Merlin Entertainments plc | | | 18,944 | |
| | 12,779 | | | * | | Norwegian Cruise Line Holdings Ltd | | | 453 | |
| | 73,730 | | | * | | Panera Bread Co (Class A) | | | 13,027 | |
COLLEGE RETIREMENT EQUITIES FUND - Growth Account
| SHARES | | | | | COMPANY | | VALUE
(000) | |
| | 15,272 | | | | | SeaWorld Entertainment, Inc | | $ | 439 | |
| | 83,511 | | | | | Service Corp International | | | 1,514 | |
| | 259,012 | | | | | Six Flags Entertainment Corp | | | 9,537 | |
| | 1,904,123 | | | | | Starbucks Corp | | | 149,264 | |
| | 40,258 | | | | | Starwood Hotels & Resorts Worldwide, Inc | | | 3,199 | |
| | 4,750 | | | e | | Weight Watchers International, Inc | | | 156 | |
| | 103,714 | | | | | Wyndham Worldwide Corp | | | 7,643 | |
| | 39,107 | | | | | Wynn Resorts Ltd | | | 7,595 | |
| | 555,158 | | | | | Yum! Brands, Inc | | | 41,975 | |
| | | | | | | TOTAL CONSUMER SERVICES | | | 666,034 | |
| | | | | | | | | | | |
| DIVERSIFIED FINANCIALS - 4.6% | | | |
| | 376,542 | | | * | | Affiliated Managers Group, Inc | | | 81,664 | |
| | 959,254 | | | | | American Express Co | | | 87,033 | |
| | 963,638 | | | | | Ameriprise Financial, Inc | | | 110,867 | |
| | 477,800 | | | | | Apollo Management LP | | | 15,103 | |
| | 2,385 | | | | | Artisan Partners Asset Management, Inc | | | 156 | |
| | 41,866 | | | | | BlackRock, Inc | | | 13,249 | |
| | 1,201,799 | | | | | Blackstone Group LP | | | 37,857 | |
| | 121,202 | | | | | CBOE Holdings, Inc | | | 6,298 | |
| | 614,115 | | | | | Charles Schwab Corp | | | 15,967 | |
| | 758,400 | | | | | Citigroup, Inc | | | 39,520 | |
| | 587,000 | | | | | Discover Financial Services | | | 32,843 | |
| | 59,876 | | | | | Eaton Vance Corp | | | 2,562 | |
| | 34,456 | | | e | | Federated Investors, Inc (Class B) | | | 992 | |
| | 198,925 | | | | | Franklin Resources, Inc | | | 11,484 | |
| | 553,785 | | | | | Goldman Sachs Group, Inc | | | 98,164 | |
| | 361,441 | | | | | IntercontinentalExchange Group, Inc | | | 81,295 | |
| | 1,250,000 | | | e | | iShares Russell 1000 Growth Index Fund | | | 107,437 | |
| | 63,515 | | | | | Lazard Ltd (Class A) | | | 2,879 | |
| | 20,111 | | | | | Leucadia National Corp | | | 570 | |
| | 46,108 | | | | | LPL Financial Holdings, Inc | | | 2,168 | |
| | 1,042,880 | | | | | Moody’s Corp | | | 81,835 | |
| | 25,525 | | | * | | MSCI, Inc (Class A) | | | 1,116 | |
| | 78,902 | | | | | Oaktree Capital Group LLC | | | 4,643 | |
| | 212,203 | | | | | SEI Investments Co | | | 7,370 | |
| | 345,800 | | | | | State Street Corp | | | 25,378 | |
| | 159,137 | | | | | T Rowe Price Group, Inc | | | 13,331 | |
| | 182,262 | | | | | Waddell & Reed Financial, Inc (Class A) | | | 11,869 | |
| | | | | | | TOTAL DIVERSIFIED FINANCIALS | | | 893,650 | |
| | | | | | | | | | | |
| ENERGY - 3.1% | | | |
| | 62,129 | | | | | Anadarko Petroleum Corp | | | 4,928 | |
| | 8,450 | | | * | | Antero Resources Corp | | | 536 | |
| | 148,271 | | | * | | Atwood Oceanics, Inc | | | 7,916 | |
| | 11,916 | | | | | Baker Hughes, Inc | | | 658 | |
| | 431,242 | | | | | Cabot Oil & Gas Corp | | | 16,715 | |
| | 222,894 | | | * | | Cameron International Corp | | | 13,269 | |
COLLEGE RETIREMENT EQUITIES FUND - Growth Account
| SHARES | | | | | COMPANY | | VALUE
(000) | |
| | 118,460 | | | * | | Cheniere Energy, Inc | | $ | 5,108 | |
| | 123,354 | | | * | | Cobalt International Energy, Inc | | | 2,029 | |
| | 360,343 | | | * | | Concho Resources, Inc | | | 38,917 | |
| | 21,296 | | | *,e | | Continental Resources, Inc | | | 2,396 | |
| | 7,778 | | | | | CVR Energy, Inc | | | 338 | |
| | 854,909 | | | * | | Denbury Resources, Inc | | | 14,046 | |
| | 36,284 | | | * | | Dresser-Rand Group, Inc | | | 2,164 | |
| | 86,381 | | | * | | Dril-Quip, Inc | | | 9,496 | |
| | 587,013 | | | | | EOG Resources, Inc | | | 98,524 | |
| | 66,613 | | | | | Equitable Resources, Inc | | | 5,980 | |
| | 114,851 | | | * | | FMC Technologies, Inc | | | 5,996 | |
| | 7,540 | | | | | Frank’s International NV | | | 204 | |
| | 33,424 | | | * | | Gulfport Energy Corp | | | 2,111 | |
| | 409,722 | | | | | Halliburton Co | | | 20,793 | |
| | 120,000 | | | | | Helmerich & Payne, Inc | | | 10,090 | |
| | 293,878 | | | | | Kinder Morgan, Inc | | | 10,580 | |
| | 50,501 | | | * | | Kosmos Energy LLC | | | 565 | |
| | 15,719 | | | * | | Laredo Petroleum Holdings, Inc | | | 435 | |
| | 137,000 | | | | | Murphy Oil Corp | | | 8,889 | |
| | 204,833 | | | | | Noble Energy, Inc | | | 13,951 | |
| | 48,660 | | | * | | Oasis Petroleum, Inc | | | 2,286 | |
| | 195,290 | | | | | Oceaneering International, Inc | | | 15,404 | |
| | 81,284 | | | | | Pioneer Natural Resources Co | | | 14,962 | |
| | 8,817 | | | | | Questar Market Resources, Inc | | | 270 | |
| | 79,844 | | | | | Range Resources Corp | | | 6,732 | |
| | 186,621 | | | e | | RPC, Inc | | | 3,331 | |
| | 1,916,158 | | | | | Schlumberger Ltd | | | 172,665 | |
| | 170,932 | | | e | | Seadrill Ltd | | | 7,022 | |
| | 332,949 | | | * | | Southwestern Energy Co | | | 13,095 | |
| | 280,791 | | | | | St. Mary Land & Exploration Co | | | 23,336 | |
| | 245,704 | | | | | Suncor Energy, Inc (NY) | | | 8,612 | |
| | 176,605 | | | * | | Whiting Petroleum Corp | | | 10,927 | |
| | 496,311 | | | | | Williams Cos, Inc | | | 19,143 | |
| | 59,496 | | | e | | World Fuel Services Corp | | | 2,568 | |
| | | | | | | TOTAL ENERGY | | | 596,987 | |
| | | | | | | | | | | |
| FOOD & STAPLES RETAILING - 2.0% | | | | |
| | 1,284,243 | | | | | Costco Wholesale Corp | | | 152,838 | |
| | 569,016 | | | | | CVS Corp | | | 40,725 | |
| | 20,270 | | | * | | Fresh Market, Inc | | | 821 | |
| | 1,592,688 | | | | | Kroger Co | | | 62,959 | |
| | 3,999,500 | | | * | | Rite Aid Corp | | | 20,237 | |
| | 203,282 | | | | | Safeway, Inc | | | 6,621 | |
| | 7,040 | | | * | | Sprouts Farmers Market, Inc | | | 271 | |
| | 100,754 | | | | | Sysco Corp | | | 3,637 | |
| | 493,252 | | | | | Walgreen Co | | | 28,332 | |
| | 681,870 | | | | | Wal-Mart Stores, Inc | | | 53,656 | |
| | 414,145 | | | | | Whole Foods Market, Inc | | | 23,950 | |
| | | | | | | TOTAL FOOD & STAPLES RETAILING | | | 394,047 | |
COLLEGE RETIREMENT EQUITIES FUND - Growth Account
| SHARES | | | | | COMPANY | | VALUE
(000) | |
| FOOD, BEVERAGE & TOBACCO - 4.4% | | | | |
| | 3,158,013 | | | | | Altria Group, Inc | | $ | 121,236 | |
| | 375,214 | | | | | Archer Daniels Midland Co | | | 16,284 | |
| | 73,349 | | | | | Brown-Forman Corp (Class B) | | | 5,543 | |
| | 56,180 | | | e | | Campbell Soup Co | | | 2,431 | |
| | 3,177,358 | | | | | Coca-Cola Co | | | 131,257 | |
| | 470,119 | | | | | Coca-Cola Enterprises, Inc | | | 20,746 | |
| | 186,599 | | | | | ConAgra Foods, Inc | | | 6,288 | |
| | 147,855 | | | * | | Constellation Brands, Inc (Class A) | | | 10,406 | |
| | 338,051 | | | | | Dr Pepper Snapple Group, Inc | | | 16,470 | |
| | 82,685 | | | | | Flowers Foods, Inc | | | 1,775 | |
| | 312,202 | | | | | General Mills, Inc | | | 15,582 | |
| | 352,196 | | | *,e | | Green Mountain Coffee Roasters, Inc | | | 26,619 | |
| | 150,000 | | | | | Groupe Danone | | | 10,821 | |
| | 234,547 | | | | | Hershey Co | | | 22,805 | |
| | 138,821 | | | | | Hillshire Brands Co | | | 4,642 | |
| | 289,858 | | | | | Hormel Foods Corp | | | 13,093 | |
| | 4,770 | | | | | Ingredion, Inc | | | 327 | |
| | 6,337 | | | | | J.M. Smucker Co | | | 657 | |
| | 115,995 | | | | | Kellogg Co | | | 7,084 | |
| | 447,672 | | | | | Kraft Foods Group, Inc | | | 24,139 | |
| | 764,225 | | | | | Lorillard, Inc | | | 38,731 | |
| | 63,520 | | | | | McCormick & Co, Inc | | | 4,378 | |
| | 151,933 | | | | | Mead Johnson Nutrition Co | | | 12,726 | |
| | 870,756 | | | * | | Monster Beverage Corp | | | 59,011 | |
| | 1,782,015 | | | | | PepsiCo, Inc | | | 147,800 | |
| | 1,129,284 | | | | | Philip Morris International, Inc | | | 98,394 | |
| | 699,600 | | | * | | Pilgrim’s Pride Corp | | | 11,369 | |
| | 8,075 | | | | | Pinnacle Foods, Inc | | | 222 | |
| | 56,000 | | | e | | Remy Cointreau S.A. | | | 4,704 | |
| | 115,648 | | | | | Reynolds American, Inc | | | 5,781 | |
| | 334,000 | | | *,e | | Suntory Beverage & Food Ltd | | | 10,655 | |
| | 69,427 | | | * | | WhiteWave Foods Co (Class A) | | | 1,593 | |
| | | | | | | TOTAL FOOD, BEVERAGE & TOBACCO | | | 853,569 | |
| | | | | | | | | | | |
| HEALTH CARE EQUIPMENT & SERVICES - 3.1% | | | | |
| | 451,190 | | | | | Aetna, Inc | | | 30,947 | |
| | 362,802 | | | | | AmerisourceBergen Corp | | | 25,509 | |
| | 38,739 | | | | | Bard (C.R.), Inc | | | 5,189 | |
| | 289,779 | | | | | Baxter International, Inc | | | 20,154 | |
| | 149,023 | | | | | Becton Dickinson & Co | | | 16,465 | |
| | 46,404 | | | * | | Brookdale Senior Living, Inc | | | 1,261 | |
| | 336,600 | | | * | | CareFusion Corp | | | 13,403 | |
| | 687,456 | | | * | | Catamaran Corp | | | 32,640 | |
| | 887,863 | | | * | | Cerner Corp | | | 49,489 | |
| | 177,431 | | | | | Cigna Corp | | | 15,522 | |
| | 3,482 | | | * | | Community Health Systems, Inc | | | 137 | |
| | 45,784 | | | | | Cooper Cos, Inc | | | 5,670 | |
| | 89,436 | | | * | | DaVita, Inc | | | 5,668 | |
COLLEGE RETIREMENT EQUITIES FUND - Growth Account
| SHARES | | | | | COMPANY | | VALUE
(000) | |
| | 20,199 | | | | | Dentsply International, Inc | | $ | 979 | |
| | 295,539 | | | * | | Edwards Lifesciences Corp | | | 19,435 | |
| | 68,006 | | | * | | Envision Healthcare Holdings, Inc | | | 2,416 | |
| | 385,815 | | | * | | Express Scripts Holding Co | | | 27,100 | |
| | 261,836 | | | * | | HCA Holdings, Inc | | | 12,492 | |
| | 124,670 | | | * | | Health Management Associates, Inc (Class A) | | | 1,633 | |
| | 248,900 | | | | | Healthsouth Corp | | | 8,293 | |
| | 41,858 | | | * | | Henry Schein, Inc | | | 4,783 | |
| | 39,131 | | | * | | Hologic, Inc | | | 875 | |
| | 88,200 | | | | | Humana, Inc | | | 9,104 | |
| | 114,912 | | | *,e | | Idexx Laboratories, Inc | | | 12,223 | |
| | 69,979 | | | * | | Intuitive Surgical, Inc | | | 26,877 | |
| | 42,517 | | | * | | Laboratory Corp of America Holdings | | | 3,885 | |
| | 549,011 | | | | | McKesson Corp | | | 88,610 | |
| | 390,400 | | | * | | Olympus Corp | | | 12,382 | |
| | 37,033 | | | | | Patterson Cos, Inc | | | 1,526 | |
| | 30,640 | | | * | | Pediatrix Medical Group, Inc | | | 1,636 | |
| | 422,218 | | | * | | Premier, Inc | | | 15,521 | |
| | 3,690 | | | e | | Quest Diagnostics, Inc | | | 198 | |
| | 69,931 | | | e | | Resmed, Inc | | | 3,292 | |
| | 26,081 | | | * | | Sirona Dental Systems, Inc | | | 1,831 | |
| | 315,581 | | | | | St. Jude Medical, Inc | | | 19,550 | |
| | 93,553 | | | | | Stryker Corp | | | 7,030 | |
| | 49,644 | | | * | | Tenet Healthcare Corp | | | 2,091 | |
| | 240,000 | | | | | UnitedHealth Group, Inc | | | 18,072 | |
| | 248,620 | | | | | Universal Health Services, Inc (Class B) | | | 20,203 | |
| | 188,956 | | | * | | Varian Medical Systems, Inc | | | 14,680 | |
| | 10,073 | | | *,e | | Veeva Systems, Inc | | | 323 | |
| | 347,000 | | | | | WellPoint, Inc | | | 32,059 | |
| | 4,740 | | | | | Zimmer Holdings, Inc | | | 442 | |
| | | | | | | TOTAL HEALTH CARE EQUIPMENT & SERVICES | | | 591,595 | |
| | | | | | | | | | | |
| HOUSEHOLD & PERSONAL PRODUCTS - 0.9% | | | | |
| | 209,142 | | | | | Avon Products, Inc | | | 3,601 | |
| | 252,780 | | | | | Church & Dwight Co, Inc | | | 16,754 | |
| | 53,095 | | | e | | Clorox Co | | | 4,925 | |
| | 617,733 | | | | | Colgate-Palmolive Co | | | 40,282 | |
| | 18,540 | | | e | | Coty, Inc | | | 283 | |
| | 112,132 | | | | | Estee Lauder Cos (Class A) | | | 8,446 | |
| | 133,751 | | | e | | Herbalife Ltd | | | 10,526 | |
| | 166,543 | | | | | Kimberly-Clark Corp | | | 17,397 | |
| | 284,875 | | | | | L’Oreal S.A. | | | 50,028 | |
| | 141,613 | | | | | Nu Skin Enterprises, Inc (Class A) | | | 19,574 | |
| | | | | | | TOTAL HOUSEHOLD & PERSONAL PRODUCTS | | | 171,816 | |
| | | | | | | | | | | |
| INSURANCE - 0.9% | | | | |
| | 280,919 | | | | | ACE Ltd | | | 29,084 | |
| | 30,377 | | | | | Allied World Assurance Co Holdings Ltd | | | 3,427 | |
| | 240,800 | | | | | Allstate Corp | | | 13,133 | |
COLLEGE RETIREMENT EQUITIES FUND - Growth Account
| SHARES | | | | | COMPANY | | VALUE
(000) | |
| | 5,379 | | | | | American Financial Group, Inc | | $ | 310 | |
| | 115,454 | | | | | Aon plc | | | 9,685 | |
| | 2,379 | | | * | | Arch Capital Group Ltd | | | 142 | |
| | 62,267 | | | | | Arthur J. Gallagher & Co | | | 2,922 | |
| | 361,725 | | | | | Axis Capital Holdings Ltd | | | 17,207 | |
| | 27,255 | | | | | Brown & Brown, Inc | | | 856 | |
| | 17,999 | | | | | Chubb Corp | | | 1,739 | |
| | 7,026 | | | | | Endurance Specialty Holdings Ltd | | | 412 | |
| | 12,540 | | | | | Erie Indemnity Co (Class A) | | | 917 | |
| | 42,576 | | | | | Hanover Insurance Group, Inc | | | 2,542 | |
| | 11,919 | | | | | Loews Corp | | | 575 | |
| | 389,899 | | | | | Marsh & McLennan Cos, Inc | | | 18,856 | |
| | 277,900 | | | | | Metlife, Inc | | | 14,984 | |
| | 117,700 | | | | | PartnerRe Ltd | | | 12,409 | |
| | 234,792 | | | | | Progressive Corp | | | 6,403 | |
| | 209,733 | | | | | Prudential Financial, Inc | | | 19,342 | |
| | 195,888 | | | | | Travelers Cos, Inc | | | 17,736 | |
| | 2,886 | | | | | Validus Holdings Ltd | | | 116 | |
| | | | | | | TOTAL INSURANCE | | | 172,797 | |
| MATERIALS - 4.3% | | | | |
| | 32,187 | | | | | Airgas, Inc | | | 3,600 | |
| | 15,309 | | | | | Albemarle Corp | | | 970 | |
| | 21,900 | | | | | Aptargroup, Inc | | | 1,485 | |
| | 270,846 | | | | | Avery Dennison Corp | | | 13,594 | |
| | 290,726 | | | | | Axiall Corp | | | 13,792 | |
| | 72,927 | | | | | Ball Corp | | | 3,767 | |
| | 22,830 | | | | | Bemis Co, Inc | | | 935 | |
| | 77,714 | | | | | Celanese Corp (Series A) | | | 4,298 | |
| | 50,145 | | | | | CF Industries Holdings, Inc | | | 11,686 | |
| | 63,486 | | | | | Compass Minerals International, Inc | | | 5,082 | |
| | 58,959 | | | * | | Crown Holdings, Inc | | | 2,628 | |
| | 734,278 | | | | | Dow Chemical Co | | | 32,602 | |
| | 535,347 | | | | | Du Pont (E.I.) de Nemours & Co | | | 34,782 | |
| | 23,602 | | | | | Eagle Materials, Inc | | | 1,828 | |
| | 74,984 | | | | | Eastman Chemical Co | | | 6,051 | |
| | 226,073 | | | | | Ecolab, Inc | | | 23,573 | |
| | 65,646 | | | | | FMC Corp | | | 4,954 | |
| | 973,900 | | | * | | Graphic Packaging Holding Co | | | 9,350 | |
| | 2,783 | | | | | Greif, Inc (Class A) | | | 146 | |
| | 40,080 | | | | | International Flavors & Fragrances, Inc | | | 3,446 | |
| | 639,605 | | | | | International Paper Co | | | 31,360 | |
| | 1,655,148 | | | | | LyondellBasell Industries AF S.C.A | | | 132,875 | |
| | 23,277 | | | | | Martin Marietta Materials, Inc | | | 2,326 | |
| | 1,777,228 | | | | | Monsanto Co | | | 207,136 | |
| | 4,372 | | | e | | NewMarket Corp | | | 1,461 | |
| | 516,193 | | | * | | Owens-Illinois, Inc | | | 18,469 | |
| | 398,631 | | | | | Packaging Corp of America | | | 25,225 | |
| | 193,525 | | | | | PPG Industries, Inc | | | 36,704 | |
| | 215,299 | | | | | Praxair, Inc | | | 27,995 | |
COLLEGE RETIREMENT EQUITIES FUND - Growth Account
| SHARES | | | | | COMPANY | | VALUE
(000) | |
| | 286,944 | | | | | Rock-Tenn Co (Class A) | | $ | 30,132 | |
| | 28,152 | | | | | Rockwood Holdings, Inc | | | 2,025 | |
| | 9,223 | | | | | Royal Gold, Inc | | | 425 | |
| | 59,787 | | | | | RPM International, Inc | | | 2,482 | |
| | 21,119 | | | | | Scotts Miracle-Gro Co (Class A) | | | 1,314 | |
| | 367,643 | | | | | Sealed Air Corp | | | 12,518 | |
| | 278,568 | | | | | Sherwin-Williams Co | | | 51,117 | |
| | 54,934 | | | | | Sigma-Aldrich Corp | | | 5,164 | |
| | 80,764 | | | | | Silgan Holdings, Inc | | | 3,878 | |
| | 439,973 | | | | | Southern Copper Corp (NY) | | | 12,632 | |
| | 3,110 | | | * | | Tahoe Resources, Inc | | | 52 | |
| | 43,559 | | | | | Valspar Corp | | | 3,105 | |
| | 74,800 | | | | | West Fraser Timber Co Ltd | | | 7,295 | |
| | 171,743 | | | | | Westlake Chemical Corp | | | 20,965 | |
| | 182,077 | | | * | | WR Grace & Co | | | 18,002 | |
| | | | | | | TOTAL MATERIALS | | | 833,226 | |
| | | | | | | | | | | |
| MEDIA - 5.3% | | | | |
| | 187,080 | | | * | | AMC Entertainment Holdings, Inc | | | 3,845 | |
| | 210,045 | | | * | | AMC Networks, Inc | | | 14,306 | |
| | 98,361 | | | e | | Cablevision Systems Corp (Class A) | | | 1,764 | |
| | 858,244 | | | | | CBS Corp (Class B) | | | 54,704 | |
| | 32,633 | | | * | | Charter Communications, Inc | | | 4,463 | |
| | 56,952 | | | | | Cinemark Holdings, Inc | | | 1,898 | |
| | 20,235 | | | | | Clear Channel Outdoor Holdings, Inc (Class A) | | | 205 | |
| | 6,515,507 | | | | | Comcast Corp (Class A) | | | 338,578 | |
| | 1,178,440 | | | * | | DIRECTV | | | 81,418 | |
| | 1,274,062 | | | * | | Discovery Communications, Inc (Class A) | | | 115,201 | |
| | 464,130 | | | * | | DISH Network Corp (Class A) | | | 26,882 | |
| | 160,000 | | | | | Grupo Televisa SAB (ADR) | | | 4,842 | |
| | 97,407 | | | | | Interpublic Group of Cos, Inc | | | 1,724 | |
| | 39,739 | | | * | | Lamar Advertising Co (Class A) | | | 2,076 | |
| | 197,710 | | | * | | Liberty Global plc (Class A) | | | 17,594 | |
| | 38,008 | | | *,e | | Lions Gate Entertainment Corp | | | 1,203 | |
| | 29,156 | | | * | | Madison Square Garden, Inc | | | 1,679 | |
| | 144,081 | | | | | McGraw-Hill Cos, Inc | | | 11,267 | |
| | 9,168 | | | | | Morningstar, Inc | | | 716 | |
| | 178,451 | | | * | | News Corp | | | 3,216 | |
| | 125,234 | | | | | Omnicom Group, Inc | | | 9,314 | |
| | 7,195 | | | e | | Regal Entertainment Group (Class A) | | | 140 | |
| | 53,258 | | | | | Scripps Networks Interactive (Class A) | | | 4,602 | |
| | 1,433,977 | | | *,e | | Sirius XM Holdings, Inc | | | 5,005 | |
| | 530,000 | | | | | Smiles S.A. | | | 7,299 | |
| | 48,474 | | | * | | Starz-Liberty Capital | | | 1,417 | |
| | 493,158 | | | | | Time Warner Cable, Inc | | | 66,823 | |
| | 329,700 | | | | | Time Warner, Inc | | | 22,987 | |
| | 465,417 | | | * | | Tribune Co | | | 36,023 | |
| | 2,571,260 | | | | | Twenty-First Century Fox, Inc | | | 90,457 | |
| | 873,474 | | | | | Viacom, Inc (Class B) | | | 76,289 | |
| | 352,484 | | | * | | Walt Disney Co | | | 26,930 | |
| | | | | | | TOTAL MEDIA | | | 1,034,867 | |
COLLEGE RETIREMENT EQUITIES FUND - Growth Account
| SHARES | | | | | COMPANY | | VALUE
(000) | |
| PHARMACEUTICALS, BIOTECHNOLOGY & LIFE SCIENCES - 11.5% | | | | |
| | 1,412,725 | | | | | AbbVie, Inc | | $ | 74,606 | |
| | 14,689 | | | *,e | | Acceleron Pharma, Inc | | | 582 | |
| | 530,236 | | | * | | Actavis plc | | | 89,080 | |
| | 288,582 | | | | | Agilent Technologies, Inc | | | 16,504 | |
| | 793,609 | | | * | | Alexion Pharmaceuticals, Inc | | | 105,598 | |
| | 171,441 | | | * | | Alkermes plc | | | 6,971 | |
| | 467,053 | | | | | Allergan, Inc | | | 51,880 | |
| | 973,383 | | | | | Amgen, Inc | | | 111,121 | |
| | 571,301 | | | | | Bayer AG. | | | 80,217 | |
| | 1,015,445 | | | * | | Biogen Idec, Inc | | | 284,071 | |
| | 67,952 | | | * | | BioMarin Pharmaceuticals, Inc | | | 4,775 | |
| | 129,000 | | | * | | Biovail Corp | | | 15,145 | |
| | 852,672 | | | | | Bristol-Myers Squibb Co | | | 45,319 | |
| | 112,222 | | | * | | Bruker BioSciences Corp | | | 2,219 | |
| | 1,297,690 | | | * | | Celgene Corp | | | 219,258 | |
| | 76,105 | | | * | | Charles River Laboratories International, Inc | | | 4,037 | |
| | 126,618 | | | * | | Covance, Inc | | | 11,150 | |
| | 66,343 | | | * | | Cubist Pharmaceuticals, Inc | | | 4,569 | |
| | 141,613 | | | | | Eli Lilly & Co | | | 7,222 | |
| | 136,154 | | | * | | Endo Pharmaceuticals Holdings, Inc | | | 9,185 | |
| | 5,258,100 | | | * | | Gilead Sciences, Inc | | | 395,146 | |
| | 559,634 | | | *,e | | Illumina, Inc | | | 61,907 | |
| | 49,961 | | | * | | Incyte Corp | | | 2,530 | |
| | 170,566 | | | * | | Jazz Pharmaceuticals plc | | | 21,587 | |
| | 174,818 | | | | | Johnson & Johnson | | | 16,012 | |
| | 54,556 | | | * | | Life Technologies Corp | | | 4,135 | |
| | 35,794 | | | * | | Medivation, Inc | | | 2,284 | |
| | 14,733 | | | * | | Mettler-Toledo International, Inc | | | 3,574 | |
| | 1,067,854 | | | * | | Mylan Laboratories, Inc | | | 46,345 | |
| | 39,761 | | | *,e | | Myriad Genetics, Inc | | | 834 | |
| | 612,484 | | | | | Novartis AG. (ADR) | | | 49,231 | |
| | 70,000 | | | | | Novo Nordisk AS (Class B) | | | 12,831 | |
| | 141,600 | | | * | | NPS Pharmaceuticals, Inc | | | 4,299 | |
| | 781,367 | | | | | Perrigo Co plc | | | 119,908 | |
| | 342,605 | | | | | Pfizer, Inc | | | 10,494 | |
| | 85,539 | | | * | | Pharmacyclics, Inc | | | 9,048 | |
| | 370,501 | | | e | | Questcor Pharmaceuticals, Inc | | | 20,174 | |
| | 13,476 | | | * | | Quintiles Transnational Holdings, Inc | | | 624 | |
| | 60,608 | | | * | | Regeneron Pharmaceuticals, Inc | | | 16,682 | |
| | 293,647 | | | | | Roche Holding AG. | | | 82,258 | |
| | 713,260 | | | * | | Salix Pharmaceuticals Ltd | | | 64,151 | |
| | 47,774 | | | *,e | | Seattle Genetics, Inc | | | 1,906 | |
| | 22,669 | | | | | Techne Corp | | | 2,146 | |
| | 280,570 | | | *,e | | Theravance, Inc | | | 10,002 | |
| | 138,003 | | | * | | United Therapeutics Corp | | | 15,605 | |
| | 191,312 | | | * | | Vertex Pharmaceuticals, Inc | | | 14,214 | |
COLLEGE RETIREMENT EQUITIES FUND - Growth Account
| SHARES | | | | | COMPANY | | VALUE
(000) | |
| | 42,242 | | | * | | Waters Corp | | $ | 4,224 | |
| | 3,069,296 | | | | | Zoetis Inc | | | 100,335 | |
| | | | | | | TOTAL PHARMACEUTICALS, BIOTECHNOLOGY & LIFE SCIENCES | | | 2,235,995 | |
| | | | | | | | | | | |
| REAL ESTATE - 1.3% | | | | |
| | 358,552 | | | | | American Tower Corp | | | 28,620 | |
| | 40,392 | | | | | Apartment Investment & Management Co (Class A) | | | 1,046 | |
| | 7,282 | | | | | Boston Properties, Inc | | | 731 | |
| | 4,500 | | | * | | Brixmor Property Group, Inc | | | 91 | |
| | 22,429 | | | | | CBL & Associates Properties, Inc | | | 403 | |
| | 584,492 | | | * | | CBRE Group, Inc | | | 15,372 | |
| | 48,831 | | | e | | Digital Realty Trust, Inc | | | 2,399 | |
| | 27,432 | | | | | Equity Lifestyle Properties, Inc | | | 994 | |
| | 246,305 | | | | | Extra Space Storage, Inc | | | 10,377 | |
| | 21,140 | | | | | Federal Realty Investment Trust | | | 2,144 | |
| | 3,650,000 | | | e | | Global Logistic Properties | | | 8,373 | |
| | 57,668 | | | | | Omega Healthcare Investors, Inc | | | 1,718 | |
| | 85,983 | | | | | Plum Creek Timber Co, Inc | | | 3,999 | |
| | 64,490 | | | | | Public Storage, Inc | | | 9,707 | |
| | 61,840 | | | | | Rayonier, Inc | | | 2,603 | |
| | 1,850,331 | | | * | | Realogy Holdings Corp | | | 91,536 | |
| | 18,444 | | | | | Regency Centers Corp | | | 854 | |
| | 5,392 | | | | | Senior Housing Properties Trust | | | 120 | |
| | 392,046 | | | | | Simon Property Group, Inc | | | 59,654 | |
| | 34,690 | | | | | Spirit Realty Capital, Inc | | | 341 | |
| | 45,671 | | | | | Tanger Factory Outlet Centers, Inc | | | 1,462 | |
| | 4,414 | | | | | Taubman Centers, Inc | | | 282 | |
| | 65,461 | | | | | Ventas, Inc | | | 3,750 | |
| | 17,470 | | | | | Vornado Realty Trust | | | 1,551 | |
| | 281,879 | | | | | Weyerhaeuser Co | | | 8,899 | |
| | | | | | | TOTAL REAL ESTATE | | | 257,026 | |
| | | | | | | | | | | |
| RETAILING - 7.2% | | | | |
| | 5,791 | | | | | Aaron’s, Inc | | | 170 | |
| | 3,643 | | | e | | Abercrombie & Fitch Co (Class A) | | | 120 | |
| | 35,634 | | | | | Advance Auto Parts, Inc | | | 3,944 | |
| | 957,363 | | | * | | Amazon.com, Inc | | | 381,787 | |
| | 55,596 | | | | | American Eagle Outfitters, Inc | | | 801 | |
| | 9,269 | | | * | | Ascena Retail Group, Inc | | | 196 | |
| | 18,470 | | | * | | ASOS plc | | | 1,882 | |
| | 25,142 | | | * | | Autonation, Inc | | | 1,249 | |
| | 17,009 | | | * | | AutoZone, Inc | | | 8,129 | |
| | 105,935 | | | * | | Bed Bath & Beyond, Inc | | | 8,507 | |
| | 582,574 | | | | | Best Buy Co, Inc | | | 23,233 | |
| | 7,853 | | | * | | Big Lots, Inc | | | 254 | |
| | 23,889 | | | * | | Cabela’s, Inc | | | 1,592 | |
| | 1,974,549 | | | * | | Carmax, Inc | | | 92,843 | |
| | 74,044 | | | | | Chico’s FAS, Inc | | | 1,395 | |
| | 255,000 | | | * | | Ctrip.com International Ltd (ADR) | | | 12,653 | |
COLLEGE RETIREMENT EQUITIES FUND - Growth Account
| SHARES | | | | | COMPANY | | VALUE
(000) | |
| | 47,335 | | | | | Dick’s Sporting Goods, Inc | | $ | 2,750 | |
| | 190,564 | | | | | Dillard’s, Inc (Class A) | | | 18,525 | |
| | 158,394 | | | * | | Dollar General Corp | | | 9,554 | |
| | 272,875 | | | * | | Dollar Tree, Inc | | | 15,396 | |
| | 118,486 | | | | | DSW, Inc (Class A) | | | 5,063 | |
| | 839,027 | | | | | Expedia, Inc | | | 58,447 | |
| | 47,004 | | | | | Family Dollar Stores, Inc | | | 3,054 | |
| | 528,485 | | | | | Foot Locker, Inc | | | 21,900 | |
| | 271,900 | | | e | | GameStop Corp (Class A) | | | 13,394 | |
| | 510,414 | | | | | Gap, Inc | | | 19,947 | |
| | 231,453 | | | | | Genuine Parts Co | | | 19,255 | |
| | 288,969 | | | | | GNC Holdings, Inc | | | 16,890 | |
| | 4,215,108 | | | * | | Groupon, Inc | | | 49,612 | |
| | 2,527,132 | | | | | Home Depot, Inc | | | 208,084 | |
| | 28,265 | | | *,e | | HomeAway, Inc | | | 1,155 | |
| | 1,180,000 | | | | | Kingfisher plc | | | 7,533 | |
| | 117,206 | | | | | L Brands, Inc | | | 7,249 | |
| | 1,373,091 | | | * | | Liberty Interactive Corp | | | 40,300 | |
| | 17,269 | | | * | | Liberty Ventures | | | 2,117 | |
| | 144,489 | | | * | | LKQ Corp | | | 4,754 | |
| | 549,958 | | | | | Lowe’s Companies, Inc | | | 27,250 | |
| | 45,100 | | | *,e | | Lumber Liquidators, Inc | | | 4,640 | |
| | 667,786 | | | | | Macy’s, Inc | | | 35,660 | |
| | 105,661 | | | * | | NetFlix, Inc | | | 38,901 | |
| | 71,433 | | | | | Nordstrom, Inc | | | 4,415 | |
| | 149,764 | | | * | | O’Reilly Automotive, Inc | | | 19,276 | |
| | 335,049 | | | | | Petsmart, Inc | | | 24,375 | |
| | 30,422 | | | * | | Priceline.com, Inc | | | 35,363 | |
| | 106,505 | | | | | Ross Stores, Inc | | | 7,980 | |
| | 81,670 | | | * | | Sally Beauty Holdings, Inc | | | 2,469 | |
| | 3,536 | | | | | Signet Jewelers Ltd | | | 278 | |
| | 315,380 | | | | | Target Corp | | | 19,954 | |
| | 54,103 | | | | | Tiffany & Co | | | 5,020 | |
| | 1,037,830 | | | | | TJX Companies, Inc | | | 66,141 | |
| | 67,408 | | | | | Tractor Supply Co | | | 5,230 | |
| | 96,362 | | | * | | TripAdvisor, Inc | | | 7,982 | |
| | 139,797 | | | * | | Ulta Salon Cosmetics & Fragrance, Inc | | | 13,493 | |
| | 163,835 | | | * | | Urban Outfitters, Inc | | | 6,078 | |
| | 89,233 | | | | | Williams-Sonoma, Inc | | | 5,200 | |
| | 10,061 | | | *,e | | zulily, Inc | | | 417 | |
| | | | | | | TOTAL RETAILING | | | 1,393,856 | |
| | | | | | | | | | | |
| SEMICONDUCTORS & SEMICONDUCTOR EQUIPMENT - 1.6% | | | | |
| | 288,830 | | | *,e | | Advanced Micro Devices, Inc | | | 1,118 | |
| | 304,335 | | | | | Altera Corp | | | 9,900 | |
| | 63,462 | | | | | Analog Devices, Inc | | | 3,232 | |
| | 384,479 | | | | | Applied Materials, Inc | | | 6,802 | |
| | 1,069,636 | | | | | ARM Holdings plc (ADR) | | | 58,552 | |
| | 201,761 | | | * | | Atmel Corp | | | 1,580 | |
COLLEGE RETIREMENT EQUITIES FUND - Growth Account
| SHARES | | | | | COMPANY | | VALUE
(000) | |
| | 208,723 | | | | | Avago Technologies Ltd | | $ | 11,039 | |
| | 516,652 | | | | | Broadcom Corp (Class A) | | | 15,319 | |
| | 57,832 | | | * | | Cree, Inc | | | 3,619 | |
| | 241,891 | | | *,e | | Freescale Semiconductor Holdings Ltd | | | 3,882 | |
| | 158,644 | | | | | Intel Corp | | | 4,118 | |
| | 410,982 | | | * | | Lam Research Corp | | | 22,378 | |
| | 167,583 | | | | | Linear Technology Corp | | | 7,633 | |
| | 562,628 | | | | | LSI Logic Corp | | | 6,200 | |
| | 699,300 | | | | | Marvell Technology Group Ltd | | | 10,056 | |
| | 141,611 | | | | | Maxim Integrated Products, Inc | | | 3,952 | |
| | 96,818 | | | e | | Microchip Technology, Inc | | | 4,333 | |
| | 109,534 | | | | | Nvidia Corp | | | 1,755 | |
| | 1,023,478 | | | * | | NXP Semiconductors NV | | | 47,008 | |
| | 210,118 | | | * | | ON Semiconductor Corp | | | 1,731 | |
| | 15,963 | | | * | | Silicon Laboratories, Inc | | | 691 | |
| | 76,156 | | | * | | Skyworks Solutions, Inc | | | 2,175 | |
| | 602,827 | | | | | Texas Instruments, Inc | | | 26,470 | |
| | 1,342,823 | | | | | Xilinx, Inc | | | 61,663 | |
| | | | | | | TOTAL SEMICONDUCTORS & SEMICONDUCTOR EQUIPMENT | | | 315,206 | |
| | | | | | | | | | | |
| SOFTWARE & SERVICES - 19.8% | | | | |
| | 773,126 | | | | | Accenture plc | | | 63,566 | |
| | 2,828,207 | | | * | | Adobe Systems, Inc | | | 169,353 | |
| | 86,425 | | | * | | Akamai Technologies, Inc | | | 4,078 | |
| | 177,814 | | | * | | Alliance Data Systems Corp | | | 46,753 | |
| | 356,691 | | | | | Amdocs Ltd | | | 14,710 | |
| | 45,862 | | | * | | Ansys, Inc | | | 3,999 | |
| | 322,700 | | | * | | AOL, Inc | | | 15,044 | |
| | 87,079 | | | * | | Autodesk, Inc | | | 4,383 | |
| | 235,141 | | | | | Automatic Data Processing, Inc | | | 19,002 | |
| | 13,938 | | | | | Booz Allen Hamilton Holding Co | | | 267 | |
| | 287,203 | | | | | Broadridge Financial Solutions, Inc | | | 11,350 | |
| | 404,400 | | | | | CA, Inc | | | 13,608 | |
| | 140,021 | | | * | | Cadence Design Systems, Inc | | | 1,963 | |
| | 146,155 | | | * | | Citrix Systems, Inc | | | 9,244 | |
| | 441,102 | | | * | | Cognizant Technology Solutions Corp (Class A) | | | 44,542 | |
| | 168,500 | | | | | Computer Sciences Corp | | | 9,416 | |
| | 22,586 | | | *,e | | Concur Technologies, Inc | | | 2,330 | |
| | 18,775 | | | * | | Criteo S.A. (ADR) | | | 642 | |
| | 13,316 | | | | | DST Systems, Inc | | | 1,208 | |
| | 3,468,159 | | | * | | eBay, Inc | | | 190,367 | |
| | 111,969 | | | * | | Electronic Arts, Inc | | | 2,569 | |
| | 24,078 | | | * | | Equinix, Inc | | | 4,273 | |
| | 5,359,676 | | | * | | Facebook, Inc | | | 292,960 | |
| | 21,200 | | | e | | Factset Research Systems, Inc | | | 2,302 | |
| | 13,996 | | | | | Fidelity National Information Services, Inc | | | 751 | |
| | 13,253 | | | *,e | | FireEye, Inc | | | 578 | |
| | 129,430 | | | * | | Fiserv, Inc | | | 7,643 | |
| | 33,180 | | | * | | FleetCor Technologies, Inc | | | 3,888 | |
COLLEGE RETIREMENT EQUITIES FUND - Growth Account
| SHARES | | | | | COMPANY | | VALUE
(000) | |
| | 67,061 | | | * | | Fortinet, Inc | | $ | 1,283 | |
| | 45,552 | | | * | | Gartner, Inc | | | 3,236 | |
| | 84,884 | | | * | | Genpact Ltd | | | 1,559 | |
| | 331,121 | | | | | Global Payments, Inc | | | 21,520 | |
| | 600,872 | | | * | | Google, Inc (Class A) | | | 673,403 | |
| | 397,945 | | | | | IAC/InterActiveCorp | | | 27,335 | |
| | 188,572 | | | * | | Informatica Corp | | | 7,826 | |
| | 1,074,172 | | | | | International Business Machines Corp | | | 201,482 | |
| | 2,496,237 | | | | | Intuit, Inc | | | 190,513 | |
| | 41,367 | | | | | Jack Henry & Associates, Inc | | | 2,449 | |
| | 271,562 | | | | | Lender Processing Services, Inc | | | 10,151 | |
| | 219,353 | | | * | | LinkedIn Corp | | | 47,562 | |
| | 393,041 | | | | | Mastercard, Inc (Class A) | | | 328,370 | |
| | 5,907 | | | * | | Micros Systems, Inc | | | 339 | |
| | 10,394,599 | | | | | Microsoft Corp | | | 389,070 | |
| | 94,500 | | | | | Netease.com (ADR) | | | 7,428 | |
| | 17,266 | | | * | | NetSuite, Inc | | | 1,779 | |
| | 387,554 | | | * | | NeuStar, Inc (Class A) | | | 19,323 | |
| | 5,273,541 | | | | | Oracle Corp | | | 201,766 | |
| | 65,150 | | | * | | Pandora Media, Inc | | | 1,733 | |
| | 140,679 | | | | | Paychex, Inc | | | 6,405 | |
| | 39,440 | | | | | QIWI plc (ADR) | | | 2,209 | |
| | 54,967 | | | *,e | | Rackspace Hosting, Inc | | | 2,151 | |
| | 2,154,555 | | | * | | Red Hat, Inc | | | 120,741 | |
| | 427,761 | | | * | | Rovi Corp | | | 8,423 | |
| | 1,031,849 | | | * | | Salesforce.com, Inc | | | 56,948 | |
| | 39,105 | | | * | | ServiceNow, Inc | | | 2,190 | |
| | 135,554 | | | * | | Sina Corp | | | 11,420 | |
| | 30,135 | | | * | | SolarWinds, Inc | | | 1,140 | |
| | 32,560 | | | | | Solera Holdings, Inc | | | 2,304 | |
| | 50,910 | | | * | | Splunk, Inc | | | 3,496 | |
| | 742,779 | | | | | Symantec Corp | | | 17,515 | |
| | 4,205 | | | * | | Tableau Software, Inc | | | 290 | |
| | 78,625 | | | * | | Teradata Corp | | | 3,577 | |
| | 81,767 | | | * | | TIBCO Software, Inc | | | 1,838 | |
| | 60,669 | | | | | Total System Services, Inc | | | 2,019 | |
| | 81,200 | | | *,e | | Twitter, Inc | | | 5,168 | |
| | 310,520 | | | * | | Vantiv, Inc | | | 10,126 | |
| | 339,480 | | | *,e | | VeriSign, Inc | | | 20,294 | |
| | 1,411,392 | | | | | Visa, Inc (Class A) | | | 314,289 | |
| | 285,000 | | | * | | VistaPrint Ltd | | | 16,202 | |
| | 856,131 | | | * | | VMware, Inc (Class A) | | | 76,804 | |
| | 269,645 | | | | | Western Union Co | | | 4,651 | |
| | 18,526 | | | * | | Workday, Inc | | | 1,541 | |
| | 1,696,870 | | | * | | Yahoo!, Inc | | | 68,621 | |
| | 62,400 | | | * | | Yelp, Inc | | | 4,303 | |
| | | | | | | TOTAL SOFTWARE & SERVICES | | | 3,843,581 | |
COLLEGE RETIREMENT EQUITIES FUND - Growth Account
| SHARES | | | | | COMPANY | | VALUE
(000) | |
| TECHNOLOGY HARDWARE & EQUIPMENT - 6.2% | | | | |
| | 48,286 | | | *,e | | 3D Systems Corp | | $ | 4,487 | |
| | 3,227,800 | | | *,e | | Alcatel S.A. | | | 14,324 | |
| | 5,899,310 | | | | | Alcatel-Lucent (ADR) | | | 25,957 | |
| | 77,972 | | | | | Amphenol Corp (Class A) | | | 6,954 | |
| | 1,359,361 | | | d | | Apple, Inc | | | 762,751 | |
| | 4,600 | | | e | | CDW Corp | | | 107 | |
| | 865,000 | | | | | Cisco Systems, Inc | | | 19,419 | |
| | 11,630 | | | * | | CommScope Holding Co, Inc | | | 220 | |
| | 9,138 | | | *,e | | Dolby Laboratories, Inc (Class A) | | | 352 | |
| | 507,771 | | | | | EMC Corp | | | 12,770 | |
| | 160,868 | | | * | | F5 Networks, Inc | | | 14,616 | |
| | 46,785 | | | | | Flir Systems, Inc | | | 1,408 | |
| | 9,592 | | | | | Harris Corp | | | 670 | |
| | 593,400 | | | | | Hewlett-Packard Co | | | 16,603 | |
| | 15,623 | | | *,e | | IPG Photonics Corp | | | 1,212 | |
| | 82,476 | | | * | | JDS Uniphase Corp | | | 1,071 | |
| | 362,542 | | | * | | Juniper Networks, Inc | | | 8,183 | |
| | 305,766 | | | | | Motorola, Inc | | | 20,639 | |
| | 45,679 | | | | | National Instruments Corp | | | 1,463 | |
| | 288,140 | | | * | | NCR Corp | | | 9,814 | |
| | 664,576 | | | | | NetApp, Inc | | | 27,341 | |
| | 3,145 | | | *,e | | Nimble Storage, Inc | | | 142 | |
| | 16,108 | | | *,e | | Palo Alto Networks, Inc | | | 926 | |
| | 2,286,344 | | | | | Qualcomm, Inc | | | 169,761 | |
| | 74,842 | | | * | | Riverbed Technology, Inc | | | 1,353 | |
| | 179,154 | | | | | SanDisk Corp | | | 12,638 | |
| | 248,500 | | | | | Seagate Technology, Inc | | | 13,956 | |
| | 118,967 | | | * | | Stratasys Ltd | | | 16,025 | |
| | 124,224 | | | * | | Trimble Navigation Ltd | | | 4,311 | |
| | 92,200 | | | *,e | | Ubiquiti Networks, Inc | | | 4,238 | |
| | 385,100 | | | | | Western Digital Corp | | | 32,310 | |
| | 2,333 | | | * | | Zebra Technologies Corp (Class A) | | | 126 | |
| | | | | | | TOTAL TECHNOLOGY HARDWARE & EQUIPMENT | | | 1,206,147 | |
| | | | | | | | | | | |
| TELECOMMUNICATION SERVICES - 1.3% | | | | |
| | 162,034 | | | * | | Crown Castle International Corp | | | 11,898 | |
| | 27,363 | | | * | | Level 3 Communications, Inc | | | 908 | |
| | 61,701 | | | * | | SBA Communications Corp (Class A) | | | 5,543 | |
| | 1,027,900 | | | | | Softbank Corp | | | 90,199 | |
| | 75,067 | | | * | | Sprint Corp | | | 807 | |
| | 821,239 | | | * | | T-Mobile US, Inc | | | 27,626 | |
| | 72,292 | | | * | | tw telecom inc (Class A) | | | 2,203 | |
| | 2,429,547 | | | | | Verizon Communications, Inc | | | 119,388 | |
| | 276,548 | | | e | | Windstream Holdings, Inc | | | 2,207 | |
| | | | | | | TOTAL TELECOMMUNICATION SERVICES | | | 260,779 | |
COLLEGE RETIREMENT EQUITIES FUND - Growth Account
| SHARES | | | | | COMPANY | | RATE | | MATURITY
DATE | | VALUE
(000) | |
| TRANSPORTATION - 3.4% | | | | | | | | | |
| | 333,265 | | | | | Alaska Air Group, Inc | | | | | | | $ | 24,452 | |
| | 34,025 | | | * | | Amerco, Inc | | | | | | | | 8,093 | |
| | 51,500 | | | *,e | | American Airlines Group, Inc | | | | | | | | 1,300 | |
| | 224,665 | | | * | | Avis Budget Group, Inc | | | | | | | | 9,081 | |
| | 177,383 | | | | | CH Robinson Worldwide, Inc | | | | | | | | 10,349 | |
| | 64,665 | | | | | Con-Way, Inc | | | | | | | | 2,568 | |
| | 86,761 | | | | | Copa Holdings S.A. (Class A) | | | | | | | | 13,891 | |
| | 247,183 | | | | | CSX Corp | | | | | | | | 7,111 | |
| | 2,576,265 | | | | | Delta Air Lines, Inc | | | | | | | | 70,770 | |
| | 294,548 | | | | | Expeditors International of Washington, Inc | | | | | | | | 13,034 | |
| | 344,720 | | | | | FedEx Corp | | | | | | | | 49,560 | |
| | 74,061 | | | * | | Genesee & Wyoming, Inc (Class A) | | | | | | | | 7,114 | |
| | 1,724,998 | | | * | | Hertz Global Holdings, Inc | | | | | | | | 49,369 | |
| | 45,410 | | | | | J.B. Hunt Transport Services, Inc | | | | | | | | 3,510 | |
| | 945,385 | | | | | Kansas City Southern Industries, Inc | | | | | | | | 117,067 | |
| | 85,049 | | | * | | Kirby Corp | | | | | | | | 8,441 | |
| | 89,762 | | | * | | Landstar System, Inc | | | | | | | | 5,157 | |
| | 475,000 | | | e | | Latam Airlines Group S.A. (ADR) | | | | | | | | 7,747 | |
| | 28,409 | | | | | Norfolk Southern Corp | | | | | | | | 2,637 | |
| | 93,320 | | | * | | Old Dominion Freight Line | | | | | | | | 4,948 | |
| | 1,340,000 | | | * | | Royal Mail plc | | | | | | | | 12,648 | |
| | 97,746 | | | | | Ryder System, Inc | | | | | | | | 7,212 | |
| | 1,424,676 | | | | | Southwest Airlines Co | | | | | | | | 26,841 | |
| | 241,000 | | | * | | Spirit Airlines, Inc | | | | | | | | 10,944 | |
| | 354,500 | | | *,e | | Swift Transportation Co, Inc | | | | | | | | 7,873 | |
| | 171,935 | | | * | | UAL Corp | | | | | | | | 6,504 | |
| | 675,724 | | | | | Union Pacific Corp | | | | | | | | 113,522 | |
| | 475,560 | | | | | United Parcel Service, Inc (Class B) | | | | | | | | 49,972 | |
| | | | | | | TOTAL TRANSPORTATION | | | | | | | | 651,715 | |
| | | | | | | | | | | | | | | | |
| UTILITIES - 0.1% | | | | | | | | | |
| | 299,200 | | | | | AES Corp | | | | | | | | 4,341 | |
| | 77,671 | | | | | Aqua America, Inc | | | | | | | | 1,832 | |
| | 135,510 | | | * | | Calpine Corp | | | | | | | | 2,644 | |
| | 24,872 | | | | | ITC Holdings Corp | | | | | | | | 2,383 | |
| | 93,850 | | | | | Oneok, Inc | | | | | | | | 5,836 | |
| | 12,825 | | | | | Questar Corp | | | | | | | | 295 | |
| | | | | | | TOTAL UTILITIES | | | | | | | | 17,331 | |
| | | | | | | | | | | | | | | | |
| | | | | | | TOTAL COMMON STOCKS | | | | | | | | 19,216,937 | |
| | | | | | | (Cost $14,251,762) | | | | | | | | | |
| | | | | | | | | | | | | | | | |
| | | | | | | | | | | | | | | | |
| PRINCIPAL | | | | | ISSUER | | | | | | | | | |
| SHORT-TERM INVESTMENTS - 2.6% | | | | | | | | | |
| | | | | | | | | | |
| GOVERNMENT AGENCY DEBT - 0.1% | | | | | | | | | |
| $ | 10,000,000 | | | | | Federal Home Loan Mortgage Corp (FHLMC) | | 0.040 | % | | 01/21/14 | | | 10,000 | |
| | | | | | | TOTAL GOVERNMENT AGENCY DEBT | | | | | | | | 10,000 | |
COLLEGE RETIREMENT EQUITIES FUND - Growth Account
| PRINCIPAL | | | | | ISSUER | | RATE | | MATURITY
DATE | | VALUE
(000) | |
| TREASURY DEBT - 0.8% | | | | | | | | | |
| $ | 3,200,000 | | | | | United States Treasury Bill | | 0.056 | % | | 02/27/14 | | $ | 3,200 | |
| | 34,350,000 | | | d | | United States Treasury Bill | | 0.070-0.081 | | | 03/06/14 | | | 34,347 | |
| | 38,900,000 | | | d | | United States Treasury Bill | | 0.053-0.066 | | | 03/13/14 | | | 38,897 | |
| | 10,500,000 | | | | | United States Treasury Bill | | 0.075 | | | 04/10/14 | | | 10,498 | |
| | 20,000,000 | | | d | | United States Treasury Bill | | 0.061-0.063 | | | 04/17/14 | | | 19,998 | |
| | 6,500,000 | | | d | | United States Treasury Bill | | 0.077 | | | 04/24/14 | | | 6,499 | |
| | 4,500,000 | | | d | | United States Treasury Bill | | 0.088 | | | 05/29/14 | | | 4,499 | |
| | 6,000,000 | | | | | United States Treasury Bill | | 0.070 | | | 06/19/14 | | | 5,998 | |
| | 11,000,000 | | | d | | United States Treasury Bill | | 0.098 | | | 06/26/14 | | | 10,995 | |
| | 18,000,000 | | | d | | United States Treasury Bill | | 0.063-0.108 | | | 07/24/14 | | | 17,992 | |
| | 6,000,000 | | | d | | United States Treasury Bill | | 0.071 | | | 08/21/14 | | | 5,997 | |
| | | | | | | TOTAL TREASURY DEBT | | | | | | | | 158,920 | |
| | | | | | | | | | | | | | | | |
| SHARES | | | | | COMPANY | | | | | | | | | |
| INVESTMENTS IN REGISTERED INVESTMENT COMPANIES - 1.7% | | | | | | | |
| | | | | | | TIAA-CREF Short Term Lending Portfolio of the State Street | | | | |
| | 338,935,715 | | | a,c | | Navigator Securities Lending Trust | | | | | | | | 338,936 | |
| | | | | | | TOTAL INVESTMENTS IN REGISTERED INVESTMENT COMPANIES | | 338,936 | |
| | | | | | | | | | | | | | | | |
| | | | | | | TOTAL SHORT-TERM INVESTMENTS | | | | | | 507,856 | |
| | | | | | | (Cost $507,847) | | | | | | | | | |
| | | | | | | TOTAL INVESTMENTS - 101.6% | | | | | | | | 19,724,793 | |
| | | | | | | (Cost $14,759,609) | | | | | | | | | |
| | | | | | | OTHER ASSETS & LIABILITIES, NET - (1.6)% | | | | | | (311,131) | |
| | | | | | | NET ASSETS - 100.0% | | | | | | | $ | 19,413,662 | |
| | | | | | | | | | | |
| | | | | | | Abbreviation(s): | | | | |
| ADR | | | | | American Depositary Receipt |
| | | | | | |
| | * | | | | | Non-income producing. |
| | a | | | | | Affiliated holding. |
| | c | | | | | Investments made with cash collateral received from securites on loan. |
| | d | | | | | All or a portion of these securities have been segregated by the custodian to cover margin or other requirements on open futures transactions. |
| | e | | | | | All or a portion of these securities are out on loan. The aggregate value of securities on loan is $332,501,000. |
| | g | | | | | Security is exempt from registration under Rule 144(A) of the Securities Act of 1933 and may be resold in transactions exempt from registration to qualified institutional buyers. At December 31, 2013, the aggregate value of these securities amounted to $18,944,000 or 0.1% of net assets. |
| | | | | | | |
| | | | | | | Cost amounts are in thousands. |
COLLEGE RETIREMENT EQUITIES FUND - Equity Index Account
COLLEGE RETIREMENT EQUITIES FUND
EQUITY INDEX ACCOUNT
SCHEDULE OF INVESTMENTS
December 31, 2013
| SHARES | | | | COMPANY | | VALUE
(000) | |
| COMMON STOCKS - 99.6% | | |
| | | |
| AUTOMOBILES & COMPONENTS - 1.1% | | | | |
| | 26,243 | | | | | Allison Transmission Holdings, Inc | | $ | 725 | |
| | 51,119 | | | * | | American Axle & Manufacturing Holdings, Inc | | | 1,045 | |
| | 175,846 | | | | | BorgWarner, Inc | | | 9,832 | |
| | 49,248 | | | | | Cooper Tire & Rubber Co | | | 1,184 | |
| | 115,365 | | | | | Dana Holding Corp | | | 2,264 | |
| | 237,669 | | | | | Delphi Automotive plc | | | 14,291 | |
| | 18,792 | | | * | | Dorman Products, Inc | | | 1,054 | |
| | 16,941 | | | * | | Drew Industries, Inc | | | 867 | |
| | 14,344 | | | * | | Federal Mogul Corp (Class A) | | | 282 | |
| | 2,944,548 | | | | | Ford Motor Co | | | 45,434 | |
| | 11,841 | | | * | | Fuel Systems Solutions, Inc | | | 164 | |
| | 634,535 | | | * | | General Motors Co | | | 25,934 | |
| | 109,188 | | | | | Gentex Corp | | | 3,602 | |
| | 27,497 | | | * | | Gentherm, Inc | | | 737 | |
| | 186,602 | | | | | Goodyear Tire & Rubber Co | | | 4,451 | |
| | 170,283 | | | | | Harley-Davidson, Inc | | | 11,790 | |
| | 521,991 | | | | | Johnson Controls, Inc | | | 26,778 | |
| | 61,452 | | | | | Lear Corp | | | 4,976 | |
| | 36,302 | | | * | | Modine Manufacturing Co | | | 465 | |
| | 7,549 | | | | | Remy International, Inc | | | 176 | |
| | 4,154 | | | * | | Shiloh Industries, Inc | | | 81 | |
| | 30,024 | | | | | Spartan Motors, Inc | | | 201 | |
| | 15,087 | | | | | Standard Motor Products, Inc | | | 555 | |
| | 20,247 | | | * | | Stoneridge, Inc | | | 258 | |
| | 17,815 | | | | | Superior Industries International, Inc | | | 368 | |
| | 46,120 | | | * | | Tenneco, Inc | | | 2,609 | |
| | 63,754 | | | *,e | | Tesla Motors, Inc | | | 9,587 | |
| | 33,978 | | | | | Thor Industries, Inc | | | 1,877 | |
| | 5,700 | | | * | | Tower International, Inc | | | 122 | |
| | 82,367 | | | * | | TRW Automotive Holdings Corp | | | 6,127 | |
| | 39,055 | | | * | | Visteon Corp | | | 3,198 | |
| | 21,322 | | | * | | Winnebago Industries, Inc | | | 585 | |
| | | | | | | TOTAL AUTOMOBILES & COMPONENTS | | | 181,619 | |
| | | | | |
| BANKS - 3.4% | | | | |
| | 11,459 | | | | | 1st Source Corp | | | 366 | |
| | 22,198 | | | | | 1st United Bancorp, Inc | | | 169 | |
| | 5,520 | | | | | Access National Corp | | | 83 | |
| | 5,882 | | | | | American National Bankshares, Inc | | | 154 | |
| | 18,171 | | | * | | Ameris Bancorp | | | 384 | |
COLLEGE RETIREMENT EQUITIES FUND - Equity Index Account
| SHARES | | | | COMPANY | | VALUE
(000) | |
| | 7,069 | | | | | Ames National Corp | | $ | 158 | |
| | 24,400 | | | | | Apollo Residential Mortgage | | | 361 | |
| | 7,201 | | | e | | Arrow Financial Corp | | | 191 | |
| | 127,805 | | | | | Associated Banc-Corp | | | 2,224 | |
| | 66,701 | | | | | Astoria Financial Corp | | | 922 | |
| | 6,248 | | | e | | Banc of California, Inc | | | 84 | |
| | 5,016 | | | | | Bancfirst Corp | | | 281 | |
| | 21,466 | | | | | Banco Latinoamericano de Exportaciones S.A. (Class E) | | | 601 | |
| | 73,283 | | | | | Bancorpsouth, Inc | | | 1,863 | |
| | 41,404 | | | | | Bank Mutual Corp | | | 290 | |
| | 34,126 | | | | | Bank of Hawaii Corp | | | 2,018 | |
| | 4,416 | | | | | Bank of Kentucky Financial Corp | | | 163 | |
| | 3,864 | | | | | Bank of Marin Bancorp | | | 168 | |
| | 23,602 | | | | | Bank of the Ozarks, Inc | | | 1,336 | |
| | 17,629 | | | | | BankFinancial Corp | | | 161 | |
| | 48,968 | | | | | BankUnited | | | 1,612 | |
| | 14,911 | | | | | Banner Corp | | | 668 | |
| | 3,044 | | | | | Bar Harbor Bankshares | | | 122 | |
| | 537,129 | | | | | BB&T Corp | | | 20,046 | |
| | 59,137 | | | | | BBCN Bancorp, Inc | | | 981 | |
| | 5,242 | | | * | | BBX Capital Corp | | | 82 | |
| | 23,421 | | | * | | Beneficial Mutual Bancorp, Inc | | | 256 | |
| | 17,538 | | | | | Berkshire Hills Bancorp, Inc | | | 478 | |
| | 13,481 | | | | | BNC Bancorp | | | 231 | |
| | 9,275 | | | * | | BofI Holding, Inc | | | 727 | |
| | 21,305 | | | | | BOK Financial Corp | | | 1,413 | |
| | 59,217 | | | | | Boston Private Financial Holdings, Inc | | | 747 | |
| | 6,664 | | | | | Bridge Bancorp, Inc | | | 173 | |
| | 7,190 | | | * | | Bridge Capital Holdings | | | 148 | |
| | 54,590 | | | | | Brookline Bancorp, Inc | | | 522 | |
| | 10,466 | | | | | Bryn Mawr Bank Corp | | | 316 | |
| | 2,500 | | | | | C&F Financial Corp | | | 114 | |
| | 5,527 | | | | | Camden National Corp | | | 233 | |
| | 16,948 | | | * | | Capital Bank Financial Corp | | | 386 | |
| | 9,158 | | | * | | Capital City Bank Group, Inc | | | 108 | |
| | 149,432 | | | | | CapitalSource, Inc | | | 2,147 | |
| | 111,251 | | | | | Capitol Federal Financial | | | 1,347 | |
| | 22,480 | | | | | Cardinal Financial Corp | | | 405 | |
| | 60,166 | | | | | Cathay General Bancorp | | | 1,608 | |
| | 9,768 | | | | | Center Bancorp, Inc | | | 183 | |
| | 23,433 | | | | | Centerstate Banks of Florida, Inc | | | 238 | |
| | 16,733 | | | | | Central Pacific Financial Corp | | | 336 | |
| | 2,883 | | | | | Century Bancorp, Inc | | | 96 | |
| | 17,428 | | | | | Charter Financial Corp | | | 188 | |
COLLEGE RETIREMENT EQUITIES FUND - Equity Index Account
| SHARES | | | | COMPANY | | VALUE
(000) | |
| | 21,008 | | | | | Chemical Financial Corp | | $ | 665 | |
| | 2,792 | | | | | Chemung Financial Corp | | | 95 | |
| | 153,189 | | | | | CIT Group, Inc | | | 7,986 | |
| | 9,568 | | | | | Citizens & Northern Corp | | | 197 | |
| | 12,921 | | | e | | City Holding Co | | | 599 | |
| | 35,413 | | | | | City National Corp | | | 2,805 | |
| | 10,007 | | | | | Clifton Savings Bancorp, Inc | | | 128 | |
| | 9,772 | | | | | CNB Financial Corp | | | 186 | |
| | 26,184 | | | | | CoBiz, Inc | | | 313 | |
| | 38,948 | | | | | Columbia Banking System, Inc | | | 1,071 | |
| | 141,895 | | | | | Comerica, Inc | | | 6,746 | |
| | 61,862 | | | | | Commerce Bancshares, Inc | | | 2,778 | |
| | 32,481 | | | | | Community Bank System, Inc | | | 1,289 | |
| | 11,562 | | | | | Community Trust Bancorp, Inc | | | 522 | |
| | 7,261 | | | * | | CommunityOne Bancorp | | | 93 | |
| | 1,351 | | | * | | ConnectOne Bancorp, Inc | | | 54 | |
| | 5,720 | | | * | | CU Bancorp | | | 100 | |
| | 41,027 | | | e | | Cullen/Frost Bankers, Inc | | | 3,054 | |
| | 15,177 | | | * | | Customers Bancorp, Inc | | | 311 | |
| | 67,239 | | | | | CVB Financial Corp | | | 1,148 | |
| | 23,810 | | | | | Dime Community Bancshares | | | 403 | |
| | 4,837 | | | * | | Doral Financial Corp | | | 76 | |
| | 16,666 | | | * | | Eagle Bancorp, Inc | | | 510 | |
| | 103,419 | | | | | East West Bancorp, Inc | | | 3,617 | |
| | 4,559 | | | | | Enterprise Bancorp, Inc | | | 97 | |
| | 11,656 | | | | | Enterprise Financial Services Corp | | | 238 | |
| | 10,062 | | | | | ESB Financial Corp | | | 143 | |
| | 9,325 | | | | | ESSA Bancorp, Inc | | | 108 | |
| | 17,600 | | | * | | Essent Group Ltd | | | 423 | |
| | 58,626 | | | | | EverBank Financial Corp | | | 1,075 | |
| | 5,385 | | | * | | Farmers Capital Bank Corp | | | 117 | |
| | 7,387 | | | | | Federal Agricultural Mortgage Corp (Class C) | | | 253 | |
| | 7,095 | | | | | Fidelity Southern Corp | | | 118 | |
| | 665,673 | | | | | Fifth Third Bancorp | | | 13,999 | |
| | 10,211 | | | | | Financial Institutions, Inc | | | 252 | |
| | 15,337 | | | | | First Bancorp (NC) | | | 255 | |
| | 54,501 | | | * | | First Bancorp (Puerto Rico) | | | 337 | |
| | 6,485 | | | | | First Bancorp, Inc | | | 113 | |
| | 58,052 | | | | | First Busey Corp | | | 337 | |
| | 5,734 | | | | | First Citizens Bancshares, Inc (Class A) | | | 1,277 | |
| | 73,506 | | | | | First Commonwealth Financial Corp | | | 648 | |
| | 12,139 | | | | | First Community Bancshares, Inc | | | 203 | |
| | 13,926 | | | | | First Connecticut Bancorp | | | 224 | |
| | 7,726 | | | | | First Defiance Financial Corp | | | 201 | |
| | 44,691 | | | | | First Financial Bancorp | | | 779 | |
| | 24,075 | | | e | | First Financial Bankshares, Inc | | | 1,597 | |
COLLEGE RETIREMENT EQUITIES FUND - Equity Index Account
| SHARES | | | | | COMPANY | | VALUE
(000) | |
| | 8,954 | | | | | First Financial Corp | | $ | 327 | |
| | 18,506 | | | | | First Financial Holdings, Inc | | | 1,231 | |
| | 12,796 | | | | | First Financial Northwest, Inc | | | 133 | |
| | 191,562 | | | | | First Horizon National Corp | | | 2,232 | |
| | 11,762 | | | | | First Interstate Bancsystem, Inc | | | 334 | |
| | 26,538 | | | | | First Merchants Corp | | | 604 | |
| | 57,533 | | | | | First Midwest Bancorp, Inc | | | 1,009 | |
| | 3,196 | | | * | | First NBC Bank Holding Co | | | 103 | |
| | 263,698 | | | | | First Niagara Financial Group, Inc | | | 2,800 | |
| | 5,749 | | | | | First of Long Island Corp | | | 246 | |
| | 88,590 | | | | | First Republic Bank | | | 4,638 | |
| | 45,823 | | | * | | First Security Group, Inc | | | 105 | |
| | 125,914 | | | | | FirstMerit Corp | | | 2,799 | |
| | 12,395 | | | * | | Flagstar Bancorp, Inc | | | 243 | |
| | 23,200 | | | | | Flushing Financial Corp | | | 480 | |
| | 118,492 | | | | | FNB Corp | | | 1,495 | |
| | 11,394 | | | | | Fox Chase Bancorp, Inc | | | 198 | |
| | 10,443 | | | * | | Franklin Financial Corp | | | 207 | |
| | 147,923 | | | | | Fulton Financial Corp | | | 1,935 | |
| | 8,476 | | | | | German American Bancorp, Inc | | | 242 | |
| | 54,526 | | | | | Glacier Bancorp, Inc | | | 1,624 | |
| | 7,809 | | | | | Great Southern Bancorp, Inc | | | 237 | |
| | 11,166 | | | | | Guaranty Bancorp | | | 157 | |
| | 66,139 | | | | | Hancock Holding Co | | | 2,426 | |
| | 23,963 | | | | | Hanmi Financial Corp | | | 525 | |
| | 10,342 | | | | | Heartland Financial USA, Inc | | | 298 | |
| | 15,254 | | | | | Heritage Commerce Corp | | | 126 | |
| | 11,990 | | | | | Heritage Financial Corp | | | 205 | |
| | 14,409 | | | * | | Heritage Oaks Bancorp | | | 108 | |
| | 939 | | | | | Hingham Institution for Savings | | | 74 | |
| | 5,389 | | | * | | Home Bancorp, Inc | | | 102 | |
| | 36,542 | | | | | Home Bancshares, Inc | | | 1,365 | |
| | 12,641 | | | | | Home Federal Bancorp, Inc | | | 188 | |
| | 54,100 | | | | | Home Loan Servicing Solutions Ltd | | | 1,243 | |
| | 6,988 | | | | | HomeStreet, Inc | | | 140 | |
| | 16,046 | | | * | | HomeTrust Bancshares, Inc | | | 257 | |
| | 6,700 | | | | | Horizon Bancorp | | | 170 | |
| | 404,335 | | | | | Hudson City Bancorp, Inc | | | 3,813 | |
| | 11,015 | | | | | Hudson Valley Holding Corp | | | 224 | |
| | 638,291 | | | | | Huntington Bancshares, Inc | | | 6,160 | |
| | 22,669 | | | | | IBERIABANK Corp | | | 1,425 | |
| | 17,904 | | | | | Independent Bank Corp | | | 702 | |
| | 3,097 | | | | | Independent Bank Group, Inc | | | 154 | |
| | 40,567 | | | | | International Bancshares Corp | | | 1,071 | |
| | 14,254 | | | * | | Intervest Bancshares Corp | | | 107 | |
| | 40,181 | | | | | Investors Bancorp, Inc | | | 1,028 | |
COLLEGE RETIREMENT EQUITIES FUND - Equity Index Account
| SHARES | | | | COMPANY | | VALUE
(000) | |
| | 14,732 | | | * | | Kearny Financial Corp | | $ | 171 | |
| | 704,870 | | | | | Keycorp | | | 9,459 | |
| | 20,622 | | | | | Lakeland Bancorp, Inc | | | 255 | |
| | 12,420 | | | | | Lakeland Financial Corp | | | 484 | |
| | 4,421 | | | | | LCNB Corp | | | 79 | |
| | 99,016 | | | e | | M&T Bank Corp | | | 11,527 | |
| | 18,100 | | | * | | Macatawa Bank Corp | | | 90 | |
| | 15,363 | | | | | MainSource Financial Group, Inc | | | 277 | |
| | 41,491 | | | | | MB Financial, Inc | | | 1,331 | |
| | 6,437 | | | | | Mercantile Bank Corp | | | 139 | |
| | 3,784 | | | | | Merchants Bancshares, Inc | | | 127 | |
| | 7,250 | | | * | | Meridian Interstate Bancorp, Inc | | | 164 | |
| | 4,004 | | | | | Meta Financial Group, Inc | | | 161 | |
| | 11,922 | | | | | MetroCorp Bancshares, Inc | | | 180 | |
| | 245,646 | | | * | | MGIC Investment Corp | | | 2,073 | |
| | 4,068 | | | | | Middleburg Financial Corp | | | 73 | |
| | 6,667 | | | | | Midsouth Bancorp, Inc | | | 119 | |
| | 5,257 | | | | | MidWestOne Financial Group, Inc | | | 143 | |
| | 2,927 | | | * | | NASB Financial, Inc | | | 88 | |
| | 41,714 | | | | | National Bank Holdings Corp | | | 893 | |
| | 5,351 | | | | | National Bankshares, Inc | | | 197 | |
| | 89,553 | | | | | National Penn Bancshares, Inc | | | 1,015 | |
| | 17,284 | | | *,e | | Nationstar Mortgage Holdings, Inc | | | 639 | |
| | 34,107 | | | | | NBT Bancorp, Inc | | | 883 | |
| | 331,783 | | | e | | New York Community Bancorp, Inc | | | 5,591 | |
| | 19,480 | | | * | | NewBridge Bancorp | | | 146 | |
| | 43,923 | | | | | Northfield Bancorp, Inc | | | 580 | |
| | 4,751 | | | | | Northrim BanCorp, Inc | | | 125 | |
| | 76,438 | | | | | Northwest Bancshares, Inc | | | 1,130 | |
| | 10,808 | | | | | OceanFirst Financial Corp | | | 185 | |
| | 78,630 | | | * | | Ocwen Financial Corp | | | 4,360 | |
| | 33,903 | | | | | OFG Bancorp | | | 588 | |
| | 76,288 | | | | | Old National Bancorp | | | 1,173 | |
| | 9,164 | | | * | | OmniAmerican Bancorp, Inc | | | 196 | |
| | 37,788 | | | | | Oritani Financial Corp | | | 606 | |
| | 14,467 | | | | | Pacific Continental Corp | | | 231 | |
| | 12,060 | | | * | | Pacific Premier Bancorp, Inc | | | 190 | |
| | 30,305 | | | e | | PacWest Bancorp | | | 1,279 | |
| | 2,932 | | | * | | Palmetto Bancshares, Inc | | | 38 | |
| | 9,233 | | | e | | Park National Corp | | | 785 | |
| | 33,018 | | | | | Park Sterling Bank | | | 236 | |
| | 8,389 | | | | | Peapack Gladstone Financial Corp | | | 160 | |
| | 2,964 | | | | | Penns Woods Bancorp, Inc | | | 151 | |
| | 10,509 | | | * | | Pennsylvania Commerce Bancorp, Inc | | | 226 | |
| | 9,540 | | | * | | PennyMac Financial Services, Inc | | | 167 | |
| | 6,808 | | | | | Peoples Bancorp, Inc | | | 153 | |
| | 236,388 | | | e | | People’s United Financial, Inc | | | 3,574 | |
COLLEGE RETIREMENT EQUITIES FUND - Equity Index Account
| SHARES | | | | COMPANY | | VALUE
(000) | |
| | 25,469 | | | | | Pinnacle Financial Partners, Inc | | $ | 828 | |
| | 403,902 | | | | | PNC Financial Services Group, Inc | | | 31,335 | |
| | 77,233 | | | * | | Popular, Inc | | | 2,219 | |
| | 8,859 | | | * | | Preferred Bank | | | 178 | |
| | 49,485 | | | | | PrivateBancorp, Inc | | | 1,432 | |
| | 45,722 | | | | | Prosperity Bancshares, Inc | | | 2,898 | |
| | 7,003 | | | | | Provident Financial Holdings, Inc | | | 105 | |
| | 45,191 | | | | | Provident Financial Services, Inc | | | 873 | |
| | 131,009 | | | e | | Radian Group, Inc | | | 1,850 | |
| | 1,076,498 | | | | | Regions Financial Corp | | | 10,647 | |
| | 23,438 | | | | | Renasant Corp | | | 737 | |
| | 6,104 | | | | | Republic Bancorp, Inc (Class A) | | | 150 | |
| | 22,920 | | | | | Rockville Financial, Inc | | | 326 | |
| | 20,998 | | | | | S&T Bancorp, Inc | | | 531 | |
| | 10,870 | | | | | S.Y. Bancorp, Inc | | | 347 | |
| | 18,232 | | | | | Sandy Spring Bancorp, Inc | | | 514 | |
| | 11,149 | | | * | | Seacoast Banking Corp of Florida | | | 136 | |
| | 8,919 | | | | | Sierra Bancorp | | | 143 | |
| | 35,982 | | | * | | Signature Bank | | | 3,865 | |
| | 13,207 | | | | | Simmons First National Corp (Class A) | | | 491 | |
| | 12,795 | | | e | | Southside Bancshares, Inc | | | 350 | |
| | 14,769 | | | * | | Southwest Bancorp, Inc | | | 235 | |
| | 24,453 | | | | | State Bank & Trust Co | | | 445 | |
| | 16,183 | | | | | StellarOne Corp | | | 390 | |
| | 67,412 | | | | | Sterling Bancorp/DE | | | 901 | |
| | 25,576 | | | | | Sterling Financial Corp | | | 872 | |
| | 7,140 | | | * | | Suffolk Bancorp | | | 149 | |
| | 29,193 | | | * | | Sun Bancorp, Inc | | | 103 | |
| | 413,290 | | | | | SunTrust Banks, Inc | | | 15,213 | |
| | 141,602 | | | | | Susquehanna Bancshares, Inc | | | 1,818 | |
| | 34,283 | | | * | | SVB Financial Group | | | 3,595 | |
| | 737,443 | | | | | Synovus Financial Corp | | | 2,655 | |
| | 12,643 | | | * | | Taylor Capital Group, Inc | | | 336 | |
| | 122,960 | | | | | TCF Financial Corp | | | 1,998 | |
| | 9,400 | | | | | Territorial Bancorp, Inc | | | 218 | |
| | 32,020 | | | * | | Texas Capital Bancshares, Inc | | | 1,992 | |
| | 53,268 | | | * | | TFS Financial Corp | | | 645 | |
| | 26,827 | | | * | | The Bancorp, Inc | | | 480 | |
| | 11,138 | | | | | Tompkins Trustco, Inc | | | 572 | |
| | 18,385 | | | e | | TowneBank | | | 283 | |
| | 4,100 | | | * | | Tree.com, Inc | | | 135 | |
| | 12,050 | | | | | Trico Bancshares | | | 342 | |
| | 5,095 | | | *,e | | Tristate Capital Holdings, Inc | | | 60 | |
| | 72,196 | | | | | Trustco Bank Corp NY | | | 518 | |
| | 53,268 | | | | | Trustmark Corp | | | 1,430 | |
| | 28,301 | | | | | UMB Financial Corp | | | 1,819 | |
| | 85,518 | | | e | | Umpqua Holdings Corp | | | 1,637 | |
COLLEGE RETIREMENT EQUITIES FUND - Equity Index Account
| SHARES | | | | COMPANY | | VALUE
(000) | |
| | 14,087 | | | e | | Union Bankshares Corp | | $ | 349 | |
| | 38,221 | | | e | | United Bankshares, Inc | | | 1,202 | |
| | 31,617 | | | * | | United Community Banks, Inc | | | 561 | |
| | 30,361 | | | * | | United Community Financial Corp | | | 108 | |
| | 15,445 | | | | | United Financial Bancorp, Inc | | | 292 | |
| | 12,704 | | | | | Univest Corp of Pennsylvania | | | 263 | |
| | 1,412,378 | | | | | US Bancorp | | | 57,060 | |
| | 153,040 | | | e | | Valley National Bancorp | | | 1,549 | |
| | 9,171 | | | *,e | | VantageSouth Bancshares, Inc | | | 48 | |
| | 29,696 | | | | | ViewPoint Financial Group | | | 815 | |
| | 20,684 | | | * | | Virginia Commerce Bancorp | | | 351 | |
| | 11,958 | | | * | | Walker & Dunlop, Inc | | | 193 | |
| | 12,184 | | | | | Washington Banking Co | | | 216 | |
| | 81,549 | | | | | Washington Federal, Inc | | | 1,899 | |
| | 10,818 | | | | | Washington Trust Bancorp, Inc | | | 403 | |
| | 5,568 | | | * | | Waterstone Financial, Inc | | | 62 | |
| | 68,818 | | | | | Webster Financial Corp | | | 2,146 | |
| | 3,680,732 | | | | | Wells Fargo & Co | | | 167,105 | |
| | 19,012 | | | | | WesBanco, Inc | | | 608 | |
| | 11,970 | | | | | West Bancorporation, Inc | | | 189 | |
| | 23,501 | | | e | | Westamerica Bancorporation | | | 1,327 | |
| | 56,653 | | | * | | Western Alliance Bancorp | | | 1,352 | |
| | 23,121 | | | | | Westfield Financial, Inc | | | 172 | |
| | 44,266 | | | | | Wilshire Bancorp, Inc | | | 484 | |
| | 27,726 | | | | | Wintrust Financial Corp | | | 1,279 | |
| | 5,884 | | | | | WSFS Financial Corp | | | 456 | |
| | 10,983 | | | * | | Yadkin Financial Corp | | | 187 | |
| | 139,772 | | | | | Zions Bancorporation | | | 4,188 | |
| | | | | | | TOTAL BANKS | | | 546,815 | |
| | | | | | | | | | | |
| CAPITAL GOODS - 8.6% | | | | |
| | 526,182 | | | | | 3M Co | | | 73,797 | |
| | 58,296 | | | | | A.O. Smith Corp | | | 3,145 | |
| | 19,918 | | | | | Aaon, Inc | | | 636 | |
| | 29,552 | | | | | AAR Corp | | | 828 | |
| | 41,768 | | | * | | Accuride Corp | | | 156 | |
| | 20,426 | | | | | Aceto Corp | | | 511 | |
| | 56,076 | | | | | Actuant Corp (Class A) | | | 2,055 | |
| | 32,751 | | | | | Acuity Brands, Inc | | | 3,580 | |
| | 78,523 | | | * | | Aecom Technology Corp | | | 2,311 | |
| | 28,439 | | | * | | Aegion Corp | | | 623 | |
| | 14,335 | | | * | | Aerovironment, Inc | | | 418 | |
| | 74,289 | | | | | AGCO Corp | | | 4,397 | |
| | 52,613 | | | | | Air Lease Corp | | | 1,635 | |
| | 52,242 | | | | | Aircastle Ltd | | | 1,001 | |
COLLEGE RETIREMENT EQUITIES FUND - Equity Index Account
| SHARES | | | | COMPANY | | VALUE
(000) | |
| | 5,366 | | | | | Alamo Group, Inc | | $ | 326 | |
| | 23,047 | | | | | Albany International Corp (Class A) | | | 828 | |
| | 76,324 | | | * | | Allegion plc | | | 3,373 | |
| | 24,535 | | | | | Alliant Techsystems, Inc | | | 2,985 | |
| | 20,492 | | | | | Altra Holdings, Inc | | | 701 | |
| | 13,776 | | | * | | Ameresco, Inc | | | 133 | |
| | 7,032 | | | e | | American Railcar Industries, Inc | | | 322 | |
| | 7,536 | | | | | American Science & Engineering, Inc | | | 542 | |
| | 35,994 | | | *,e | | American Superconductor Corp | | | 59 | |
| | 8,518 | | | * | | American Woodmark Corp | | | 337 | |
| | 186,300 | | | | | Ametek, Inc | | | 9,812 | |
| | 7,032 | | | | | Ampco-Pittsburgh Corp | | | 137 | |
| | 24,223 | | | * | | API Technologies Corp | | | 83 | |
| | 25,458 | | | | | Apogee Enterprises, Inc | | | 914 | |
| | 32,556 | | | | | Applied Industrial Technologies, Inc | | | 1,598 | |
| | 9,512 | | | | | Argan, Inc | | | 262 | |
| | 18,986 | | | * | | Armstrong World Industries, Inc | | | 1,094 | |
| | 73,992 | | | * | | ArvinMeritor, Inc | | | 772 | |
| | 15,638 | | | | | Astec Industries, Inc | | | 604 | |
| | 11,879 | | | * | | Astronics Corp | | | 606 | |
| | 1,935 | | | *,e | | Astronics Corp (Class B) | | | 98 | |
| | 19,364 | | | | | AZZ, Inc | | | 946 | |
| | 85,193 | | | | | Babcock & Wilcox Co | | | 2,913 | |
| | 39,660 | | | | | Barnes Group, Inc | | | 1,519 | |
| | 75,123 | | | * | | BE Aerospace, Inc | | | 6,538 | |
| | 37,178 | | | * | | Beacon Roofing Supply, Inc | | | 1,498 | |
| | 35,059 | | | * | | Blount International, Inc | | | 507 | |
| | 21,793 | | | * | | Bluelinx Holdings, Inc | | | 43 | |
| | 578,448 | | | | | Boeing Co | | | 78,952 | |
| | 35,197 | | | | | Brady Corp (Class A) | | | 1,089 | |
| | 36,516 | | | | | Briggs & Stratton Corp | | | 795 | |
| | 33,815 | | | * | | Builders FirstSource, Inc | | | 241 | |
| | 13,167 | | | * | | CAI International, Inc | | | 310 | |
| | 274,193 | | | *,e | | Capstone Turbine Corp | | | 354 | |
| | 48,667 | | | | | Carlisle Cos, Inc | | | 3,864 | |
| | 501,161 | | | | | Caterpillar, Inc | | | 45,510 | |
| | 23,360 | | | * | | Chart Industries, Inc | | | 2,234 | |
| | 76,371 | | | | | Chicago Bridge & Iron Co NV | | | 6,349 | |
| | 12,832 | | | | | CIRCOR International, Inc | | | 1,037 | |
| | 37,827 | | | | | Clarcor, Inc | | | 2,434 | |
| | 6,482 | | | | | Coleman Cable, Inc | | | 170 | |
| | 65,289 | | | * | | Colfax Corp | | | 4,158 | |
| | 14,727 | | | * | | Columbus McKinnon Corp | | | 400 | |
| | 33,040 | | | | | Comfort Systems USA, Inc | | | 641 | |
| | 18,507 | | | * | | Commercial Vehicle Group, Inc | | | 135 | |
| | 36,855 | | | | | Crane Co | | | 2,479 | |
| | 15,215 | | | | | Cubic Corp | | | 801 | |
COLLEGE RETIREMENT EQUITIES FUND - Equity Index Account
| SHARES | | | | COMPANY | | VALUE
(000) | |
| | 145,144 | | | | | Cummins, Inc | | $ | 20,461 | |
| | 35,284 | | | | | Curtiss-Wright Corp | | | 2,196 | |
| | 456,318 | | | | | Danaher Corp | | | 35,228 | |
| | 295,621 | | | | | Deere & Co | | | 26,999 | |
| | 57,673 | | | * | | DigitalGlobe, Inc | | | 2,373 | |
| | 112,137 | | | | | Donaldson Co, Inc | | | 4,873 | |
| | 21,128 | | | | | Douglas Dynamics, Inc | | | 355 | |
| | 130,396 | | | | | Dover Corp | | | 12,588 | |
| | 8,048 | | | * | | Ducommun, Inc | | | 240 | |
| | 7,198 | | | * | | DXP Enterprises, Inc | | | 829 | |
| | 25,816 | | | * | | Dycom Industries, Inc | | | 717 | |
| | 11,541 | | | | | Dynamic Materials Corp | | | 251 | |
| | 360,401 | | | | | Eaton Corp | | | 27,434 | |
| | 50,074 | | | | | EMCOR Group, Inc | | | 2,125 | |
| | 548,008 | | | | | Emerson Electric Co | | | 38,459 | |
| | 15,305 | | | | | Encore Wire Corp | | | 830 | |
| | 34,170 | | | *,e | | Energy Recovery, Inc | | | 190 | |
| | 37,162 | | | | | EnerSys | | | 2,605 | |
| | 12,394 | | | * | | Engility Holdings, Inc | | | 414 | |
| | 11,300 | | | *,e | | Enphase Energy, Inc | | | 72 | |
| | 15,889 | | | *,e | | EnPro Industries, Inc | | | 916 | |
| | 2,980 | | | *,e | | Erickson Air-Crane, Inc | | | 62 | |
| | 20,938 | | | | | ESCO Technologies, Inc | | | 717 | |
| | 23,350 | | | * | | Esterline Technologies Corp | | | 2,381 | |
| | 146,394 | | | | | Exelis, Inc | | | 2,790 | |
| | 225,819 | | | | | Fastenal Co | | | 10,729 | |
| | 50,117 | | | * | | Federal Signal Corp | | | 734 | |
| | 37,173 | | | * | | Flow International Corp | | | 150 | |
| | 108,780 | | | | | Flowserve Corp | | | 8,575 | |
| | 123,894 | | | | | Fluor Corp | | | 9,947 | |
| | 126,637 | | | | | Fortune Brands Home & Security, Inc | | | 5,787 | |
| | 36,490 | | | | | Franklin Electric Co, Inc | | | 1,629 | |
| | 10,761 | | | | | Freightcar America, Inc | | | 286 | |
| | 126,167 | | | *,e | | FuelCell Energy, Inc | | | 178 | |
| | 25,764 | | | * | | Furmanite Corp | | | 274 | |
| | 35,871 | | | | | GATX Corp | | | 1,871 | |
| | 46,010 | | | *,e | | GenCorp, Inc | | | 829 | |
| | 39,263 | | | | | Generac Holdings, Inc | | | 2,224 | |
| | 37,226 | | | | | General Cable Corp | | | 1,095 | |
| | 227,054 | | | | | General Dynamics Corp | | | 21,695 | |
| | 7,883,007 | | | | | General Electric Co | | | 220,961 | |
| | 22,869 | | | * | | Gibraltar Industries, Inc | | | 425 | |
| | 6,109 | | | | | Global Brass & Copper Holdings, Inc | | | 101 | |
| | 12,250 | | | | | Global Power Equipment Group, Inc | | | 240 | |
| | 16,191 | | | | | Gorman-Rupp Co | | | 541 | |
| | 47,550 | | | | | Graco, Inc | | | 3,715 | |
| | 93,933 | | | *,e | | GrafTech International Ltd | | | 1,055 | |
COLLEGE RETIREMENT EQUITIES FUND - Equity Index Account
| SHARES | | | | COMPANY | | VALUE
(000) | |
| | 9,470 | | | | | Graham Corp | | $ | 344 | |
| | 29,395 | | | | | Granite Construction, Inc | | | 1,028 | |
| | 44,924 | | | * | | Great Lakes Dredge & Dock Corp | | | 413 | |
| | 18,407 | | | * | | Greenbrier Cos, Inc | | | 604 | |
| | 34,315 | | | | | Griffon Corp | | | 453 | |
| | 21,180 | | | * | | H&E Equipment Services, Inc | | | 628 | |
| | 8,389 | | | | | Hardinge, Inc | | | 121 | |
| | 61,544 | | | | | Harsco Corp | | | 1,725 | |
| | 46,800 | | | * | | HD Supply Holdings, Inc | | | 1,124 | |
| | 49,798 | | | | | Heico Corp | | | 2,886 | |
| | 75,795 | | | * | | Hexcel Corp | | | 3,387 | |
| | 599,834 | | | | | Honeywell International, Inc | | | 54,807 | |
| | 12,024 | | | | | Houston Wire & Cable Co | | | 161 | |
| | 45,393 | | | | | Hubbell, Inc (Class B) | | | 4,943 | |
| | 37,789 | | | | | Huntington Ingalls | | | 3,401 | |
| | 4,796 | | | | | Hurco Cos, Inc | | | 120 | |
| | 7,224 | | | | | Hyster-Yale Materials Handling, Inc | | | 673 | |
| | 62,789 | | | | | IDEX Corp | | | 4,637 | |
| | 39,772 | | | * | | II-VI, Inc | | | 700 | |
| | 288,510 | | | | | Illinois Tool Works, Inc | | | 24,258 | |
| | 228,973 | | | | | Ingersoll-Rand plc | | | 14,105 | |
| | 9,867 | | | * | | Innovative Solutions & Support, Inc | | | 72 | |
| | 13,472 | | | | | Insteel Industries, Inc | | | 306 | |
| | 68,395 | | | | | ITT Corp | | | 2,970 | |
| | 98,921 | | | * | | Jacobs Engineering Group, Inc | | | 6,231 | |
| | 21,706 | | | | | John Bean Technologies Corp | | | 637 | |
| | 80,876 | | | e | | Joy Global, Inc | | | 4,730 | |
| | 9,545 | | | | | Kadant, Inc | | | 387 | |
| | 21,747 | | | | | Kaman Corp | | | 864 | |
| | 112,424 | | | | | KBR, Inc | | | 3,585 | |
| | 59,735 | | | | | Kennametal, Inc | | | 3,110 | |
| | 24,548 | | | *,e | | KEYW Holding Corp | | | 330 | |
| | 40,842 | | | * | | Kratos Defense & Security Solutions, Inc | | | 314 | |
| | 68,488 | | | | | L-3 Communications Holdings, Inc | | | 7,319 | |
| | 13,874 | | | *,e | | Layne Christensen Co | | | 237 | |
| | 7,262 | | | | | LB Foster Co (Class A) | | | 343 | |
| | 38,323 | | | | | Lennox International, Inc | | | 3,260 | |
| | 63,765 | | | | | Lincoln Electric Holdings, Inc | | | 4,549 | |
| | 10,010 | | | e | | Lindsay Manufacturing Co | | | 828 | |
| | 6,398 | | | *,e | | LMI Aerospace, Inc | | | 94 | |
| | 198,304 | | | | | Lockheed Martin Corp | | | 29,480 | |
| | 12,960 | | | | | LSI Industries, Inc | | | 112 | |
| | 12,907 | | | * | | Lydall, Inc | | | 227 | |
| | 8,938 | | | * | | Manitex International, Inc | | | 142 | |
| | 100,071 | | | | | Manitowoc Co, Inc | | | 2,334 | |
| | 272,388 | | | | | Masco Corp | | | 6,202 | |
| | 48,078 | | | * | | Mastec, Inc | | | 1,573 | |
COLLEGE RETIREMENT EQUITIES FUND - Equity Index Account
| SHARES | | | | | COMPANY | | VALUE
(000) | |
| | 14,270 | | | * | | Middleby Corp | | $ | 3,424 | |
| | 7,280 | | | | | Miller Industries, Inc | | | 136 | |
| | 34,691 | | | * | | Moog, Inc (Class A) | | | 2,357 | |
| | 63,944 | | | * | | MRC Global, Inc | | | 2,063 | |
| | 36,007 | | | | | MSC Industrial Direct Co (Class A) | | | 2,912 | |
| | 21,318 | | | | | Mueller Industries, Inc | | | 1,343 | |
| | 118,277 | | | | | Mueller Water Products, Inc (Class A) | | | 1,108 | |
| | 14,064 | | | * | | MYR Group, Inc | | | 353 | |
| | 3,938 | | | *,e | | National Presto Industries, Inc | | | 317 | |
| | 44,159 | | | *,e | | Navistar International Corp | | | 1,686 | |
| | 19,754 | | | * | | NCI Building Systems, Inc | | | 346 | |
| | 12,459 | | | | | NN, Inc | | | 252 | |
| | 48,825 | | | | | Nordson Corp | | | 3,628 | |
| | 6,303 | | | * | | Nortek, Inc | | | 470 | |
| | 168,939 | | | | | Northrop Grumman Corp | | | 19,362 | |
| | 8,845 | | | * | | Northwest Pipe Co | | | 334 | |
| | 44,747 | | | * | | Orbital Sciences Corp | | | 1,043 | |
| | 19,593 | | | * | | Orion Marine Group, Inc | | | 236 | |
| | 66,818 | | | | | Oshkosh Truck Corp | | | 3,366 | |
| | 90,499 | | | * | | Owens Corning, Inc | | | 3,685 | |
| | 265,512 | | | | | Paccar, Inc | | | 15,710 | |
| | 84,544 | | | | | Pall Corp | | | 7,216 | |
| | 113,612 | | | | | Parker Hannifin Corp | | | 14,615 | |
| | 4,350 | | | * | | Patrick Industries, Inc | | | 126 | |
| | 155,297 | | | | | Pentair Ltd | | | 12,062 | |
| | 28,503 | | | * | | Perini Corp | | | 750 | |
| | 24,429 | | | * | | Pgt, Inc | | | 247 | |
| | 16,392 | | | * | | Pike Electric Corp | | | 173 | |
| | 12,258 | | | *,e | | Ply Gem Holdings, Inc | | | 221 | |
| | 13,529 | | | * | | PMFG, Inc | | | 122 | |
| | 35,438 | | | *,e | | Polypore International, Inc | | | 1,379 | |
| | 7,077 | | | | | Powell Industries, Inc | | | 474 | |
| | 1,587 | | | * | | Power Solutions International, Inc | | | 119 | |
| | 14,420 | | | * | | PowerSecure International, Inc | | | 248 | |
| | 111,754 | | | | | Precision Castparts Corp | | | 30,095 | |
| | 1,801 | | | | | Preformed Line Products Co | | | 132 | |
| | 26,671 | | | | | Primoris Services Corp | | | 830 | |
| | 12,975 | | | *,e | | Proto Labs, Inc | | | 924 | |
| | 28,579 | | | | | Quanex Building Products Corp | | | 569 | |
| | 159,563 | | | * | | Quanta Services, Inc | | | 5,036 | |
| | 27,582 | | | | | Raven Industries, Inc | | | 1,135 | |
| | 247,037 | | | | | Raytheon Co | | | 22,406 | |
| | 18,319 | | | * | | RBC Bearings, Inc | | | 1,296 | |
| | 34,163 | | | | | Regal-Beloit Corp | | | 2,519 | |
| | 54,254 | | | *,e | | Revolution Lighting Technologies, Inc | | | 186 | |
| | 21,768 | | | * | | Rexnord Corp | | | 588 | |
| | 106,338 | | | | | Rockwell Automation, Inc | | | 12,565 | |
COLLEGE RETIREMENT EQUITIES FUND - Equity Index Account
| SHARES | | | | | COMPANY | | VALUE
(000) | |
| | 102,927 | | | | | Rockwell Collins, Inc | | $ | 7,608 | |
| | 74,901 | | | | | Roper Industries, Inc | | | 10,387 | |
| | 26,334 | | | * | | Rush Enterprises, Inc (Class A) | | | 781 | |
| | 31,268 | | | | | Simpson Manufacturing Co, Inc | | | 1,148 | |
| | 44,514 | | | | | Snap-On, Inc | | | 4,875 | |
| | 18,297 | | | * | | SolarCity Corp | | | 1,040 | |
| | 7,959 | | | * | | Sparton Corp | | | 222 | |
| | 90,789 | | | * | | Spirit Aerosystems Holdings, Inc (Class A) | | | 3,094 | |
| | 35,604 | | | | | SPX Corp | | | 3,547 | |
| | 9,752 | | | | | Standex International Corp | | | 613 | |
| | 123,315 | | | | | Stanley Works | | | 9,950 | |
| | 12,518 | | | * | | Sterling Construction Co, Inc | | | 147 | |
| | 16,194 | | | | | Sun Hydraulics Corp | | | 661 | |
| | 26,344 | | | e | | TAL International Group, Inc | | | 1,511 | |
| | 38,585 | | | * | | Taser International, Inc | | | 613 | |
| | 13,992 | | | * | | Tecumseh Products Co (Class A) | | | 127 | |
| | 28,168 | | | * | | Teledyne Technologies, Inc | | | 2,588 | |
| | 14,645 | | | | | Tennant Co | | | 993 | |
| | 84,391 | | | | | Terex Corp | | | 3,544 | |
| | 15,040 | | | e | | Textainer Group Holdings Ltd | | | 605 | |
| | 211,415 | | | | | Textron, Inc | | | 7,772 | |
| | 4,600 | | | *,e | | The ExOne Company | | | 278 | |
| | 20,645 | | | * | | Thermon Group Holdings | | | 564 | |
| | 65,723 | | | | | Timken Co | | | 3,619 | |
| | 41,571 | | | e | | Titan International, Inc | | | 747 | |
| | 11,613 | | | *,e | | Titan Machinery, Inc | | | 207 | |
| | 44,675 | | | | | Toro Co | | | 2,841 | |
| | 39,994 | | | | | TransDigm Group, Inc | | | 6,440 | |
| | 13,203 | | | * | | Trex Co, Inc | | | 1,050 | |
| | 34,233 | | | * | | Trimas Corp | | | 1,366 | |
| | 60,186 | | | | | Trinity Industries, Inc | | | 3,281 | |
| | 39,203 | | | | | Triumph Group, Inc | | | 2,982 | |
| | 6,504 | | | e | | Twin Disc, Inc | | | 168 | |
| | 71,568 | | | *,e | | United Rentals, Inc | | | 5,579 | |
| | 700,858 | | | | | United Technologies Corp | | | 79,758 | |
| | 14,766 | | | | | Universal Forest Products, Inc | | | 770 | |
| | 57,668 | | | | | URS Corp | | | 3,056 | |
| | 58,065 | | | *,e | | USG Corp | | | 1,648 | |
| | 20,359 | | | e | | Valmont Industries, Inc | | | 3,036 | |
| | 12,845 | | | * | | Vicor Corp | | | 172 | |
| | 45,211 | | | | | W.W. Grainger, Inc | | | 11,548 | |
| | 52,045 | | | * | | Wabash National Corp | | | 643 | |
| | 44,618 | | | * | | WABCO Holdings, Inc | | | 4,168 | |
| | 19,517 | | | | | Watsco, Inc | | | 1,875 | |
| | 21,144 | | | | | Watts Water Technologies, Inc (Class A) | | | 1,308 | |
| | 33,347 | | | *,e | | WESCO International, Inc | | | 3,037 | |
| | 73,575 | | | | | Westinghouse Air Brake Technologies Corp | | | 5,464 | |
COLLEGE RETIREMENT EQUITIES FUND - Equity Index Account
| SHARES | | | | | COMPANY | | VALUE
(000) | |
| | 52,887 | | | | | Woodward Governor Co | | $ | 2,412 | |
| | 8,335 | | | * | | Xerium Technologies, Inc | | | 137 | |
| | 140,768 | | | | | Xylem, Inc | | | 4,871 | |
| | | | | | | TOTAL CAPITAL GOODS | | | 1,361,511 | |
| | | | | | | | | | | |
| COMMERCIAL & PROFESSIONAL SERVICES - 1.0% | | |
| | 41,289 | | | | | ABM Industries, Inc | | | 1,180 | |
| | 37,820 | | | e | | Acacia Research (Acacia Technologies) | | | 550 | |
| | 87,875 | | | * | | ACCO Brands Corp | | | 591 | |
| | 12,255 | | | e | | Acorn Energy, Inc | | | 50 | |
| | 16,355 | | | | | Administaff, Inc | | | 591 | |
| | 151,678 | | | e | | ADT Corp | | | 6,138 | |
| | 27,004 | | | * | | Advisory Board Co | | | 1,719 | |
| | 14,202 | | | | | American Ecology Corp | | | 528 | |
| | 26,021 | | | * | | ARC Document Solutions, Inc | | | 214 | |
| | 6,166 | | | | | Barrett Business Services, Inc | | | 572 | |
| | 35,828 | | | | | Brink’s Co | | | 1,223 | |
| | 29,675 | | | * | | Casella Waste Systems, Inc (Class A) | | | 172 | |
| | 35,493 | | | *,e | | CBIZ, Inc | | | 324 | |
| | 10,344 | | | | | CDI Corp | | | 192 | |
| | 10,136 | | | e | | Ceco Environmental Corp | | | 164 | |
| | 38,005 | | | *,e | | Cenveo, Inc | | | 131 | |
| | 78,313 | | | | | Cintas Corp | | | 4,667 | |
| | 46,868 | | | * | | Clean Harbors, Inc | | | 2,810 | |
| | 5,517 | | | * | | Consolidated Graphics, Inc | | | 372 | |
| | 84,979 | | | * | | Copart, Inc | | | 3,114 | |
| | 25,057 | | | | | Corporate Executive Board Co | | | 1,940 | |
| | 87,736 | | | | | Corrections Corp of America | | | 2,814 | |
| | 8,633 | | | | | Courier Corp | | | 156 | |
| | 80,750 | | | | | Covanta Holding Corp | | | 1,433 | |
| | 8,400 | | | * | | CRA International, Inc | | | 166 | |
| | 37,676 | | | | | Deluxe Corp | | | 1,966 | |
| | 30,470 | | | | | Dun & Bradstreet Corp | | | 3,740 | |
| | 20,747 | | | * | | EnerNOC, Inc | | | 357 | |
| | 20,052 | | | | | Ennis, Inc | | | 355 | |
| | 91,556 | | | | | Equifax, Inc | | | 6,326 | |
| | 11,236 | | | | | Exponent, Inc | | | 870 | |
| | 9,375 | | | * | | Franklin Covey Co | | | 186 | |
| | 32,036 | | | * | | FTI Consulting, Inc | | | 1,318 | |
| | 15,088 | | | | | G & K Services, Inc (Class A) | | | 939 | |
| | 54,016 | | | | | Geo Group, Inc | | | 1,740 | |
| | 12,104 | | | * | | GP Strategies Corp | | | 361 | |
| | 51,852 | | | | | Healthcare Services Group | | | 1,471 | |
| | 14,300 | | | | | Heidrick & Struggles International, Inc | | | 288 | |
| | 5,613 | | | * | | Heritage-Crystal Clean, Inc | | | 115 | |
| | 43,782 | | | | | Herman Miller, Inc | | | 1,292 | |
COLLEGE RETIREMENT EQUITIES FUND - Equity Index Account
| SHARES | | | | | COMPANY | | VALUE
(000) | |
| | 33,809 | | | | | HNI Corp | | $ | 1,313 | |
| | 17,734 | | | * | | Huron Consulting Group, Inc | | | 1,112 | |
| | 14,961 | | | * | | ICF International, Inc | | | 519 | |
| | 114,792 | | | * | | ICO Global Communications Holdings Ltd | | | 231 | |
| | 50,033 | | | * | | IHS, Inc (Class A) | | | 5,989 | |
| | 33,730 | | | *,e | | Innerworkings, Inc | | | 263 | |
| | 44,922 | | | | | Interface, Inc | | | 986 | |
| | 6,998 | | | | | Intersections, Inc | | | 55 | |
| | 129,308 | | | | | Iron Mountain, Inc | | | 3,925 | |
| | 60,101 | | | | | KAR Auction Services, Inc | | | 1,776 | |
| | 20,372 | | | | | Kelly Services, Inc (Class A) | | | 508 | |
| | 21,985 | | | | | Kforce, Inc | | | 450 | |
| | 25,171 | | | | | Kimball International, Inc (Class B) | | | 378 | |
| | 35,963 | | | | | Knoll, Inc | | | 658 | |
| | 38,704 | | | * | | Korn/Ferry International | | | 1,011 | |
| | 58,657 | | | | | Manpower, Inc | | | 5,036 | |
| | 19,108 | | | | | McGrath RentCorp | | | 761 | |
| | 21,996 | | | | | Mine Safety Appliances Co | | | 1,126 | |
| | 13,300 | | | * | | Mistras Group, Inc | | | 278 | |
| | 28,189 | | | * | | Mobile Mini, Inc | | | 1,161 | |
| | 8,734 | | | | | Multi-Color Corp | | | 330 | |
| | 40,393 | | | * | | Navigant Consulting, Inc | | | 776 | |
| | 165,909 | | | | | Nielsen Holdings NV | | | 7,614 | |
| | 4,943 | | | | | NL Industries, Inc | | | 55 | |
| | 50,328 | | | *,e | | Odyssey Marine Exploration, Inc | | | 102 | |
| | 34,971 | | | * | | On Assignment, Inc | | | 1,221 | |
| | 17,073 | | | * | | Performant Financial Corp | | | 176 | |
| | 152,067 | | | e | | Pitney Bowes, Inc | | | 3,543 | |
| | 19,286 | | | e | | Quad | | | 525 | |
| | 137,806 | | | e | | R.R. Donnelley & Sons Co | | | 2,795 | |
| | 205,322 | | | | | Republic Services, Inc | | | 6,817 | |
| | 32,857 | | | | | Resources Connection, Inc | | | 471 | |
| | 105,944 | | | | | Robert Half International, Inc | | | 4,449 | |
| | 48,594 | | | | | Rollins, Inc | | | 1,472 | |
| | 24,429 | | | * | | RPX Corp | | | 413 | |
| | 10,767 | | | | | Schawk, Inc (Class A) | | | 160 | |
| | 12,140 | | | * | | SP Plus Corp | | | 316 | |
| | 64,080 | | | | | Steelcase, Inc (Class A) | | | 1,016 | |
| | 65,639 | | | * | | Stericycle, Inc | | | 7,625 | |
| | 85,446 | | | *,e | | Swisher Hygiene, Inc | | | 44 | |
| | 15,368 | | | * | | Team, Inc | | | 651 | |
| | 47,935 | | | * | | Tetra Tech, Inc | | | 1,341 | |
| | 49,471 | | | * | | Towers Watson & Co | | | 6,313 | |
| | 13,579 | | | * | | TRC Cos, Inc | | | 97 | |
| | 30,958 | | | * | | TrueBlue, Inc | | | 798 | |
| | 10,503 | | | | | Unifirst Corp | | | 1,124 | |
| | 31,063 | | | | | United Stationers, Inc | | | 1,425 | |
| | 115,025 | | | * | | Verisk Analytics, Inc | | | 7,559 | |
COLLEGE RETIREMENT EQUITIES FUND - Equity Index Account
| SHARES | | | | | COMPANY | | VALUE
(000) | |
| | 15,178 | | | | | Viad Corp | | $ | 422 | |
| | 2,793 | | | | | VSE Corp | | | 134 | |
| | 18,889 | | | * | | WageWorks, Inc | | | 1,123 | |
| | 93,921 | | | | | Waste Connections, Inc | | | 4,098 | |
| | 355,433 | | | | | Waste Management, Inc | | | 15,948 | |
| | 16,168 | | | | | West Corp | | | 416 | |
| | | | | | | TOTAL COMMERCIAL & PROFESSIONAL SERVICES | | | 162,040 | |
| | | | | | |
| CONSUMER DURABLES & APPAREL - 1.6% | | |
| | 40,872 | | | *,e | | American Apparel, Inc | | | 50 | |
| | 9,523 | | | | | Arctic Cat, Inc | | | 543 | |
| | 8,829 | | | | | Bassett Furniture Industries, Inc | | | 135 | |
| | 21,459 | | | *,e | | Beazer Homes USA, Inc | | | 524 | |
| | 23,174 | | | *,e | | Black Diamond Inc | | | 309 | |
| | 7,843 | | | e | | Blyth, Inc | | | 85 | |
| | 68,196 | | | | | Brunswick Corp | | | 3,141 | |
| | 51,179 | | | | | Callaway Golf Co | | | 431 | |
| | 45,108 | | | | | Carter’s, Inc | | | 3,238 | |
| | 5,387 | | | * | | Cavco Industries, Inc | | | 370 | |
| | 215,581 | | | | | Coach, Inc | | | 12,101 | |
| | 9,439 | | | e | | Columbia Sportswear Co | | | 743 | |
| | 7,698 | | | * | | Costa, Inc | | | 167 | |
| | 68,785 | | | * | | CROCS, Inc | | | 1,095 | |
| | 5,480 | | | | | CSS Industries, Inc | | | 157 | |
| | 6,895 | | | | | Culp, Inc | | | 141 | |
| | 26,041 | | | *,e | | Deckers Outdoor Corp | | | 2,199 | |
| | 219,402 | | | * | | DR Horton, Inc | | | 4,897 | |
| | 18,783 | | | e | | Ethan Allen Interiors, Inc | | | 571 | |
| | 7,662 | | | * | | EveryWare Global, Inc | | | 63 | |
| | 91,288 | | | * | | Fifth & Pacific Cos, Inc | | | 2,928 | |
| | 3,461 | | | | | Flexsteel Industries, Inc | | | 106 | |
| | 39,080 | | | * | | Fossil Group, Inc | | | 4,687 | |
| | 93,303 | | | e | | Garmin Ltd | | | 4,313 | |
| | 13,268 | | | * | | G-III Apparel Group Ltd | | | 979 | |
| | 74,818 | | | | | Hanesbrands, Inc | | | 5,258 | |
| | 51,667 | | | | | Harman International Industries, Inc | | | 4,229 | |
| | 87,267 | | | | | Hasbro, Inc | | | 4,801 | |
| | 23,782 | | | * | | Helen of Troy Ltd | | | 1,177 | |
| | 7,853 | | | | | Hooker Furniture Corp | | | 131 | |
| | 93,175 | | | *,e | | Hovnanian Enterprises, Inc (Class A) | | | 617 | |
| | 42,156 | | | * | | Iconix Brand Group, Inc | | | 1,674 | |
| | 21,039 | | | * | | iRobot Corp | | | 732 | |
| | 20,248 | | | e | | Jakks Pacific, Inc | | | 136 | |
| | 96,831 | | | * | | Jarden Corp | | | 5,941 | |
| | 3,583 | | | | | Johnson Outdoors, Inc | | | 97 | |
| | 63,176 | | | | | Jones Apparel Group, Inc | | | 945 | |
| | 63,287 | | | e | | KB Home | | | 1,157 | |
COLLEGE RETIREMENT EQUITIES FUND - Equity Index Account
| SHARES | | | | | COMPANY | | VALUE
(000) | |
| | 39,237 | | | | | La-Z-Boy, Inc | | $ | 1,216 | |
| | 52,779 | | | *,e | | Leapfrog Enterprises, Inc | | | 419 | |
| | 108,175 | | | e | | Leggett & Platt, Inc | | | 3,347 | |
| | 126,090 | | | e | | Lennar Corp (Class A) | | | 4,988 | |
| | 16,013 | | | * | | Libbey, Inc | | | 336 | |
| | 7,210 | | | | | Lifetime Brands, Inc | | | 113 | |
| | 16,714 | | | * | | M/I Homes, Inc | | | 425 | |
| | 8,407 | | | | | Marine Products Corp | | | 85 | |
| | 264,203 | | | | | Mattel, Inc | | | 12,571 | |
| | 29,150 | | | * | | MDC Holdings, Inc | | | 940 | |
| | 28,574 | | | * | | Meritage Homes Corp | | | 1,371 | |
| | 153,320 | | | * | | Michael Kors Holdings Ltd | | | 12,448 | |
| | 46,185 | | | * | | Mohawk Industries, Inc | | | 6,877 | |
| | 12,667 | | | | | Movado Group, Inc | | | 558 | |
| | 4,424 | | | | | Nacco Industries, Inc (Class A) | | | 275 | |
| | 22,756 | | | * | | Nautilus, Inc | | | 192 | |
| | 219,526 | | | | | Newell Rubbermaid, Inc | | | 7,115 | |
| | 540,527 | | | | | Nike, Inc (Class B) | | | 42,507 | |
| | 3,488 | | | * | | NVR, Inc | | | 3,579 | |
| | 10,106 | | | | | Oxford Industries, Inc | | | 815 | |
| | 8,860 | | | * | | Perry Ellis International, Inc | | | 140 | |
| | 61,650 | | | | | Phillips-Van Heusen Corp | | | 8,386 | |
| | 49,324 | | | | | Polaris Industries, Inc | | | 7,184 | |
| | 36,161 | | | | | Pool Corp | | | 2,102 | |
| | 294,920 | | | | | Pulte Homes, Inc | | | 6,008 | |
| | 101,655 | | | * | | Quiksilver, Inc | | | 892 | |
| | 45,636 | | | | | Ralph Lauren Corp | | | 8,058 | |
| | 6,477 | | | | | RG Barry Corp | | | 125 | |
| | 35,106 | | | | | Ryland Group, Inc | | | 1,524 | |
| | 29,390 | | | * | | Skechers U.S.A., Inc (Class A) | | | 974 | |
| | 12,508 | | | * | | Skullcandy, Inc | | | 90 | |
| | 48,359 | | | *,e | | Smith & Wesson Holding Corp | | | 652 | |
| | 112,658 | | | * | | Standard-Pacific Corp | | | 1,020 | |
| | 45,166 | | | * | | Steven Madden Ltd | | | 1,653 | |
| | 14,503 | | | e | | Sturm Ruger & Co, Inc | | | 1,060 | |
| | 24,241 | | | * | | Taylor Morrison Home Corp | | | 544 | |
| | 45,528 | | | * | | Tempur-Pedic International, Inc | | | 2,457 | |
| | 129,618 | | | * | | Toll Brothers, Inc | | | 4,796 | |
| | 12,000 | | | *,e | | TRI Pointe Homes, Inc | | | 239 | |
| | 36,378 | | | * | | Tumi Holdings, Inc | | | 820 | |
| | 40,284 | | | | | Tupperware Corp | | | 3,808 | |
| | 63,714 | | | *,e | | Under Armour, Inc (Class A) | | | 5,562 | |
| | 10,905 | | | * | | Unifi, Inc | | | 297 | |
| | 11,370 | | | * | | Universal Electronics, Inc | | | 433 | |
| | 19,269 | | | *,e | | Vera Bradley, Inc | | | 463 | |
| | 266,376 | | | | | VF Corp | | | 16,606 | |
| | 9,200 | | | * | | Vince Holding Corp | | | 282 | |
COLLEGE RETIREMENT EQUITIES FUND - Equity Index Account
| SHARES | | | | | COMPANY | | VALUE
(000) | |
| | 5,600 | | | * | | WCI Communities, Inc | | $ | 107 | |
| | 5,214 | | | | | Weyco Group, Inc | | | 153 | |
| | 60,719 | | | | | Whirlpool Corp | | | 9,524 | |
| | 8,350 | | | * | | William Lyon Homes, Inc | | | 185 | |
| | 76,448 | | | | | Wolverine World Wide, Inc | | | 2,596 | |
| | 28,030 | | | * | | Zagg, Inc | | | 122 | |
| | | | | | | TOTAL CONSUMER DURABLES & APPAREL | | 259,907 | |
| | | | | | |
| CONSUMER SERVICES - 2.2% | | |
| | 18,260 | | | * | | AFC Enterprises | | | 703 | |
| | 13,862 | | | * | | American Public Education, Inc | | | 603 | |
| | 74,107 | | | * | | Apollo Group, Inc (Class A) | | | 2,025 | |
| | 11,587 | | | * | | Ascent Media Corp (Series A) | | | 991 | |
| | 29,370 | | | * | | Bally Technologies, Inc | | | 2,304 | |
| | 18,782 | | | * | | BJ’s Restaurants, Inc | | | 583 | |
| | 42,020 | | | * | | Bloomin’ Brands, Inc | | | 1,009 | |
| | 21,179 | | | | | Bob Evans Farms, Inc | | | 1,071 | |
| | 52,961 | | | * | | Boyd Gaming Corp | | | 596 | |
| | 14,947 | | | * | | Bravo Brio Restaurant Group, Inc | | | 243 | |
| | 13,548 | | | * | | Bridgepoint Education, Inc | | | 240 | |
| | 9,000 | | | * | | Bright Horizons Family Solutions | | | 331 | |
| | 50,290 | | | | | Brinker International, Inc | | | 2,330 | |
| | 14,166 | | | * | | Buffalo Wild Wings, Inc | | | 2,085 | |
| | 76,511 | | | | | Burger King Worldwide, Inc | | | 1,749 | |
| | 32,600 | | | *,e | | Caesars Entertainment Corp | | | 702 | |
| | 9,631 | | | * | | Capella Education Co | | | 640 | |
| | 46,334 | | | * | | Career Education Corp | | | 264 | |
| | 318,100 | | | | | Carnival Corp | | | 12,778 | |
| | 12,748 | | | | | Carriage Services, Inc | | | 249 | |
| | 18,871 | | | * | | Carrols Restaurant Group, Inc | | | 125 | |
| | 14,608 | | | | | CBRL Group, Inc | | | 1,608 | |
| | 15,042 | | | | | CEC Entertainment, Inc | | | 666 | |
| | 41,224 | | | | | Cheesecake Factory | | | 1,990 | |
| | 23,515 | | | * | | Chipotle Mexican Grill, Inc (Class A) | | | 12,528 | |
| | 21,021 | | | e | | Choice Hotels International, Inc | | | 1,032 | |
| | 10,504 | | | * | | Churchill Downs, Inc | | | 942 | |
| | 12,474 | | | * | | Chuy’s Holdings, Inc | | | 449 | |
| | 15,700 | | | * | | ClubCorp Holdings, Inc | | | 279 | |
| | 59,209 | | | *,e | | Corinthian Colleges, Inc | | | 105 | |
| | 98,248 | | | | | Darden Restaurants, Inc | | | 5,342 | |
| | 7,863 | | | * | | Del Frisco’s Restaurant Group, Inc | | | 185 | |
| | 75,312 | | | * | | Denny’s Corp | | | 542 | |
| | 48,007 | | | e | | DeVry, Inc | | | 1,704 | |
| | 12,000 | | | * | | Diamond Resorts International, Inc | | | 222 | |
| | 12,442 | | | | | DineEquity, Inc | | | 1,040 | |
| | 8,223 | | | * | | Diversified Restaurant Holdings, Inc | | | 39 | |
| | 42,657 | | | | | Domino’s Pizza, Inc | | | 2,971 | |
COLLEGE RETIREMENT EQUITIES FUND - Equity Index Account
| SHARES | | | | | COMPANY | | VALUE
(000) | |
| | 81,221 | | | | | Dunkin Brands Group, Inc | | $ | 3,915 | |
| | 21,777 | | | * | | Education Management Corp | | | 220 | |
| | 4,221 | | | | | Einstein Noah Restaurant Group, Inc | | | 61 | |
| | 14,961 | | | * | | Fiesta Restaurant Group, Inc | | | 782 | |
| | 3,249 | | | * | | Graham Holdings Co | | | 2,155 | |
| | 34,464 | | | * | | Grand Canyon Education, Inc | | | 1,503 | |
| | 208,641 | | | | | H&R Block, Inc | | | 6,059 | |
| | 41,775 | | | | | Hillenbrand, Inc | | | 1,229 | |
| | 33,800 | | | * | | Hyatt Hotels Corp | | | 1,672 | |
| | 4,863 | | | *,e | | Ignite Restaurant Group, Inc | | | 61 | |
| | 197,900 | | | | | International Game Technology | | | 3,594 | |
| | 20,955 | | | | | International Speedway Corp (Class A) | | | 744 | |
| | 33,777 | | | | | Interval Leisure Group, Inc | | | 1,044 | |
| | 15,534 | | | * | | Isle of Capri Casinos, Inc | | | 140 | |
| | 18,743 | | | *,e | | ITT Educational Services, Inc | | | 629 | |
| | 33,770 | | | * | | Jack in the Box, Inc | | | 1,689 | |
| | 12,737 | | | * | | Jamba, Inc | | | 158 | |
| | 3,365 | | | *,e | | JTH Holding, Inc | | | 82 | |
| | 21,966 | | | *,e | | K12, Inc | | | 478 | |
| | 51,222 | | | * | | Krispy Kreme Doughnuts, Inc | | | 988 | |
| | 298,583 | | | | | Las Vegas Sands Corp | | | 23,549 | |
| | 32,744 | | | *,e | | Life Time Fitness, Inc | | | 1,539 | |
| | 46,274 | | | * | | LifeLock, Inc | | | 759 | |
| | 17,103 | | | | | Lincoln Educational Services Corp | | | 85 | |
| | 13,766 | | | * | | Luby’s, Inc | | | 106 | |
| | 8,861 | | | | | Mac-Gray Corp | | | 188 | |
| | 14,891 | | | | | Marcus Corp | | | 200 | |
| | 177,752 | | | | | Marriott International, Inc (Class A) | | | 8,774 | |
| | 22,417 | | | * | | Marriott Vacations Worldwide Corp | | | 1,183 | |
| | 23,085 | | | | | Matthews International Corp (Class A) | | | 984 | |
| | 764,374 | | | | | McDonald’s Corp | | | 74,167 | |
| | 282,640 | | | * | | MGM Mirage | | | 6,648 | |
| | 7,140 | | | * | | Monarch Casino & Resort, Inc | | | 143 | |
| | 23,956 | | | * | | Morgans Hotel Group Co | | | 195 | |
| | 22,035 | | | * | | Multimedia Games, Inc | | | 691 | |
| | 2,018 | | | * | | Nathan’s Famous, Inc | | | 102 | |
| | 4,600 | | | *,e | | Noodles & Co | | | 165 | |
| | 20,600 | | | * | | Norwegian Cruise Line Holdings Ltd | | | 731 | |
| | 71,477 | | | * | | Orient-Express Hotels Ltd (Class A) | | | 1,080 | |
| | 21,333 | | | * | | Panera Bread Co (Class A) | | | 3,769 | |
| | 24,166 | | | | | Papa John’s International, Inc | | | 1,097 | |
| | 51,524 | | | * | | Penn National Gaming, Inc | | | 738 | |
| | 48,180 | | | * | | Pinnacle Entertainment, Inc | | | 1,252 | |
| | 10,662 | | | * | | Red Robin Gourmet Burgers, Inc | | | 784 | |
| | 37,371 | | | | | Regis Corp | | | 542 | |
| | 124,741 | | | | | Royal Caribbean Cruises Ltd | | | 5,915 | |
| | 46,223 | | | * | | Ruby Tuesday, Inc | | | 320 | |
COLLEGE RETIREMENT EQUITIES FUND - Equity Index Account
| SHARES | | | | | COMPANY | | VALUE
(000) | |
| | 26,831 | | | | | Ruth’s Chris Steak House, Inc | | $ | 381 | |
| | 42,614 | | | * | | Scientific Games Corp (Class A) | | | 722 | |
| | 21,338 | | | | | SeaWorld Entertainment, Inc | | | 614 | |
| | 161,096 | | | | | Service Corp International | | | 2,921 | |
| | 50,232 | | | | | Six Flags Entertainment Corp | | | 1,850 | |
| | 45,772 | | | * | | Sonic Corp | | | 924 | |
| | 51,448 | | | | | Sotheby’s (Class A) | | | 2,737 | |
| | 9,984 | | | | | Speedway Motorsports, Inc | | | 198 | |
| | 571,201 | | | | | Starbucks Corp | | | 44,777 | |
| | 147,972 | | | | | Starwood Hotels & Resorts Worldwide, Inc | | | 11,756 | |
| | 1,149 | | | * | | Steak N Shake Co | | | 582 | |
| | 11,970 | | | * | | Steiner Leisure Ltd | | | 589 | |
| | 9,323 | | | * | | Strayer Education, Inc | | | 321 | |
| | 48,004 | | | | | Texas Roadhouse, Inc (Class A) | | | 1,335 | |
| | 16,126 | | | | | Town Sports International Holdings, Inc | | | 238 | |
| | 15,190 | | | | | Universal Technical Institute, Inc | | | 211 | |
| | 27,599 | | | | | Vail Resorts, Inc | | | 2,076 | |
| | 20,024 | | | e | | Weight Watchers International, Inc | | | 659 | |
| | 215,839 | | | | | Wendy’s | | | 1,882 | |
| | 103,319 | | | | | Wyndham Worldwide Corp | | | 7,614 | |
| | 61,484 | | | | | Wynn Resorts Ltd | | | 11,941 | |
| | 342,871 | | | | | Yum! Brands, Inc | | | 25,925 | |
| | | | | | | TOTAL CONSUMER SERVICES | | 346,427 | |
| | | | | | |
| DIVERSIFIED FINANCIALS - 6.7% | | |
| | 40,110 | | | * | | Affiliated Managers Group, Inc | | | 8,699 | |
| | 232,535 | | | * | | American Capital Ltd | | | 3,637 | |
| | 722,381 | | | | | American Express Co | | | 65,542 | |
| | 153,226 | | | | | Ameriprise Financial, Inc | | | 17,629 | |
| | 172,494 | | | | | Apollo Investment Corp | | | 1,463 | |
| | 225,801 | | | | | Ares Capital Corp | | | 4,012 | |
| | 9,688 | | | | | Artisan Partners Asset Management, Inc | | | 632 | |
| | 8,218,119 | | | | | Bank of America Corp | | | 127,956 | |
| | 885,753 | | | | | Bank of New York Mellon Corp | | | 30,948 | |
| | 97,553 | | | | | BGC Partners, Inc (Class A) | | | 591 | |
| | 54,667 | | | | | BlackRock Kelso Capital Corp | | | 510 | |
| | 99,808 | | | | | BlackRock, Inc | | | 31,586 | |
| | 16,951 | | | | | Calamos Asset Management, Inc (Class A) | | | 201 | |
| | 445,425 | | | | | Capital One Financial Corp | | | 34,124 | |
| | 10,188 | | | | | Capital Southwest Corp | | | 355 | |
| | 22,738 | | | e | | Cash America International, Inc | | | 871 | |
| | 66,839 | | | | | CBOE Holdings, Inc | | | 3,473 | |
| | 836,494 | | | | | Charles Schwab Corp | | | 21,749 | |
| | 2,319,717 | | | | | Citigroup, Inc | | | 120,880 | |
| | 242,077 | | | | | CME Group, Inc | | | 18,993 | |
| | 14,207 | | | e | | Cohen & Steers, Inc | | | 569 | |
| | 10,988 | | | * | | Consumer Portfolio Services, Inc | | | 103 | |
COLLEGE RETIREMENT EQUITIES FUND - Equity Index Account
| SHARES | | | | | COMPANY | | VALUE
(000) | |
| | 75,792 | | | * | | Cowen Group, Inc | | $ | 296 | |
| | 5,419 | | | * | | Credit Acceptance Corp | | | 704 | |
| | 7,179 | | | | | Deerfield Capital Corp | | | 56 | |
| | 1,990 | | | | | Diamond Hill Investment Group, Inc | | | 236 | |
| | 373,783 | | | | | Discover Financial Services | | | 20,913 | |
| | 30,717 | | | * | | Dollar Financial Corp | | | 352 | |
| | 216,676 | | | * | | E*Trade Financial Corp | | | 4,256 | |
| | 91,544 | | | | | Eaton Vance Corp | | | 3,917 | |
| | 18,317 | | | *,e | | Encore Capital Group, Inc | | | 921 | |
| | 23,860 | | | | | Evercore Partners, Inc (Class A) | | | 1,426 | |
| | 38,445 | | | * | | Ezcorp, Inc (Class A) | | | 449 | |
| | 9,821 | | | * | | FBR & Co | | | 259 | |
| | 69,691 | | | e | | Federated Investors, Inc (Class B) | | | 2,007 | |
| | 10,455 | | | e | | Fidus Investment Corp | | | 227 | |
| | 104,057 | | | | | Fifth Street Finance Corp | | | 963 | |
| | 37,325 | | | | | Financial Engines, Inc | | | 2,593 | |
| | 21,634 | | | * | | First Cash Financial Services, Inc | | | 1,338 | |
| | 5,825 | | | *,e | | First Marblehead Corp | | | 43 | |
| | 6,203 | | | | | Firsthand Technology Value Fund, Inc | | | 144 | |
| | 314,266 | | | | | Franklin Resources, Inc | | | 18,143 | |
| | 9,042 | | | | | Friedman Billings Ramsey Group, Inc (Class A) | | | 239 | |
| | 27,923 | | | e | | FXCM, Inc | | | 498 | |
| | 7,000 | | | | | Gain Capital Holdings, Inc | | | 53 | |
| | 6,584 | | | | | GAMCO Investors, Inc (Class A) | | | 573 | |
| | 4,491 | | | e | | Garrison Capital, Inc | | | 62 | |
| | 54,396 | | | | | GFI Group, Inc | | | 213 | |
| | 15,081 | | | | | Gladstone Capital Corp | | | 145 | |
| | 15,921 | | | | | Gladstone Investment Corp | | | 128 | |
| | 349,609 | | | | | Goldman Sachs Group, Inc | | | 61,972 | |
| | 26,497 | | | e | | Golub Capital BDC, Inc | | | 506 | |
| | 19,596 | | | * | | Green Dot Corp | | | 493 | |
| | 22,433 | | | | | Greenhill & Co, Inc | | | 1,300 | |
| | 14,431 | | | *,e | | GSV Capital Corp | | | 174 | |
| | 46,985 | | | e | | Hercules Technology Growth Capital, Inc | | | 771 | |
| | 25,335 | | | * | | HFF, Inc (Class A) | | | 680 | |
| | 4,930 | | | | | Horizon Technology Finance Corp | | | 70 | |
| | 13,614 | | | * | | Imperial Holdings, Inc | | | 89 | |
| | 57,175 | | | | | ING US, Inc | | | 2,010 | |
| | 35,381 | | | | | Interactive Brokers Group, Inc (Class A) | | | 861 | |
| | 86,996 | | | | | IntercontinentalExchange Group, Inc | | | 19,567 | |
| | 12,794 | | | * | | International Assets Holding Corp | | | 237 | |
| | 32,107 | | | * | | Internet Capital Group, Inc | | | 598 | |
| | 337,832 | | | | | Invesco Ltd | | | 12,297 | |
| | 28,315 | | | * | | Investment Technology Group, Inc | | | 582 | |
| | 41,500 | | | e | | iShares Russell 2000 Index Fund | | | 4,785 | |
| | 124,420 | | | | | Janus Capital Group, Inc | | | 1,539 | |
| | 11,011 | | | | | JMP Group, Inc | | | 81 | |
COLLEGE RETIREMENT EQUITIES FUND - Equity Index Account
| SHARES | | | | | COMPANY | | VALUE
(000) | |
| | 2,881,500 | | | | | JPMorgan Chase & Co | | $ | 168,510 | |
| | 20,819 | | | e | | KCAP Financial, Inc | | | 168 | |
| | 54,281 | | | * | | KCG Holdings, Inc | | | 649 | |
| | 73,441 | | | * | | Ladenburg Thalmann Financial Services, Inc | | | 230 | |
| | 97,716 | | | | | Lazard Ltd (Class A) | | | 4,429 | |
| | 84,309 | | | e | | Legg Mason, Inc | | | 3,666 | |
| | 225,092 | | | | | Leucadia National Corp | | | 6,379 | |
| | 42,965 | | | | | LPL Financial Holdings, Inc | | | 2,021 | |
| | 30,028 | | | e | | Main Street Capital Corp | | | 982 | |
| | 10,552 | | | | | Manning & Napier, Inc | | | 186 | |
| | 27,836 | | | | | MarketAxess Holdings, Inc | | | 1,861 | |
| | 6,533 | | | | | Marlin Business Services Corp | | | 165 | |
| | 53,786 | | | | | MCG Capital Corp | | | 237 | |
| | 14,534 | | | | | Medallion Financial Corp | | | 209 | |
| | 30,571 | | | | | Medley Capital Corp | | | 423 | |
| | 148,210 | | | | | Moody’s Corp | | | 11,630 | |
| | 1,161,824 | | | | | Morgan Stanley | | | 36,435 | |
| | 91,923 | | | * | | MSCI, Inc (Class A) | | | 4,019 | |
| | 17,411 | | | | | MVC Capital, Inc | | | 235 | |
| | 84,624 | | | | | Nasdaq Stock Market, Inc | | | 3,368 | |
| | 17,569 | | | | | Nelnet, Inc (Class A) | | | 740 | |
| | 31,067 | | | | | New Mountain Finance Corp | | | 467 | |
| | 21,889 | | | * | | NewStar Financial, Inc | | | 389 | |
| | 12,077 | | | | | NGP Capital Resources Co | | | 90 | |
| | 7,402 | | | | | Nicholas Financial, Inc | | | 117 | |
| | 182,080 | | | | | Northern Trust Corp | | | 11,269 | |
| | 7,363 | | | | | Oppenheimer Holdings, Inc | | | 182 | |
| | 7,560 | | | | | PennantPark Floating Rate Capital Ltd | | | 104 | |
| | 49,497 | | | | | PennantPark Investment Corp | | | 574 | |
| | 41,814 | | | * | | PHH Corp | | | 1,018 | |
| | 17,372 | | | * | | Pico Holdings, Inc | | | 401 | |
| | 13,978 | | | * | | Piper Jaffray Cos | | | 553 | |
| | 39,048 | | | * | | Portfolio Recovery Associates, Inc | | | 2,063 | |
| | 212,080 | | | e | | Prospect Capital Corp | | | 2,380 | |
| | 9,591 | | | | | Pzena Investment Management, Inc (Class A) | | | 113 | |
| | 92,808 | | | | | Raymond James Financial, Inc | | | 4,844 | |
| | 4,005 | | | * | | Regional Management Corp | | | 136 | |
| | 9,098 | | | | | Resource America, Inc (Class A) | | | 85 | |
| | 19,711 | | | * | | Safeguard Scientifics, Inc | | | 396 | |
| | 109,665 | | | | | SEI Investments Co | | | 3,809 | |
| | 337,831 | | | | | SLM Corp | | | 8,878 | |
| | 34,070 | | | | | Solar Capital Ltd | | | 768 | |
| | 8,927 | | | | | Solar Senior Capital Ltd | | | 163 | |
| | 14,000 | | | | | SPDR S&P MidCap 400 ETF Trust | | | 3,419 | |
| | 242,000 | | | | | SPDR Trust Series 1 | | | 44,690 | |
| | 18,800 | | | *,e | | Springleaf Holdings, Inc | | | 475 | |
| | 348,165 | | | | | State Street Corp | | | 25,552 | |
COLLEGE RETIREMENT EQUITIES FUND - Equity Index Account
| SHARES | | | | | COMPANY | | VALUE
(000) | |
| | 8,917 | | | e | | Stellus Capital Investment Corp | | $ | 133 | |
| | 48,147 | | | * | | Stifel Financial Corp | | | 2,307 | |
| | 26,347 | | | * | | SWS Group, Inc | | | 160 | |
| | 197,360 | | | | | T Rowe Price Group, Inc | | | 16,533 | |
| | 26,893 | | | | | TCP Capital Corp | | | 451 | |
| | 177,302 | | | | | TD Ameritrade Holding Corp | | | 5,433 | |
| | 25,867 | | | | | THL Credit, Inc | | | 427 | |
| | 39,767 | | | e | | TICC Capital Corp | | | 411 | |
| | 20,596 | | | | | Triangle Capital Corp | | | 569 | |
| | 5,194 | | | * | | Virtus Investment Partners, Inc | | | 1,039 | |
| | 65,189 | | | | | Waddell & Reed Financial, Inc (Class A) | | | 4,245 | |
| | 30,353 | | | * | | Walter Investment Management Corp | | | 1,073 | |
| | 5,409 | | | | | Westwood Holdings Group, Inc | | | 335 | |
| | 5,336 | | | e | | WhiteHorse Finance, Inc | | | 81 | |
| | 76,546 | | | * | | WisdomTree Investments, Inc | | | 1,356 | |
| | 7,647 | | | *,e | | World Acceptance Corp | | | 669 | |
| | | | | | | TOTAL DIVERSIFIED FINANCIALS | | 1,058,988 | |
| | | | | | |
| ENERGY - 9.2% | | |
| | 70,225 | | | * | | Abraxas Petroleum Corp | | | 230 | |
| | 1,730 | | | | | Adams Resources & Energy, Inc | | | 118 | |
| | 17,965 | | | e | | Alon USA Energy, Inc | | | 297 | |
| | 172,068 | | | * | | Alpha Natural Resources, Inc | | | 1,229 | |
| | 13,406 | | | *,e | | Amyris Biotechnologies, Inc | | | 71 | |
| | 382,330 | | | | | Anadarko Petroleum Corp | | | 30,326 | |
| | 29,400 | | | * | | Antero Resources Corp | | | 1,865 | |
| | 299,215 | | | | | Apache Corp | | | 25,715 | |
| | 6,580 | | | *,e | | APCO Argentina, Inc | | | 103 | |
| | 25,857 | | | *,e | | Approach Resources, Inc | | | 499 | |
| | 170,075 | | | e | | Arch Coal, Inc | | | 757 | |
| | 13,800 | | | * | | Athlon Energy, Inc | | | 417 | |
| | 42,045 | | | * | | Atwood Oceanics, Inc | | | 2,245 | |
| | 337,587 | | | | | Baker Hughes, Inc | | | 18,655 | |
| | 23,122 | | | * | | Basic Energy Services, Inc | | | 365 | |
| | 36,863 | | | *,e | | Bill Barrett Corp | | | 987 | |
| | 6,457 | | | | | Bolt Technology Corp | | | 142 | |
| | 23,393 | | | * | | Bonanza Creek Energy, Inc | | | 1,017 | |
| | 90,573 | | | *,e | | BPZ Energy, Inc | | | 165 | |
| | 27,621 | | | | | Bristow Group, Inc | | | 2,073 | |
| | 34,352 | | | *,e | | C&J Energy Services, Inc | | | 794 | |
| | 320,466 | | | | | Cabot Oil & Gas Corp | | | 12,421 | |
| | 79,978 | | | *,e | | Cal Dive International, Inc | | | 161 | |
| | 30,407 | | | * | | Callon Petroleum Co | | | 199 | |
| | 188,599 | | | * | | Cameron International Corp | | | 11,227 | |
| | 15,028 | | | e | | CARBO Ceramics, Inc | | | 1,751 | |
| | 30,645 | | | * | | Carrizo Oil & Gas, Inc | | | 1,372 | |
| | 185,199 | | | * | | Cheniere Energy, Inc | | | 7,986 | |
COLLEGE RETIREMENT EQUITIES FUND - Equity Index Account
| SHARES | | | | | COMPANY | | VALUE
(000) | |
| | 440,764 | | | | | Chesapeake Energy Corp | | $ | 11,962 | |
| | 1,477,880 | | | | | Chevron Corp | | | 184,602 | |
| | 66,090 | | | | | Cimarex Energy Co | | | 6,933 | |
| | 4,602 | | | * | | Clayton Williams Energy, Inc | | | 377 | |
| | 50,466 | | | *,e | | Clean Energy Fuels Corp | | | 650 | |
| | 46,507 | | | * | | Cloud Peak Energy, Inc | | | 837 | |
| | 208,263 | | | * | | Cobalt International Energy, Inc | | | 3,426 | |
| | 36,545 | | | | | Comstock Resources, Inc | | | 668 | |
| | 79,401 | | | * | | Concho Resources, Inc | | | 8,575 | |
| | 932,077 | | | | | ConocoPhillips | | | 65,851 | |
| | 173,265 | | | | | Consol Energy, Inc | | | 6,591 | |
| | 10,581 | | | * | | Contango Oil & Gas Co | | | 500 | |
| | 32,408 | | | *,e | | Continental Resources, Inc | | | 3,647 | |
| | 36,397 | | | | | Crosstex Energy, Inc | | | 1,316 | |
| | 11,149 | | | | | CVR Energy, Inc | | | 484 | |
| | 6,271 | | | * | | Dawson Geophysical Co | | | 212 | |
| | 28,844 | | | | | Delek US Holdings, Inc | | | 993 | |
| | 283,577 | | | * | | Denbury Resources, Inc | | | 4,659 | |
| | 309,448 | | | | | Devon Energy Corp | | | 19,146 | |
| | 52,396 | | | e | | Diamond Offshore Drilling, Inc | | | 2,982 | |
| | 13,900 | | | * | | Diamondback Energy, Inc | | | 735 | |
| | 57,836 | | | * | | Dresser-Rand Group, Inc | | | 3,449 | |
| | 30,642 | | | * | | Dril-Quip, Inc | | | 3,368 | |
| | 43,233 | | | * | | Emerald Oil, Inc | | | 331 | |
| | 39,982 | | | *,e | | Endeavour International Corp | | | 210 | |
| | 55,035 | | | | | Energen Corp | | | 3,894 | |
| | 60,585 | | | | | Energy XXI Bermuda Ltd | | | 1,639 | |
| | 207,435 | | | | | EOG Resources, Inc | | | 34,816 | |
| | 21,960 | | | * | | EPL Oil & Gas, Inc | | | 626 | |
| | 27,387 | | | | | Equal Energy Ltd | | | 146 | |
| | 114,287 | | | | | Equitable Resources, Inc | | | 10,261 | |
| | 16,143 | | | * | | Era Group, Inc | | | 498 | |
| | 11,704 | | | | | Evolution Petroleum Corp | | | 144 | |
| | 104,447 | | | e | | EXCO Resources, Inc | | | 555 | |
| | 46,375 | | | * | | Exterran Holdings, Inc | | | 1,586 | |
| | 3,389,888 | | | d | | Exxon Mobil Corp | | | 343,057 | |
| | 181,300 | | | * | | FMC Technologies, Inc | | | 9,466 | |
| | 91,201 | | | * | | Forest Oil Corp | | | 329 | |
| | 29,897 | | | * | | Forum Energy Technologies, Inc | | | 845 | |
| | 26,300 | | | | | Frank’s International NV | | | 710 | |
| | 39,564 | | | *,e | | Frontline Ltd | | | 148 | |
| | 36,931 | | | *,e | | FX Energy, Inc | | | 135 | |
| | 17,507 | | | | | GasLog Ltd | | | 299 | |
| | 51,404 | | | * | | Gastar Exploration Ltd | | | 356 | |
| | 9,836 | | | *,e | | Geospace Technologies Corp | | | 933 | |
| | 20,626 | | | * | | Global Geophysical Services, Inc | | | 33 | |
| | 34,474 | | | e | | Golar LNG Ltd | | | 1,251 | |
COLLEGE RETIREMENT EQUITIES FUND - Equity Index Account
| SHARES | | | | | COMPANY | | VALUE
(000) | |
| | 24,817 | | | *,e | | Goodrich Petroleum Corp | | $ | 422 | |
| | 20,962 | | | | | Green Plains Renewable Energy, Inc | | | 406 | |
| | 11,124 | | | | | Gulf Island Fabrication, Inc | | | 258 | |
| | 20,444 | | | | | Gulfmark Offshore, Inc | | | 964 | |
| | 58,937 | | | * | | Gulfport Energy Corp | | | 3,722 | |
| | 176,659 | | | *,e | | Halcon Resources Corp | | | 682 | |
| | 3,710 | | | | | Hallador Petroleum Co | | | 30 | |
| | 645,604 | | | | | Halliburton Co | | | 32,764 | |
| | 81,306 | | | * | | Helix Energy Solutions Group, Inc | | | 1,885 | |
| | 71,374 | | | | | Helmerich & Payne, Inc | | | 6,001 | |
| | 121,560 | | | * | | Hercules Offshore, Inc | | | 794 | |
| | 233,636 | | | | | Hess Corp | | | 19,392 | |
| | 156,766 | | | | | Holly Corp | | | 7,790 | |
| | 27,723 | | | * | | Hornbeck Offshore Services, Inc | | | 1,365 | |
| | 100,154 | | | * | | ION Geophysical Corp | | | 330 | |
| | 823 | | | *,e | | Isramco, Inc | | | 105 | |
| | 8,500 | | | * | | Jones Energy, Inc (Class A) | | | 123 | |
| | 118,324 | | | * | | Key Energy Services, Inc | | | 935 | |
| | 503,414 | | | | | Kinder Morgan, Inc | | | 18,123 | |
| | 33,098 | | | *,e | | KiOR, Inc (Class A) | | | 56 | |
| | 18,775 | | | | | Knightsbridge Tankers Ltd | | | 173 | |
| | 211,347 | | | * | | Kodiak Oil & Gas Corp | | | 2,369 | |
| | 73,463 | | | * | | Kosmos Energy LLC | | | 821 | |
| | 22,491 | | | *,e,m | | L&L Energy, Inc | | | 34 | |
| | 32,948 | | | * | | Laredo Petroleum Holdings, Inc | | | 912 | |
| | 128,410 | | | *,e | | Magnum Hunter Resources Corp | | | 939 | |
| | 538,829 | | | | | Marathon Oil Corp | | | 19,021 | |
| | 229,669 | | | | | Marathon Petroleum Corp | | | 21,068 | |
| | 44,270 | | | * | | Matador Resources Co | | | 825 | |
| | 23,922 | | | * | | Matrix Service Co | | | 585 | |
| | 188,124 | | | *,e | | McDermott International, Inc | | | 1,723 | |
| | 25,277 | | | *,e | | Midstates Petroleum Co, Inc | | | 167 | |
| | 37,819 | | | *,e | | Miller Petroleum, Inc | | | 266 | |
| | 9,855 | | | * | | Mitcham Industries, Inc | | | 175 | |
| | 145,088 | | | | | Murphy Oil Corp | | | 9,413 | |
| | 223,659 | | | | | Nabors Industries Ltd | | | 3,800 | |
| | 325,737 | | | | | National Oilwell Varco, Inc | | | 25,906 | |
| | 9,713 | | | * | | Natural Gas Services Group, Inc | | | 268 | |
| | 103,184 | | | * | | Newfield Exploration Co | | | 2,541 | |
| | 69,133 | | | * | | Newpark Resources, Inc | | | 850 | |
| | 274,067 | | | | | Noble Energy, Inc | | | 18,667 | |
| | 48,702 | | | e | | Nordic American Tanker Shipping | | | 472 | |
| | 48,403 | | | *,e | | Northern Oil And Gas, Inc | | | 729 | |
| | 16,270 | | | *,e | | Nuverra Environmental Solutions, Inc | | | 273 | |
| | 71,421 | | | * | | Oasis Petroleum, Inc | | | 3,355 | |
| | 614,184 | | | | | Occidental Petroleum Corp | | | 58,409 | |
| | 82,172 | | | | | Oceaneering International, Inc | | | 6,482 | |
COLLEGE RETIREMENT EQUITIES FUND - Equity Index Account
| | | | | | | | VALUE | |
| SHARES | | | | | COMPANY | | (000) | |
| | 42,049 | | | * | | Oil States International, Inc | | $ | 4,277 | |
| | 5,367 | | | | | Panhandle Oil and Gas, Inc (Class A) | | | 179 | |
| | 96,030 | | | * | | Parker Drilling Co | | | 781 | |
| | 113,291 | | | | | Patterson-UTI Energy, Inc | | | 2,869 | |
| | 18,000 | | | e | | PBF Energy, Inc | | | 566 | |
| | 27,088 | | | * | | PDC Energy, Inc | | | 1,442 | |
| | 207,042 | | | | | Peabody Energy Corp | | | 4,044 | |
| | 42,828 | | | *,e | | Penn Virginia Corp | | | 404 | |
| | 43,261 | | | * | | Petroquest Energy, Inc | | | 187 | |
| | 9,723 | | | * | | PHI, Inc | | | 422 | |
| | 472,335 | | | | | Phillips 66 | | | 36,431 | |
| | 42,944 | | | * | | Pioneer Energy Services Corp | | | 344 | |
| | 104,062 | | | | | Pioneer Natural Resources Co | | | 19,155 | |
| | 136,144 | | | | | Questar Market Resources, Inc | | | 4,173 | |
| | 106,368 | | | *,e | | Quicksilver Resources, Inc | | | 327 | |
| | 124,202 | | | | | Range Resources Corp | | | 10,471 | |
| | 21,954 | | | *,e | | Renewable Energy Group, Inc | | | 252 | |
| | 51,813 | | | *,e | | Resolute Energy Corp | | | 468 | |
| | 36,039 | | | * | | Rex Energy Corp | | | 710 | |
| | 5,384 | | | * | | Rex Stores Corp | | | 241 | |
| | 9,601 | | | * | | RigNet, Inc | | | 460 | |
| | 45,950 | | | * | | Rosetta Resources, Inc | | | 2,207 | |
| | 93,726 | | | * | | Rowan Cos plc | | | 3,314 | |
| | 49,925 | | | e | | RPC, Inc | | | 891 | |
| | 29,011 | | | *,e | | Sanchez Energy Corp | | | 711 | |
| | 375,818 | | | *,e | | SandRidge Energy, Inc | | | 2,281 | |
| | 1,013,608 | | | | | Schlumberger Ltd | | | 91,336 | |
| | 140,502 | | | | | Scorpio Tankers, Inc | | | 1,657 | |
| | 15,043 | | | *,e | | SEACOR Holdings, Inc | | | 1,372 | |
| | 270,257 | | | e | | Seadrill Ltd | | | 11,102 | |
| | 31,863 | | | | | SemGroup Corp | | | 2,078 | |
| | 40,831 | | | e | | Ship Finance International Ltd | | | 669 | |
| | 36,371 | | | *,e | | Solazyme, Inc | | | 396 | |
| | 266,793 | | | * | | Southwestern Energy Co | | | 10,493 | |
| | 508,692 | | | | | Spectra Energy Corp | | | 18,120 | |
| | 49,940 | | | | | St. Mary Land & Exploration Co | | | 4,151 | |
| | 38,145 | | | * | | Stone Energy Corp | | | 1,319 | |
| | 120,353 | | | * | | Superior Energy Services | | | 3,203 | |
| | 39,048 | | | *,e | | Swift Energy Co | | | 527 | |
| | 44,222 | | | * | | Synergy Resources Corp | | | 409 | |
| | 24,801 | | | | | Targa Resources Investments, Inc | | | 2,187 | |
| | 27,666 | | | | | Teekay Corp | | | 1,328 | |
| | 48,134 | | | e | | Teekay Tankers Ltd (Class A) | | | 189 | |
| | 23,351 | | | * | | Tesco Corp | | | 462 | |
| | 104,350 | | | | | Tesoro Corp | | | 6,104 | |
| | 61,337 | | | * | | Tetra Technologies, Inc | | | 758 | |
| | 11,511 | | | * | | TGC Industries, Inc | | | 84 | |
COLLEGE RETIREMENT EQUITIES FUND - Equity Index Account
| | | | | | | | | VALUE | |
| SHARES | | | | | COMPANY | | (000) | |
| | 36,444 | | | | | Tidewater, Inc | | $ | 2,160 | |
| | 51,822 | | | *,e | | Triangle Petroleum Corp | | | 431 | |
| | 117,937 | | | *,e | | Ultra Petroleum Corp | | | 2,553 | |
| | 36,980 | | | * | | Unit Corp | | | 1,909 | |
| | 76,523 | | | *,e | | Uranium Energy Corp | | | 153 | |
| | 94,356 | | | *,e | | Ur-Energy, Inc | | | 130 | |
| | 48,465 | | | * | | Vaalco Energy, Inc | | | 334 | |
| | 416,910 | | | | | Valero Energy Corp | | | 21,012 | |
| | 169,150 | | | *,e | | Vantage Drilling Co | | | 311 | |
| | 26,733 | | | e | | W&T Offshore, Inc | | | 428 | |
| | 67,894 | | | * | | Warren Resources, Inc | | | 213 | |
| | 41,371 | | | e | | Western Refining, Inc | | | 1,755 | |
| | 7,723 | | | * | | Westmoreland Coal Co | | | 149 | |
| | 89,390 | | | * | | Whiting Petroleum Corp | | | 5,531 | |
| | 33,654 | | | * | | Willbros Group, Inc | | | 317 | |
| | 519,114 | | | | | Williams Cos, Inc | | | 20,022 | |
| | 55,107 | | | e | | World Fuel Services Corp | | | 2,378 | |
| | 151,612 | | | * | | WPX Energy, Inc | | | 3,090 | |
| | 19,733 | | | *,e | | ZaZa Energy Corp | | | 19 | |
| | | | | | | TOTAL ENERGY | | | 1,462,254 | |
| | | | | | | | | | | |
| FOOD & STAPLES RETAILING - 2.0% | | | | |
| | 14,244 | | | | | Andersons, Inc | | | 1,270 | |
| | 837 | | | | | Arden Group, Inc (Class A) | | | 106 | |
| | 29,135 | | | | | Casey’s General Stores, Inc | | | 2,047 | |
| | 14,374 | | | * | | Chefs’ Warehouse Holdings, Inc | | | 419 | |
| | 332,985 | | | | | Costco Wholesale Corp | | | 39,629 | |
| | 933,442 | | | | | CVS Corp | | | 66,806 | |
| | 11,866 | | | *,e | | Fairway Group Holdings Corp | | | 215 | |
| | 31,233 | | | * | | Fresh Market, Inc | | | 1,265 | |
| | 37,737 | | | | | Harris Teeter Supermarkets, Inc | | | 1,862 | |
| | 8,163 | | | | | Ingles Markets, Inc (Class A) | | | 221 | |
| | 395,571 | | | | | Kroger Co | | | 15,637 | |
| | 6,410 | | | *,e | | Natural Grocers by Vitamin C | | | 272 | |
| | 16,292 | | | * | | Pantry, Inc | | | 273 | |
| | 14,319 | | | | | Pricesmart, Inc | | | 1,655 | |
| | 553,974 | | | * | | Rite Aid Corp | | | 2,803 | |
| | 19,881 | | | e | | Roundy’s, Inc | | | 196 | |
| | 183,872 | | | e | | Safeway, Inc | | | 5,989 | |
| | 28,394 | | | | | Spartan Stores, Inc | | | 689 | |
| | 15,500 | | | * | | Sprouts Farmers Market, Inc | | | 596 | |
| | 154,781 | | | *,e | | Supervalu, Inc | | | 1,128 | |
| | 13,980 | | | * | | Susser Holdings Corp | | | 916 | |
| | 452,325 | | | | | Sysco Corp | | | 16,329 | |
| | 38,243 | | | * | | United Natural Foods, Inc | | | 2,883 | |
| | 4,843 | | | | | Village Super Market (Class A) | | | 150 | |
COLLEGE RETIREMENT EQUITIES FUND - Equity Index Account
| | | | | | | | | VALUE | |
| SHARES | | | | | COMPANY | | (000) | |
| | 722,923 | | | | | Walgreen Co | | $ | 41,525 | |
| | 1,227,726 | | | | | Wal-Mart Stores, Inc | | | 96,610 | |
| | 8,834 | | | | | Weis Markets, Inc | | | 464 | |
| | 283,486 | | | | | Whole Foods Market, Inc | | | 16,394 | |
| | | | | | | TOTAL FOOD & STAPLES RETAILING | | | 318,349 | |
| | | | | | | | | | | |
| FOOD, BEVERAGE & TOBACCO - 4.6% | | | | |
| | 2,319 | | | | | Alico, Inc | | | 90 | |
| | 68,179 | | | * | | Alliance One International, Inc | | | 208 | |
| | 1,531,148 | | | | | Altria Group, Inc | | | 58,781 | |
| | 10,027 | | | *,e | | Annie’s, Inc | | | 432 | |
| | 503,456 | | | | | Archer Daniels Midland Co | | | 21,850 | |
| | 40,577 | | | | | B&G Foods, Inc (Class A) | | | 1,376 | |
| | 122,773 | | | | | Beam, Inc | | | 8,356 | |
| | 6,146 | | | *,e | | Boston Beer Co, Inc (Class A) | | | 1,486 | |
| | 44,670 | | | * | | Boulder Brands, Inc | | | 708 | |
| | 114,934 | | | | | Brown-Forman Corp (Class B) | | | 8,686 | |
| | 111,586 | | | | | Bunge Ltd | | | 9,162 | |
| | 9,305 | | | | | Calavo Growers, Inc | | | 282 | |
| | 10,929 | | | | | Cal-Maine Foods, Inc | | | 658 | |
| | 133,322 | | | e | | Campbell Soup Co | | | 5,770 | |
| | 35,476 | | | * | | Chiquita Brands International, Inc | | | 415 | |
| | 3,512 | | | | | Coca-Cola Bottling Co Consolidated | | | 257 | |
| | 2,915,970 | | | | | Coca-Cola Co | | | 120,459 | |
| | 196,725 | | | | | Coca-Cola Enterprises, Inc | | | 8,681 | |
| | 316,741 | | | | | ConAgra Foods, Inc | | | 10,674 | |
| | 117,161 | | | * | | Constellation Brands, Inc (Class A) | | | 8,246 | |
| | 7,653 | | | * | | Craft Brewers Alliance, Inc | | | 126 | |
| | 121,494 | | | * | | Darling International, Inc | | | 2,537 | |
| | 70,011 | | | * | | Dean Foods Co | | | 1,204 | |
| | 16,103 | | | *,e | | Diamond Foods, Inc | | | 416 | |
| | 155,039 | | | | | Dr Pepper Snapple Group, Inc | | | 7,554 | |
| | 5,320 | | | * | | Farmer Bros Co | | | 124 | |
| | 128,238 | | | | | Flowers Foods, Inc | | | 2,753 | |
| | 27,620 | | | | | Fresh Del Monte Produce, Inc | | | 782 | |
| | 492,079 | | | | | General Mills, Inc | | | 24,560 | |
| | 113,862 | | | *,e | | Green Mountain Coffee Roasters, Inc | | | 8,606 | |
| | 2,482 | | | | | Griffin Land & Nurseries, Inc (Class A) | | | 83 | |
| | 29,164 | | | * | | Hain Celestial Group, Inc | | | 2,648 | |
| | 114,104 | | | | | Hershey Co | | | 11,094 | |
| | 93,510 | | | | | Hillshire Brands Co | | | 3,127 | |
| | 102,534 | | | | | Hormel Foods Corp | | | 4,631 | |
| | 59,068 | | | | | Ingredion, Inc | | | 4,044 | |
| | 10,713 | | | * | | Inventure Foods, Inc | | | 142 | |
| | 11,326 | | | | | J&J Snack Foods Corp | | | 1,003 | |
| | 81,528 | | | | | J.M. Smucker Co | | | 8,448 | |
| | 5,780 | | | | | John B. Sanfilippo & Son, Inc | | | 143 | |
COLLEGE RETIREMENT EQUITIES FUND - Equity Index Account
| | | | | | | | | VALUE | |
| SHARES | | | | | COMPANY | | (000) | |
| | 197,954 | | | | | Kellogg Co | | $ | 12,089 | |
| | 453,881 | | | | | Kraft Foods Group, Inc | | | 24,473 | |
| | 13,050 | | | | | Lancaster Colony Corp | | | 1,150 | |
| | 38,935 | | | | | Lance, Inc | | | 1,118 | |
| | 3,603 | | | e | | Lifeway Foods, Inc | | | 58 | |
| | 6,464 | | | | | Limoneira Co | | | 172 | |
| | 289,311 | | | | | Lorillard, Inc | | | 14,662 | |
| | 100,712 | | | | | McCormick & Co, Inc | | | 6,941 | |
| | 155,186 | | | | | Mead Johnson Nutrition Co | | | 12,998 | |
| | 106,487 | | | | | Molson Coors Brewing Co (Class B) | | | 5,979 | |
| | 1,362,591 | | | | | Mondelez International, Inc | | | 48,099 | |
| | 102,054 | | | * | | Monster Beverage Corp | | | 6,916 | |
| | 5,604 | | | * | | National Beverage Corp | | | 113 | |
| | 15,084 | | | * | | Omega Protein Corp | | | 185 | |
| | 1,178,968 | | | | | PepsiCo, Inc | | | 97,783 | |
| | 1,246,887 | | | | | Philip Morris International, Inc | | | 108,641 | |
| | 45,390 | | | * | | Pilgrim’s Pride Corp | | | 738 | |
| | 25,540 | | | | | Pinnacle Foods, Inc | | | 701 | |
| | 24,973 | | | * | | Post Holdings, Inc | | | 1,230 | |
| | 239,445 | | | | | Reynolds American, Inc | | | 11,970 | |
| | 17,484 | | | | | Sanderson Farms, Inc | | | 1,265 | |
| | 224 | | | * | | Seaboard Corp | | | 626 | |
| | 6,106 | | | * | | Seneca Foods Corp | | | 195 | |
| | 14,223 | | | *,e | | Synutra International, Inc | | | 126 | |
| | 14,911 | | | e | | Tootsie Roll Industries, Inc | | | 485 | |
| | 28,438 | | | * | | TreeHouse Foods, Inc | | | 1,960 | |
| | 212,762 | | | | | Tyson Foods, Inc (Class A) | | | 7,119 | |
| | 17,708 | | | e | | Universal Corp | | | 967 | |
| | 50,271 | | | e | | Vector Group Ltd | | | 823 | |
| | 105,268 | | | * | | WhiteWave Foods Co (Class A) | | | 2,415 | |
| | | | | | | TOTAL FOOD, BEVERAGE & TOBACCO | | | 722,599 | |
| | | | | | | | | | | |
| HEALTH CARE EQUIPMENT & SERVICES - 4.5% | | | | |
| | 15,924 | | | * | | Abaxis, Inc | | | 637 | |
| | 1,189,465 | | | | | Abbott Laboratories | | | 45,592 | |
| | 29,721 | | | *,e | | Abiomed, Inc | | | 795 | |
| | 26,970 | | | * | | Acadia Healthcare Co, Inc | | | 1,277 | |
| | 43,084 | | | *,e | | Accretive Health, Inc | | | 395 | |
| | 52,299 | | | *,e | | Accuray, Inc | | | 456 | |
| | 4,240 | | | * | | Addus HomeCare Corp | | | 95 | |
| | 289,062 | | | | | Aetna, Inc | | | 19,827 | |
| | 29,433 | | | * | | Air Methods Corp | | | 1,717 | |
| | 55,710 | | | * | | Align Technology, Inc | | | 3,184 | |
| | 4,207 | | | * | | Alliance HealthCare Services, Inc | | | 104 | |
| | 133,589 | | | * | | Allscripts Healthcare Solutions, Inc | | | 2,065 | |
| | 7,268 | | | * | | Almost Family, Inc | | | 235 | |
| | 39,818 | | | * | | Alphatec Holdings, Inc | | | 80 | |
COLLEGE RETIREMENT EQUITIES FUND - Equity Index Account
| | | | | | | | | VALUE | |
| SHARES | | | | | COMPANY | | (000) | |
| | 21,596 | | | * | | Amedisys, Inc | | $ | 316 | |
| | 176,361 | | | | | AmerisourceBergen Corp | | | 12,400 | |
| | 34,893 | | | * | | AMN Healthcare Services, Inc | | | 513 | |
| | 23,448 | | | * | | Amsurg Corp | | | 1,077 | |
| | 9,253 | | | | | Analogic Corp | | | 819 | |
| | 18,523 | | | * | | Angiodynamics, Inc | | | 318 | |
| | 8,891 | | | * | | Anika Therapeutics, Inc | | | 339 | |
| | 91,526 | | | *,e | | Antares Pharma, Inc | | | 410 | |
| | 20,843 | | | * | | Arthrocare Corp | | | 839 | |
| | 27,901 | | | *,e | | athenahealth, Inc | | | 3,753 | |
| | 15,737 | | | * | | AtriCure, Inc | | | 294 | |
| | 1,165 | | | | | Atrion Corp | | | 345 | |
| | 61,206 | | | | | Bard (C.R.), Inc | | | 8,198 | |
| | 413,548 | | | | | Baxter International, Inc | | | 28,762 | |
| | 147,715 | | | | | Becton Dickinson & Co | | | 16,321 | |
| | 22,779 | | | *,e | | Biolase Technology, Inc | | | 64 | |
| | 17,746 | | | *,e | | Bio-Reference Labs, Inc | | | 453 | |
| | 44,213 | | | * | | BioScrip, Inc | | | 327 | |
| | 1,025,414 | | | * | | Boston Scientific Corp | | | 12,325 | |
| | 77,576 | | | * | | Brookdale Senior Living, Inc | | | 2,109 | |
| | 27,942 | | | | | Cantel Medical Corp | | | 948 | |
| | 21,051 | | | * | | Capital Senior Living Corp | | | 505 | |
| | 259,817 | | | | | Cardinal Health, Inc | | | 17,358 | |
| | 15,037 | | | * | | Cardiovascular Systems, Inc | | | 516 | |
| | 166,970 | | | * | | CareFusion Corp | | | 6,649 | |
| | 156,388 | | | * | | Catamaran Corp | | | 7,425 | |
| | 41,366 | | | * | | Centene Corp | | | 2,439 | |
| | 227,368 | | | * | | Cerner Corp | | | 12,674 | |
| | 49,516 | | | *,e | | Cerus Corp | | | 319 | |
| | 14,552 | | | e | | Chemed Corp | | | 1,115 | |
| | 8,056 | | | * | | Chindex International, Inc | | | 140 | |
| | 217,555 | | | | | Cigna Corp | | | 19,032 | |
| | 71,850 | | | * | | Community Health Systems, Inc | | | 2,822 | |
| | 9,537 | | | | | Computer Programs & Systems, Inc | | | 589 | |
| | 22,053 | | | | | Conmed Corp | | | 937 | |
| | 37,072 | | | | | Cooper Cos, Inc | | | 4,591 | |
| | 12,032 | | | * | | Corvel Corp | | | 562 | |
| | 359,706 | | | | | Covidien plc | | | 24,496 | |
| | 22,090 | | | * | | Cross Country Healthcare, Inc | | | 220 | |
| | 19,963 | | | | | CryoLife, Inc | | | 221 | |
| | 10,626 | | | * | | Cutera, Inc | | | 108 | |
| | 20,834 | | | * | | Cyberonics, Inc | | | 1,365 | |
| | 12,860 | | | * | | Cynosure, Inc (Class A) | | | 343 | |
| | 141,772 | | | * | | DaVita, Inc | | | 8,984 | |
| | 109,051 | | | | | Dentsply International, Inc | | | 5,287 | |
| | 10,143 | | | *,e | | Derma Sciences, Inc | | | 110 | |
| | 53,654 | | | * | | DexCom, Inc | | | 1,900 | |
COLLEGE RETIREMENT EQUITIES FUND - Equity Index Account
| | | | | | | | | VALUE | |
| SHARES | | | | | COMPANY | | (000) | |
| | 85,882 | | | * | | Edwards Lifesciences Corp | | $ | 5,648 | |
| | 30,361 | | | * | | Emeritus Corp | | | 657 | |
| | 47,927 | | | * | | Endologix, Inc | | | 836 | |
| | 14,856 | | | | | Ensign Group, Inc | | | 658 | |
| | 36,800 | | | * | | Envision Healthcare Holdings, Inc | | | 1,307 | |
| | 7,074 | | | * | | Exactech, Inc | | | 168 | |
| | 23,160 | | | * | | ExamWorks Group, Inc | | | 692 | |
| | 624,270 | | | * | | Express Scripts Holding Co | | | 43,849 | |
| | 29,310 | | | * | | Five Star Quality Care, Inc | | | 161 | |
| | 30,765 | | | * | | GenMark Diagnostics, Inc | | | 409 | |
| | 22,160 | | | * | | Gentiva Health Services, Inc | | | 275 | |
| | 41,537 | | | * | | Globus Medical, Inc | | | 838 | |
| | 18,107 | | | * | | Greatbatch, Inc | | | 801 | |
| | 38,562 | | | * | | Haemonetics Corp | | | 1,625 | |
| | 25,502 | | | * | | Hanger Orthopedic Group, Inc | | | 1,003 | |
| | 203,382 | | | * | | HCA Holdings, Inc | | | 9,703 | |
| | 197,006 | | | * | | Health Management Associates, Inc (Class A) | | | 2,581 | |
| | 60,101 | | | * | | Health Net, Inc | | | 1,783 | |
| | 66,457 | | | | | Healthsouth Corp | | | 2,214 | |
| | 14,864 | | | * | | HealthStream, Inc | | | 487 | |
| | 28,116 | | | * | | Healthways, Inc | | | 432 | |
| | 12,504 | | | * | | HeartWare International, Inc | | | 1,175 | |
| | 66,261 | | | * | | Henry Schein, Inc | | | 7,571 | |
| | 46,960 | | | | | Hill-Rom Holdings, Inc | | | 1,941 | |
| | 65,676 | | | * | | HMS Holdings Corp | | | 1,493 | |
| | 204,404 | | | * | | Hologic, Inc | | | 4,568 | |
| | 119,912 | | | | | Humana, Inc | | | 12,377 | |
| | 9,893 | | | * | | ICU Medical, Inc | | | 630 | |
| | 41,103 | | | *,e | | Idexx Laboratories, Inc | | | 4,372 | |
| | 39,836 | | | * | | Insulet Corp | | | 1,478 | |
| | 16,089 | | | * | | Integra LifeSciences Holdings Corp | | | 768 | |
| | 29,188 | | | * | | Intuitive Surgical, Inc | | | 11,211 | |
| | 23,110 | | | | | Invacare Corp | | | 536 | |
| | 62,113 | | | * | | Inverness Medical Innovations, Inc | | | 2,249 | |
| | 12,768 | | | * | | IPC The Hospitalist Co, Inc | | | 758 | |
| | 38,766 | | | | | Kindred Healthcare, Inc | | | 765 | |
| | 70,372 | | | * | | Laboratory Corp of America Holdings | | | 6,430 | |
| | 8,629 | | | | | Landauer, Inc | | | 454 | |
| | 11,927 | | | * | | LHC Group, Inc | | | 287 | |
| | 36,120 | | | * | | LifePoint Hospitals, Inc | | | 1,909 | |
| | 20,796 | | | * | | Magellan Health Services, Inc | | | 1,246 | |
| | 38,810 | | | * | | Masimo Corp | | | 1,134 | |
| | 172,760 | | | | | McKesson Corp | | | 27,883 | |
| | 44,883 | | | * | | MedAssets, Inc | | | 890 | |
| | 10,881 | | | * | | Medical Action Industries, Inc | | | 93 | |
| | 39,902 | | | * | | Medidata Solutions, Inc | | | 2,417 | |
COLLEGE RETIREMENT EQUITIES FUND - Equity Index Account
| | | | | | | | | VALUE | |
| SHARES | | | | | COMPANY | | (000) | |
| | 775,243 | | | | | Medtronic, Inc | | $ | 44,491 | |
| | 43,385 | | | * | | Merge Healthcare, Inc | | | 101 | |
| | 31,965 | | | e | | Meridian Bioscience, Inc | | | 848 | |
| | 32,366 | | | * | | Merit Medical Systems, Inc | | | 509 | |
| | 21,513 | | | * | | Molina Healthcare, Inc | | | 748 | |
| | 9,533 | | | * | | MWI Veterinary Supply, Inc | | | 1,626 | |
| | 8,081 | | | | | National Healthcare Corp | | | 436 | |
| | 5,598 | | | * | | National Research Corp | | | 105 | |
| | 22,829 | | | * | | Natus Medical, Inc | | | 514 | |
| | 27,729 | | | * | | Neogen Corp | | | 1,267 | |
| | 33,067 | | | * | | NuVasive, Inc | | | 1,069 | |
| | 45,234 | | | * | | NxStage Medical, Inc | | | 452 | |
| | 79,723 | | | | | Omnicare, Inc | | | 4,812 | |
| | 25,874 | | | * | | Omnicell, Inc | | | 661 | |
| | 36,642 | | | * | | OraSure Technologies, Inc | | | 230 | |
| | 14,876 | | | * | | Orthofix International NV | | | 339 | |
| | 48,567 | | | e | | Owens & Minor, Inc | | | 1,776 | |
| | 66,558 | | | | | Patterson Cos, Inc | | | 2,742 | |
| | 75,502 | | | * | | Pediatrix Medical Group, Inc | | | 4,030 | |
| | 23,814 | | | * | | PharMerica Corp | | | 512 | |
| | 9,836 | | | *,e | | PhotoMedex, Inc | | | 127 | |
| | 24,800 | | | * | | Premier, Inc | | | 912 | |
| | 8,598 | | | * | | Providence Service Corp | | | 221 | |
| | 29,676 | | | | | Quality Systems, Inc | | | 625 | |
| | 111,989 | | | e | | Quest Diagnostics, Inc | | | 5,996 | |
| | 21,781 | | | *,e | | Quidel Corp | | | 673 | |
| | 108,952 | | | e | | Resmed, Inc | | | 5,129 | |
| | 31,391 | | | *,e | | Rockwell Medical Technologies, Inc | | | 328 | |
| | 38,631 | | | * | | RTI Biologics, Inc | | | 137 | |
| | 36,584 | | | | | Select Medical Holdings Corp | | | 425 | |
| | 42,129 | | | * | | Sirona Dental Systems, Inc | | | 2,957 | |
| | 15,881 | | | * | | Skilled Healthcare Group, Inc (Class A) | | | 76 | |
| | 44,003 | | | * | | Solta Medical, Inc | | | 130 | |
| | 30,482 | | | * | | Spectranetics Corp | | | 762 | |
| | 215,715 | | | | | St. Jude Medical, Inc | | | 13,364 | |
| | 26,141 | | | * | | Staar Surgical Co | | | 423 | |
| | 44,285 | | | | | STERIS Corp | | | 2,128 | |
| | 252,822 | | | | | Stryker Corp | | | 18,997 | |
| | 13,627 | | | * | | SurModics, Inc | | | 332 | |
| | 32,497 | | | * | | Symmetry Medical, Inc | | | 328 | |
| | 52,336 | | | * | | Team Health Holdings, Inc | | | 2,384 | |
| | 19,871 | | | *,e | | TearLab Corp | | | 186 | |
| | 31,210 | | | | | Teleflex, Inc | | | 2,929 | |
| | 79,191 | | | * | | Tenet Healthcare Corp | | | 3,336 | |
| | 44,951 | | | * | | Thoratec Corp | | | 1,645 | |
| | 20,149 | | | * | | Tornier BV | | | 379 | |
COLLEGE RETIREMENT EQUITIES FUND - Equity Index Account
| | | | | | | | | VALUE | |
| SHARES | | | | | COMPANY | | (000) | |
| | 20,300 | | | * | | Triple-S Management Corp (Class B) | | $ | 395 | |
| | 77,329 | | | *,e | | Unilife Corp | | | 340 | |
| | 777,615 | | | | | UnitedHealth Group, Inc | | | 58,554 | |
| | 28,773 | | | | | Universal American Corp | | | 210 | |
| | 68,958 | | | | | Universal Health Services, Inc (Class B) | | | 5,604 | |
| | 8,422 | | | | | US Physical Therapy, Inc | | | 297 | |
| | 697 | | | *,e | | USMD Holdings, Inc | | | 14 | |
| | 2,349 | | | | | Utah Medical Products, Inc | | | 134 | |
| | 82,411 | | | * | | Varian Medical Systems, Inc | | | 6,403 | |
| | 12,709 | | | * | | Vascular Solutions, Inc | | | 294 | |
| | 66,310 | | | * | | VCA Antech, Inc | | | 2,079 | |
| | 11,900 | | | *,e | | Veeva Systems, Inc | | | 382 | |
| | 15,934 | | | * | | Vocera Communications, Inc | | | 249 | |
| | 44,457 | | | *,e | | Volcano Corp | | | 971 | |
| | 32,655 | | | * | | WellCare Health Plans, Inc | | | 2,300 | |
| | 228,279 | | | | | WellPoint, Inc | | | 21,091 | |
| | 52,696 | | | | | West Pharmaceutical Services, Inc | | | 2,585 | |
| | 33,963 | | | * | | Wright Medical Group, Inc | | | 1,043 | |
| | 12,908 | | | *,e | | Zeltiq Aesthetics, Inc | | | 244 | |
| | 127,984 | | | | | Zimmer Holdings, Inc | | | 11,927 | |
| | | | | | | TOTAL HEALTH CARE EQUIPMENT & SERVICES | | | 706,171 | |
| | | | | | | | | | | |
| HOUSEHOLD & PERSONAL PRODUCTS - 1.9% | | | | |
| | 332,448 | | | | | Avon Products, Inc | | | 5,725 | |
| | 39,882 | | | * | | Central Garden and Pet Co (Class A) | | | 269 | |
| | 105,332 | | | | | Church & Dwight Co, Inc | | | 6,982 | |
| | 100,251 | | | e | | Clorox Co | | | 9,299 | |
| | 710,631 | | | | | Colgate-Palmolive Co | | | 46,340 | |
| | 43,500 | | | e | | Coty, Inc | | | 663 | |
| | 19,608 | | | * | | Elizabeth Arden, Inc | | | 695 | |
| | 47,350 | | | | | Energizer Holdings, Inc | | | 5,125 | |
| | 176,366 | | | | | Estee Lauder Cos (Class A) | | | 13,284 | |
| | 15,213 | | | | | Female Health Co | | | 129 | |
| | 25,252 | | | * | | Harbinger Group, Inc | | | 299 | |
| | 66,040 | | | e | | Herbalife Ltd | | | 5,197 | |
| | 12,258 | | | | | Inter Parfums, Inc | | | 439 | |
| | 293,295 | | | | | Kimberly-Clark Corp | | | 30,638 | |
| | 74,599 | | | *,e | | Lifevantage Corp | | | 123 | |
| | 9,661 | | | * | | Medifast, Inc | | | 253 | |
| | 5,868 | | | | | Nature’s Sunshine Products, Inc | | | 102 | |
| | 44,175 | | | | | Nu Skin Enterprises, Inc (Class A) | | | 6,106 | |
| | 8,067 | | | * | | Nutraceutical International Corp | | | 216 | |
| | 3,981 | | | | | Oil-Dri Corp of America | | | 151 | |
| | 4,547 | | | | | Orchids Paper Products Co | | | 149 | |
| | 2,089,539 | | | | | Procter & Gamble Co | | | 170,109 | |
| | 9,587 | | | * | | Revlon, Inc (Class A) | | | 239 | |
| | 15,918 | | | | | Spectrum Brands, Inc | | | 1,123 | |
COLLEGE RETIREMENT EQUITIES FUND - Equity Index Account
| | | | | | | | | VALUE | |
| SHARES | | | | | COMPANY | | (000) | |
| | 110,286 | | | *,e | | Star Scientific, Inc | | $ | 128 | |
| | 5,403 | | | *,e | | USANA Health Sciences, Inc | | | 408 | |
| | 11,764 | | | | | WD-40 Co | | | 879 | |
| | | | | | | TOTAL HOUSEHOLD & PERSONAL PRODUCTS | | | 305,070 | |
| | | | | | | | | | | |
| INSURANCE - 4.2% | | | | |
| | 258,666 | | | | | ACE Ltd | | | 26,780 | |
| | 356,101 | | | | | Aflac, Inc | | | 23,788 | |
| | 12,775 | | | * | | Alleghany Corp | | | 5,109 | |
| | 26,404 | | | | | Allied World Assurance Co Holdings Ltd | | | 2,979 | |
| | 356,385 | | | | | Allstate Corp | | | 19,437 | |
| | 34,048 | | | * | | AMBAC Financial Group, Inc | | | 836 | |
| | 48,474 | | | | | American Equity Investment Life Holding Co | | | 1,279 | |
| | 59,156 | | | | | American Financial Group, Inc | | | 3,414 | |
| | 1,125,229 | | | | | American International Group, Inc | | | 57,443 | |
| | 5,469 | | | | | American National Insurance Co | | | 626 | |
| | 13,065 | | | | | Amerisafe, Inc | | | 552 | |
| | 23,097 | | | e | | Amtrust Financial Services, Inc | | | 755 | |
| | 235,462 | | | | | Aon plc | | | 19,753 | |
| | 101,165 | | | * | | Arch Capital Group Ltd | | | 6,039 | |
| | 20,783 | | | | | Argo Group International Holdings Ltd | | | 966 | |
| | 96,211 | | | | | Arthur J. Gallagher & Co | | | 4,515 | |
| | 50,374 | | | | | Aspen Insurance Holdings Ltd | | | 2,081 | |
| | 57,650 | | | | | Assurant, Inc | | | 3,826 | |
| | 129,363 | | | | | Assured Guaranty Ltd | | | 3,052 | |
| | 89,885 | | | | | Axis Capital Holdings Ltd | | | 4,276 | |
| | 6,904 | | | | | Baldwin & Lyons, Inc (Class B) | | | 189 | |
| | 1,372,059 | | | * | | Berkshire Hathaway, Inc (Class B) | | | 162,671 | |
| | 89,066 | | | | | Brown & Brown, Inc | | | 2,796 | |
| | 197,559 | | | | | Chubb Corp | | | 19,090 | |
| | 124,217 | | | | | Cincinnati Financial Corp | | | 6,505 | |
| | 32,879 | | | * | | Citizens, Inc (Class A) | | | 288 | |
| | 19,762 | | | | | CNA Financial Corp | | | 848 | |
| | 168,806 | | | | | Conseco, Inc | | | 2,986 | |
| | 19,001 | | | | | Crawford & Co (Class B) | | | 176 | |
| | 7,812 | | | | | Donegal Group, Inc (Class A) | | | 124 | |
| | 4,850 | | | | | Eastern Insurance Holdings, Inc | | | 119 | |
| | 14,028 | | | * | | eHealth, Inc | | | 652 | |
| | 4,503 | | | | | EMC Insurance Group, Inc | | | 138 | |
| | 24,104 | | | | | Employers Holdings, Inc | | | 763 | |
| | 31,468 | | | | | Endurance Specialty Holdings Ltd | | | 1,846 | |
| | 7,174 | | | * | | Enstar Group Ltd | | | 997 | |
| | 20,774 | | | | | Erie Indemnity Co (Class A) | | | 1,519 | |
| | 38,034 | | | | | Everest Re Group Ltd | | | 5,928 | |
| | 9,829 | | | | | FBL Financial Group, Inc (Class A) | | | 440 | |
| | 190,098 | | | | | Fidelity National Title Group, Inc (Class A) | | | 6,169 | |
| | 80,939 | | | | | First American Financial Corp | | | 2,282 | |
COLLEGE RETIREMENT EQUITIES FUND - Equity Index Account
| | | | | | | | | VALUE | |
| SHARES | | | | | COMPANY | | (000) | |
| | 4,187 | | | * | | Fortegra Financial Corp | | $ | 35 | |
| | 375,048 | | | * | | Genworth Financial, Inc (Class A) | | | 5,824 | |
| | 20,683 | | | * | | Greenlight Capital Re Ltd (Class A) | | | 697 | |
| | 7,438 | | | * | | Hallmark Financial Services | | | 66 | |
| | 33,724 | | | | | Hanover Insurance Group, Inc | | | 2,014 | |
| | 345,892 | | | | | Hartford Financial Services Group, Inc | | | 12,532 | |
| | 77,301 | | | | | HCC Insurance Holdings, Inc | | | 3,567 | |
| | 6,789 | | | e | | HCI Group, Inc | | | 363 | |
| | 2,870 | | | * | | Health Insurance Innovations, Inc | | | 29 | |
| | 49,340 | | | * | | Hilltop Holdings, Inc | | | 1,141 | |
| | 29,235 | | | | | Horace Mann Educators Corp | | | 922 | |
| | 5,951 | | | | | Independence Holding Co | | | 80 | |
| | 10,249 | | | | | Infinity Property & Casualty Corp | | | 735 | |
| | 862 | | | | | Investors Title Co | | | 70 | |
| | 2,854 | | | | | Kansas City Life Insurance Co | | | 136 | |
| | 37,633 | | | | | Kemper Corp | | | 1,538 | |
| | 203,899 | | | | | Lincoln National Corp | | | 10,525 | |
| | 233,503 | | | | | Loews Corp | | | 11,264 | |
| | 34,934 | | | | | Maiden Holdings Ltd | | | 382 | |
| | 10,487 | | | * | | Markel Corp | | | 6,086 | |
| | 420,252 | | | | | Marsh & McLennan Cos, Inc | | | 20,323 | |
| | 108,070 | | | * | | MBIA, Inc | | | 1,290 | |
| | 42,189 | | | | | Meadowbrook Insurance Group, Inc | | | 294 | |
| | 20,342 | | | | | Mercury General Corp | | | 1,011 | |
| | 682,950 | | | | | Metlife, Inc | | | 36,825 | |
| | 35,141 | | | | | Montpelier Re Holdings Ltd | | | 1,023 | |
| | 7,244 | | | | | National Interstate Corp | | | 167 | |
| | 1,551 | | | | | National Western Life Insurance Co (Class A) | | | 347 | |
| | 8,338 | | | * | | Navigators Group, Inc | | | 527 | |
| | 195,723 | | | | | Old Republic International Corp | | | 3,380 | |
| | 17,609 | | | | | OneBeacon Insurance Group Ltd (Class A) | | | 279 | |
| | 41,191 | | | | | PartnerRe Ltd | | | 4,343 | |
| | 4,932 | | | * | | Phoenix Cos, Inc | | | 303 | |
| | 24,214 | | | | | Platinum Underwriters Holdings Ltd | | | 1,484 | |
| | 43,301 | | | | | Primerica, Inc | | | 1,858 | |
| | 223,115 | | | | | Principal Financial Group | | | 11,002 | |
| | 46,842 | | | | | ProAssurance Corp | | | 2,271 | |
| | 460,432 | | | | | Progressive Corp | | | 12,556 | |
| | 61,341 | | | | | Protective Life Corp | | | 3,107 | |
| | 354,308 | | | | | Prudential Financial, Inc | | | 32,674 | |
| | 54,915 | | | | | Reinsurance Group of America, Inc (Class A) | | | 4,251 | |
| | 34,135 | | | | | RenaissanceRe Holdings Ltd | | | 3,323 | |
| | 16,141 | | | | | RLI Corp | | | 1,572 | |
| | 10,041 | | | | | Safety Insurance Group, Inc | | | 565 | |
| | 42,211 | | | | | Selective Insurance Group, Inc | | | 1,142 | |
| | 33,695 | | | | | Stancorp Financial Group, Inc | | | 2,232 | |
| | 9,480 | | | | | State Auto Financial Corp | | | 201 | |
COLLEGE RETIREMENT EQUITIES FUND - Equity Index Account
| | | | | | | | | VALUE | |
| SHARES | | | | | COMPANY | | (000) | |
| | 16,046 | | | | | Stewart Information Services Corp | | $ | 518 | |
| | 62,336 | | | | | Symetra Financial Corp | | | 1,182 | |
| | 19,300 | | | * | | Third Point Reinsurance Ltd | | | 358 | |
| | 70,622 | | | | | Torchmark Corp | | | 5,519 | |
| | 21,406 | | | e | | Tower Group International Ltd | | | 72 | |
| | 286,983 | | | | | Travelers Cos, Inc | | | 25,983 | |
| | 6,929 | | | * | | United America Indemnity Ltd | | | 175 | |
| | 16,961 | | | | | United Fire & Casualty Co | | | 486 | |
| | 22,242 | | | | | Universal Insurance Holdings, Inc | | | 322 | |
| | 202,943 | | | | | UnumProvident Corp | | | 7,119 | |
| | 79,239 | | | | | Validus Holdings Ltd | | | 3,193 | |
| | 82,061 | | | | | W.R. Berkley Corp | | | 3,561 | |
| | 4,646 | | | | | White Mountains Insurance Group Ltd | | | 2,802 | |
| | 221,856 | | | | | XL Capital Ltd | | | 7,064 | |
| | | | | | | TOTAL INSURANCE | | | 668,742 | |
| | | | | | | | | | | |
| MATERIALS - 3.8% | | | | |
| | 22,177 | | | | | A. Schulman, Inc | | | 782 | |
| | 7,771 | | | * | | Advanced Emissions Solutions, Inc | | | 421 | |
| | 3,376 | | | * | | AEP Industries, Inc | | | 178 | |
| | 159,436 | | | | | Air Products & Chemicals, Inc | | | 17,822 | |
| | 49,733 | | | | | Airgas, Inc | | | 5,563 | |
| | 110,458 | | | *,e | | AK Steel Holding Corp | | | 906 | |
| | 62,071 | | | | | Albemarle Corp | | | 3,935 | |
| | 811,261 | | | e | | Alcoa, Inc | | | 8,624 | |
| | 81,466 | | | | | Allegheny Technologies, Inc | | | 2,903 | |
| | 79,955 | | | *,e | | Allied Nevada Gold Corp | | | 284 | |
| | 21,055 | | | | | AMCOL International Corp | | | 715 | |
| | 3,809 | | | * | | American Pacific Corp | | | 142 | |
| | 20,501 | | | | | American Vanguard Corp | | | 498 | |
| | 50,635 | | | | | Aptargroup, Inc | | | 3,434 | |
| | 15,246 | | | * | | Arabian American Development Co | | | 191 | |
| | 60,168 | | | | | Ashland, Inc | | | 5,839 | |
| | 75,563 | | | | | Avery Dennison Corp | | | 3,792 | |
| | 52,910 | | | | | Axiall Corp | | | 2,510 | |
| | 23,190 | | | * | | Balchem Corp | | | 1,361 | |
| | 113,393 | | | | | Ball Corp | | | 5,858 | |
| | 78,588 | | | | | Bemis Co, Inc | | | 3,219 | |
| | 42,124 | | | * | | Berry Plastics Group, Inc | | | 1,002 | |
| | 10,300 | | | * | | Boise Cascade Co | | | 304 | |
| | 14,781 | | | | | Brush Engineered Materials, Inc | | | 456 | |
| | 48,545 | | | | | Cabot Corp | | | 2,495 | |
| | 41,280 | | | * | | Calgon Carbon Corp | | | 849 | |
| | 35,267 | | | | | Carpenter Technology Corp | | | 2,194 | |
| | 11,808 | | | * | | Castle (A.M.) & Co | | | 174 | |
| | 121,529 | | | | | Celanese Corp (Series A) | | | 6,722 | |
| | 39,702 | | | * | | Century Aluminum Co | | | 415 | |
COLLEGE RETIREMENT EQUITIES FUND - Equity Index Account
| | | | | | | | | VALUE | |
| SHARES | | | | | COMPANY | | (000) | |
| | 45,049 | | | | | CF Industries Holdings, Inc | | $ | 10,498 | |
| | 5,158 | | | | | Chase Corp | | | 182 | |
| | 73,547 | | | * | | Chemtura | | | 2,053 | |
| | 16,903 | | | * | | Clearwater Paper Corp | | | 887 | |
| | 116,499 | | | e | | Cliffs Natural Resources, Inc | | | 3,053 | |
| | 77,643 | | | * | | Coeur d’Alene Mines Corp | | | 842 | |
| | 89,141 | | | | | Commercial Metals Co | | | 1,812 | |
| | 25,270 | | | | | Compass Minerals International, Inc | | | 2,023 | |
| | 107,626 | | | * | | Crown Holdings, Inc | | | 4,797 | |
| | 27,766 | | | | | Cytec Industries, Inc | | | 2,587 | |
| | 9,014 | | | | | Deltic Timber Corp | | | 612 | |
| | 25,140 | | | | | Domtar Corp | | | 2,372 | |
| | 922,158 | | | | | Dow Chemical Co | | | 40,944 | |
| | 702,854 | | | | | Du Pont (E.I.) de Nemours & Co | | | 45,664 | |
| | 37,135 | | | | | Eagle Materials, Inc | | | 2,875 | |
| | 118,069 | | | | | Eastman Chemical Co | | | 9,528 | |
| | 200,262 | | | | | Ecolab, Inc | | | 20,881 | |
| | 55,318 | | | * | | Ferro Corp | | | 710 | |
| | 35,881 | | | * | | Flotek Industries, Inc | | | 720 | |
| | 103,495 | | | | | FMC Corp | | | 7,810 | |
| | 789,171 | | | | | Freeport-McMoRan Copper & Gold, Inc (Class B) | | | 29,783 | |
| | 14,460 | | | | | FutureFuel Corp | | | 228 | |
| | 51,402 | | | *,e | | General Moly, Inc | | | 69 | |
| | 32,454 | | | | | Glatfelter | | | 897 | |
| | 47,286 | | | | | Globe Specialty Metals, Inc | | | 852 | |
| | 24,960 | | | e | | Gold Resource Corp | | | 113 | |
| | 165,993 | | | * | | Graphic Packaging Holding Co | | | 1,594 | |
| | 24,459 | | | | | Greif, Inc (Class A) | | | 1,282 | |
| | 6,559 | | | * | | GSE Holding, Inc | | | 14 | |
| | 39,075 | | | | | H.B. Fuller Co | | | 2,033 | |
| | 6,809 | | | | | Hawkins, Inc | | | 253 | |
| | 9,402 | | | | | Haynes International, Inc | | | 519 | |
| | 54,162 | | | * | | Headwaters, Inc | | | 530 | |
| | 262,218 | | | e | | Hecla Mining Co | | | 808 | |
| | 33,599 | | | * | | Horsehead Holding Corp | | | 545 | |
| | 145,355 | | | | | Huntsman Corp | | | 3,576 | |
| | 16,427 | | | | | Innophos Holdings, Inc | | | 798 | |
| | 18,027 | | | | | Innospec, Inc | | | 833 | |
| | 62,007 | | | | | International Flavors & Fragrances, Inc | | | 5,331 | |
| | 338,906 | | | | | International Paper Co | | | 16,617 | |
| | 40,015 | | | *,e | | Intrepid Potash, Inc | | | 634 | |
| | 14,023 | | | | | Kaiser Aluminum Corp | | | 985 | |
| | 31,073 | | | * | | Kapstone Paper and Packaging Corp | | | 1,736 | |
| | 4,800 | | | | | KMG Chemicals, Inc | | | 81 | |
| | 16,539 | | | | | Koppers Holdings, Inc | | | 757 | |
| | 24,388 | | | * | | Kraton Polymers LLC | | | 562 | |
| | 14,288 | | | e | | Kronos Worldwide, Inc | | | 272 | |
COLLEGE RETIREMENT EQUITIES FUND - Equity Index Account
| | | | | | | | | VALUE | |
| SHARES | | | | | COMPANY | | (000) | |
| | 19,323 | | | * | | Landec Corp | | $ | 234 | |
| | 104,108 | | | * | | Louisiana-Pacific Corp | | | 1,927 | |
| | 13,887 | | | * | | LSB Industries, Inc | | | 570 | |
| | 309,335 | | | | | LyondellBasell Industries AF S.C.A | | | 24,833 | |
| | 34,945 | | | | | Martin Marietta Materials, Inc | | | 3,492 | |
| | 135,736 | | | | | MeadWestvaco Corp | | | 5,013 | |
| | 60,363 | | | *,e | | Midway Gold Corp | | | 49 | |
| | 27,178 | | | | | Minerals Technologies, Inc | | | 1,633 | |
| | 124,409 | | | *,e | | Molycorp, Inc | | | 699 | |
| | 407,663 | | | | | Monsanto Co | | | 47,513 | |
| | 228,319 | | | | | Mosaic Co | | | 10,793 | |
| | 23,791 | | | | | Myers Industries, Inc | | | 502 | |
| | 11,726 | | | | | Neenah Paper, Inc | | | 501 | |
| | 7,313 | | | e | | NewMarket Corp | | | 2,444 | |
| | 376,798 | | | | | Newmont Mining Corp | | | 8,678 | |
| | 29,589 | | | | | Noranda Aluminium Holding Corp | | | 97 | |
| | 242,223 | | | | | Nucor Corp | | | 12,930 | |
| | 61,075 | | | e | | Olin Corp | | | 1,762 | |
| | 8,985 | | | | | Olympic Steel, Inc | | | 260 | |
| | 23,303 | | | * | | OM Group, Inc | | | 848 | |
| | 32,453 | | | * | | Omnova Solutions, Inc | | | 296 | |
| | 126,112 | | | * | | Owens-Illinois, Inc | | | 4,512 | |
| | 74,848 | | | | | Packaging Corp of America | | | 4,736 | |
| | 90,889 | | | *,e | | Paramount Gold and Silver Corp | | | 85 | |
| | 6,963 | | | * | | Penford Corp | | | 89 | |
| | 75,550 | | | | | PolyOne Corp | | | 2,671 | |
| | 109,184 | | | | | PPG Industries, Inc | | | 20,708 | |
| | 225,674 | | | | | Praxair, Inc | | | 29,344 | |
| | 9,804 | | | | | Quaker Chemical Corp | | | 756 | |
| | 58,316 | | | | | Reliance Steel & Aluminum Co | | | 4,423 | |
| | 201,095 | | | * | | Rentech, Inc | | | 352 | |
| | 55,110 | | | *,e | | Resolute Forest Products | | | 883 | |
| | 55,046 | | | | | Rock-Tenn Co (Class A) | | | 5,780 | |
| | 59,225 | | | | | Rockwood Holdings, Inc | | | 4,259 | |
| | 48,654 | | | | | Royal Gold, Inc | | | 2,241 | |
| | 101,323 | | | | | RPM International, Inc | | | 4,206 | |
| | 23,200 | | | * | | RTI International Metals, Inc | | | 794 | |
| | 19,399 | | | | | Schnitzer Steel Industries, Inc (Class A) | | | 634 | |
| | 23,952 | | | | | Schweitzer-Mauduit International, Inc | | | 1,233 | |
| | 32,453 | | | | | Scotts Miracle-Gro Co (Class A) | | | 2,019 | |
| | 148,606 | | | | | Sealed Air Corp | | | 5,060 | |
| | 38,347 | | | | | Sensient Technologies Corp | | | 1,861 | |
| | 67,653 | | | | | Sherwin-Williams Co | | | 12,414 | |
| | 91,531 | | | | | Sigma-Aldrich Corp | | | 8,605 | |
| | 33,477 | | | | | Silgan Holdings, Inc | | | 1,608 | |
| | 76,188 | | | | | Sonoco Products Co | | | 3,179 | |
| | 119,844 | | | | | Southern Copper Corp (NY) | | | 3,441 | |
COLLEGE RETIREMENT EQUITIES FUND - Equity Index Account
| | | | | | | | | VALUE | |
| SHARES | | | | | COMPANY | | (000) | |
| | 165,973 | | | | | Steel Dynamics, Inc | | $ | 3,243 | |
| | 13,671 | | | | | Stepan Co | | | 897 | |
| | 98,491 | | | *,e | | Stillwater Mining Co | | | 1,215 | |
| | 56,972 | | | * | | SunCoke Energy, Inc | | | 1,300 | |
| | 64,203 | | | *,e | | Tahoe Resources, Inc | | | 1,068 | |
| | 10,897 | | | * | | Taminco Corp | | | 220 | |
| | 17,215 | | | * | | Texas Industries, Inc | | | 1,184 | |
| | 19,671 | | | | | Tredegar Corp | | | 567 | |
| | 4,092 | | | * | | UFP Technologies, Inc | | | 103 | |
| | 1,357 | | | * | | United States Lime & Minerals, Inc | | | 83 | |
| | 110,404 | | | e | | United States Steel Corp | | | 3,257 | |
| | 4,623 | | | * | | Universal Stainless & Alloy | | | 167 | |
| | 10,188 | | | * | | US Concrete, Inc | | | 231 | |
| | 16,233 | | | | | US Silica Holdings Inc | | | 554 | |
| | 67,788 | | | | | Valspar Corp | | | 4,833 | |
| | 98,368 | | | | | Vulcan Materials Co | | | 5,845 | |
| | 47,694 | | | e | | Walter Energy, Inc | | | 793 | |
| | 37,679 | | | | | Wausau Paper Corp | | | 478 | |
| | 15,532 | | | | | Westlake Chemical Corp | | | 1,896 | |
| | 4,506 | | | * | | WHX Corp | | | 109 | |
| | 40,133 | | | | | Worthington Industries, Inc | | | 1,689 | |
| | 57,560 | | | * | | WR Grace & Co | | | 5,691 | |
| | 17,018 | | | | | Zep, Inc | | | 309 | |
| | 27,143 | | | *,e | | Zoltek Cos, Inc | | | 455 | |
| | | | | | | TOTAL MATERIALS | | | 603,294 | |
| | | | | | | | | | | |
| MEDIA - 3.9% | | | | | | | | | |
| | 12,963 | | | | | AH Belo Corp (Class A) | | | 97 | |
| | 45,765 | | | * | | AMC Networks, Inc | | | 3,117 | |
| | 153,456 | | | e | | Cablevision Systems Corp (Class A) | | | 2,751 | |
| | 17,686 | | | * | | Carmike Cinemas, Inc | | | 492 | |
| | 467,179 | | | | | CBS Corp (Class B) | | | 29,778 | |
| | 57,454 | | | *,e | | Central European Media Enterprises Ltd (Class A) Nasdaq | | | 221 | |
| | 50,363 | | | * | | Charter Communications, Inc | | | 6,888 | |
| | 87,874 | | | | | Cinemark Holdings, Inc | | | 2,929 | |
| | 28,047 | | | | | Clear Channel Outdoor Holdings, Inc (Class A) | | | 284 | |
| | 2,000,507 | | | | | Comcast Corp (Class A) | | | 103,956 | |
| | 27,056 | | | * | | Crown Media Holdings, Inc (Class A) | | | 96 | |
| | 71,115 | | | * | | Cumulus Media, Inc (Class A) | | | 550 | |
| | 772 | | | * | | Daily Journal Corp | | | 143 | |
| | 12,681 | | | *,e | | Dex Media, Inc | | | 86 | |
| | 20,194 | | | *,e | | Digital Generation, Inc | | | 257 | |
| | 374,566 | | | * | | DIRECTV | | | 25,879 | |
| | 186,385 | | | * | | Discovery Communications, Inc (Class A) | | | 16,853 | |
| | 159,417 | | | * | | DISH Network Corp (Class A) | | | 9,233 | |
| | 57,581 | | | * | | DreamWorks Animation SKG, Inc (Class A) | | | 2,044 | |
| | 18,269 | | | * | | Entercom Communications Corp (Class A) | | | 192 | |
COLLEGE RETIREMENT EQUITIES FUND - Equity Index Account
| | | | | | | | | VALUE | |
| SHARES | | | | | COMPANY | | (000) | |
| | 54,182 | | | | | Entravision Communications Corp (Class A) | | $ | 330 | |
| | 23,436 | | | * | | EW Scripps Co (Class A) | | | 509 | |
| | 173,988 | | | | | Gannett Co, Inc | | | 5,147 | |
| | 15,102 | | | * | | Global Sources Ltd | | | 123 | |
| | 38,349 | | | * | | Gray Television, Inc | | | 571 | |
| | 33,505 | | | | | Harte-Hanks, Inc | | | 262 | |
| | 6,780 | | | *,e | | Hemisphere Media Group, Inc | | | 81 | |
| | 327,851 | | | | | Interpublic Group of Cos, Inc | | | 5,803 | |
| | 34,627 | | | | | John Wiley & Sons, Inc (Class A) | | | 1,911 | |
| | 42,642 | | | * | | Journal Communications, Inc (Class A) | | | 397 | |
| | 59,903 | | | * | | Lamar Advertising Co (Class A) | | | 3,130 | |
| | 298,688 | | | * | | Liberty Global plc (Class A) | | | 26,580 | |
| | 73,249 | | | * | | Liberty Media Corp | | | 10,727 | |
| | 64,240 | | | *,e | | Lions Gate Entertainment Corp | | | 2,034 | |
| | 108,249 | | | * | | Live Nation, Inc | | | 2,139 | |
| | 9,932 | | | * | | Loral Space & Communications, Inc | | | 804 | |
| | 46,379 | | | * | | Madison Square Garden, Inc | | | 2,671 | |
| | 29,313 | | | *,e | | Martha Stewart Living Omnimedia, Inc (Class A) | | | 123 | |
| | 45,516 | | | *,e | | McClatchy Co (Class A) | | | 155 | |
| | 209,534 | | | | | McGraw-Hill Cos, Inc | | | 16,386 | |
| | 29,277 | | | | | MDC Partners, Inc | | | 747 | |
| | 15,588 | | | *,e | | Media General, Inc (Class A) | | | 352 | |
| | 26,535 | | | | | Meredith Corp | | | 1,375 | |
| | 15,752 | | | | | Morningstar, Inc | | | 1,230 | |
| | 42,789 | | | | | National CineMedia, Inc | | | 854 | |
| | 98,100 | | | | | New York Times Co (Class A) | | | 1,557 | |
| | 377,718 | | | * | | News Corp | | | 6,806 | |
| | 21,441 | | | | | Nexstar Broadcasting Group, Inc (Class A) | | | 1,195 | |
| | 196,563 | | | | | Omnicom Group, Inc | | | 14,618 | |
| | 7,422 | | | *,e | | ReachLocal, Inc | | | 94 | |
| | 12,373 | | | * | | Reading International, Inc | | | 93 | |
| | 60,087 | | | e | | Regal Entertainment Group (Class A) | | | 1,169 | |
| | 7,217 | | | * | | Rentrak Corp | | | 273 | |
| | 3,654 | | | | | Saga Communications, Inc | | | 184 | |
| | 2,328 | | | | | Salem Communications | | | 20 | |
| | 19,984 | | | | | Scholastic Corp | | | 680 | |
| | 83,466 | | | | | Scripps Networks Interactive (Class A) | | | 7,212 | |
| | 51,060 | | | | | Sinclair Broadcast Group, Inc (Class A) | | | 1,824 | |
| | 2,344,228 | | | *,e | | Sirius XM Holdings, Inc | | | 8,181 | |
| | 87,187 | | | * | | Starz-Liberty Capital | | | 2,549 | |
| | 284,506 | | | e | | Thomson Corp | | | 10,760 | |
| | 222,106 | | | | | Time Warner Cable, Inc | | | 30,095 | |
| | 710,611 | | | | | Time Warner, Inc | | | 49,544 | |
| | 1,514,973 | | | | | Twenty-First Century Fox, Inc | | | 53,297 | |
| | 29,390 | | | e | | Valassis Communications, Inc | | | 1,007 | |
COLLEGE RETIREMENT EQUITIES FUND - Equity Index Account
| | | | | | | | | VALUE | |
| SHARES | | | | | COMPANY | | (000) | |
| | 339,321 | | | | | Viacom, Inc (Class B) | | $ | 29,636 | |
| | 1,373,018 | | | * | | Walt Disney Co | | | 104,899 | |
| | 21,644 | | | | | World Wrestling Entertainment, Inc (Class A) | | | 359 | |
| | | | | | | TOTAL MEDIA | | | 616,339 | |
| | | | | | | | | | | |
| PHARMACEUTICALS, BIOTECHNOLOGY & LIFE SCIENCES - 8.1% | | | | |
| | 1,207,462 | | | | | AbbVie, Inc | | | 63,766 | |
| | 53,518 | | | *,e | | Acadia Pharmaceuticals, Inc | | | 1,337 | |
| | 9,332 | | | *,e | | Accelerate Diagnostics, Inc | | | 114 | |
| | 15,957 | | | *,e | | AcelRx Pharmaceuticals, Inc | | | 181 | |
| | 103,008 | | | *,e | | Achillion Pharmaceuticals, Inc | | | 342 | |
| | 29,951 | | | * | | Acorda Therapeutics, Inc | | | 875 | |
| | 132,272 | | | * | | Actavis plc | | | 22,222 | |
| | 21,882 | | | * | | Aegerion Pharmaceuticals, Inc | | | 1,553 | |
| | 56,476 | | | *,e | | Affymetrix, Inc | | | 484 | |
| | 265,679 | | | | | Agilent Technologies, Inc | | | 15,194 | |
| | 5,300 | | | *,e | | Agios Pharmaceuticals, Inc | | | 127 | |
| | 44,535 | | | *,e | | Akorn, Inc | | | 1,097 | |
| | 17,375 | | | * | | Albany Molecular Research, Inc | | | 175 | |
| | 148,847 | | | * | | Alexion Pharmaceuticals, Inc | | | 19,806 | |
| | 13,583 | | | *,e | | Alimera Sciences, Inc | | | 64 | |
| | 95,158 | | | * | | Alkermes plc | | | 3,869 | |
| | 226,660 | | | | | Allergan, Inc | | | 25,177 | |
| | 44,275 | | | * | | Alnylam Pharmaceuticals, Inc | | | 2,848 | |
| | 16,995 | | | * | | AMAG Pharmaceuticals, Inc | | | 412 | |
| | 572,623 | | | | | Amgen, Inc | | | 65,371 | |
| | 22,849 | | | *,e | | Amicus Therapeutics, Inc | | | 54 | |
| | 21,263 | | | *,e | | Ampio Pharmaceuticals, Inc | | | 152 | |
| | 19,555 | | | *,e | | Anacor Pharmaceuticals, Inc | | | 328 | |
| | 165,796 | | | *,e | | Arena Pharmaceuticals, Inc | | | 970 | |
| | 26,499 | | | *,e | | Ariad Pharmaceuticals, Inc | | | 181 | |
| | 40,003 | | | * | | Arqule, Inc | | | 86 | |
| | 91,342 | | | * | | Array Biopharma, Inc | | | 458 | |
| | 36,727 | | | * | | Auxilium Pharmaceuticals, Inc | | | 762 | |
| | 111,046 | | | *,e | | AVANIR Pharmaceuticals, Inc | | | 373 | |
| | 41,227 | | | * | | AVEO Pharmaceuticals, Inc | | | 76 | |
| | 15,220 | | | *,e | | BioDelivery Sciences International, Inc | | | 90 | |
| | 181,236 | | | * | | Biogen Idec, Inc | | | 50,701 | |
| | 105,565 | | | * | | BioMarin Pharmaceuticals, Inc | | | 7,418 | |
| | 15,517 | | | * | | Bio-Rad Laboratories, Inc (Class A) | | | 1,918 | |
| | 27,248 | | | *,e | | Biotime, Inc | | | 98 | |
| | 5,300 | | | * | | Bluebird Bio, Inc | | | 111 | |
| | 1,252,290 | | | | | Bristol-Myers Squibb Co | | | 66,559 | |
| | 83,145 | | | * | | Bruker BioSciences Corp | | | 1,644 | |
| | 47,523 | | | * | | Cadence Pharmaceuticals, Inc | | | 430 | |
| | 26,827 | | | * | | Cambrex Corp | | | 478 | |
| | 318,405 | | | * | | Celgene Corp | | | 53,798 | |
| | 135,101 | | | *,e | | Cell Therapeutics, Inc | | | 259 | |
COLLEGE RETIREMENT EQUITIES FUND - Equity Index Account
| | | | | | | | | VALUE | |
| SHARES | | | | | COMPANY | | (000) | |
| | 62,461 | | | * | | Celldex Therapeutics, Inc | | $ | 1,512 | |
| | 11,015 | | | * | | Cempra, Inc | | | 137 | |
| | 50,965 | | | *,e | | Cepheid, Inc | | | 2,381 | |
| | 37,085 | | | * | | Charles River Laboratories International, Inc | | | 1,967 | |
| | 73,802 | | | *,e | | Chelsea Therapeutics International, Inc | | | 327 | |
| | 18,304 | | | *,e | | ChemoCentryx, Inc | | | 106 | |
| | 6,658 | | | * | | Chimerix, Inc | | | 101 | |
| | 12,210 | | | * | | Clovis Oncology, Inc | | | 736 | |
| | 32,316 | | | *,e | | Corcept Therapeutics, Inc | | | 104 | |
| | 5,072 | | | * | | Cornerstone Therapeutics, Inc | | | 48 | |
| | 20,437 | | | *,e | | Coronado Biosciences, Inc | | | 54 | |
| | 42,288 | | | * | | Covance, Inc | | | 3,724 | |
| | 49,683 | | | * | | Cubist Pharmaceuticals, Inc | | | 3,422 | |
| | 59,363 | | | *,e | | Curis, Inc | | | 167 | |
| | 18,932 | | | *,e | | Cytokinetics, Inc | | | 123 | |
| | 47,980 | | | *,e | | Cytori Therapeutics, Inc | | | 123 | |
| | 120,216 | | | *,e | | Dendreon Corp | | | 359 | |
| | 40,825 | | | * | | Depomed, Inc | | | 432 | |
| | 9,738 | | | *,e | | Durata Therapeutics, Inc | | | 125 | |
| | 94,682 | | | * | | Dyax Corp | | | 713 | |
| | 95,378 | | | *,e | | Dynavax Technologies Corp | | | 187 | |
| | 756,733 | | | | | Eli Lilly & Co | | | 38,593 | |
| | 19,838 | | | * | | Emergent Biosolutions, Inc | | | 456 | |
| | 2,982 | | | * | | Enanta Pharmaceuticals, Inc | | | 81 | |
| | 85,345 | | | *,e | | Endo Pharmaceuticals Holdings, Inc | | | 5,757 | |
| | 22,769 | | | *,e | | Endocyte, Inc | | | 243 | |
| | 31,349 | | | | | Enzon Pharmaceuticals, Inc | | | 36 | |
| | 4,483 | | | *,e | | Epizyme, Inc | | | 93 | |
| | 57,614 | | | *,e | | Exact Sciences Corp | | | 674 | |
| | 140,174 | | | *,e | | Exelixis, Inc | | | 859 | |
| | 13,135 | | | * | | Fibrocell Science, Inc | | | 53 | |
| | 20,851 | | | * | | Fluidigm Corp | | | 799 | |
| | 203,023 | | | * | | Forest Laboratories, Inc | | | 12,187 | |
| | 10,743 | | | *,m | | Forest Laboratories, Inc CVR | | | 10 | |
| | 10,500 | | | *,e | | Foundation Medicine, Inc | | | 250 | |
| | 6,747 | | | * | | Furiex Pharmaceuticals Inc | | | 283 | |
| | 102,537 | | | *,e | | Galena Biopharma, Inc | | | 509 | |
| | 14,823 | | | * | | Genomic Health, Inc | | | 434 | |
| | 114,325 | | | * | | Geron Corp | | | 542 | |
| | 1,162,933 | | | * | | Gilead Sciences, Inc | | | 87,394 | |
| | 6,376 | | | *,e | | Golf Trust Of America, Inc | | | 16 | |
| | 68,771 | | | *,e | | Halozyme Therapeutics, Inc | | | 1,031 | |
| | 4,180 | | | * | | Harvard Apparatus Regenerative Technology, Inc | | | 20 | |
| | 16,723 | | | * | | Harvard Bioscience, Inc | | | 79 | |
| | 8,540 | | | * | | Hi-Tech Pharmacal Co, Inc | | | 371 | |
| | 51,686 | | | *,e | | Horizon Pharma, Inc | | | 394 | |
| | 126,136 | | | * | | Hospira, Inc | | | 5,207 | |
COLLEGE RETIREMENT EQUITIES FUND - Equity Index Account
| | | | | | | | | VALUE | |
| SHARES | | | | | COMPANY | | (000) | |
| | 6,640 | | | *,e | | Hyperion Therapeutics, Inc | | $ | 134 | |
| | 77,709 | | | *,e | | Idenix Pharmaceuticals, Inc | | | 465 | |
| | 94,781 | | | *,e | | Illumina, Inc | | | 10,485 | |
| | 65,469 | | | *,e | | Immunogen, Inc | | | 960 | |
| | 78,549 | | | *,e | | Immunomedics, Inc | | | 361 | |
| | 52,266 | | | * | | Impax Laboratories, Inc | | | 1,314 | |
| | 77,568 | | | * | | Incyte Corp | | | 3,927 | |
| | 36,466 | | | *,e | | Infinity Pharmaceuticals, Inc | | | 504 | |
| | 27,309 | | | * | | Insmed, Inc | | | 465 | |
| | 6,124 | | | *,e | | Insys Therapeutics, Inc | | | 237 | |
| | 6,656 | | | * | | Intercept Pharmaceuticals, Inc | | | 454 | |
| | 76,840 | | | * | | InterMune, Inc | | | 1,132 | |
| | 8,700 | | | *,e | | Intrexon Corp | | | 207 | |
| | 71,354 | | | *,e | | Ironwood Pharmaceuticals, Inc | | | 828 | |
| | 85,658 | | | *,e | | Isis Pharmaceuticals, Inc | | | 3,413 | |
| | 39,333 | | | * | | Jazz Pharmaceuticals plc | | | 4,978 | |
| | 2,141,519 | | | | | Johnson & Johnson | | | 196,142 | |
| | 5,336 | | | * | | KaloBios Pharmaceuticals, Inc | | | 24 | |
| | 62,502 | | | *,e | | Keryx Biopharmaceuticals, Inc | | | 809 | |
| | 10,009 | | | *,e | | KYTHERA Biopharmaceuticals, Inc | | | 373 | |
| | 12,437 | | | * | | Lannett Co, Inc | | | 412 | |
| | 173,586 | | | *,e | | Lexicon Pharmaceuticals, Inc | | | 312 | |
| | 131,366 | | | * | | Life Technologies Corp | | | 9,958 | |
| | 14,627 | | | *,e | | Ligand Pharmaceuticals, Inc (Class B) | | | 769 | |
| | 31,134 | | | * | | Luminex Corp | | | 604 | |
| | 44,700 | | | * | | Mallinckrodt plc | | | 2,336 | |
| | 117,013 | | | *,e | | MannKind Corp | | | 610 | |
| | 48,124 | | | * | | Medicines Co | | | 1,859 | |
| | 56,962 | | | * | | Medivation, Inc | | | 3,635 | |
| | 7,487 | | | *,e | | MEI Pharma, Inc | | | 60 | |
| | 2,302,119 | | | | | Merck & Co, Inc | | | 115,221 | |
| | 73,750 | | | *,e | | Merrimack Pharmaceuticals, Inc | | | 394 | |
| | 22,964 | | | * | | Mettler-Toledo International, Inc | | | 5,571 | |
| | 62,685 | | | *,e | | MiMedx Group, Inc | | | 548 | |
| | 34,069 | | | * | | Momenta Pharmaceuticals, Inc | | | 602 | |
| | 290,035 | | | * | | Mylan Laboratories, Inc | | | 12,588 | |
| | 62,489 | | | *,e | | Myriad Genetics, Inc | | | 1,311 | |
| | 31,951 | | | *,e | | Nanosphere, Inc | | | 73 | |
| | 97,156 | | | *,e | | Navidea Biopharmaceuticals, Inc | | | 201 | |
| | 87,448 | | | * | | Nektar Therapeutics | | | 993 | |
| | 23,721 | | | * | | NeoGenomics, Inc | | | 86 | |
| | 51,178 | | | * | | Neurocrine Biosciences, Inc | | | 478 | |
| | 12,598 | | | *,e | | NewLink Genetics Corp | | | 277 | |
| | 160,650 | | | * | | Novavax, Inc | | | 823 | |
| | 75,335 | | | * | | NPS Pharmaceuticals, Inc | | | 2,287 | |
| | 26,874 | | | *,e | | Omeros Corp | | | 303 | |
| | 4,045 | | | *,m | | Omthera Pharmaceuticals, Inc | | | 2 | |
COLLEGE RETIREMENT EQUITIES FUND - Equity Index Account
| | | | | | | | | VALUE | |
| SHARES | | | | | COMPANY | | (000) | |
| | 11,325 | | | * | | OncoGenex Pharmaceutical, Inc | | $ | 94 | |
| | 6,600 | | | *,e | | Onconova Therapeutics, Inc | | | 76 | |
| | 7,900 | | | *,e | | Ophthotech Corp | | | 256 | |
| | 143,885 | | | *,e | | Opko Health, Inc | | | 1,214 | |
| | 77,270 | | | *,e | | Orexigen Therapeutics, Inc | | | 435 | |
| | 12,630 | | | *,e | | Osiris Therapeutics, Inc | | | 203 | |
| | 6,597 | | | * | | OvaScience, Inc | | | 60 | |
| | 50,411 | | | * | | Pacific Biosciences of California, Inc | | | 264 | |
| | 21,106 | | | *,e | | Pacira Pharmaceuticals, Inc | | | 1,213 | |
| | 43,666 | | | * | | Parexel International Corp | | | 1,973 | |
| | 106,509 | | | e | | PDL BioPharma, Inc | | | 899 | |
| | 104,909 | | | *,e | | Peregrine Pharmaceuticals, Inc | | | 146 | |
| | 85,256 | | | | | PerkinElmer, Inc | | | 3,515 | |
| | 95,563 | | | e | | Perrigo Co plc | | | 14,665 | |
| | 5,098,843 | | | | | Pfizer, Inc | | | 156,177 | |
| | 45,141 | | | * | | Pharmacyclics, Inc | | | 4,775 | |
| | 7,585 | | | * | | Portola Pharmaceuticals, Inc | | | 195 | |
| | 15,548 | | | | | Pozen, Inc | | | 125 | |
| | 38,233 | | | * | | Prestige Brands Holdings, Inc | | | 1,369 | |
| | 40,290 | | | * | | Progenics Pharmaceuticals, Inc | | | 215 | |
| | 12,791 | | | *,e | | Prothena Corp plc | | | 339 | |
| | 16,769 | | | * | | Puma Biotechnology, Inc | | | 1,736 | |
| | 178,940 | | | * | | Qiagen NV (NASDAQ) | | | 4,261 | |
| | 39,852 | | | e | | Questcor Pharmaceuticals, Inc | | | 2,170 | |
| | 20,597 | | | * | | Quintiles Transnational Holdings, Inc | | | 954 | |
| | 48,221 | | | *,e | | Raptor Pharmaceutical Corp | | | 628 | |
| | 4,242 | | | * | | Receptos, Inc | | | 123 | |
| | 61,171 | | | * | | Regeneron Pharmaceuticals, Inc | | | 16,837 | |
| | 7,041 | | | * | | Regulus Therapeutics, Inc | | | 52 | |
| | 23,464 | | | * | | Repligen Corp | | | 320 | |
| | 16,297 | | | *,e | | Repros Therapeutics, Inc | | | 298 | |
| | 66,996 | | | * | | Rigel Pharmaceuticals, Inc | | | 191 | |
| | 12,401 | | | * | | Sagent Pharmaceuticals | | | 315 | |
| | 46,827 | | | * | | Salix Pharmaceuticals Ltd | | | 4,212 | |
| | 43,846 | | | *,e | | Sangamo Biosciences, Inc | | | 609 | |
| | 31,888 | | | *,e | | Sarepta Therapeutics, Inc | | | 650 | |
| | 43,039 | | | * | | Sciclone Pharmaceuticals, Inc | | | 217 | |
| | 76,360 | | | *,e | | Seattle Genetics, Inc | | | 3,046 | |
| | 87,069 | | | *,e | | Sequenom, Inc | | | 204 | |
| | 26,901 | | | *,e | | SIGA Technologies, Inc | | | 88 | |
| | 47,540 | | | *,e | | Spectrum Pharmaceuticals, Inc | | | 421 | |
| | 12,168 | | | * | | Stemline Therapeutics, Inc | | | 239 | |
| | 6,322 | | | * | | Sucampo Pharmaceuticals, Inc (Class A) | | | 59 | |
| | 21,433 | | | *,e | | Sunesis Pharmaceuticals, Inc | | | 102 | |
| | 10,484 | | | *,e | | Supernus Pharmaceuticals, Inc | | | 79 | |
| | 14,988 | | | *,e | | Synageva BioPharma Corp | | | 970 | |
| | 61,665 | | | *,e | | Synergy Pharmaceuticals, Inc | | | 347 | |
COLLEGE RETIREMENT EQUITIES FUND - Equity Index Account
| | | | | | | | | VALUE | |
| SHARES | | | | | COMPANY | | (000) | |
| | 52,113 | | | *,e | | Synta Pharmaceuticals Corp | | $ | 273 | |
| | 21,017 | | | * | | Targacept, Inc | | | 87 | |
| | 28,521 | | | | | Techne Corp | | | 2,700 | |
| | 10,002 | | | * | | TESARO, Inc | | | 282 | |
| | 8,515 | | | * | | Tetraphase Pharmaceuticals, Inc | | | 115 | |
| | 10,736 | | | *,e | | TG Therapeutics, Inc | | | 42 | |
| | 78,332 | | | * | | TherapeuticsMD, Inc | | | 408 | |
| | 59,890 | | | *,e | | Theravance, Inc | | | 2,135 | |
| | 274,014 | | | | | Thermo Electron Corp | | | 30,511 | |
| | 34,985 | | | *,e | | Threshold Pharmaceuticals, Inc | | | 163 | |
| | 35,349 | | | * | | United Therapeutics Corp | | | 3,997 | |
| | 31,829 | | | * | | Vanda Pharmaceuticals, Inc | | | 395 | |
| | 10,567 | | | *,e | | Verastem, Inc | | | 120 | |
| | 178,617 | | | * | | Vertex Pharmaceuticals, Inc | | | 13,271 | |
| | 65,503 | | | * | | Vical, Inc | | | 77 | |
| | 51,543 | | | * | | Viropharma, Inc | | | 2,569 | |
| | 74,791 | | | *,e | | Vivus, Inc | | | 679 | |
| | 65,126 | | | * | | Waters Corp | | | 6,513 | |
| | 33,276 | | | * | | Xenoport, Inc | | | 191 | |
| | 64,947 | | | *,e | | XOMA Corp | | | 437 | |
| | 78,272 | | | *,e | | ZIOPHARM Oncology, Inc | | | 340 | |
| | 382,191 | | | | | Zoetis Inc | | | 12,494 | |
| | 116,179 | | | *,e | | Zogenix, Inc | | | 400 | |
| | | | | | | TOTAL PHARMACEUTICALS, BIOTECHNOLOGY & LIFE SCIENCES | | | 1,280,237 | |
| | | | | | | | | | | |
| REAL ESTATE - 3.1% | | | | | | |
| | 41,676 | | | | | Acadia Realty Trust | | | 1,035 | |
| | 18,082 | | | | | AG Mortgage Investment Trust | | | 283 | |
| | 10,360 | | | | | Agree Realty Corp | | | 301 | |
| | 32,853 | | | | | Alexander & Baldwin, Inc | | | 1,371 | |
| | 1,574 | | | | | Alexander’s, Inc | | | 519 | |
| | 54,028 | | | | | Alexandria Real Estate Equities, Inc | | | 3,437 | |
| | 32,259 | | | | | Altisource Residential Corp | | | 971 | |
| | 25,582 | | | | | American Assets Trust, Inc | | | 804 | |
| | 79,779 | | | | | American Campus Communities, Inc | | | 2,570 | |
| | 302,432 | | | | | American Capital Agency Corp | | | 5,834 | |
| | 44,879 | | | | | American Capital Mortgage, Inc | | | 784 | |
| | 38,600 | | | * | | American Homes 4 Rent | | | 625 | |
| | 116,652 | | | e | | American Realty Capital Properties, Inc | | | 1,500 | |
| | 10,250 | | | *,e | | American Residential Properties, Inc | | | 176 | |
| | 302,005 | | | | | American Tower Corp | | | 24,106 | |
| | 11,988 | | | | | AmREIT, Inc (Class B) | | | 201 | |
| | 728,985 | | | | | Annaly Capital Management, Inc | | | 7,268 | |
| | 104,198 | | | | | Anworth Mortgage Asset Corp | | | 439 | |
| | 110,902 | | | | | Apartment Investment & Management Co (Class A) | | | 2,873 | |
| | 29,005 | | | | | Apollo Commercial Real Estate Finance, Inc | | | 471 | |
| | 16,344 | | | | | Ares Commercial Real Estate Corp | | | 214 | |
COLLEGE RETIREMENT EQUITIES FUND - Equity Index Account
| | | | | | | | | VALUE | |
| SHARES | | | | | COMPANY | | (000) | |
| | 14,151 | | | | | Armada Hoffler Properties, Inc | | $ | 131 | |
| | 309,135 | | | | | ARMOUR Residential REIT, Inc | | | 1,240 | |
| | 8,644 | | | * | | Ashford Hospitality Prime, Inc | | | 157 | |
| | 43,224 | | | | | Ashford Hospitality Trust, Inc | | | 358 | |
| | 38,683 | | | e | | Associated Estates Realty Corp | | | 621 | |
| | 7,072 | | | * | | AV Homes, Inc | | | 128 | |
| | 98,505 | | | | | AvalonBay Communities, Inc | | | 11,646 | |
| | 8,814 | | | e | | Aviv REIT, Inc | | | 209 | |
| | 142,585 | | | | | BioMed Realty Trust, Inc | | | 2,584 | |
| | 115,541 | | | | | Boston Properties, Inc | | | 11,597 | |
| | 118,676 | | | | | Brandywine Realty Trust | | | 1,672 | |
| | 58,646 | | | | | BRE Properties, Inc (Class A) | | | 3,209 | |
| | 36,900 | | | * | | Brixmor Property Group, Inc | | | 750 | |
| | 64,335 | | | | | Camden Property Trust | | | 3,659 | |
| | 49,200 | | | | | Campus Crest Communities, Inc | | | 463 | |
| | 72,089 | | | | | Capstead Mortgage Corp | | | 871 | |
| | 124,137 | | | | | CBL & Associates Properties, Inc | | | 2,229 | |
| | 212,369 | | | * | | CBRE Group, Inc | | | 5,585 | |
| | 54,349 | | | | | Cedar Shopping Centers, Inc | | | 340 | |
| | 189,048 | | | e | | Chambers Street Properties | | | 1,446 | |
| | 15,294 | | | | | Chatham Lodging Trust | | | 313 | |
| | 37,072 | | | | | Chesapeake Lodging Trust | | | 938 | |
| | 782,428 | | | | | Chimera Investment Corp | | | 2,426 | |
| | 58,259 | | | | | Colony Financial, Inc | | | 1,182 | |
| | 4,977 | | | | | Consolidated-Tomoka Land Co | | | 181 | |
| | 15,000 | | | | | Coresite Realty | | | 483 | |
| | 65,862 | | | | | Corporate Office Properties Trust | | | 1,560 | |
| | 127,954 | | | | | Cousins Properties, Inc | | | 1,318 | |
| | 102,580 | | | | | CubeSmart | | | 1,635 | |
| | 14,500 | | | | | CyrusOne, Inc | | | 324 | |
| | 135,056 | | | | | CYS Investments, Inc | | | 1,001 | |
| | 221,413 | | | | | DCT Industrial Trust, Inc | | | 1,579 | |
| | 225,998 | | | | | DDR Corp | | | 3,474 | |
| | 148,119 | | | | | DiamondRock Hospitality Co | | | 1,711 | |
| | 98,095 | | | e | | Digital Realty Trust, Inc | | | 4,818 | |
| | 108,380 | | | | | Douglas Emmett, Inc | | | 2,524 | |
| | 244,327 | | | | | Duke Realty Corp | | | 3,675 | |
| | 47,457 | | | e | | DuPont Fabros Technology, Inc | | | 1,173 | |
| | 41,887 | | | | | Dynex Capital, Inc | | | 335 | |
| | 23,492 | | | | | EastGroup Properties, Inc | | | 1,361 | |
| | 86,427 | | | | | Education Realty Trust, Inc | | | 762 | |
| | 4,681 | | | | | Ellington Residential Mortgage REIT | | | 72 | |
| | 63,300 | | | | | Empire State Realty Trust, Inc | | | 968 | |
| | 39,304 | | | | | Entertainment Properties Trust | | | 1,932 | |
| | 62,982 | | | | | Equity Lifestyle Properties, Inc | | | 2,282 | |
| | 45,769 | | | | | Equity One, Inc | | | 1,027 | |
| | 275,864 | | | | | Equity Residential | | | 14,309 | |
COLLEGE RETIREMENT EQUITIES FUND - Equity Index Account
| | | | | | | | | VALUE | |
| SHARES | | | | | COMPANY | | (000) | |
| | 29,675 | | | e | | Essex Property Trust, Inc | | $ | 4,259 | |
| | 35,324 | | | | | Excel Trust, Inc | | | 402 | |
| | 83,827 | | | | | Extra Space Storage, Inc | | | 3,532 | |
| | 49,343 | | | | | Federal Realty Investment Trust | | | 5,004 | |
| | 96,717 | | | * | | FelCor Lodging Trust, Inc | | | 789 | |
| | 82,257 | | | | | First Industrial Realty Trust, Inc | | | 1,435 | |
| | 47,359 | | | | | First Potomac Realty Trust | | | 551 | |
| | 120,106 | | | * | | Forest City Enterprises, Inc (Class A) | | | 2,294 | |
| | 29,389 | | | * | | Forestar Real Estate Group, Inc | | | 625 | |
| | 67,229 | | | | | Franklin Street Properties Corp | | | 803 | |
| | 51,524 | | | * | | Gaming and Leisure Properties, Inc | | | 2,618 | |
| | 424,625 | | | | | General Growth Properties, Inc | | | 8,522 | |
| | 18,098 | | | | | Getty Realty Corp | | | 332 | |
| | 9,649 | | | | | Gladstone Commercial Corp | | | 173 | |
| | 109,785 | | | | | Glimcher Realty Trust | | | 1,028 | |
| | 40,458 | | | | | Government Properties Income Trust | | | 1,005 | |
| | 57,383 | | | * | | Gramercy Property Trust, Inc | | | 330 | |
| | 10,641 | | | e | | Hannon Armstrong Sustainable Infrastructure Capital, Inc | | | 149 | |
| | 78,328 | | | | | Hatteras Financial Corp | | | 1,280 | |
| | 346,529 | | | | | HCP, Inc | | | 12,586 | |
| | 218,433 | | | | | Health Care REIT, Inc | | | 11,701 | |
| | 72,939 | | | | | Healthcare Realty Trust, Inc | | | 1,554 | |
| | 84,407 | | | | | Healthcare Trust of America, Inc | | | 831 | |
| | 153,508 | | | | | Hersha Hospitality Trust | | | 855 | |
| | 68,398 | | | | | Highwoods Properties, Inc | | | 2,474 | |
| | 43,293 | | | | | Home Properties, Inc | | | 2,321 | |
| | 107,078 | | | | | Hospitality Properties Trust | | | 2,894 | |
| | 567,427 | | | | | Host Marriott Corp | | | 11,031 | |
| | 30,234 | | | * | | Howard Hughes Corp | | | 3,631 | |
| | 90,303 | | | | | HRPT Properties Trust | | | 2,105 | |
| | 32,763 | | | | | Hudson Pacific Properties | | | 717 | |
| | 64,150 | | | | | Inland Real Estate Corp | | | 675 | |
| | 108,200 | | | | | Invesco Mortgage Capital, Inc | | | 1,588 | |
| | 74,579 | | | | | Investors Real Estate Trust | | | 640 | |
| | 64,505 | | | * | | iStar Financial, Inc | | | 920 | |
| | 16,600 | | | e | | JAVELIN Mortgage Investment Corp | | | 231 | |
| | 33,460 | | | | | Jones Lang LaSalle, Inc | | | 3,426 | |
| | 44,089 | | | e | | Kennedy-Wilson Holdings, Inc | | | 981 | |
| | 62,016 | | | | | Kilroy Realty Corp | | | 3,112 | |
| | 312,567 | | | | | Kimco Realty Corp | | | 6,173 | |
| | 99,574 | | | | | Kite Realty Group Trust | | | 654 | |
| | 79,268 | | | | | LaSalle Hotel Properties | | | 2,446 | |
| | 138,161 | | | e | | Lexington Corporate Properties Trust | | | 1,411 | |
| | 98,224 | | | | | Liberty Property Trust | | | 3,327 | |
| | 27,155 | | | | | LTC Properties, Inc | | | 961 | |
| | 104,635 | | | | | Macerich Co | | | 6,162 | |
| | 67,066 | | | | | Mack-Cali Realty Corp | | | 1,441 | |
COLLEGE RETIREMENT EQUITIES FUND - Equity Index Account
| | | | | | | | | VALUE | |
| SHARES | | | | | COMPANY | | (000) | |
| | 123,287 | | | | | Medical Properties Trust, Inc | | $ | 1,507 | |
| | 286,855 | | | e | | MFA Mortgage Investments, Inc | | | 2,025 | |
| | 56,685 | | | | | Mid-America Apartment Communities, Inc | | | 3,443 | |
| | 31,123 | | | | | Monmouth Real Estate Investment Corp (Class A) | | | 283 | |
| | 20,485 | | | | | National Health Investors, Inc | | | 1,149 | |
| | 91,193 | | | e | | National Retail Properties, Inc | | | 2,766 | |
| | 192,893 | | | | | New Residential Investment Corp | | | 1,289 | |
| | 48,692 | | | e | | New York Mortgage Trust, Inc | | | 340 | |
| | 218,183 | | | e | | NorthStar Realty Finance Corp | | | 2,935 | |
| | 93,151 | | | | | Omega Healthcare Investors, Inc | | | 2,776 | |
| | 9,027 | | | | | One Liberty Properties, Inc | | | 182 | |
| | 39,886 | | | | | Parkway Properties, Inc | | | 769 | |
| | 46,471 | | | | | Pebblebrook Hotel Trust | | | 1,429 | |
| | 52,388 | | | | | Pennsylvania Real Estate Investment Trust | | | 994 | |
| | 57,080 | | | | | Pennymac Mortgage Investment Trust | | | 1,311 | |
| | 130,905 | | | e | | Piedmont Office Realty Trust, Inc | | | 2,163 | |
| | 135,833 | | | | | Plum Creek Timber Co, Inc | | | 6,318 | |
| | 41,348 | | | | | Post Properties, Inc | | | 1,870 | |
| | 30,874 | | | | | Potlatch Corp | | | 1,289 | |
| | 382,324 | | | | | Prologis, Inc | | | 14,127 | |
| | 14,049 | | | | | PS Business Parks, Inc | | | 1,074 | |
| | 108,820 | | | | | Public Storage, Inc | | | 16,380 | |
| | 6,700 | | | * | | QTS Realty Trust, Inc | | | 166 | |
| | 52,552 | | | e | | RAIT Investment Trust | | | 471 | |
| | 49,178 | | | | | Ramco-Gershenson Properties | | | 774 | |
| | 95,872 | | | | | Rayonier, Inc | | | 4,036 | |
| | 9,000 | | | * | | RE | | | 289 | |
| | 91,446 | | | * | | Realogy Holdings Corp | | | 4,524 | |
| | 149,848 | | | e | | Realty Income Corp | | | 5,594 | |
| | 59,894 | | | e | | Redwood Trust, Inc | | | 1,160 | |
| | 69,743 | | | | | Regency Centers Corp | | | 3,229 | |
| | 85,615 | | | | | Resource Capital Corp | | | 508 | |
| | 50,793 | | | | | Retail Opportunities Investment Corp | | | 748 | |
| | 101,421 | | | | | Retail Properties of America, Inc | | | 1,290 | |
| | 12,700 | | | * | | Rexford Industrial Realty, Inc | | | 168 | |
| | 93,949 | | | | | RLJ Lodging Trust | | | 2,285 | |
| | 16,171 | | | e | | Rouse Properties, Inc | | | 359 | |
| | 32,495 | | | e | | Ryman Hospitality Properties | | | 1,358 | |
| | 28,029 | | | | | Sabra Healthcare REIT, Inc | | | 733 | |
| | 6,582 | | | | | Saul Centers, Inc | | | 314 | |
| | 13,046 | | | | | Select Income REIT | | | 349 | |
| | 143,050 | | | | | Senior Housing Properties Trust | | | 3,180 | |
| | 13,436 | | | e | | Silver Bay Realty Trust Corp | | | 215 | |
| | 236,653 | | | | | Simon Property Group, Inc | | | 36,009 | |
| | 69,574 | | | | | SL Green Realty Corp | | | 6,427 | |
| | 23,922 | | | | | Sovran Self Storage, Inc | | | 1,559 | |
| | 282,732 | | | | | Spirit Realty Capital, Inc | | | 2,779 | |
COLLEGE RETIREMENT EQUITIES FUND - Equity Index Account
| | | | | | | | | VALUE | |
| SHARES | | | | | COMPANY | | (000) | |
| | 49,920 | | | *,e | | St. Joe Co | | $ | 958 | |
| | 33,698 | | | | | STAG Industrial, Inc | | | 687 | |
| | 148,626 | | | | | Starwood Property Trust, Inc | | | 4,117 | |
| | 137,597 | | | * | | Strategic Hotels & Resorts, Inc | | | 1,300 | |
| | 60,860 | | | | | Summit Hotel Properties, Inc | | | 548 | |
| | 28,548 | | | | | Sun Communities, Inc | | | 1,217 | |
| | 123,458 | | | | | Sunstone Hotel Investors, Inc | | | 1,654 | |
| | 71,971 | | | | | Tanger Factory Outlet Centers, Inc | | | 2,305 | |
| | 48,485 | | | | | Taubman Centers, Inc | | | 3,099 | |
| | 11,747 | | | * | | Tejon Ranch Co | | | 432 | |
| | 15,912 | | | | | Terreno Realty Corp | | | 282 | |
| | 281,289 | | | | | Two Harbors Investment Corp | | | 2,610 | |
| | 190,771 | | | | | UDR, Inc | | | 4,454 | |
| | 11,783 | | | | | UMH Properties, Inc | | | 111 | |
| | 10,285 | | | | | Universal Health Realty Income Trust | | | 412 | |
| | 19,529 | | | | | Urstadt Biddle Properties, Inc (Class A) | | | 360 | |
| | 222,896 | | | | | Ventas, Inc | | | 12,767 | |
| | 142,193 | | | | | Vornado Realty Trust | | | 12,625 | |
| | 50,804 | | | | | Washington Real Estate Investment Trust | | | 1,187 | |
| | 92,487 | | | | | Weingarten Realty Investors | | | 2,536 | |
| | 18,722 | | | e | | Western Asset Mortgage Capital Corp | | | 279 | |
| | 443,235 | | | | | Weyerhaeuser Co | | | 13,993 | |
| | 14,061 | | | | | Whitestone REIT | | | 188 | |
| | 24,416 | | | | | Winthrop Realty Trust | | | 270 | |
| | 43,708 | | | e | | WP Carey, Inc | | | 2,681 | |
| | 4,300 | | | | | ZAIS Financial Corp | | | 69 | |
| | | | | | | TOTAL REAL ESTATE | | | 496,103 | |
| | | | | | | | | | | |
| RETAILING - 4.6% | | | |
| | 14,742 | | | * | | 1-800-FLOWERS.COM, Inc (Class A) | | | 80 | |
| | 56,578 | | | | | Aaron’s, Inc | | | 1,663 | |
| | 59,479 | | | e | | Abercrombie & Fitch Co (Class A) | | | 1,957 | |
| | 55,859 | | | | | Advance Auto Parts, Inc | | | 6,182 | |
| | 61,843 | | | *,e | | Aeropostale, Inc | | | 562 | |
| | 280,300 | | | * | | Amazon.com, Inc | | | 111,781 | |
| | 146,718 | | | | | American Eagle Outfitters, Inc | | | 2,113 | |
| | 6,968 | | | * | | America’s Car-Mart, Inc | | | 294 | |
| | 35,675 | | | * | | Ann Taylor Stores Corp | | | 1,304 | |
| | 23,729 | | | * | | Asbury Automotive Group, Inc | | | 1,275 | |
| | 97,226 | | | * | | Ascena Retail Group, Inc | | | 2,057 | |
| | 11,570 | | | * | | Audiovox Corp (Class A) | | | 193 | |
| | 38,634 | | | * | | Autonation, Inc | | | 1,920 | |
| | 26,957 | | | * | | AutoZone, Inc | | | 12,884 | |
| | 30,948 | | | * | | Barnes & Noble, Inc | | | 463 | |
| | 23,033 | | | | | Bebe Stores, Inc | | | 123 | |
| | 166,730 | | | * | | Bed Bath & Beyond, Inc | | | 13,388 | |
| | 207,694 | | | | | Best Buy Co, Inc | | | 8,283 | |
COLLEGE RETIREMENT EQUITIES FUND - Equity Index Account
| | | | | | | | VALUE | |
| SHARES | | | | | COMPANY | | (000) | |
| | 14,390 | | | | | Big 5 Sporting Goods Corp | | $ | 285 | |
| | 45,422 | | | * | | Big Lots, Inc | | | 1,467 | |
| | 10,661 | | | *,e | | Blue Nile, Inc | | | 502 | |
| | 13,103 | | | *,e | | Body Central Corp | | | 52 | |
| | 9,116 | | | e | | Bon-Ton Stores, Inc | | | 148 | |
| | 32,106 | | | | | Brown Shoe Co, Inc | | | 903 | |
| | 21,122 | | | e | | Buckle, Inc | | | 1,110 | |
| | 11,900 | | | * | | Burlington Stores, Inc | | | 381 | |
| | 36,046 | | | * | | Cabela’s, Inc | | | 2,403 | |
| | 171,517 | | | * | | Carmax, Inc | | | 8,065 | |
| | 21,208 | | | | | Cato Corp (Class A) | | | 674 | |
| | 123,275 | | | | | Chico’s FAS, Inc | | | 2,323 | |
| | 17,477 | | | * | | Children’s Place Retail Stores, Inc | | | 996 | |
| | 33,880 | | | * | | Christopher & Banks Corp | | | 289 | |
| | 12,866 | | | * | | Citi Trends, Inc | | | 219 | |
| | 16,992 | | | *,e | | Conn’s, Inc | | | 1,339 | |
| | 11,400 | | | *,e | | Container Store Group, Inc | | | 531 | |
| | 9,734 | | | | | Core-Mark Holding Co, Inc | | | 739 | |
| | 46,869 | | | e | | CST Brands, Inc | | | 1,721 | |
| | 10,433 | | | | | Destination Maternity Corp | | | 312 | |
| | 32,976 | | | * | | Destination XL Group, Inc | | | 217 | |
| | 75,404 | | | | | Dick’s Sporting Goods, Inc | | | 4,381 | |
| | 20,459 | | | | | Dillard’s, Inc (Class A) | | | 1,989 | |
| | 248,778 | | | * | | Dollar General Corp | | | 15,006 | |
| | 158,637 | | | * | | Dollar Tree, Inc | | | 8,950 | |
| | 54,370 | | | | | DSW, Inc (Class A) | | | 2,323 | |
| | 81,053 | | | | | Expedia, Inc | | | 5,646 | |
| | 64,933 | | | * | | Express Parent LLC | | | 1,212 | |
| | 73,294 | | | | | Family Dollar Stores, Inc | | | 4,762 | |
| | 37,259 | | | | | Finish Line, Inc (Class A) | | | 1,050 | |
| | 24,942 | | | *,e | | Five Below, Inc | | | 1,078 | |
| | 114,126 | | | | | Foot Locker, Inc | | | 4,729 | |
| | 34,442 | | | *,e | | Francesca’s Holdings Corp | | | 634 | |
| | 29,664 | | | | | Fred’s, Inc (Class A) | | | 549 | |
| | 13,967 | | | *,e | | FTD Cos, Inc | | | 455 | |
| | 91,076 | | | e | | GameStop Corp (Class A) | | | 4,486 | |
| | 212,511 | | | | | Gap, Inc | | | 8,305 | |
| | 18,687 | | | * | | Genesco, Inc | | | 1,365 | |
| | 117,877 | | | | | Genuine Parts Co | | | 9,806 | |
| | 74,796 | | | | | GNC Holdings, Inc | | | 4,372 | |
| | 7,143 | | | | | Gordmans Stores, Inc | | | 55 | |
| | 17,052 | | | | | Group 1 Automotive, Inc | | | 1,211 | |
| | 319,043 | | | * | | Groupon, Inc | | | 3,755 | |
| | 44,451 | | | | | Guess?, Inc | | | 1,381 | |
| | 16,062 | | | | | Haverty Furniture Cos, Inc | | | 503 | |
| | 12,065 | | | *,e | | HHgregg, Inc | | | 169 | |
| | 20,590 | | | *,e | | Hibbett Sports, Inc | | | 1,384 | |
COLLEGE RETIREMENT EQUITIES FUND - Equity Index Account
| | | | | | | | VALUE | |
| SHARES | | | | | COMPANY | | (000) | |
| | 1,113,653 | | | | | Home Depot, Inc | | $ | 91,698 | |
| | 42,828 | | | *,e | | HomeAway, Inc | | | 1,751 | |
| | 25,591 | | | | | HSN, Inc | | | 1,594 | |
| | 180,271 | | | *,e | | JC Penney Co, Inc | | | 1,650 | |
| | 21,133 | | | * | | JOS A Bank Clothiers, Inc | | | 1,157 | |
| | 8,801 | | | * | | Kirkland’s, Inc | | | 208 | |
| | 168,673 | | | | | Kohl’s Corp | | | 9,572 | |
| | 182,518 | | | | | L Brands, Inc | | | 11,289 | |
| | 402,890 | | | * | | Liberty Interactive Corp | | | 11,825 | |
| | 27,951 | | | * | | Liberty Ventures | | | 3,427 | |
| | 16,930 | | | | | Lithia Motors, Inc (Class A) | | | 1,175 | |
| | 229,339 | | | * | | LKQ Corp | | | 7,545 | |
| | 830,686 | | | | | Lowe’s Companies, Inc | | | 41,161 | |
| | 21,092 | | | *,e | | Lumber Liquidators, Inc | | | 2,170 | |
| | 292,154 | | | | | Macy’s, Inc | | | 15,601 | |
| | 16,477 | | | * | | MarineMax, Inc | | | 265 | |
| | 10,302 | | | *,e | | Mattress Firm Holding Corp | | | 443 | |
| | 39,013 | | | | | Men’s Wearhouse, Inc | | | 1,993 | |
| | 24,581 | | | e | | Monro Muffler, Inc | | | 1,385 | |
| | 36,272 | | | * | | Murphy USA, Inc | | | 1,507 | |
| | 38,259 | | | * | | NetFlix, Inc | | | 14,086 | |
| | 13,306 | | | * | | New York & Co, Inc | | | 58 | |
| | 111,848 | | | | | Nordstrom, Inc | | | 6,912 | |
| | 20,499 | | | | | Nutri/System, Inc | | | 337 | |
| | 372,250 | | | * | | Office Depot, Inc | | | 1,969 | |
| | 17,611 | | | * | | Orbitz Worldwide, Inc | | | 126 | |
| | 83,639 | | | * | | O’Reilly Automotive, Inc | | | 10,765 | |
| | 21,924 | | | *,e | | Outerwall, Inc | | | 1,475 | |
| | 8,893 | | | *,e | | Overstock.com, Inc | | | 274 | |
| | 31,428 | | | | | Penske Auto Group, Inc | | | 1,482 | |
| | 40,957 | | | * | | PEP Boys - Manny Moe & Jack | | | 497 | |
| | 15,450 | | | e | | PetMed Express, Inc | | | 257 | |
| | 77,507 | | | | | Petsmart, Inc | | | 5,639 | |
| | 72,685 | | | | | Pier 1 Imports, Inc | | | 1,678 | |
| | 39,403 | | | * | | Priceline.com, Inc | | | 45,802 | |
| | 78,808 | | | *,e | | RadioShack Corp | | | 205 | |
| | 40,660 | | | | | Rent-A-Center, Inc | | | 1,356 | |
| | 13,438 | | | * | | Restoration Hardware Holdings, Inc | | | 904 | |
| | 7,100 | | | *,e | | RetailMeNot, Inc | | | 204 | |
| | 167,440 | | | | | Ross Stores, Inc | | | 12,546 | |
| | 128,898 | | | * | | Sally Beauty Holdings, Inc | | | 3,897 | |
| | 32,813 | | | *,e | | Sears Holdings Corp | | | 1,609 | |
| | 6,100 | | | * | | Sears Hometown and Outlet Stores, Inc | | | 156 | |
| | 42,473 | | | * | | Select Comfort Corp | | | 896 | |
| | 10,447 | | | | | Shoe Carnival, Inc | | | 303 | |
COLLEGE RETIREMENT EQUITIES FUND - Equity Index Account
| | | | | | | | VALUE | |
| SHARES | | | | | COMPANY | | (000) | |
| | 29,418 | | | *,e | | Shutterfly, Inc | | $ | 1,498 | |
| | 61,539 | | | | | Signet Jewelers Ltd | | | 4,843 | |
| | 29,758 | | | | | Sonic Automotive, Inc (Class A) | | | 728 | |
| | 25,073 | | | e | | Stage Stores, Inc | | | 557 | |
| | 504,161 | | | | | Staples, Inc | | | 8,011 | |
| | 17,973 | | | | | Stein Mart, Inc | | | 242 | |
| | 9,938 | | | * | | Systemax, Inc | | | 112 | |
| | 489,225 | | | | | Target Corp | | | 30,953 | |
| | 85,272 | | | | | Tiffany & Co | | | 7,912 | |
| | 13,840 | | | *,e | | Tile Shop Holdings, Inc | | | 250 | |
| | 6,790 | | | * | | Tilly’s, Inc | | | 78 | |
| | 549,136 | | | | | TJX Companies, Inc | | | 34,996 | |
| | 106,368 | | | | | Tractor Supply Co | | | 8,252 | |
| | 8,233 | | | * | | Trans World Entertainment Corp | | | 36 | |
| | 85,276 | | | * | | TripAdvisor, Inc | | | 7,063 | |
| | 32,864 | | | * | | Tuesday Morning Corp | | | 525 | |
| | 48,392 | | | * | | Ulta Salon Cosmetics & Fragrance, Inc | | | 4,671 | |
| | 81,376 | | | * | | Urban Outfitters, Inc | | | 3,019 | |
| | 29,701 | | | * | | Valuevision International, Inc (Class A) | | | 208 | |
| | 16,534 | | | * | | Vitacost.com, Inc | | | 96 | |
| | 22,533 | | | * | | Vitamin Shoppe, Inc | | | 1,172 | |
| | 11,292 | | | * | | West Marine, Inc | | | 161 | |
| | 73,584 | | | * | | Wet Seal, Inc (Class A) | | | 201 | |
| | 29,100 | | | * | | WEX, Inc | | | 2,882 | |
| | 74,374 | | | | | Williams-Sonoma, Inc | | | 4,335 | |
| | 1,945 | | | | | Winmark Corp | | | 180 | |
| | 28,882 | | | * | | Zale Corp | | | 455 | |
| | 10,200 | | | *,e | | zulily, Inc | | | 423 | |
| | 15,828 | | | * | | Zumiez, Inc | | | 412 | |
| | | | | | | TOTAL RETAILING | | | 725,874 | |
| | | | | | | | | | | |
| SEMICONDUCTORS & SEMICONDUCTOR EQUIPMENT - 2.1% | | | | |
| | 29,482 | | | * | | Advanced Energy Industries, Inc | | | 674 | |
| | 474,503 | | | *,e | | Advanced Micro Devices, Inc | | | 1,836 | |
| | 11,245 | | | * | | Alpha & Omega Semiconductor Ltd | | | 87 | |
| | 243,206 | | | | | Altera Corp | | | 7,911 | |
| | 13,851 | | | *,e | | Ambarella, Inc | | | 470 | |
| | 57,503 | | | *,e | | Amkor Technology, Inc | | | 352 | |
| | 47,982 | | | * | | Anadigics, Inc | | | 88 | |
| | 235,106 | | | | | Analog Devices, Inc | | | 11,974 | |
| | 914,892 | | | | | Applied Materials, Inc | | | 16,184 | |
| | 51,846 | | | * | | Applied Micro Circuits Corp | | | 694 | |
| | 330,760 | | | * | | Atmel Corp | | | 2,590 | |
| | 24,963 | | | * | | ATMI, Inc | | | 754 | |
| | 188,674 | | | | | Avago Technologies Ltd | | | 9,979 | |
| | 83,398 | | | * | | Axcelis Technologies, Inc | | | 203 | |
COLLEGE RETIREMENT EQUITIES FUND - Equity Index Account
| | | | | | | | VALUE | |
| SHARES | | | | | COMPANY | | (000) | |
| | 435,213 | | | | | Broadcom Corp (Class A) | | $ | 12,904 | |
| | 52,087 | | | | | Brooks Automation, Inc | | | 546 | |
| | 17,924 | | | * | | Cabot Microelectronics Corp | | | 819 | |
| | 38,988 | | | * | | Cavium Networks, Inc | | | 1,345 | |
| | 18,075 | | | * | | Ceva, Inc | | | 275 | |
| | 47,684 | | | *,e | | Cirrus Logic, Inc | | | 974 | |
| | 18,761 | | | | | Cohu, Inc | | | 197 | |
| | 90,120 | | | * | | Cree, Inc | | | 5,639 | |
| | 118,022 | | | e | | Cypress Semiconductor Corp | | | 1,239 | |
| | 28,713 | | | * | | Diodes, Inc | | | 676 | |
| | 21,955 | | | * | | DSP Group, Inc | | | 213 | |
| | 105,554 | | | * | | Entegris, Inc | | | 1,224 | |
| | 68,235 | | | * | | Entropic Communications, Inc | | | 321 | |
| | 28,026 | | | * | | Exar Corp | | | 330 | |
| | 95,996 | | | * | | Fairchild Semiconductor International, Inc | | | 1,282 | |
| | 51,608 | | | * | | First Solar, Inc | | | 2,820 | |
| | 40,961 | | | * | | Formfactor, Inc | | | 247 | |
| | 42,880 | | | *,e | | Freescale Semiconductor Holdings Ltd | | | 688 | |
| | 13,134 | | | * | | GSI Technology, Inc | | | 87 | |
| | 94,807 | | | *,e | | GT Solar International, Inc | | | 827 | |
| | 23,480 | | | * | | Hittite Microwave Corp | | | 1,449 | |
| | 20,085 | | | * | | Inphi Corp | | | 259 | |
| | 100,476 | | | * | | Integrated Device Technology, Inc | | | 1,024 | |
| | 19,660 | | | * | | Integrated Silicon Solution, Inc | | | 238 | |
| | 3,789,805 | | | | | Intel Corp | | | 98,383 | |
| | 10,099 | | | * | | Intermolecular, Inc | | | 50 | |
| | 52,511 | | | * | | International Rectifier Corp | | | 1,369 | |
| | 94,162 | | | | | Intersil Corp (Class A) | | | 1,080 | |
| | 16,725 | | | | | IXYS Corp | | | 217 | |
| | 126,216 | | | | | Kla-Tencor Corp | | | 8,136 | |
| | 50,517 | | | * | | Kopin Corp | | | 213 | |
| | 123,857 | | | * | | Lam Research Corp | | | 6,744 | |
| | 90,159 | | | * | | Lattice Semiconductor Corp | | | 497 | |
| | 178,347 | | | | | Linear Technology Corp | | | 8,124 | |
| | 418,323 | | | | | LSI Logic Corp | | | 4,610 | |
| | 37,527 | | | * | | LTX-Credence Corp | | | 300 | |
| | 7,685 | | | * | | MA-COM Technology Solutions | | | 131 | |
| | 299,774 | | | | | Marvell Technology Group Ltd | | | 4,311 | |
| | 221,478 | | | | | Maxim Integrated Products, Inc | | | 6,181 | |
| | 17,709 | | | * | | MaxLinear, Inc | | | 185 | |
| | 40,439 | | | | | Micrel, Inc | | | 399 | |
| | 150,135 | | | e | | Microchip Technology, Inc | | | 6,719 | |
| | 784,826 | | | * | | Micron Technology, Inc | | | 17,078 | |
| | 70,791 | | | * | | Microsemi Corp | | | 1,766 | |
| | 40,466 | | | | | MKS Instruments, Inc | | | 1,212 | |
| | 28,065 | | | * | | Monolithic Power Systems, Inc | | | 973 | |
| | 36,904 | | | * | | MoSys, Inc | | | 204 | |
COLLEGE RETIREMENT EQUITIES FUND - Equity Index Account
| | | | | | | | VALUE | |
| SHARES | | | | | COMPANY | | (000) | |
| | 18,167 | | | * | | Nanometrics, Inc | | $ | 346 | |
| | 14,586 | | | * | | NeoPhotonics Corp Ltd | | | 103 | |
| | 3,184 | | | * | | NVE Corp | | | 186 | |
| | 439,769 | | | | | Nvidia Corp | | | 7,045 | |
| | 40,842 | | | * | | Omnivision Technologies, Inc | | | 702 | |
| | 346,536 | | | * | | ON Semiconductor Corp | | | 2,855 | |
| | 18,837 | | | * | | PDF Solutions, Inc | | | 483 | |
| | 20,104 | | | *,e | | Peregrine Semiconductor Corp | | | 149 | |
| | 19,298 | | | * | | Pericom Semiconductor Corp | | | 171 | |
| | 46,544 | | | * | | Photronics, Inc | | | 420 | |
| | 34,118 | | | * | | PLX Technology, Inc | | | 225 | |
| | 157,538 | | | * | | PMC - Sierra, Inc | | | 1,013 | |
| | 22,028 | | | | | Power Integrations, Inc | | | 1,230 | |
| | 84,186 | | | * | | Rambus, Inc | | | 797 | |
| | 209,504 | | | * | | RF Micro Devices, Inc | | | 1,081 | |
| | 11,027 | | | *,e | | Rubicon Technology, Inc | | | 110 | |
| | 25,190 | | | * | | Rudolph Technologies, Inc | | | 296 | |
| | 51,093 | | | * | | Semtech Corp | | | 1,292 | |
| | 27,850 | | | * | | Sigma Designs, Inc | | | 131 | |
| | 56,384 | | | * | | Silicon Image, Inc | | | 347 | |
| | 32,688 | | | * | | Silicon Laboratories, Inc | | | 1,416 | |
| | 145,483 | | | * | | Skyworks Solutions, Inc | | | 4,155 | |
| | 38,295 | | | * | | Spansion, Inc | | | 532 | |
| | 203,017 | | | * | | SunEdison, Inc | | | 2,649 | |
| | 31,758 | | | *,e | | SunPower Corp | | | 947 | |
| | 8,595 | | | * | | Supertex, Inc | | | 215 | |
| | 145,162 | | | * | | Teradyne, Inc | | | 2,558 | |
| | 40,116 | | | | | Tessera Technologies, Inc | | | 791 | |
| | 844,333 | | | | | Texas Instruments, Inc | | | 37,075 | |
| | 121,131 | | | * | | Triquint Semiconductor, Inc | | | 1,010 | |
| | 17,159 | | | * | | Ultra Clean Holdings | | | 172 | |
| | 21,651 | | | * | | Ultratech, Inc | | | 628 | |
| | 29,696 | | | * | | Veeco Instruments, Inc | | | 977 | |
| | 200,711 | | | | | Xilinx, Inc | | | 9,217 | |
| | | | | | | TOTAL SEMICONDUCTORS & SEMICONDUCTOR EQUIPMENT | | | 339,625 | |
| | | | | | | | | | | |
| SOFTWARE & SERVICES - 10.1% | | | | |
| | 41,790 | | | * | | Accelrys, Inc | | | 399 | |
| | 490,412 | | | | | Accenture plc | | | 40,322 | |
| | 30,248 | | | * | | ACI Worldwide, Inc | | | 1,966 | |
| | 205,416 | | | | | Activision Blizzard, Inc | | | 3,663 | |
| | 40,528 | | | * | | Actuate Corp | | | 312 | |
| | 57,158 | | | * | | Acxiom Corp | | | 2,114 | |
| | 383,917 | | | * | | Adobe Systems, Inc | | | 22,989 | |
| | 24,736 | | | | | Advent Software, Inc | | | 865 | |
| | 136,325 | | | * | | Akamai Technologies, Inc | | | 6,432 | |
| | 37,470 | | | *,e | | Alliance Data Systems Corp | | | 9,852 | |
COLLEGE RETIREMENT EQUITIES FUND - Equity Index Account
| | | | | | | | VALUE | |
| SHARES | | | | | COMPANY | | (000) | |
| | 122,656 | | | | | Amdocs Ltd | | $ | 5,058 | |
| | 15,720 | | | | | American Software, Inc (Class A) | | | 155 | |
| | 32,146 | | | *,e | | Angie’s List, Inc | | | 487 | |
| | 71,299 | | | * | | Ansys, Inc | | | 6,217 | |
| | 61,041 | | | * | | AOL, Inc | | | 2,846 | |
| | 71,278 | | | * | | Aspen Technology, Inc | | | 2,979 | |
| | 171,241 | | | * | | Autodesk, Inc | | | 8,619 | |
| | 369,435 | | | | | Automatic Data Processing, Inc | | | 29,854 | |
| | 17,759 | | | * | | AVG Technologies NV | | | 306 | |
| | 35,339 | | | *,e | | Bankrate, Inc | | | 634 | |
| | 36,867 | | | *,e | | Bazaarvoice, Inc | | | 292 | |
| | 35,258 | | | | | Blackbaud, Inc | | | 1,327 | |
| | 8,569 | | | *,e | | Blackhawk Network Holdings, Inc | | | 216 | |
| | 30,473 | | | * | | Blucora, Inc | | | 889 | |
| | 26,320 | | | | | Booz Allen Hamilton Holding Co | | | 504 | |
| | 27,849 | | | * | | Bottomline Technologies, Inc | | | 1,007 | |
| | 20,694 | | | * | | Brightcove, Inc | | | 293 | |
| | 92,422 | | | | | Broadridge Financial Solutions, Inc | | | 3,653 | |
| | 20,308 | | | * | | BroadSoft, Inc | | | 555 | |
| | 249,812 | | | | | CA, Inc | | | 8,406 | |
| | 17,259 | | | *,e | | CACI International, Inc (Class A) | | | 1,264 | |
| | 215,503 | | | * | | Cadence Design Systems, Inc | | | 3,021 | |
| | 28,904 | | | * | | Callidus Software, Inc | | | 397 | |
| | 8,488 | | | * | | Carbonite, Inc | | | 100 | |
| | 33,955 | | | * | | Cardtronics, Inc | | | 1,475 | |
| | 7,744 | | | | | Cass Information Systems, Inc | | | 522 | |
| | 4,497 | | | * | | ChannelAdvisor Corp | | | 188 | |
| | 30,200 | | | *,e | | Chegg, Inc | | | 257 | |
| | 52,926 | | | * | | Ciber, Inc | | | 219 | |
| | 142,633 | | | * | | Citrix Systems, Inc | | | 9,022 | |
| | 230,131 | | | * | | Cognizant Technology Solutions Corp (Class A) | | | 23,239 | |
| | 35,374 | | | * | | Commvault Systems, Inc | | | 2,649 | |
| | 114,157 | | | | | Computer Sciences Corp | | | 6,379 | |
| | 11,045 | | | | | Computer Task Group, Inc | | | 209 | |
| | 163,806 | | | | | Compuware Corp | | | 1,836 | |
| | 27,099 | | | * | | comScore, Inc | | | 775 | |
| | 16,654 | | | * | | Comverse, Inc | | | 646 | |
| | 35,478 | | | *,e | | Concur Technologies, Inc | | | 3,661 | |
| | 21,930 | | | * | | Constant Contact, Inc | | | 681 | |
| | 83,991 | | | | | Convergys Corp | | | 1,768 | |
| | 30,729 | | | * | | Cornerstone OnDemand, Inc | | | 1,639 | |
| | 21,672 | | | * | | CoStar Group, Inc | | | 4,000 | |
| | 27,701 | | | | | CSG Systems International, Inc | | | 814 | |
| | 4,900 | | | * | | Cvent, Inc | | | 178 | |
| | 5,494 | | | *,e | | Cyan, Inc | | | 29 | |
| | 32,566 | | | * | | DealerTrack Holdings, Inc | | | 1,566 | |
| | 22,760 | | | * | | Demand Media, Inc | | | 131 | |
COLLEGE RETIREMENT EQUITIES FUND - Equity Index Account
| | | | | | | | VALUE | |
| SHARES | | | | | COMPANY | | (000) | |
| | 12,187 | | | * | | Demandware, Inc | | $ | 781 | |
| | 37,330 | | | * | | Dice Holdings, Inc | | | 271 | |
| | 27,690 | | | * | | Digital River, Inc | | | 512 | |
| | 5,437 | | | | | DMRC Corp | | | 105 | |
| | 26,145 | | | | | DST Systems, Inc | | | 2,372 | |
| | 11,019 | | | *,e | | E2open, Inc | | | 263 | |
| | 82,942 | | | | | Earthlink, Inc | | | 421 | |
| | 989,409 | | | * | | eBay, Inc | | | 54,309 | |
| | 9,461 | | | * | | eGain Corp | | | 97 | |
| | 230,160 | | | * | | Electronic Arts, Inc | | | 5,280 | |
| | 20,207 | | | *,e | | Ellie Mae, Inc | | | 543 | |
| | 17,443 | | | * | | Envestnet, Inc | | | 703 | |
| | 16,518 | | | * | | EPAM Systems, Inc | | | 577 | |
| | 25,591 | | | | | EPIQ Systems, Inc | | | 415 | |
| | 2,603 | | | * | | ePlus, Inc | | | 148 | |
| | 37,504 | | | * | | Equinix, Inc | | | 6,655 | |
| | 37,881 | | | * | | Euronet Worldwide, Inc | | | 1,813 | |
| | 22,470 | | | | | EVERTEC, Inc | | | 554 | |
| | 24,918 | | | * | | ExlService Holdings, Inc | | | 688 | |
| | 1,298,618 | | | * | | Facebook, Inc | | | 70,982 | |
| | 33,465 | | | e | | Factset Research Systems, Inc | | | 3,634 | |
| | 26,950 | | | | | Fair Isaac Corp | | | 1,694 | |
| | 223,290 | | | | | Fidelity National Information Services, Inc | | | 11,986 | |
| | 13,500 | | | * | | FireEye, Inc | | | 589 | |
| | 74,117 | | | * | | First American Corp | | | 2,633 | |
| | 201,538 | | | * | | Fiserv, Inc | | | 11,901 | |
| | 51,651 | | | * | | FleetCor Technologies, Inc | | | 6,052 | |
| | 12,472 | | | *,e | | FleetMatics Group plc | | | 539 | |
| | 11,266 | | | | | Forrester Research, Inc | | | 431 | |
| | 103,474 | | | * | | Fortinet, Inc | | | 1,979 | |
| | 71,116 | | | * | | Gartner, Inc | | | 5,053 | |
| | 128,036 | | | * | | Genpact Ltd | | | 2,352 | |
| | 19,206 | | | *,m | | Gerber Scientific, Inc | | | 0 | ^ |
| | 5,900 | | | * | | Gigamon, Inc | | | 166 | |
| | 51,313 | | | * | | Global Cash Access, Inc | | | 513 | |
| | 16,316 | | | * | | Global Eagle Entertainment, Inc | | | 243 | |
| | 57,988 | | | | | Global Payments, Inc | | | 3,769 | |
| | 49,882 | | | *,e | | Glu Mobile, Inc | | | 194 | |
| | 8,400 | | | *,e | | Gogo, Inc | | | 208 | |
| | 205,596 | | | * | | Google, Inc (Class A) | | | 230,414 | |
| | 9,927 | | | * | | Guidance Software, Inc | | | 100 | |
| | 37,189 | | | * | | Guidewire Software, Inc | | | 1,825 | |
| | 28,793 | | | | | Hackett Group, Inc | | | 179 | |
| | 28,656 | | | e | | Heartland Payment Systems, Inc | | | 1,428 | |
| | 23,633 | | | * | | Higher One Holdings, Inc | | | 231 | |
| | 57,133 | | | | | IAC/InterActiveCorp | | | 3,924 | |
| | 27,237 | | | * | | iGate Corp | | | 1,094 | |
COLLEGE RETIREMENT EQUITIES FUND - Equity Index Account
| | | | | | | | VALUE | |
| SHARES | | | | | COMPANY | | (000) | |
| | 15,425 | | | * | | Imperva, Inc | | $ | 742 | |
| | 37,980 | | | * | | Infoblox, Inc | | | 1,254 | |
| | 82,708 | | | * | | Informatica Corp | | | 3,432 | |
| | 11,680 | | | * | | Interactive Intelligence, Inc | | | 787 | |
| | 40,309 | | | * | | Internap Network Services Corp | | | 303 | |
| | 793,653 | | | | | International Business Machines Corp | | | 148,866 | |
| | 226,669 | | | | | Intuit, Inc | | | 17,299 | |
| | 34,679 | | | e | | j2 Global, Inc | | | 1,734 | |
| | 66,373 | | | | | Jack Henry & Associates, Inc | | | 3,930 | |
| | 30,270 | | | *,e | | Jive Software, Inc | | | 341 | |
| | 19,259 | | | * | | Knot, Inc | | | 286 | |
| | 55,531 | | | | | Leidos Holdings, Inc | | | 2,582 | |
| | 65,991 | | | | | Lender Processing Services, Inc | | | 2,467 | |
| | 50,961 | | | * | | Limelight Networks, Inc | | | 101 | |
| | 73,740 | | | * | | LinkedIn Corp | | | 15,989 | |
| | 44,720 | | | * | | Lionbridge Technologies | | | 267 | |
| | 19,090 | | | *,e | | Liquidity Services, Inc | | | 433 | |
| | 40,701 | | | * | | Liveperson, Inc | | | 603 | |
| | 18,232 | | | * | | LogMeIn, Inc | | | 612 | |
| | 3,600 | | | * | | Luxoft Holding, Inc | | | 137 | |
| | 13,813 | | | *,e | | magicJack VocalTec Ltd | | | 165 | |
| | 15,544 | | | * | | Manhattan Associates, Inc | | | 1,826 | |
| | 18,418 | | | e | | Mantech International Corp (Class A) | | | 551 | |
| | 16,386 | | | * | | Marchex, Inc (Class B) | | | 142 | |
| | 6,598 | | | * | | Marin Software, Inc | | | 68 | |
| | 5,558 | | | *,e | | Marketo, Inc | | | 206 | |
| | 89,025 | | | | | Mastercard, Inc (Class A) | | | 74,377 | |
| | 51,764 | | | | | MAXIMUS, Inc | | | 2,277 | |
| | 73,403 | | | | | Mentor Graphics Corp | | | 1,767 | |
| | 60,589 | | | *,e | | Micros Systems, Inc | | | 3,476 | |
| | 6,366,772 | | | | | Microsoft Corp | | | 238,308 | |
| | 6,844 | | | * | | MicroStrategy, Inc (Class A) | | | 850 | |
| | 26,713 | | | *,e | | Millennial Media, Inc | | | 194 | |
| | 16,991 | | | *,e | | Mitek Systems, Inc | | | 101 | |
| | 6,089 | | | *,e | | Model N, Inc | | | 72 | |
| | 33,165 | | | * | | ModusLink Global Solutions, Inc | | | 190 | |
| | 16,742 | | | * | | MoneyGram International, Inc | | | 348 | |
| | 29,292 | | | | | Monotype Imaging Holdings, Inc | | | 933 | |
| | 87,580 | | | * | | Monster Worldwide, Inc | | | 624 | |
| | 29,335 | | | * | | Move, Inc | | | 469 | |
| | 28,739 | | | * | | Netscout Systems, Inc | | | 850 | |
| | 26,566 | | | * | | NetSuite, Inc | | | 2,737 | |
| | 50,511 | | | * | | NeuStar, Inc (Class A) | | | 2,518 | |
| | 48,579 | | | * | | NIC, Inc | | | 1,208 | |
| | 199,552 | | | *,e | | Nuance Communications, Inc | | | 3,033 | |
| | 17,950 | | | *,e | | OpenTable, Inc | | | 1,425 | |
| | 2,706,734 | | | | | Oracle Corp | | | 103,560 | |
COLLEGE RETIREMENT EQUITIES FUND - Equity Index Account
| | | | | | | | VALUE | |
| SHARES | | | | | COMPANY | | (000) | |
| | 107,932 | | | * | | Pandora Media, Inc | | $ | 2,871 | |
| | 249,764 | | | | | Paychex, Inc | | | 11,372 | |
| | 12,459 | | | | | Pegasystems, Inc | | | 613 | |
| | 25,493 | | | * | | Perficient, Inc | | | 597 | |
| | 33,429 | | | * | | Planet Payment, Inc | | | 93 | |
| | 22,039 | | | * | | PRG-Schultz International, Inc | | | 148 | |
| | 44,011 | | | * | | Progress Software Corp | | | 1,137 | |
| | 16,358 | | | * | | Proofpoint, Inc | | | 543 | |
| | 17,256 | | | * | | PROS Holdings, Inc | | | 689 | |
| | 90,859 | | | * | | PTC, Inc | | | 3,215 | |
| | 3,320 | | | | | QAD, Inc (Class A) | | | 59 | |
| | 65,926 | | | * | | QLIK Technologies, Inc | | | 1,756 | |
| | 11,626 | | | * | | Qualys, Inc | | | 269 | |
| | 20,643 | | | * | | QuinStreet, Inc | | | 179 | |
| | 85,846 | | | *,e | | Rackspace Hosting, Inc | | | 3,359 | |
| | 5,396 | | | * | | Rally Software Development Corp | | | 105 | |
| | 18,038 | | | * | | RealNetworks, Inc | | | 136 | |
| | 35,118 | | | *,e | | RealPage, Inc | | | 821 | |
| | 145,587 | | | * | | Red Hat, Inc | | | 8,159 | |
| | 6,528 | | | * | | Reis, Inc | | | 126 | |
| | 27,251 | | | * | | Responsys, Inc | | | 747 | |
| | 4,900 | | | *,e | | Rocket Fuel, Inc | | | 301 | |
| | 8,173 | | | * | | Rosetta Stone, Inc | | | 100 | |
| | 78,388 | | | * | | Rovi Corp | | | 1,543 | |
| | 450,308 | | | * | | Salesforce.com, Inc | | | 24,852 | |
| | 13,536 | | | | | Sapiens International Corp NV | | | 104 | |
| | 85,802 | | | * | | Sapient Corp | | | 1,490 | |
| | 31,732 | | | | | Science Applications International Corp | | | 1,049 | |
| | 17,573 | | | * | | Sciquest, Inc | | | 500 | |
| | 24,634 | | | * | | Seachange International, Inc | | | 300 | |
| | 59,920 | | | * | | ServiceNow, Inc | | | 3,356 | |
| | 46,932 | | | * | | ServiceSource International LLC | | | 393 | |
| | 5,658 | | | *,e | | Shutterstock, Inc | | | 473 | |
| | 4,249 | | | *,e | | Silver Spring Networks, Inc | | | 89 | |
| | 49,819 | | | * | | SolarWinds, Inc | | | 1,885 | |
| | 52,358 | | | | | Solera Holdings, Inc | | | 3,705 | |
| | 12,997 | | | *,e | | Spark Networks, Inc | | | 80 | |
| | 77,861 | | | * | | Splunk, Inc | | | 5,347 | |
| | 11,456 | | | * | | SPS Commerce, Inc | | | 748 | |
| | 43,812 | | | * | | SS&C Technologies Holdings, Inc | | | 1,939 | |
| | 11,136 | | | * | | Stamps.com, Inc | | | 469 | |
| | 32,388 | | | * | | SupportSoft, Inc | | | 123 | |
| | 31,978 | | | * | | Sykes Enterprises, Inc | | | 697 | |
| | 533,896 | | | | | Symantec Corp | | | 12,589 | |
| | 22,146 | | | * | | Synchronoss Technologies, Inc | | | 688 | |
| | 117,306 | | | * | | Synopsys, Inc | | | 4,759 | |
| | 11,627 | | | * | | Syntel, Inc | | | 1,057 | |
COLLEGE RETIREMENT EQUITIES FUND - Equity Index Account
| | | | | | | | VALUE | |
| SHARES | | | | | COMPANY | | (000) | |
| | 34,637 | | | * | | TA Indigo Holding Corp | | $ | 419 | |
| | 7,151 | | | * | | Tableau Software, Inc | | | 493 | |
| | 65,606 | | | * | | Take-Two Interactive Software, Inc | | | 1,140 | |
| | 23,016 | | | *,e | | Tangoe, Inc | | | 415 | |
| | 24,938 | | | * | | TeleCommunication Systems, Inc (Class A) | | | 58 | |
| | 12,644 | | | * | | TeleNav, Inc | | | 83 | |
| | 18,087 | | | * | | TeleTech Holdings, Inc | | | 433 | |
| | 125,851 | | | * | | Teradata Corp | | | 5,725 | |
| | 4,000 | | | *,e | | Textura Corp | | | 120 | |
| | 124,754 | | | * | | TIBCO Software, Inc | | | 2,804 | |
| | 95,854 | | | * | | TiVo, Inc | | | 1,258 | |
| | 124,382 | | | | | Total System Services, Inc | | | 4,139 | |
| | 6,116 | | | * | | Travelzoo, Inc | | | 130 | |
| | 21,011 | | | *,e | | Trulia, Inc | | | 741 | |
| | 60,000 | | | *,e | | Twitter, Inc | | | 3,819 | |
| | 24,286 | | | * | | Tyler Technologies, Inc | | | 2,480 | |
| | 21,004 | | | * | | Ultimate Software Group, Inc | | | 3,218 | |
| | 32,818 | | | * | | Unisys Corp | | | 1,102 | |
| | 9,976 | | | | | United Online, Inc | | | 137 | |
| | 68,687 | | | * | | Unwired Planet, Inc | | | 95 | |
| | 57,076 | | | *,e | | Valueclick, Inc | | | 1,334 | |
| | 66,282 | | | * | | Vantiv, Inc | | | 2,161 | |
| | 19,828 | | | * | | Vasco Data Security International | | | 153 | |
| | 82,056 | | | * | | VeriFone Systems, Inc | | | 2,201 | |
| | 41,983 | | | * | | Verint Systems, Inc | | | 1,803 | |
| | 98,940 | | | *,e | | VeriSign, Inc | | | 5,915 | |
| | 32,131 | | | *,e | | VirnetX Holding Corp | | | 624 | |
| | 15,340 | | | * | | Virtusa Corp | | | 584 | |
| | 398,295 | | | | | Visa, Inc (Class A) | | | 88,692 | |
| | 24,953 | | | *,e | | VistaPrint Ltd | | | 1,419 | |
| | 65,349 | | | * | | VMware, Inc (Class A) | | | 5,862 | |
| | 15,521 | | | * | | Vocus, Inc | | | 177 | |
| | 49,370 | | | *,e | | Vringo, Inc | | | 146 | |
| | 24,522 | | | *,e | | WebMD Health Corp (Class A) | | | 969 | |
| | 32,019 | | | * | | Website Pros, Inc | | | 1,018 | |
| | 427,429 | | | | | Western Union Co | | | 7,373 | |
| | 9,100 | | | * | | Wix.com Ltd | | | 244 | |
| | 28,135 | | | * | | Workday, Inc | | | 2,340 | |
| | 5,304 | | | * | | Xoom Corp | | | 145 | |
| | 681,205 | | | * | | Yahoo!, Inc | | | 27,548 | |
| | 24,831 | | | * | | Yelp, Inc | | | 1,712 | |
| | 17,846 | | | *,e | | Zillow, Inc | | | 1,459 | |
| | 47,197 | | | * | | Zix Corp | | | 215 | |
| | 444,065 | | | * | | Zynga, Inc | | | 1,687 | |
| | | | | | | TOTAL SOFTWARE & SERVICES | | | 1,605,156 | |
COLLEGE RETIREMENT EQUITIES FUND - Equity Index Account
| | | | | | | | VALUE | |
| SHARES | | | | | COMPANY | | (000) | |
| TECHNOLOGY HARDWARE & EQUIPMENT - 5.8% | | | | |
| | 76,536 | | | *,e | | 3D Systems Corp | | $ | 7,112 | |
| | 45,260 | | | | | Adtran, Inc | | | 1,222 | |
| | 18,766 | | | * | | Agilysys, Inc | | | 261 | |
| | 9,098 | | | e | | Alliance Fiber Optic Products, Inc | | | 137 | |
| | 121,665 | | | | | Amphenol Corp (Class A) | | | 10,850 | |
| | 13,773 | | | * | | Anaren, Inc | | | 386 | |
| | 20,525 | | | * | | Anixter International, Inc | | | 1,844 | |
| | 715,623 | | | | | Apple, Inc | | | 401,543 | |
| | 88,409 | | | * | | ARRIS Group, Inc | | | 2,154 | |
| | 79,414 | | | * | | Arrow Electronics, Inc | | | 4,308 | |
| | 85,572 | | | * | | Aruba Networks, Inc | | | 1,532 | |
| | 7,201 | | | * | | Audience, Inc | | | 84 | |
| | 24,879 | | | * | | Avid Technology, Inc | | | 203 | |
| | 104,137 | | | | | Avnet, Inc | | | 4,593 | |
| | 34,410 | | | | | AVX Corp | | | 479 | |
| | 15,077 | | | * | | AX Holding Corp | | | 98 | |
| | 11,475 | | | | | Badger Meter, Inc | | | 625 | |
| | 7,316 | | | | | Bel Fuse, Inc (Class B) | | | 156 | |
| | 34,599 | | | | | Belden CDT, Inc | | | 2,438 | |
| | 45,364 | | | * | | Benchmark Electronics, Inc | | | 1,047 | |
| | 12,526 | | | | | Black Box Corp | | | 373 | |
| | 338,011 | | | * | | Brocade Communications Systems, Inc | | | 2,998 | |
| | 26,799 | | | * | | CalAmp Corp | | | 750 | |
| | 28,887 | | | * | | Calix Networks, Inc | | | 278 | |
| | 20,400 | | | e | | CDW Corp | | | 477 | |
| | 30,668 | | | * | | Checkpoint Systems, Inc | | | 484 | |
| | 77,250 | | | *,e | | Ciena Corp | | | 1,849 | |
| | 4,074,383 | | | | | Cisco Systems, Inc | | | 91,470 | |
| | 65,532 | | | * | | Cognex Corp | | | 2,502 | |
| | 19,403 | | | * | | Coherent, Inc | | | 1,443 | |
| | 32,000 | | | * | | CommScope Holding Co, Inc | | | 605 | |
| | 16,633 | | | | | Comtech Telecommunications Corp | | | 524 | |
| | 1,126,872 | | | | | Corning, Inc | | | 20,081 | |
| | 29,620 | | | * | | Cray, Inc | | | 813 | |
| | 23,637 | | | | | CTS Corp | | | 471 | |
| | 27,847 | | | | | Daktronics, Inc | | | 437 | |
| | 11,133 | | | * | | Datalink Corp | | | 121 | |
| | 47,853 | | | e | | Diebold, Inc | | | 1,580 | |
| | 18,652 | | | * | | Digi International, Inc | | | 226 | |
| | 34,172 | | | *,e | | Dolby Laboratories, Inc (Class A) | | | 1,318 | |
| | 16,172 | | | * | | DTS, Inc | | | 388 | |
| | 29,407 | | | * | | EchoStar Corp (Class A) | | | 1,462 | |
| | 11,677 | | | | | Electro Rent Corp | | | 216 | |
| | 17,062 | | | | | Electro Scientific Industries, Inc | | | 178 | |
| | 35,264 | | | * | | Electronics for Imaging, Inc | | | 1,366 | |
| | 1,604,714 | | | | | EMC Corp | | | 40,359 | |
COLLEGE RETIREMENT EQUITIES FUND - Equity Index Account
| | | | | | | | VALUE | |
| SHARES | | | | | COMPANY | | (000) | |
| | 65,177 | | | * | | Emulex Corp | | $ | 467 | |
| | 79,396 | | | * | | Extreme Networks, Inc | | | 556 | |
| | 60,456 | | | * | | F5 Networks, Inc | | | 5,493 | |
| | 21,797 | | | * | | Fabrinet | | | 448 | |
| | 12,851 | | | * | | FARO Technologies, Inc | | | 749 | |
| | 32,068 | | | | | FEI Co | | | 2,866 | |
| | 69,390 | | | * | | Finisar Corp | | | 1,660 | |
| | 107,919 | | | | | Flir Systems, Inc | | | 3,248 | |
| | 55,710 | | | *,e | | Fusion-io, Inc | | | 496 | |
| | 20,123 | | | * | | GSI Group, Inc | | | 226 | |
| | 85,574 | | | * | | Harmonic, Inc | | | 632 | |
| | 83,384 | | | | | Harris Corp | | | 5,821 | |
| | 42,057 | | | * | | Harris Stratex Networks, Inc (Class A) | | | 95 | |
| | 1,483,258 | | | | | Hewlett-Packard Co | | | 41,502 | |
| | 17,775 | | | *,e | | Hutchinson Technology, Inc | | | 57 | |
| | 21,588 | | | * | | Imation Corp | | | 101 | |
| | 21,661 | | | * | | Immersion Corp | | | 225 | |
| | 88,583 | | | *,e | | Infinera Corp | | | 866 | |
| | 116,956 | | | * | | Ingram Micro, Inc (Class A) | | | 2,744 | |
| | 34,716 | | | * | | Insight Enterprises, Inc | | | 788 | |
| | 31,229 | | | e | | InterDigital, Inc | | | 921 | |
| | 43,480 | | | *,e | | InvenSense, Inc | | | 904 | |
| | 24,446 | | | *,e | | IPG Photonics Corp | | | 1,897 | |
| | 31,091 | | | * | | Itron, Inc | | | 1,288 | |
| | 43,041 | | | * | | Ixia | | | 573 | |
| | 154,194 | | | | | Jabil Circuit, Inc | | | 2,689 | |
| | 176,416 | | | * | | JDS Uniphase Corp | | | 2,290 | |
| | 384,874 | | | * | | Juniper Networks, Inc | | | 8,687 | |
| | 33,781 | | | * | | Kemet Corp | | | 191 | |
| | 10,929 | | | * | | KVH Industries, Inc | | | 142 | |
| | 48,008 | | | e | | Lexmark International, Inc (Class A) | | | 1,705 | |
| | 17,104 | | | | | Littelfuse, Inc | | | 1,589 | |
| | 22,942 | | | * | | Maxwell Technologies, Inc | | | 178 | |
| | 11,532 | | | * | | Measurement Specialties, Inc | | | 700 | |
| | 23,128 | | | * | | Mercury Computer Systems, Inc | | | 253 | |
| | 1,988 | | | | | Mesa Laboratories, Inc | | | 156 | |
| | 28,385 | | | | | Methode Electronics, Inc | | | 970 | |
| | 184,087 | | | | | Motorola, Inc | | | 12,426 | |
| | 12,135 | | | | | MTS Systems Corp | | | 865 | |
| | 9,079 | | | * | | Multi-Fineline Electronix, Inc | | | 126 | |
| | 73,278 | | | | | National Instruments Corp | | | 2,346 | |
| | 125,176 | | | * | | NCR Corp | | | 4,264 | |
| | 17,608 | | | *,e | | Neonode, Inc | | | 111 | |
| | 258,724 | | | | | NetApp, Inc | | | 10,644 | |
| | 28,803 | | | * | | Netgear, Inc | | | 949 | |
| | 27,910 | | | * | | Newport Corp | | | 504 | |
| | 10,650 | | | * | | Numerex Corp | | | 138 | |
COLLEGE RETIREMENT EQUITIES FUND - Equity Index Account
| | | | | | | | VALUE | |
| SHARES | | | | | COMPANY | | (000) | |
| | 15,398 | | | * | | Oplink Communications, Inc | | $ | 286 | |
| | 14,702 | | | * | | OSI Systems, Inc | | | 781 | |
| | 25,180 | | | * | | Palo Alto Networks, Inc | | | 1,447 | |
| | 18,452 | | | | | Park Electrochemical Corp | | | 530 | |
| | 68,401 | | | *,e | | Parkervision, Inc | | | 311 | |
| | 6,868 | | | | | PC Connection, Inc | | | 171 | |
| | 13,367 | | | | | PC-Tel, Inc | | | 128 | |
| | 31,900 | | | | | Plantronics, Inc | | | 1,482 | |
| | 27,845 | | | * | | Plexus Corp | | | 1,205 | |
| | 130,633 | | | * | | Polycom, Inc | | | 1,467 | |
| | 16,952 | | | *,e | | Procera Networks, Inc | | | 255 | |
| | 73,291 | | | * | | QLogic Corp | | | 867 | |
| | 1,317,314 | | | | | Qualcomm, Inc | | | 97,811 | |
| | 171,155 | | | * | | Quantum Corp | | | 205 | |
| | 25,143 | | | *,e | | Rackable Systems, Inc | | | 337 | |
| | 15,185 | | | * | | Radisys Corp | | | 35 | |
| | 36,008 | | | * | | RealD, Inc | | | 308 | |
| | 11,626 | | | | | Richardson Electronics Ltd | | | 132 | |
| | 124,087 | | | * | | Riverbed Technology, Inc | | | 2,244 | |
| | 21,664 | | | * | | Rofin-Sinar Technologies, Inc | | | 585 | |
| | 12,342 | | | * | | Rogers Corp | | | 759 | |
| | 33,121 | | | * | | Ruckus Wireless, Inc | | | 470 | |
| | 171,839 | | | | | SanDisk Corp | | | 12,122 | |
| | 61,646 | | | * | | Sanmina Corp | | | 1,029 | |
| | 22,159 | | | * | | Scansource, Inc | | | 940 | |
| | 43,182 | | | * | | ShoreTel, Inc | | | 401 | |
| | 165,491 | | | * | | Sonus Networks, Inc | | | 521 | |
| | 29,279 | | | * | | Speed Commerce, Inc | | | 137 | |
| | 24,121 | | | * | | Stratasys Ltd | | | 3,249 | |
| | 24,077 | | | * | | Super Micro Computer, Inc | | | 413 | |
| | 25,608 | | | *,e | | Synaptics, Inc | | | 1,327 | |
| | 19,931 | | | * | | SYNNEX Corp | | | 1,343 | |
| | 28,651 | | | * | | Tech Data Corp | | | 1,478 | |
| | 3,883 | | | | | Tessco Technologies, Inc | | | 157 | |
| | 194,448 | | | * | | Trimble Navigation Ltd | | | 6,747 | |
| | 41,884 | | | * | | TTM Technologies, Inc | | | 359 | |
| | 9,456 | | | *,e | | Ubiquiti Networks, Inc | | | 435 | |
| | 7,424 | | | *,e | | Uni-Pixel, Inc | | | 74 | |
| | 29,474 | | | *,e | | Universal Display Corp | | | 1,013 | |
| | 30,131 | | | * | | Viasat, Inc | | | 1,888 | |
| | 3,408 | | | * | | Viasystems Group, Inc | | | 47 | |
| | 25,400 | | | * | | Violin Memory, Inc | | | 101 | |
| | 100,754 | | | * | | Vishay Intertechnology, Inc | | | 1,336 | |
| | 9,508 | | | * | | Vishay Precision Group, Inc | | | 142 | |
| | 40,762 | | | * | | Westell Technologies, Inc | | | 165 | |
| | 161,050 | | | | | Western Digital Corp | | | 13,512 | |
COLLEGE RETIREMENT EQUITIES FUND - Equity Index Account
| | | | | | | | VALUE | |
| SHARES | | | | | COMPANY | | (000) | |
| | 933,534 | | | | | Xerox Corp | | $ | 11,361 | |
| | 38,765 | | | * | | Zebra Technologies Corp (Class A) | | | 2,096 | |
| | 12,959 | | | * | | Zygo Corp | | | 192 | |
| | | | | | | TOTAL TECHNOLOGY HARDWARE & EQUIPMENT | | | 914,788 | |
| | | | | | | | | | | |
| TELECOMMUNICATION SERVICES - 2.1% | | | | |
| | 54,341 | | | * | | 8x8, Inc | | | 552 | |
| | 4,101,542 | | | | | AT&T, Inc | | | 144,210 | |
| | 7,918 | | | | | Atlantic Tele-Network, Inc | | | 448 | |
| | 12,079 | | | * | | Boingo Wireless, Inc | | | 77 | |
| | 20,132 | | | * | | Cbeyond Communications, Inc | | | 139 | |
| | 465,829 | | | | | CenturyTel, Inc | | | 14,837 | |
| | 149,815 | | | * | | Cincinnati Bell, Inc | | | 533 | |
| | 35,274 | | | | | Cogent Communications Group, Inc | | | 1,425 | |
| | 30,479 | | | | | Consolidated Communications Holdings, Inc | | | 598 | |
| | 254,432 | | | * | | Crown Castle International Corp | | | 18,683 | |
| | 16,551 | | | *,e | | Fairpoint Communications, Inc | | | 187 | |
| | 762,890 | | | e | | Frontier Communications Corp | | | 3,547 | |
| | 24,304 | | | * | | General Communication, Inc (Class A) | | | 271 | |
| | 7,568 | | | * | | Hawaiian Telcom Holdco, Inc | | | 222 | |
| | 10,686 | | | | | HickoryTech Corp | | | 137 | |
| | 10,513 | | | | | IDT Corp (Class B) | | | 188 | |
| | 38,233 | | | * | | inContact, Inc | | | 299 | |
| | 25,073 | | | | | Inteliquent, Inc | | | 286 | |
| | 17,103 | | | *,e | | Intelsat S.A. | | | 386 | |
| | 49,634 | | | *,e | | Iridium Communications, Inc | | | 311 | |
| | 46,753 | | | * | | Leap Wireless International, Inc | | | 814 | |
| | 124,143 | | | * | | Level 3 Communications, Inc | | | 4,118 | |
| | 11,759 | | | | | Lumos Networks Corp | | | 247 | |
| | 128,273 | | | *,e | | NII Holdings, Inc (Class B) | | | 353 | |
| | 11,759 | | | | | NTELOS Holdings Corp | | | 238 | |
| | 28,044 | | | * | | Orbcomm, Inc | | | 178 | |
| | 42,630 | | | * | | Premiere Global Services, Inc | | | 494 | |
| | 97,128 | | | * | | SBA Communications Corp (Class A) | | | 8,726 | |
| | 18,151 | | | | | Shenandoah Telecom Co | | | 466 | |
| | 644,967 | | | * | | Sprint Corp | | | 6,933 | |
| | 5,256 | | | * | | Straight Path Communications, Inc | | | 43 | |
| | 70,668 | | | | | Telephone & Data Systems, Inc | | | 1,822 | |
| | 145,664 | | | * | | T-Mobile US, Inc | | | 4,900 | |
| | 49,246 | | | *,e | | Towerstream Corp | | | 146 | |
| | 114,391 | | | * | | tw telecom inc (Class A) | | | 3,486 | |
| | 9,529 | | | | | US Cellular Corp | | | 399 | |
| | 18,421 | | | | | USA Mobility, Inc | | | 263 | |
| | 2,181,158 | | | | | Verizon Communications, Inc | | | 107,182 | |
| | 119,221 | | | * | | Vonage Holdings Corp | | | 397 | |
| | 459,835 | | | e | | Windstream Holdings, Inc | | | 3,669 | |
| | | | | | | TOTAL TELECOMMUNICATION SERVICES | | | 332,210 | |
COLLEGE RETIREMENT EQUITIES FUND - Equity Index Account
| | | | | | | | VALUE | |
| SHARES | | | | | COMPANY | | (000) | |
| TRANSPORTATION - 2.1% | | | | |
| | 44,655 | | | * | | Air Transport Services Group, Inc | | $ | 361 | |
| | 53,479 | | | | | Alaska Air Group, Inc | | | 3,924 | |
| | 11,124 | | | * | | Allegiant Travel Co | | | 1,173 | |
| | 5,591 | | | * | | Amerco, Inc | | | 1,330 | |
| | 146,103 | | | *,e | | American Airlines Group, Inc | | | 3,689 | |
| | 19,331 | | | | | Arkansas Best Corp | | | 651 | |
| | 19,165 | | | * | | Atlas Air Worldwide Holdings, Inc | | | 789 | |
| | 81,543 | | | * | | Avis Budget Group, Inc | | | 3,296 | |
| | 16,346 | | | | | Celadon Group, Inc | | | 318 | |
| | 115,874 | | | e | | CH Robinson Worldwide, Inc | | | 6,760 | |
| | 42,760 | | | | | Con-Way, Inc | | | 1,698 | |
| | 25,778 | | | | | Copa Holdings S.A. (Class A) | | | 4,127 | |
| | 779,163 | | | | | CSX Corp | | | 22,416 | |
| | 654,973 | | | | | Delta Air Lines, Inc | | | 17,992 | |
| | 13,483 | | | * | | Echo Global Logistics, Inc | | | 290 | |
| | 157,007 | | | | | Expeditors International of Washington, Inc | | | 6,948 | |
| | 241,942 | | | | | FedEx Corp | | | 34,784 | |
| | 22,919 | | | | | Forward Air Corp | | | 1,006 | |
| | 32,826 | | | * | | Genesee & Wyoming, Inc (Class A) | | | 3,153 | |
| | 40,654 | | | *,e | | Hawaiian Holdings, Inc | | | 391 | |
| | 38,365 | | | | | Heartland Express, Inc | | | 753 | |
| | 262,970 | | | * | | Hertz Global Holdings, Inc | | | 7,526 | |
| | 28,105 | | | * | | Hub Group, Inc (Class A) | | | 1,121 | |
| | 4,290 | | | | | International Shipholding Corp | | | 127 | |
| | 69,164 | | | | | J.B. Hunt Transport Services, Inc | | | 5,346 | |
| | 181,414 | | | *,e | | JetBlue Airways Corp | | | 1,551 | |
| | 83,991 | | | | | Kansas City Southern Industries, Inc | | | 10,401 | |
| | 42,550 | | | * | | Kirby Corp | | | 4,223 | |
| | 42,524 | | | | | Knight Transportation, Inc | | | 780 | |
| | 35,503 | | | * | | Landstar System, Inc | | | 2,040 | |
| | 17,739 | | | | | Marten Transport Ltd | | | 358 | |
| | 32,238 | | | | | Matson, Inc | | | 842 | |
| | 239,908 | | | | | Norfolk Southern Corp | | | 22,271 | |
| | 54,394 | | | * | | Old Dominion Freight Line | | | 2,884 | |
| | 31,042 | | | * | | Pacer International, Inc | | | 256 | |
| | 6,136 | | | * | | Park-Ohio Holdings Corp | | | 321 | |
| | 4,942 | | | * | | Patriot Transportation Holding, Inc | | | 205 | |
| | 16,337 | | | * | | Quality Distribution, Inc | | | 210 | |
| | 36,815 | | | * | | Republic Airways Holdings, Inc | | | 394 | |
| | 13,212 | | | * | | Roadrunner Transportation Services Holdings, Inc | | | 356 | |
| | 39,335 | | | | | Ryder System, Inc | | | 2,902 | |
| | 18,094 | | | * | | Saia, Inc | | | 580 | |
| | 40,260 | | | | | Skywest, Inc | | | 597 | |
| | 548,845 | | | | | Southwest Airlines Co | | | 10,340 | |
| | 45,773 | | | * | | Spirit Airlines, Inc | | | 2,079 | |
| | 63,781 | | | *,e | | Swift Transportation Co, Inc | | | 1,417 | |
COLLEGE RETIREMENT EQUITIES FUND - Equity Index Account
| | | | | | | | VALUE | |
| SHARES | | | | | COMPANY | | (000) | |
| | 269,291 | | | * | | UAL Corp | | $ | 10,187 | |
| | 14,027 | | | * | | Ultrapetrol Bahamas Ltd | | | 52 | |
| | 355,735 | | | | | Union Pacific Corp | | | 59,763 | |
| | 552,290 | | | | | United Parcel Service, Inc (Class B) | | | 58,035 | |
| | 3,884 | | | | | Universal Truckload Services, Inc | | | 118 | |
| | 69,158 | | | | | UTI Worldwide, Inc | | | 1,214 | |
| | 34,798 | | | | | Werner Enterprises, Inc | | | 861 | |
| | 31,643 | | | * | | Wesco Aircraft Holdings, Inc | | | 694 | |
| | 22,338 | | | *,e | | XPO Logistics, Inc | | | 587 | |
| | 8,209 | | | *,e | | YRC Worldwide, Inc | | | 143 | |
| | | | | | | TOTAL TRANSPORTATION | | | 326,630 | |
| | | | | | | | | | | |
| UTILITIES - 2.9% | | | | |
| | 471,467 | | | | | AES Corp | | | 6,841 | |
| | 91,415 | | | | | AGL Resources, Inc | | | 4,318 | |
| | 30,845 | | | | | Allete, Inc | | | 1,539 | |
| | 84,216 | | | | | Alliant Energy Corp | | | 4,346 | |
| | 184,363 | | | | | Ameren Corp | | | 6,667 | |
| | 369,389 | | | | | American Electric Power Co, Inc | | | 17,265 | |
| | 29,456 | | | | | American States Water Co | | | 846 | |
| | 134,451 | | | | | American Water Works Co, Inc | | | 5,682 | |
| | 134,973 | | | | | Aqua America, Inc | | | 3,184 | |
| | 4,909 | | | | | Artesian Resources Corp | | | 113 | |
| | 108,646 | | | e | | Atlantic Power Corp | | | 378 | |
| | 69,174 | | | | | Atmos Energy Corp | | | 3,142 | |
| | 43,026 | | | | | Avista Corp | | | 1,213 | |
| | 33,522 | | | | | Black Hills Corp | | | 1,760 | |
| | 35,650 | | | | | California Water Service Group | | | 822 | |
| | 300,049 | | | * | | Calpine Corp | | | 5,854 | |
| | 325,746 | | | | | Centerpoint Energy, Inc | | | 7,551 | |
| | 7,727 | | | | | Chesapeake Utilities Corp | | | 464 | |
| | 46,444 | | | | | Cleco Corp | | | 2,165 | |
| | 203,302 | | | | | CMS Energy Corp | | | 5,442 | |
| | 8,405 | | | | | Connecticut Water Service, Inc | | | 299 | |
| | 222,400 | | | | | Consolidated Edison, Inc | | | 12,294 | |
| | 10,306 | | | | | Consolidated Water Co, Inc | | | 145 | |
| | 5,331 | | | | | Delta Natural Gas Co, Inc | | | 119 | |
| | 439,672 | | | | | Dominion Resources, Inc | | | 28,442 | |
| | 131,757 | | | | | DTE Energy Co | | | 8,747 | |
| | 538,717 | | | | | Duke Energy Corp | | | 37,177 | |
| | 76,383 | | | *,e | | Dynegy, Inc | | | 1,644 | |
| | 248,110 | | | | | Edison International | | | 11,488 | |
| | 30,616 | | | | | El Paso Electric Co | | | 1,075 | |
| | 33,239 | | | | | Empire District Electric Co | | | 754 | |
| | 135,237 | | | | | Entergy Corp | | | 8,556 | |
| | 655,184 | | | | | Exelon Corp | | | 17,946 | |
| | 321,056 | | | | | FirstEnergy Corp | | | 10,588 | |
COLLEGE RETIREMENT EQUITIES FUND - Equity Index Account
| | | | | | | | VALUE | |
| SHARES | | | | | COMPANY | | (000) | |
| | 10,513 | | | * | | Genie Energy Ltd | | $ | 107 | |
| | 117,135 | | | | | Great Plains Energy, Inc | | | 2,839 | |
| | 73,366 | | | e | | Hawaiian Electric Industries, Inc | | | 1,912 | |
| | 38,056 | | | | | Idacorp, Inc | | | 1,973 | |
| | 59,780 | | | | | Integrys Energy Group, Inc | | | 3,253 | |
| | 39,649 | | | | | ITC Holdings Corp | | | 3,799 | |
| | 24,878 | | | | | Laclede Group, Inc | | | 1,133 | |
| | 144,429 | | | | | MDU Resources Group, Inc | | | 4,412 | |
| | 17,500 | | | | | MGE Energy, Inc | | | 1,013 | |
| | 11,759 | | | | | Middlesex Water Co | | | 246 | |
| | 55,740 | | | | | National Fuel Gas Co | | | 3,980 | |
| | 31,721 | | | | | New Jersey Resources Corp | | | 1,467 | |
| | 323,264 | | | | | NextEra Energy, Inc | | | 27,678 | |
| | 237,792 | | | | | NiSource, Inc | | | 7,819 | |
| | 241,828 | | | | | Northeast Utilities | | | 10,251 | |
| | 22,143 | | | | | Northwest Natural Gas Co | | | 948 | |
| | 27,832 | | | | | NorthWestern Corp | | | 1,206 | |
| | 248,809 | | | | | NRG Energy, Inc | | | 7,146 | |
| | 17,100 | | | e | | NRG Yield, Inc | | | 684 | |
| | 150,808 | | | | | OGE Energy Corp | | | 5,112 | |
| | 158,189 | | | | | Oneok, Inc | | | 9,836 | |
| | 13,917 | | | e | | Ormat Technologies, Inc | | | 379 | |
| | 27,545 | | | | | Otter Tail Corp | | | 806 | |
| | 11,000 | | | * | | Pattern Energy Group, Inc | | | 333 | |
| | 189,953 | | | e | | Pepco Holdings, Inc | | | 3,634 | |
| | 336,758 | | | | | PG&E Corp | | | 13,565 | |
| | 58,907 | | | | | Piedmont Natural Gas Co, Inc | | | 1,953 | |
| | 83,775 | | | | | Pinnacle West Capital Corp | | | 4,433 | |
| | 60,937 | | | | | PNM Resources, Inc | | | 1,470 | |
| | 58,032 | | | | | Portland General Electric Co | | | 1,753 | |
| | 483,994 | | | | | PPL Corp | | | 14,563 | |
| | 384,444 | | | | | Public Service Enterprise Group, Inc | | | 12,318 | |
| | 13,764 | | | *,e | | Pure Cycle Corp | | | 87 | |
| | 135,152 | | | | | Questar Corp | | | 3,107 | |
| | 106,249 | | | | | SCANA Corp | | | 4,986 | |
| | 185,680 | | | | | Sempra Energy | | | 16,667 | |
| | 12,005 | | | | | SJW Corp | | | 358 | |
| | 24,625 | | | | | South Jersey Industries, Inc | | | 1,378 | |
| | 662,536 | | | | | Southern Co | | | 27,237 | |
| | 34,400 | | | | | Southwest Gas Corp | | | 1,923 | |
| | 163,004 | | | e | | TECO Energy, Inc | | | 2,810 | |
| | 85,402 | | | | | UGI Corp | | | 3,541 | |
| | 43,076 | | | | | UIL Holdings Corp | | | 1,669 | |
| | 10,272 | | | | | Unitil Corp | | | 313 | |
| | 30,975 | | | | | UNS Energy Corp | | | 1,854 | |
| | 62,331 | | | | | Vectren Corp | | | 2,213 | |
| | 102,865 | | | | | Westar Energy, Inc | | | 3,309 | |
COLLEGE RETIREMENT EQUITIES FUND - Equity Index Account
| | | | | | | | | | MATURITY | | VALUE | |
| SHARES | | | | | COMPANY | | RATE | | DATE | | (000) | |
| | 39,376 | | | | | WGL Holdings, Inc | | | | | | | $ | 1,577 | |
| | 174,151 | | | | | Wisconsin Energy Corp | | | | | | | | 7,199 | |
| | 379,157 | | | | | Xcel Energy, Inc | | | | | | | | 10,594 | |
| | 9,006 | | | | | York Water Co | | | | | | | | 189 | |
| | | | | | | TOTAL UTILITIES | | | | | | | | 461,898 | |
| | | | | | | | | | | | | | | | |
| | | | | | | TOTAL COMMON STOCKS | | | | | | | | 15,802,646 | |
| | | | | | | (Cost $9,162,211) | | | | | | | | | |
| | | | | | | | | | | | | | | | |
| RIGHTS / WARRANTS - 0.0% | | | | | | | | | |
| | | | | | | | | | |
| ENERGY - 0.0% | | | | | | | | | |
| | 104,447 | | | | | EXCO Resources, Inc | | | | | | | | 16 | |
| | 15,560 | | | m | | Magnum Hunter Resources Corp | | | | | | | | 0 | ^ |
| | | | | | | TOTAL ENERGY | | | | | | | | 16 | |
| | | | | | | | | | | | | | | | |
| PHARMACEUTICALS, BIOTECHNOLOGY & LIFE SCIENCES - 0.0% | | | | | | | | | |
| | 28,951 | | | m | | Trius Therapeutics, Inc | | | | | | | | 4 | |
| | | | | | | TOTAL PHARMACEUTICALS, BIOTECHNOLOGY & LIFE SCIENCES | | | 4 | |
| | | | | | | | | | | | | | | | |
| REAL ESTATE - 0.0% | | | | | | | | | |
| | 1,735 | | | | | Tejon Ranch Co | | | | | | | | 9 | |
| | | | | | | TOTAL REAL ESTATE | | | | | | | | 9 | |
| | | | | | | | | | | | | | | | |
| | | | | | | TOTAL RIGHTS / WARRANTS | | | | | | | | 29 | |
| | | | | | | (Cost $10) | | | | | | | | | |
| | | | | | | | | | | | | | | | |
| PRINCIPAL | | | | | ISSUER | | | | | | | | | |
| SHORT-TERM INVESTMENTS - 3.6% | | | | | | | | | |
| | | | | | | | | | |
| GOVERNMENT AGENCY DEBT - 0.1% | | | | | | | | | |
| $ | 5,000,000 | | | d | | Federal Home Loan Bank (FHLB) | | 0.065 | % | | 02/26/14 | | | 4,999 | |
| | 6,530,000 | | | d | | Federal National Mortgage Association (FNMA) | | 0.030 | | | 01/15/14 | | | 6,530 | |
| | | | | | | TOTAL GOVERNMENT AGENCY DEBT | | | | | | | | 11,529 | |
| | | | | | | | | | | | | | | | |
| TREASURY DEBT - 0.1% | | | | | | | | | |
| | 18,800,000 | | | d | | United States Treasury Bill | | 0.053 | | | 03/13/14 | | | 18,799 | |
| | 4,000,000 | | | | | United States Treasury Bill | | 0.070 | | | 06/19/14 | | | 3,999 | |
| | | | | | | TOTAL TREASURY DEBT | | | | | | | | 22,798 | |
COLLEGE RETIREMENT EQUITIES FUND - Equity Index Account
| | | | | | | | VALUE | |
| SHARES | | | | | COMPANY | | (000) | |
| INVESTMENTS IN REGISTERED INVESTMENT COMPANIES - 3.4% | | | |
| | 536,110,401 | | | a,c | | TIAA-CREF Short Term Lending Portfolio of the State Street Navigator Securities Lending Trust | | $ | 536,110 | |
| | | | | | | TOTAL INVESTMENTS IN REGISTERED INVESTMENT COMPANIES | | | 536,110 | |
| | | | | | | | | | | |
| | | | | | | TOTAL SHORT-TERM INVESTMENTS | | | 570,437 | |
| | | | | | | (Cost $570,436) | | | | |
| | | | | | | TOTAL INVESTMENTS - 103.2% | | | 16,373,112 | |
| | | | | | | (Cost $9,732,657) | | | | |
| | | | | | | OTHER ASSETS & LIABILITIES, NET - (3.2)% | | | (515,101 | ) |
| | | | | | | NET ASSETS - 100.0% | | $ | 15,858,011 | |
| | | | | | | | |
| | | | | | | Abbreviation(s): |
| | ETF | | | | | Exchange Traded Fund |
| | REIT | | | | | Real Estate Investment Trust |
| | SPDR | | | | | Standard & Poor’s Depository Receipts |
| | | | | | | |
| | * | | | | | Non-income producing. |
| | ^ | | | | | Amount represents less than $1,000. |
| | a | | | | | Affiliated holding. |
| | c | | | | | Investments made with cash collateral received from securites on loan. |
| | d | | | | | All or a portion of these securities have been segregated by the custodian to cover margin or other requirements on open futures transactions. |
| | e | | | | | All or a portion of these securities are out on loan. The aggregate value of securities on loan is $523,303,000. |
| | m | | | | | Indicates a security that has been deemed illiquid. |
| | | | | | | |
| | | | | | | Cost amounts are in thousands. |
COLLEGE RETIREMENT EQUITIES FUND - Bond Market Account
COLLEGE RETIREMENT EQUITIES FUND
BOND MARKET ACCOUNT
SCHEDULE OF INVESTMENTS
December 31, 2013
| | | | | | | | | | MATURITY | | VALUE | |
| PRINCIPAL | | | | | ISSUER | | RATE | | DATE | | (000) | |
| BANK LOAN OBLIGATIONS - 0.2% | | | | | | | | | |
| | | | | | | | | | | | | | | | |
| CAPITAL GOODS - 0.1% | | | | | | | | | |
| $ | 3,283,500 | | | i | | Apex Tool Group LLC | | 4.500 | % | | 01/31/20 | | $ | 3,295 | |
| | 4,851,000 | | | i | | TransDigm, Inc | | 3.750 | | | 02/28/20 | | | 4,860 | |
| | | | | | | TOTAL CAPITAL GOODS | | | | | | | | 8,155 | |
| | | | | | | | | | | | | | | | |
| FOOD, BEVERAGE & TOBACCO - 0.1% | | | | | | | | | |
| | 10,746,000 | | | i | | HJ Heinz Co | | 3.250 | | | 06/07/19 | | | 10,803 | |
| | | | | | | TOTAL FOOD, BEVERAGE & TOBACCO | | | | | | | | 10,803 | |
| | | | | | | | | | | | | | | | |
| MEDIA - 0.0% | | | | | | | | | |
| | 1,836,125 | | | i | | Univision Communications, Inc | | 4.000 | | | 03/01/20 | | | 1,843 | |
| | | | | | | TOTAL MEDIA | | | | | | | | 1,843 | |
| | | | | | | | | | | | | | | | |
| UTILITIES - 0.0% | | | | | | | | | |
| | 197,500 | | | i | | Calpine Corp | | 4.000 | | | 10/09/19 | | | 199 | |
| | | | | | | TOTAL UTILITIES | | | | | | | | 199 | |
| | | | | | | | | | | | | | | | |
| | | | | | | TOTAL BANK LOAN OBLIGATIONS | | | | | | | | 21,000 | |
| | | | | | | (Cost $20,879) | | | | | | | | | |
| | | | | | | | | | | | | | | | |
| BONDS - 97.6% | | | | | | | | | |
| | | | | | | | | | | | | | | | |
| CORPORATE BONDS - 32.0% | | | | | | | | | |
| | | | | | | | | | | | | | | | |
| AUTOMOBILES & COMPONENTS - 0.1% | | | | | | | | | |
| | 10,300,000 | | | | | Ford Motor Co | | 4.750 | | | 01/15/43 | | | 9,289 | |
| | 4,500,000 | | | g | | Hyundai Motor Manufacturer | | 4.500 | | | 04/15/15 | | | 4,686 | |
| | | | | | | TOTAL AUTOMOBILES & COMPONENTS | | | | | | | | 13,975 | |
| | | | | | | | | | | | | | | | |
| BANKS - 5.6% | | | | | | | | | |
| | 4,500,000 | | | g | | Alfa Bond Issuance plc for OJSC Alfa Bank | | 7.750 | | | 04/28/21 | | | 4,809 | |
| | 4,800,000 | | | g | | Banco de Credito del Peru | | 5.375 | | | 09/16/20 | | | 4,992 | |
| | 5,950,000 | | | g | | Banco de Credito e Inversiones | | 4.000 | | | 02/11/23 | | | 5,504 | |
| | 4,500,000 | | | | | Banco de Oro Unibank, Inc | | 3.875 | | | 04/22/16 | | | 4,579 | |
| | 2,700,000 | | | g | | Banco del Estado de Chile | | 3.875 | | | 02/08/22 | | | 2,636 | |
| | 5,600,000 | | | g | | Banco Santander Mexico S.A. Institucion de Banca Multiple Grupo Financiero Santander | | 4.125 | | | 11/09/22 | | | 5,278 | |
| | 7,255,000 | | | | | Bancolombia S.A. | | 5.950 | | | 06/03/21 | | | 7,545 | |
| | 11,786,000 | | | g | | Bank Nederlandse Gemeenten | | 1.375 | | | 09/27/17 | | | 11,716 | |
| | 1,500,000 | | | g | | Bank Nederlandse Gemeenten | | 1.375 | | | 03/19/18 | | | 1,473 | |
COLLEGE RETIREMENT EQUITIES FUND - Bond Market Account
| | | | | | | | | | | MATURITY | | VALUE | |
| PRINCIPAL | | | | | ISSUER | | RATE | | DATE | | (000) | |
| $ | 9,500,000 | | | | | Bank of America Corp | | 2.600 | % | | 01/15/19 | | $ | 9,542 | |
| | 11,505,000 | | | g | | Bank of Montreal | | 2.850 | | | 06/09/15 | | | 11,894 | |
| | 27,700,000 | | | g | | Bank of Montreal | | 2.625 | | | 01/25/16 | | | 28,816 | |
| | 50,520,000 | | | g | | Bank of Nova Scotia | | 1.650 | | | 10/29/15 | | | 51,510 | |
| | 39,500,000 | | | g | | Bank of Nova Scotia | | 2.150 | | | 08/03/16 | | | 40,682 | |
| 5,850,000 | | | g | | Bank of Tokyo-Mitsubishi UFJ Ltd | | 2.350 | | | 02/23/17 | | | 5,938 | |
| | 3,400,000 | | | | | BB&T Corp | | 2.050 | | | 06/19/18 | | | 3,366 | |
| | 5,190,000 | | | g | | BBVA Banco Continental S.A. | | 3.250 | | | 04/08/18 | | | 5,190 | |
| | 7,450,000 | | | | | BHP Billiton Finance USA Ltd | | 5.000 | | | 09/30/43 | | | 7,575 | |
| | 2,500,000 | | | g | | Caixa Economica Federal | | 2.375 | | | 11/06/17 | | | 2,322 | |
| | 4,500,000 | | | g | | Caixa Economica Federal | | 4.500 | | | 10/03/18 | | | 4,471 | |
| | 6,000,000 | | | g | | Canadian Imperial Bank of Commerce | | 2.600 | | | 07/02/15 | | | 6,189 | |
| | 12,500,000 | | | g | | Canadian Imperial Bank of Commerce | | 2.750 | | | 01/27/16 | | | 13,037 | |
| | 4,500,000 | | | | | Capital One Bank USA NA | | 3.375 | | | 02/15/23 | | | 4,184 | |
| | 10,100,000 | | | | | Capital One Financial Corp | | 1.000 | | | 11/06/15 | | | 10,096 | |
| | 8,425,000 | | | | | Citigroup, Inc | | 1.300 | | | 11/15/16 | | | 8,396 | |
| | 11,400,000 | | | | | Citigroup, Inc | | 2.500 | | | 09/26/18 | | | 11,457 | |
| | 11,000,000 | | | | | Citigroup, Inc | | 3.875 | | | 10/25/23 | | | 10,814 | |
| | 10,775,000 | | | | | Citigroup, Inc | | 6.675 | | | 09/13/43 | | | 12,398 | |
| | 4,475,000 | | | | | Cooperatieve Centrale Raiffeisen-Boerenleenbank BA | | 1.700 | | | 03/19/18 | | | 4,420 | |
| | 5,950,000 | | | | | Cooperatieve Centrale Raiffeisen-Boerenleenbank BA | | 3.875 | | | 02/08/22 | | | 5,982 | |
| | 6,875,000 | | | | | Cooperatieve Centrale Raiffeisen-Boerenleenbank BA | | 3.950 | | | 11/09/22 | | | 6,662 | |
| | 8,650,000 | | | | | Cooperatieve Centrale Raiffeisen-Boerenleenbank BA | | 4.625 | | | 12/01/23 | | | 8,711 | |
| | 10,900,000 | | | | | Cooperatieve Centrale Raiffeisen-Boerenleenbank BA | | 5.750 | | | 12/01/43 | | | 11,555 | |
| | 11,730,000 | | | g | | Depfa ACS Bank | | 5.125 | | | 03/16/37 | | | 9,926 | |
| | 2,350,000 | | | g | | HSBC Bank plc | | 1.500 | | | 05/15/18 | | | 2,295 | |
| | 7,350,000 | | | g | | HSBC Bank plc | | 4.125 | | | 08/12/20 | | | 7,777 | |
| | 7,000,000 | | | | | HSBC Bank USA NA | | 4.625 | | | 04/01/14 | | | 7,072 | |
| | 1,550,000 | | | | | HSBC Holdings plc | | 4.000 | | | 03/30/22 | | | 1,593 | |
| | 2,100,000 | | | | | HSBC Holdings plc | | 6.500 | | | 09/15/37 | | | 2,484 | |
| | 11,275,000 | | | | | HSBC USA, Inc | | 2.375 | | | 02/13/15 | | | 11,505 | |
| | 11,350,000 | | | | | HSBC USA, Inc | | 1.625 | | | 01/16/18 | | | 11,192 | |
| | 4,150,000 | | | g | | Hutchison Whampoa International 11 Ltd | | 4.625 | | | 01/13/22 | | | 4,239 | |
| | 2,595,000 | | | | | JPMorgan Chase & Co | | 5.125 | | | 09/15/14 | | | 2,674 | |
| | 9,125,000 | | | | | JPMorgan Chase & Co | | 5.400 | | | 01/06/42 | | | 9,824 | |
| | 3,750,000 | | | i | | JPMorgan Chase & Co | | 5.150 | | | 12/30/49 | | | 3,366 | |
| | 4,250,000 | | | i | | Manufacturers & Traders Trust Co | | 5.629 | | | 12/01/21 | | | 4,388 | |
| | 6,225,000 | | | g | | PKO Finance AB | | 4.630 | | | 09/26/22 | | | 6,197 | |
| | 4,250,000 | | | | | PNC Bank NA | | 2.700 | | | 11/01/22 | | | 3,852 | |
| | 17,395,000 | | | | | PNC Bank NA | | 2.950 | | | 01/30/23 | | | 16,009 | |
| | 8,000,000 | | | | | PNC Funding Corp | | 5.125 | | | 02/08/20 | | | 8,985 | |
| | 4,900,000 | | | g,i | | Rabobank Nederland NV | | 11.000 | | | 12/30/49 | | | 6,486 | |
| | 12,000,000 | | | | | Royal Bank of Canada | | 1.200 | | | 09/19/17 | | | 11,890 | |
| | 11,300,000 | | | | | Royal Bank of Canada | | 2.200 | | | 07/27/18 | | | 11,346 | |
| | 15,000,000 | | | g | | Skandinaviska Enskilda Banken AB | | 1.375 | | | 05/29/18 | | | 14,602 | |
COLLEGE RETIREMENT EQUITIES FUND - Bond Market Account
| | | | | | | | | | | MATURITY | | VALUE | |
| PRINCIPAL | | | | | ISSUER | | RATE | | DATE | | (000) | |
| $ | 3,800,000 | | | g | | State Bank of India | | 3.250 | % | | 04/18/18 | | $ | 3,679 | |
| | 2,355,000 | | | g | | Sumitomo Mitsui Banking Corp | | 3.150 | | | 07/22/15 | | | 2,435 | |
| | 9,000,000 | | | g | | Toronto-Dominion Bank | | 2.200 | | | 07/29/15 | | | 9,238 | |
| | 495,000 | | | | | Toronto-Dominion Bank | | 2.500 | | | 07/14/16 | | | 513 | |
| | 26,500,000 | | | g | | Toronto-Dominion Bank | | 1.625 | | | 09/14/16 | | | 26,969 | |
| | 10,000,000 | | | | | Toronto-Dominion Bank | | 2.375 | | | 10/19/16 | | | 10,382 | |
| | 70,000,000 | | | g | | Toronto-Dominion Bank | | 1.500 | | | 03/13/17 | | | 70,749 | |
| | 1,950,000 | | | g | | Turkiye Halk Bankasi AS. | | 3.875 | | | 02/05/20 | | | 1,706 | |
| | 9,100,000 | | | g | | Turkiye Is Bankasi | | 3.750 | | | 10/10/18 | | | 8,458 | |
| | 2,975,000 | | | g | | Turkiye Is Bankasi | | 5.500 | | | 04/21/19 | | | 2,943 | |
| | 7,100,000 | | | | | Union Bank NA | | 2.125 | | | 06/16/17 | | | 7,133 | |
| | 5,700,000 | | | | | UnionBanCal Corp | | 3.500 | | | 06/18/22 | | | 5,591 | |
| | 5,800,000 | | | | | US Bancorp | | 1.650 | | | 05/15/17 | | | 5,812 | |
| | 5,550,000 | | | | | US Bancorp | | 2.950 | | | 07/15/22 | | | 5,157 | |
| | 5,000,000 | | | | | US Bank NA | | 4.950 | | | 10/30/14 | | | 5,190 | |
| | 1,980,000 | | | | | Wachovia Bank NA | | 4.800 | | | 11/01/14 | | | 2,053 | |
| | 12,500,000 | | | | | Wells Fargo & Co | | 1.500 | | | 07/01/15 | | | 12,676 | |
| | 10,550,000 | | | | | Wells Fargo & Co | | 1.500 | | | 01/16/18 | | | 10,482 | |
| | 10,175,000 | | | | | Wells Fargo & Co | | 2.150 | | | 01/15/19 | | | 10,143 | |
| | 5,052,000 | | | g | | Wells Fargo & Co | | 4.480 | | | 01/16/24 | | | 5,029 | |
| | 14,625,000 | | | | | Wells Fargo & Co | | 5.375 | | | 11/02/43 | | | 14,976 | |
| | 2,111,000 | | | g | | Wells Fargo & Co | | 5.606 | | | 01/15/44 | | | 2,193 | |
| | 5,700,000 | | | | | Westpac Banking Corp | | 3.000 | | | 08/04/15 | | | 5,922 | |
| | 15,000,000 | | | g | | Westpac Banking Corp | | 1.850 | | | 11/26/18 | | | 14,731 | |
| | | | | | | TOTAL BANKS | | | | | | | | 735,601 | |
| | | | | | | | | | | | | | | | |
| CAPITAL GOODS - 0.7% | | | | | | | | | |
| | 8,000,000 | | | | | Caterpillar, Inc | | 1.375 | | | 05/27/14 | | | 8,031 | |
| | 12,050,000 | | | | | Caterpillar, Inc | | 1.500 | | | 06/26/17 | | | 11,992 | |
| | 2,085,000 | | | | | Crown Americas LLC | | 4.500 | | | 01/15/23 | | | 1,949 | |
| | 8,000,000 | | | | | Deere & Co | | 2.600 | | | 06/08/22 | | | 7,481 | |
| | 6,350,000 | | | g | | EADS Finance BV | | 2.700 | | | 04/17/23 | | | 5,823 | |
| | 6,200,000 | | | | | Eaton Corp | | 1.500 | | | 11/02/17 | | | 6,078 | |
| | 2,075,000 | | | | | Eaton Corp | | 4.000 | | | 11/02/32 | | | 1,906 | |
| | 1,250,000 | | | g | | Schaeffler Finance BV | | 4.750 | | | 05/15/21 | | | 1,247 | |
| | 4,850,000 | | | | | Seagate HDD Cayman | | 7.000 | | | 11/01/21 | | | 5,353 | |
| | 11,000,000 | | | g | | Seagate HDD Cayman | | 4.750 | | | 06/01/23 | | | 10,285 | |
| | 665,000 | | | g | | Sealed Air Corp | | 6.500 | | | 12/01/20 | | | 715 | |
| | 1,370,000 | | | g | | Sealed Air Corp | | 5.250 | | | 04/01/23 | | | 1,332 | |
| | 2,000,000 | | | | | SPX Corp | | 6.875 | | | 09/01/17 | | | 2,260 | |
| | 10,000,000 | | | g | | TSMC Global Ltd | | 1.625 | | | 04/03/18 | | | 9,576 | |
| | 8,950,000 | | | | | United Technologies Corp | | 1.800 | | | 06/01/17 | | | 9,088 | |
| | 5,950,000 | | | | | United Technologies Corp | | 4.500 | | | 06/01/42 | | | 5,778 | |
| | | | | | | TOTAL CAPITAL GOODS | | | | | | | | 88,894 | |
COLLEGE RETIREMENT EQUITIES FUND - Bond Market Account
| | | | | | | | | | | MATURITY | | VALUE | |
| PRINCIPAL | | | | | ISSUER | | RATE | | DATE | | (000) | |
| COMMERCIAL & PROFESSIONAL SERVICES - 0.4% | | | | | | | | | |
| $ | 1,425,000 | | | g | | ADT Corp | | 6.250 | % | | 10/15/21 | | $ | 1,496 | |
| | 10,290,000 | | | | | Republic Services, Inc | | 3.800 | | | 05/15/18 | | | 10,898 | |
| | 5,375,000 | | | | | Republic Services, Inc | | 3.550 | | | 06/01/22 | | | 5,183 | |
| | 7,150,000 | | | | | Waste Management, Inc | | 2.600 | | | 09/01/16 | | | 7,380 | |
| | 32,550,000 | | | | | Waste Management, Inc | | 2.900 | | | 09/15/22 | | | 30,154 | |
| | | | | | | TOTAL COMMERCIAL & PROFESSIONAL SERVICES | | | | | | 55,111 | |
| | | | | | | | | | | | | | | | |
| CONSUMER DURABLES & APPAREL - 0.3% | | | | | | | | | |
| | 12,174,000 | | | | | DR Horton, Inc | | 3.625 | | | 02/15/18 | | | 12,357 | |
| | 4,450,000 | | | | | DR Horton, Inc | | 4.375 | | | 09/15/22 | | | 4,150 | |
| | 5,000,000 | | | | | DR Horton, Inc | | 5.750 | | | 08/15/23 | | | 5,087 | |
| | 1,500,000 | | | | | Hanesbrands, Inc | | 6.375 | | | 12/15/20 | | | 1,639 | |
| | 3,000,000 | | | | | Phillips-Van Heusen Corp | | 7.375 | | | 05/15/20 | | | 3,304 | |
| | 11,900,000 | | | | | PVH Corp | | 4.500 | | | 12/15/22 | | | 11,275 | |
| | 2,625,000 | | | | | Whirlpool Corp | | 3.700 | | | 03/01/23 | | | 2,509 | |
| | | | | | | TOTAL CONSUMER DURABLES & APPAREL | | | | | | 40,321 | |
| | | | | | | | | | | | | | | | |
| CONSUMER SERVICES - 0.8% | | | | | | | | | |
| | 850,000 | | | g | | ARAMARK Corp | | 5.750 | | | 03/15/20 | | | 888 | |
| | 2,000,000 | | | | | DineEquity, Inc | | 9.500 | | | 10/30/18 | | | 2,220 | |
| 2,475,000 | | | g | | GLP Capital LP | | 4.375 | | | 11/01/18 | | | 2,531 | |
| | 5,000,000 | | | | | Johns Hopkins University | | 4.083 | | | 07/01/53 | | | 4,293 | |
| | 8,000,000 | | | | | President and Fellows of Harvard College | | 3.529 | | | 10/01/31 | | | 7,008 | |
| | 14,250,000 | | | | | President and Fellows of Harvard College | | 3.619 | | | 10/01/37 | | | 12,069 | |
| | 11,650,000 | | | g | | SABMiller Holdings, Inc | | 3.750 | | | 01/15/22 | | | 11,693 | |
| | 8,650,000 | | | g | | SABMiller Holdings, Inc | | 4.950 | | | 01/15/42 | | | 8,592 | |
| | 40,000,000 | | | | | Stanford University | | 4.013 | | | 05/01/42 | | | 35,011 | |
| | 21,000,000 | | | | | University of Chicago | | 4.151 | | | 10/01/45 | | | 18,192 | |
| | 7,900,000 | | | | | Walt Disney Co | | 0.450 | | | 12/01/15 | | | 7,892 | |
| | | | | | | TOTAL CONSUMER SERVICES | | | | | | | | 110,389 | |
| | | | | | | | | | | | | | | | |
| DIVERSIFIED FINANCIALS - 5.5% | | | | | | | | | |
| | 6,165,000 | | | g | | Abbey National Treasury Services plc | | 3.875 | | | 11/10/14 | | | 6,333 | |
| | 3,875,000 | | | | | Abbey National Treasury Services plc | | 4.000 | | | 04/27/16 | | | 4,114 | |
| | 7,455,000 | | | g | | Ajecorp BV | | 6.500 | | | 05/14/22 | | | 7,399 | |
| | 2,000,000 | | | | | American Express Centurion Bank | | 6.000 | | | 09/13/17 | | | 2,295 | |
| | 9,275,000 | | | | | American Express Credit Corp | | 1.300 | | | 07/29/16 | | | 9,347 | |
| | 9,800,000 | | | | | American Express Credit Corp | | 2.125 | | | 07/27/18 | | | 9,816 | |
| | 4,500,000 | | | g | | Bangkok Bank PCL | | 4.800 | | | 10/18/20 | | | 4,643 | |
| | 15,175,000 | | | | | Bank of America Corp | | 3.750 | | | 07/12/16 | | | 16,133 | |
| | 18,550,000 | | | | | Bank of America Corp | | 5.300 | | | 03/15/17 | | | 20,446 | |
| | 8,525,000 | | | | | Bank of America Corp | | 6.000 | | | 09/01/17 | | | 9,734 | |
| | 26,175,000 | | | | | Bank of America Corp | | 4.100 | | | 07/24/23 | | | 26,286 | |
| | 10,900,000 | | | | | Bank of America Corp | | 5.875 | | | 02/07/42 | | | 12,466 | |
| | 2,250,000 | | | | | Bank of New York Mellon Corp | | 1.200 | | | 02/20/15 | | | 2,267 | |
| | 6,250,000 | | | i | | Bank of New York Mellon Corp | | 1.969 | | | 06/20/17 | | | 6,318 | |
COLLEGE RETIREMENT EQUITIES FUND - Bond Market Account
| | | | | | | | | | | MATURITY | | VALUE | |
| PRINCIPAL | | | | | ISSUER | | RATE | | DATE | | (000) | |
| $ | 4,125,000 | | | | | Bank of New York Mellon Corp | | 5.450 | % | | 05/15/19 | | $ | 4,687 | |
| | 4,330,000 | | | g | | BBVA Bancomer S.A. | | 4.500 | | | 03/10/16 | | | 4,590 | |
| | 9,075,000 | | | g | | BBVA Bancomer S.A. | | 6.750 | | | 09/30/22 | | | 9,665 | |
| | 7,250,000 | | | | | BlackRock, Inc | | 3.500 | | | 12/10/14 | | | 7,462 | |
| | 15,000,000 | | | | | BlackRock, Inc | | 1.375 | | | 06/01/15 | | | 15,188 | |
| | 7,000,000 | | | | | BlackRock, Inc | | 4.250 | | | 05/24/21 | | | 7,407 | |
| | 10,680,000 | | | g | | Caisse Centrale Desjardins du Quebec | | 2.550 | | | 03/24/16 | | | 11,113 | |
| | 24,600,000 | | | g | | Caisse Centrale Desjardins du Quebec | | 1.600 | | | 03/06/17 | | | 24,907 | |
| | 12,640,000 | | | | | Citigroup, Inc | | 5.000 | | | 09/15/14 | | | 13,000 | |
| | 2,432,000 | | | | | Citigroup, Inc | | 5.500 | | | 10/15/14 | | | 2,522 | |
| | 6,400,000 | | | | | Citigroup, Inc | | 2.250 | | | 08/07/15 | | | 6,533 | |
| | 21,575,000 | | | | | Citigroup, Inc | | 3.500 | | | 05/15/23 | | | 20,103 | |
| | 12,300,000 | | | | | Citigroup, Inc | | 4.950 | | | 11/07/43 | | | 12,252 | |
| | 10,000,000 | | | i | | Citigroup, Inc | | 5.350 | | | 12/30/49 | | | 8,780 | |
| | 3,700,000 | | | | | Countrywide Financial Corp | | 6.250 | | | 05/15/16 | | | 4,083 | |
| | 2,750,000 | | | | | Export-Import Bank of Korea | | 2.875 | | | 09/17/18 | | | 2,782 | |
| | 10,000,000 | | | g | | FMR LLC | | 4.950 | | | 02/01/33 | | | 9,812 | |
| | 11,425,000 | | | g | | FMR LLC | | 5.150 | | | 02/01/43 | | | 10,968 | |
| | 6,660,000 | | | | | Ford Motor Credit Co LLC | | 4.250 | | | 02/03/17 | | | 7,165 | |
| | 3,340,000 | | | | | Ford Motor Credit Co LLC | | 6.625 | | | 08/15/17 | | | 3,869 | |
| | 7,325,000 | | | | | Ford Motor Credit Co LLC | | 5.000 | | | 05/15/18 | | | 8,159 | |
| | 6,750,000 | | | | | Ford Motor Credit Co LLC | | 4.375 | | | 08/06/23 | | | 6,786 | |
| | 17,000,000 | | | | | General Electric Capital Corp | | 1.625 | | | 07/02/15 | | | 17,276 | |
| | 7,200,000 | | | | | General Electric Capital Corp | | 2.100 | | | 12/11/19 | | | 7,001 | |
| | 30,000,000 | | | | | General Electric Capital Corp | | 3.100 | | | 01/09/23 | | | 28,463 | |
| | 5,000,000 | | | | | General Electric Capital Corp | | 6.150 | | | 08/07/37 | | | 5,833 | |
| | 375,000 | | | | | General Electric Capital Corp | | 6.875 | | | 01/10/39 | | | 482 | |
| 5,125,000 | | | g | | General Motors Financial Co, Inc | | 2.750 | | | 05/15/16 | | | 5,189 | |
| | 19,240,000 | | | | | Goldman Sachs Group, Inc | | 3.300 | | | 05/03/15 | | | 19,823 | |
| | 11,075,000 | | | | | Goldman Sachs Group, Inc | | 2.375 | | | 01/22/18 | | | 11,117 | |
| | 1,150,000 | | | | | Goldman Sachs Group, Inc | | 6.450 | | | 05/01/36 | | | 1,232 | |
| | 3,100,000 | | | | | Goldman Sachs Group, Inc | | 6.750 | | | 10/01/37 | | | 3,449 | |
| | 10,250,000 | | | | | Goldman Sachs Group, Inc | | 6.250 | | | 02/01/41 | | | 11,812 | |
| | 9,599,000 | | | | | HSBC Finance Corp | | 6.676 | | | 01/15/21 | | | 11,030 | |
| | 1,440,000 | | | g | | Hyundai Capital America, Inc | | 3.750 | | | 04/06/16 | | | 1,508 | |
| | 1,800,000 | | | g | | Hyundai Capital Services, Inc | | 4.375 | | | 07/27/16 | | | 1,915 | |
| | 2,750,000 | | | g | | Hyundai Capital Services, Inc | | 3.500 | | | 09/13/17 | | | 2,843 | |
| | 3,750,000 | | | g | | International Lease Finance Corp | | 6.500 | | | 09/01/14 | | | 3,877 | |
| | 9,250,000 | | | | | International Lease Finance Corp | | 5.750 | | | 05/15/16 | | | 9,909 | |
| | 8,400,000 | | | | | International Lease Finance Corp | | 3.875 | | | 04/15/18 | | | 8,421 | |
| | 3,200,000 | | | | | International Lease Finance Corp | | 5.875 | | | 04/01/19 | | | 3,408 | |
| | 10,000,000 | | | | | International Lease Finance Corp | | 5.875 | | | 08/15/22 | | | 9,975 | |
| | 3,030,000 | | | g | | Inversiones CMPC S.A. | | 4.375 | | | 05/15/23 | | | 2,824 | |
| | 5,000,000 | | | | | Landwirtschaftliche Rentenbank | | 5.125 | | | 02/01/17 | | | 5,625 | |
| | 5,745,000 | | | g | | Lukoil International Finance BV | | 6.125 | | | 11/09/20 | | | 6,225 | |
| | 5,100,000 | | | g | | LUKOIL International Finance BV | | 4.563 | | | 04/24/23 | | | 4,786 | |
| | 4,675,000 | | | | | Merrill Lynch & Co, Inc | | 6.400 | | | 08/28/17 | | | 5,390 | |
COLLEGE RETIREMENT EQUITIES FUND - Bond Market Account
| | | | | | | | | | | MATURITY | | VALUE | |
| PRINCIPAL | | | | | ISSUER | | RATE | | DATE | | (000) | |
| $ | 8,025,000 | | | | | Merrill Lynch & Co, Inc | | 6.875 | % | | 04/25/18 | | $ | 9,489 | |
| | 10,300,000 | | | | | Morgan Stanley | | 1.750 | | | 02/25/16 | | | 10,438 | |
| | 7,550,000 | | | | | Morgan Stanley | | 4.100 | | | 05/22/23 | | | 7,307 | |
| | 12,750,000 | | | | | Morgan Stanley | | 5.000 | | | 11/24/25 | | | 12,788 | |
| | 7,250,000 | | | | | Morgan Stanley | | 6.375 | | | 07/24/42 | | | 8,492 | |
| | 3,800,000 | | | | | National Rural Utilities Cooperative Finance Corp | | 10.375 | | | 11/01/18 | | | 5,139 | |
| | 2,725,000 | | | g | | Odebrecht Finance Ltd | | 7.125 | | | 06/26/42 | | | 2,517 | |
| | 2,925,000 | | | g | | Perrigo Co Ltd | | 4.000 | | | 11/15/23 | | | 2,870 | |
| | 2,800,000 | | | g | | Perrigo Co Ltd | | 5.300 | | | 11/15/43 | | | 2,748 | |
| | 8,100,000 | | | g | | Reliance Holdings USA | | 4.500 | | | 10/19/20 | | | 8,004 | |
| | 6,350,000 | | | | | State Street Corp | | 4.300 | | | 05/30/14 | | | 6,452 | |
| | 7,075,000 | | | | | State Street Corp | | 3.100 | | | 05/15/23 | | | 6,578 | |
| | 3,800,000 | | | | | Sumitomo Mitsui Banking Corp | | 2.500 | | | 07/19/18 | | | 3,817 | |
| | 5,700,000 | | | | | SunTrust Bank | | 2.750 | | | 05/01/23 | | | 5,168 | |
| | 54,367,424 | | | | | Tagua Leasing LLC | | 1.900 | | | 07/12/24 | | | 52,427 | |
| | 12,790,000 | | | g | | Temasek Financial I Ltd | | 2.375 | | | 01/23/23 | | | 11,509 | |
| | 7,650,000 | | | | | Toyota Motor Credit Corp | | 2.050 | | | 01/12/17 | | | 7,818 | |
| | 2,075,000 | | | g | | Turkiye Vakiflar Bankasi Tao | | 3.750 | | | 04/15/18 | | | 1,943 | |
| | 2,325,000 | | | | | UBS AG. | | 2.250 | | | 01/28/14 | | | 2,328 | |
| | 3,350,000 | | | g | | UBS AG. | | 1.875 | | | 01/23/15 | | | 3,397 | |
| | 9,125,000 | | | | | Unilever Capital Corp | | 2.200 | | | 03/06/19 | | | 9,113 | |
| | 2,000,000 | | | | | Unilever Capital Corp | | 4.250 | | | 02/10/21 | | | 2,145 | |
| | 3,150,000 | | | g | | Waha Aerospace BV | | 3.925 | | | 07/28/20 | | | 3,307 | |
| | | | | | | TOTAL DIVERSIFIED FINANCIALS | | | | | | | | 714,637 | |
| | | | | | | | | | | | | | | | |
| ENERGY - 2.9% | | | | | | | | | |
| | 7,950,000 | | | | | Anadarko Petroleum Corp | | 5.950 | | | 09/15/16 | | | 8,857 | |
| | 2,445,000 | | | | | Anadarko Petroleum Corp | | 6.950 | | | 06/15/19 | | | 2,910 | |
| | 3,650,000 | | | | | Apache Corp | | 1.750 | | | 04/15/17 | | | 3,657 | |
| | 12,170,000 | | | | | Apache Corp | | 4.750 | | | 04/15/43 | | | 11,804 | |
| | 3,750,000 | | | | | Ashland, Inc | | 3.875 | | | 04/15/18 | | | 3,797 | |
| | 13,650,000 | | | | | Ashland, Inc | | 4.750 | | | 08/15/22 | | | 12,967 | |
| | 3,415,000 | | | | | Baker Hughes, Inc | | 3.200 | | | 08/15/21 | | | 3,391 | |
| 16,500,000 | | | | | BP Capital Markets plc | | 1.375 | | | 05/10/18 | | | 16,014 | |
| | 6,250,000 | | | | | Chevron Corp | | 2.355 | | | 12/05/22 | | | 5,685 | |
| | 3,690,000 | | | | | Cimarex Energy Co | | 5.875 | | | 05/01/22 | | | 3,902 | |
| | 1,000,000 | | | | | Cloud Peak Energy Resources LLC | | 8.250 | | | 12/15/17 | | | 1,044 | |
| | 2,000,000 | | | | | Cloud Peak Energy Resources LLC | | 8.500 | | | 12/15/19 | | | 2,170 | |
| | 5,475,000 | | | | | Concho Resources, Inc | | 5.500 | | | 04/01/23 | | | 5,639 | |
| | 7,000,000 | | | | | ConocoPhillips | | 4.600 | | | 01/15/15 | | | 7,297 | |
| | 7,600,000 | | | | | ConocoPhillips | | 6.500 | | | 02/01/39 | | | 9,531 | |
| | 2,075,000 | | | | | Continental Resources, Inc | | 5.000 | | | 09/15/22 | | | 2,155 | |
| | 1,825,000 | | | | | Devon Energy Corp | | 1.875 | | | 05/15/17 | | | 1,838 | |
| | 6,800,000 | | | | | Devon Energy Corp | | 5.600 | | | 07/15/41 | | | 7,086 | |
| | 3,150,000 | | | | | Devon Energy Corp | | 4.750 | | | 05/15/42 | | | 2,921 | |
| | 1,905,000 | | | | | Ecopetrol S.A. | | 4.250 | | | 09/18/18 | | | 2,010 | |
| | 1,090,000 | | | | | Ecopetrol S.A. | | 5.875 | | | 09/18/23 | | | 1,150 | |
| | 4,500,000 | | | g | | Empresa Nacional del Petroleo | | 6.250 | | | 07/08/19 | | | 4,953 | |
COLLEGE RETIREMENT EQUITIES FUND - Bond Market Account
| | | | | | | | | | | MATURITY | | VALUE | |
| PRINCIPAL | | | | | ISSUER | | RATE | | DATE | | (000) | |
| $ | 3,250,000 | | | | | Enbridge Energy Partners LP | | 5.200 | % | | 03/15/20 | | $ | 3,489 | |
| | 4,000,000 | | | | | Enterprise Products Operating LLC | | 5.600 | | | 10/15/14 | | | 4,157 | |
| | 1,150,000 | | | | | Enterprise Products Operating LLC | | 5.000 | | | 03/01/15 | | | 1,205 | |
| | 7,500,000 | | | | | Enterprise Products Operating LLC | | 4.850 | | | 03/15/44 | | | 7,053 | |
| | 1,950,000 | | | | | EOG Resources, Inc | | 2.625 | | | 03/15/23 | | | 1,774 | |
| | 2,800,000 | | | g | | Gazprom Neft OAO | | 4.375 | | | 09/19/22 | | | 2,565 | |
| | 3,000,000 | | | g | | Gazprom OAO Via Gaz Capital S.A. | | 4.950 | | | 05/23/16 | | | 3,185 | |
| | 3,300,000 | | | g | | Gazprom OAO Via Gaz Capital S.A. | | 3.850 | | | 02/06/20 | | | 3,185 | |
| | 4,450,000 | | | g | | Gazprom OAO Via Gaz Capital S.A. | | 4.950 | | | 07/19/22 | | | 4,317 | |
| | 5,700,000 | | | | | Hess Corp | | 5.600 | | | 02/15/41 | | | 5,940 | |
| | 1,900,000 | | | g | | Indo Energy Finance II BV | | 6.375 | | | 01/24/23 | | | 1,563 | |
| | 4,430,000 | | | g | | KMG Finance Sub BV | | 6.375 | | | 04/09/21 | | | 4,807 | |
| | 5,530,000 | | | | | Marathon Petroleum Corp | | 3.500 | | | 03/01/16 | | | 5,775 | |
| | 1,000,000 | | | | | MarkWest Energy Partners LP | | 6.750 | | | 11/01/20 | | | 1,085 | |
| | 4,240,000 | | | | | MarkWest Energy Partners LP | | 5.500 | | | 02/15/23 | | | 4,272 | |
| | 2,525,000 | | | | | Newfield Exploration Co | | 5.625 | | | 07/01/24 | | | 2,512 | |
| | 7,350,000 | | | | | Noble Energy, Inc | | 5.250 | | | 11/15/43 | | | 7,344 | |
| | 2,475,000 | | | | | Noble Holding International Ltd | | 3.450 | | | 08/01/15 | | | 2,566 | |
| | 7,550,000 | | | | | Noble Holding International Ltd | | 4.900 | | | 08/01/20 | | | 7,968 | |
| | 8,000,000 | | | g | | Novatek OAO via Novatek Finance Ltd | | 4.422 | | | 12/13/22 | | | 7,360 | |
| | 8,500,000 | | | g | | Pacific Rubiales Energy Corp | | 5.375 | | | 01/26/19 | | | 8,564 | |
| | 800,000 | | | | | Pemex Project Funding Master Trust | | 5.750 | | | 03/01/18 | | | 892 | |
| | 3,040,000 | | | | | Pemex Project Funding Master Trust | | 6.625 | | | 06/15/35 | | | 3,200 | |
| | 2,000,000 | | | g | | Pertamina Persero PT | | 4.875 | | | 05/03/22 | | | 1,835 | |
| | 2,300,000 | | | g | | Pertamina Persero PT | | 4.300 | | | 05/20/23 | | | 2,001 | |
| | 3,000,000 | | | g | | Pertamina PT | | 5.250 | | | 05/23/21 | | | 2,888 | |
| | 1,850,000 | | | i | | Petrobras Global Finance BV | | 1.857 | | | 05/20/16 | | | 1,845 | |
| | 2,000,000 | | | i | | Petrobras Global Finance BV | | 2.384 | | | 01/15/19 | | | 1,960 | |
| | 810,000 | | | | | Petrobras Global Finance BV | | 4.375 | | | 05/20/23 | | | 722 | |
| | 2,080,000 | | | | | Petrobras International Finance Co | | 3.875 | | | 01/27/16 | | | 2,141 | |
| | 6,050,000 | | | | | Petrobras International Finance Co | | 3.500 | | | 02/06/17 | | | 6,105 | |
| | 4,500,000 | | | | | Petrobras International Finance Co | | 7.875 | | | 03/15/19 | | | 5,097 | |
| | 2,000,000 | | | | | Petrobras International Finance Co | | 6.875 | | | 01/20/40 | | | 1,891 | |
| | 4,350,000 | | | | | Petroleos Mexicanos | | 3.500 | | | 07/18/18 | | | 4,464 | |
| | 2,900,000 | | | | | Petroleos Mexicanos | | 8.000 | | | 05/03/19 | | | 3,509 | |
| | 2,500,000 | | | | | Petroleos Mexicanos | | 6.000 | | | 03/05/20 | | | 2,778 | |
| | 1,500,000 | | | | | Petroleos Mexicanos | | 4.875 | | | 01/24/22 | | | 1,541 | |
| | 18,000,000 | | | | | Petroleos Mexicanos | | 1.950 | | | 12/20/22 | | | 17,692 | |
| 9,630,000 | | | | | Petroleos Mexicanos | | 2.000 | | | 12/20/22 | | | 9,487 | |
| | 1,500,000 | | | | | Petroleos Mexicanos | | 3.500 | | | 01/30/23 | | | 1,374 | |
| | 6,150,000 | | | | | Petroleos Mexicanos | | 6.500 | | | 06/02/41 | | | 6,427 | |
| | 2,250,000 | | | | | Petroleos Mexicanos | | 5.500 | | | 06/27/44 | | | 2,053 | |
| | 3,960,000 | | | g | | Petroleum Co of Trinidad & Tobago Ltd | | 9.750 | | | 08/14/19 | | | 4,960 | |
| | 7,400,000 | | | | | Phillips 66 | | 1.950 | | | 03/05/15 | | | 7,503 | |
| | 2,674,000 | | | | | Precision Drilling Trust | | 6.625 | | | 11/15/20 | | | 2,854 | |
| | 2,800,000 | | | g | | PTT Exploration & Production PCL | | 3.707 | | | 09/16/18 | | | 2,844 | |
| | 3,000,000 | | | g | | PTTEP Canada International Finance Ltd | | 5.692 | | | 04/05/21 | | | 3,197 | |
| | 3,335,000 | | | | | Range Resources Corp | | 5.000 | | | 08/15/22 | | | 3,277 | |
COLLEGE RETIREMENT EQUITIES FUND - Bond Market Account
| | | | | | | | | | | MATURITY | | VALUE | |
| PRINCIPAL | | | | | ISSUER | | RATE | | DATE | | (000) | |
| $ | 3,000,000 | | | g | | Rosneft Oil Co via Rosneft International Finance Ltd | | 4.199 | % | | 03/06/22 | | $ | 2,753 | |
| | 7,925,000 | | | g | | Schlumberger Investment S.A. | | 2.400 | | | 08/01/22 | | | 7,263 | |
| | 7,620,000 | | | | | Shell International Finance BV | | 4.300 | | | 09/22/19 | | | 8,352 | |
| | 4,650,000 | | | | | Shell International Finance BV | | 4.550 | | | 08/12/43 | | | 4,535 | |
| | 2,800,000 | | | | | Statoil ASA | | 2.900 | | | 10/15/14 | | | 2,856 | |
| | 2,075,000 | | | | | Statoil ASA | | 1.200 | | | 01/17/18 | | | 2,025 | |
| | 5,300,000 | | | | | Statoil ASA | | 2.450 | | | 01/17/23 | | | 4,831 | |
| | 4,025,000 | | | | | Total Capital Canada Ltd | | 1.450 | | | 01/15/18 | | | 3,979 | |
| | 6,100,000 | | | | | Total Capital International S.A. | | 1.500 | | | 02/17/17 | | | 6,111 | |
| | 3,400,000 | | | | | TransCanada Pipelines Ltd | | 5.850 | | | 03/15/36 | | | 3,701 | |
| | 2,750,000 | | | i | | TransCanada Pipelines Ltd | | 6.350 | | | 05/15/67 | | | 2,825 | |
| | 5,025,000 | | | | | Vale Overseas Ltd | | 4.375 | | | 01/11/22 | | | 4,882 | |
| | 2,760,000 | | | | | Vale Overseas Ltd | | 6.875 | | | 11/21/36 | | | 2,850 | |
| | 3,375,000 | | | | | Valero Energy Corp | | 4.500 | | | 02/01/15 | | | 3,509 | |
| | | | | | | TOTAL ENERGY | | | | | | | | 376,473 | |
| | | | | | | | | | | | | | | | |
| FOOD & STAPLES RETAILING - 0.2% | | | | | | | | | |
| | 5,690,000 | | | | | CVS Caremark Corp | | 3.250 | | | 05/18/15 | | | 5,881 | |
| | 7,625,000 | | | | | CVS Caremark Corp | | 4.000 | | | 12/05/23 | | | 7,609 | |
| | 4,125,000 | | | | | CVS Caremark Corp | | 5.300 | | | 12/05/43 | | | 4,266 | |
| | 7,300,000 | | | | | Ingles Markets, Inc | | 5.750 | | | 06/15/23 | | | 7,154 | |
| | 880,000 | | | | | Stater Bros Holdings, Inc | | 7.750 | | | 04/15/15 | | | 882 | |
| | 900,000 | | | | | Stater Bros Holdings, Inc | | 7.375 | | | 11/15/18 | | | 952 | |
| | | | | | | TOTAL FOOD & STAPLES RETAILING | | | | | | | | 26,744 | |
| | | | | | | | | | | | | | | | |
| FOOD, BEVERAGE & TOBACCO - 1.0% | | | | | | | | | |
| | 6,300,000 | | | | | Anheuser-Busch InBev Worldwide, Inc | | 2.875 | | | 02/15/16 | | | 6,558 | |
| | 10,575,000 | | | | | Anheuser-Busch InBev Worldwide, Inc | | 1.375 | | | 07/15/17 | | | 10,553 | |
| | 24,650,000 | | | | | Anheuser-Busch InBev Worldwide, Inc | | 2.500 | | | 07/15/22 | | | 22,800 | |
| | 5,125,000 | | | g | | BRF-Brasil Foods S.A. | | 5.875 | | | 06/06/22 | | | 5,115 | |
| | 3,270,000 | | | g | | BRF-Brasil Foods S.A. | | 3.950 | | | 05/22/23 | | | 2,829 | |
| | 1,900,000 | | | | | Campbell Soup Co | | 2.500 | | | 08/02/22 | | | 1,676 | |
| | 22,100,000 | | | | | Coca-Cola Co | | 3.200 | | | 11/01/23 | | | 21,256 | |
| | 3,250,000 | | | | | ConAgra Foods, Inc | | 1.300 | | | 01/25/16 | | | 3,256 | |
| | 1,300,000 | | | g | | Corp Lindley S.A. | | 6.750 | | | 11/23/21 | | | 1,372 | |
| | 9,400,000 | | | | | Diageo Capital plc | | 2.625 | | | 04/29/23 | | | 8,570 | |
| | 5,525,000 | | | g | | Embotelladora Andina S.A. | | 5.000 | | | 10/01/23 | | | 5,543 | |
| | 3,350,000 | | | | | Fomento Economico Mexicano SAB de C.V. | | 2.875 | | | 05/10/23 | | | 2,960 | |
| | 4,080,000 | | | | | General Mills, Inc | | 5.200 | | | 03/17/15 | | | 4,302 | |
| | 5,525,000 | | | g | | Grupo Bimbo SAB de C.V. | | 4.500 | | | 01/25/22 | | | 5,479 | |
| | 8,105,000 | | | | | Kraft Foods, Inc | | 6.500 | | | 02/09/40 | | | 9,685 | |
| | 625,000 | | | | | PepsiAmericas, Inc | | 4.375 | | | 02/15/14 | | | 628 | |
| | 680,000 | | | | | PepsiCo, Inc | | 7.900 | | | 11/01/18 | | | 850 | |
| 6,850,000 | | | g | | Pernod Ricard S.A. | | 4.250 | | | 07/15/22 | | | 6,833 | |
| | 2,000,000 | | | g | | Pernod-Ricard S.A. | | 2.950 | | | 01/15/17 | | | 2,065 | |
| | 1,600,000 | | | | | Philip Morris International, Inc | | 6.375 | | | 05/16/38 | | | 1,896 | |
| | | | | | | TOTAL FOOD, BEVERAGE & TOBACCO | | | | | | | | 124,226 | |
COLLEGE RETIREMENT EQUITIES FUND - Bond Market Account
| | | | | | | | | | | MATURITY | | VALUE | |
| PRINCIPAL | | | | | ISSUER | | RATE | | DATE | | (000) | |
| HEALTH CARE EQUIPMENT & SERVICES - 0.8% | | | | | | | | | |
| $ | 7,290,000 | | | | | Baxter International, Inc | | 3.200 | % | | 06/15/23 | | $ | 6,964 | |
| | 3,900,000 | | | | | Becton Dickinson & Co | | 1.750 | | | 11/08/16 | | | 3,973 | |
| | 2,325,000 | | | | | CHS/Community Health Systems | | 5.125 | | | 08/15/18 | | | 2,401 | |
| | 7,150,000 | | | | | Covidien International Finance S.A. | | 1.350 | | | 05/29/15 | | | 7,202 | |
| | 3,800,000 | | | | | Covidien International Finance S.A. | | 3.200 | | | 06/15/22 | | | 3,664 | |
| | 4,475,000 | | | | | Edwards Lifesciences Corp | | 2.875 | | | 10/15/18 | | | 4,449 | |
| | 6,500,000 | | | | | Express Scripts Holding Co | | 2.100 | | | 02/12/15 | | | 6,594 | |
| | 6,850,000 | | | | | Express Scripts Holding Co | | 3.900 | | | 02/15/22 | | | 6,857 | |
| | 4,500,000 | | | g | | Fresenius Medical Care Capital Trust | | 5.750 | | | 02/15/21 | | | 4,770 | |
| | 4,000,000 | | | g | | Fresenius Medical Care II | | 5.625 | | | 07/31/19 | | | 4,320 | |
| | 4,560,000 | | | | | HCA, Inc | | 6.500 | | | 02/15/20 | | | 5,010 | |
| | 9,575,000 | | | | | HCA, Inc | | 5.875 | | | 03/15/22 | | | 9,886 | |
| | 5,000,000 | | | | | HCA, Inc | | 5.875 | | | 05/01/23 | | | 4,938 | |
| | 3,500,000 | | | g | | Mallinckrodt International Finance S.A. | | 3.500 | | | 04/15/18 | | | 3,433 | |
| | 1,695,000 | | | | | Thermo Fisher Scientific, Inc | | 3.200 | | | 05/01/15 | | | 1,750 | |
| | 1,750,000 | | | | | Thermo Fisher Scientific, Inc | | 5.000 | | | 06/01/15 | | | 1,853 | |
| | 6,125,000 | | | | | Thermo Fisher Scientific, Inc | | 2.250 | | | 08/15/16 | | | 6,264 | |
| | 2,700,000 | | | | | Thermo Fisher Scientific, Inc | | 2.400 | | | 02/01/19 | | | 2,675 | |
| | 3,625,000 | | | | | Thermo Fisher Scientific, Inc | | 4.150 | | | 02/01/24 | | | 3,591 | |
| | 7,125,000 | | | | | Thermo Fisher Scientific, Inc | | 5.300 | | | 02/01/44 | | | 7,205 | |
| | | | | | | TOTAL HEALTH CARE EQUIPMENT & SERVICES | | | | | | 97,799 | |
| | | | | | | | | | | | | | | | |
| HOUSEHOLD & PERSONAL PRODUCTS - 0.1% | | | | | | | | | |
| | 7,175,000 | | | | | Clorox Co | | 3.800 | | | 11/15/21 | | | 7,221 | |
| | 2,620,000 | | | | | Colgate-Palmolive Co | | 2.300 | | | 05/03/22 | | | 2,402 | |
| | 4,525,000 | | | | | Ecolab, Inc | | 1.450 | | | 12/08/17 | | | 4,422 | |
| | | | | | | TOTAL HOUSEHOLD & PERSONAL PRODUCTS | | | | | | 14,045 | |
| | | | | | | | | | | | | | | | |
| INSURANCE - 1.8% | | | | | | | | | |
| | 3,825,000 | | | | | ACE INA Holdings, Inc | | 5.875 | | | 06/15/14 | | | 3,919 | |
| | 6,560,000 | | | | | Aetna, Inc | | 6.500 | | | 09/15/18 | | | 7,727 | |
| | 1,925,000 | | | | | Aetna, Inc | | 6.625 | | | 06/15/36 | | | 2,302 | |
| | 6,200,000 | | | | | Allstate Corp | | 3.150 | | | 06/15/23 | | | 5,880 | |
| | 6,200,000 | | | | | Allstate Corp | | 4.500 | | | 06/15/43 | | | 5,866 | |
| | 8,900,000 | | | | | Berkshire Hathaway Finance Corp | | 1.300 | | | 05/15/18 | | | 8,697 | |
| | 3,750,000 | | | | | Chubb Corp | | 6.000 | | | 05/11/37 | | | 4,380 | |
| | 1,390,000 | | | | | CIGNA Corp | | 5.125 | | | 06/15/20 | | | 1,542 | |
| | 6,900,000 | | | | | CIGNA Corp | | 4.500 | | | 03/15/21 | | | 7,333 | |
| | 25,500,000 | | | g | | Five Corners Funding Trust | | 4.419 | | | 11/15/23 | | | 25,136 | |
| | 7,600,000 | | | | | Hartford Financial Services Group, Inc | | 4.000 | | | 03/30/15 | | | 7,896 | |
| | 4,500,000 | | | | | Hartford Financial Services Group, Inc | | 4.000 | | | 10/15/17 | | | 4,786 | |
| | 2,800,000 | | | | | Lincoln National Corp | | 7.000 | | | 06/15/40 | | | 3,508 | |
| | 5,250,000 | | | g | | MetLife Institutional Funding II | | 1.625 | | | 04/02/15 | | | 5,309 | |
| | 7,675,000 | | | | | MetLife, Inc | | 6.750 | | | 06/01/16 | | | 8,727 | |
| | 2,000,000 | | | | | MetLife, Inc | | 4.368 | | | 09/15/23 | | | 2,042 | |
| | 4,500,000 | | | | | MetLife, Inc | | 5.700 | | | 06/15/35 | | | 4,915 | |
| | 6,500,000 | | | | | MetLife, Inc | | 4.125 | | | 08/13/42 | | | 5,652 | |
COLLEGE RETIREMENT EQUITIES FUND - Bond Market Account
| | | | | | | | | | | MATURITY | | VALUE | |
| PRINCIPAL | | | | | ISSUER | | RATE | | DATE | | (000) | |
| $ | 9,500,000 | | | | | MetLife, Inc | | 4.875 | % | | 11/13/43 | | $ | 9,324 | |
| | 2,825,000 | | | | | Principal Financial Group, Inc | | 1.850 | | | 11/15/17 | | | 2,799 | |
| | 5,000,000 | | | | | Progressive Corp | | 3.750 | | | 08/23/21 | | | 5,098 | |
| | 2,000,000 | | | | | Prudential Financial, Inc | | 3.875 | | | 01/14/15 | | | 2,067 | |
| | 4,200,000 | | | | | Prudential Financial, Inc | | 2.300 | | | 08/15/18 | | | 4,175 | |
| | 8,050,000 | | | | | Prudential Financial, Inc | | 7.375 | | | 06/15/19 | | | 9,883 | |
| | 8,000,000 | | | | | Prudential Financial, Inc | | 5.400 | | | 06/13/35 | | | 8,263 | |
| | 5,000,000 | | | | | Prudential Financial, Inc | | 6.625 | | | 06/21/40 | | | 6,063 | |
| | 7,775,000 | | | | | Prudential Financial, Inc | | 5.100 | | | 08/15/43 | | | 7,722 | |
| | 8,650,000 | | | i | | Prudential Financial, Inc | | 5.200 | | | 03/15/44 | | | 8,369 | |
| | 3,000,000 | | | g | | Prudential Funding LLC | | 6.750 | | | 09/15/23 | | | 3,603 | |
| | 2,425,000 | | | g | | Swiss Re Treasury US Corp | | 2.875 | | | 12/06/22 | | | 2,233 | |
| | 6,100,000 | | | g | | Swiss Re Treasury US Corp | | 4.250 | | | 12/06/42 | | | 5,242 | |
| | 4,250,000 | | | | | Travelers Cos, Inc | | 5.800 | | | 05/15/18 | | | 4,896 | |
| | 7,875,000 | | | | | UnitedHealth Group, Inc | | 0.850 | | | 10/15/15 | | | 7,906 | |
| | 6,000,000 | | | | | UnitedHealth Group, Inc | | 1.400 | | | 10/15/17 | | | 5,924 | |
| | 7,450,000 | | | | | UnitedHealth Group, Inc | | 3.950 | | | 10/15/42 | | | 6,318 | |
| | 6,750,000 | | | | | WellPoint, Inc | | 3.125 | | | 05/15/22 | | | 6,331 | |
| | 7,850,000 | | | | | WellPoint, Inc | | 4.625 | | | 05/15/42 | | | 7,255 | |
| | 7,000,000 | | | | | Willis Group Holdings plc | | 4.125 | | | 03/15/16 | | | 7,328 | |
| | 2,400,000 | | | | | WR Berkley Corp | | 5.375 | | | 09/15/20 | | | 2,584 | |
| | | | | | | TOTAL INSURANCE | | | | | | | | 239,000 | |
| | | | | | | | | | | | | | | | |
| MATERIALS - 1.6% | | | | | | | | | |
| | 6,630,000 | | | | | Air Products & Chemicals, Inc | | 4.375 | | | 08/21/19 | | | 7,175 | |
| | 1,125,000 | | | | | Airgas, Inc | | 4.500 | | | 09/15/14 | | | 1,154 | |
| | 1,860,000 | | | | | ArcelorMittal | | 4.250 | | | 08/05/15 | | | 1,925 | |
| | 3,500,000 | | | | | ArcelorMittal | | 5.000 | | | 02/25/17 | | | 3,754 | |
| | 355,000 | | | | | Ball Corp | | 7.375 | | | 09/01/19 | | | 383 | |
| | 4,000,000 | | | | | Ball Corp | | 5.750 | | | 05/15/21 | | | 4,210 | |
| | 1,365,000 | | | | | Ball Corp | | 5.000 | | | 03/15/22 | | | 1,351 | |
| | 8,960,000 | | | | | Ball Corp | | 4.000 | | | 11/15/23 | | | 8,019 | |
| | 4,050,000 | | | | | Barrick Gold Corp | | 4.100 | | | 05/01/23 | | | 3,661 | |
| | 7,175,000 | | | | | Barrick North America Finance LLC | | 4.400 | | | 05/30/21 | | | 6,908 | |
| | 5,000,000 | | | g | | Braskem Finance Ltd | | 5.750 | | | 04/15/21 | | | 4,900 | |
| | 3,000,000 | | | | | Celanese US Holdings LLC | | 6.625 | | | 10/15/18 | | | 3,202 | |
| | 3,175,000 | | | | | CF Industries, Inc | | 7.125 | | | 05/01/20 | | | 3,722 | |
| | 3,550,000 | | | | | Corning, Inc | | 1.450 | | | 11/15/17 | | | 3,499 | |
| | 2,400,000 | | | g | | Corp Nacional del Cobre de Chile-CODELCO | | 3.750 | | | 11/04/20 | | | 2,399 | |
| | 5,100,000 | | | g | | Corp Nacional del Cobre de Chile-CODELCO | | 3.875 | | | 11/03/21 | | | 4,988 | |
| | 2,900,000 | | | g | | Corp Nacional del Cobre de Chile-CODELCO | | 3.000 | | | 07/17/22 | | | 2,609 | |
| | 9,270,000 | | | | | Crown Americas LLC | | 6.250 | | | 02/01/21 | | | 10,058 | |
| | 5,500,000 | | | | | E.I. du Pont de Nemours & Co | | 3.250 | | | 01/15/15 | | | 5,658 | |
| | 6,000,000 | | | | | E.I. du Pont de Nemours & Co | | 4.625 | | | 01/15/20 | | | 6,550 | |
| | 1,000,000 | | | | | Eastman Chemical Co | | 5.500 | | | 11/15/19 | | | 1,102 | |
| | 12,625,000 | | | | | Freeport-McMoRan Copper & Gold, Inc | | 2.375 | | | 03/15/18 | | | 12,594 | |
| | 2,850,000 | | | g | | Fresnillo plc | | 5.500 | | | 11/13/23 | | | 2,764 | |
| | 12,500,000 | | | g | | Glencore Funding LLC | | 2.500 | | | 01/15/19 | | | 12,104 | |
COLLEGE RETIREMENT EQUITIES FUND - Bond Market Account
| | | | | | | | | | | MATURITY | | VALUE | |
| PRINCIPAL | | | | | ISSUER | | RATE | | DATE | | (000) | |
| $ | 1,400,000 | | | | | Greif, Inc | | 7.750 | % | | 08/01/19 | | $ | 1,589 | |
| | 13,016,000 | | | | | International Paper Co | | 4.750 | | | 02/15/22 | | | 13,646 | |
| | 4,250,000 | | | | | International Paper Co | | 7.300 | | | 11/15/39 | | | 5,248 | |
| | 3,000,000 | | | | | LyondellBasell Industries NV | | 5.000 | | | 04/15/19 | | | 3,332 | |
| | 7,500,000 | | | | | Rio Tinto Finance USA Ltd | | 2.250 | | | 09/20/16 | | | 7,719 | |
| 9,100,000 | | | | | Rio Tinto Finance USA plc | | 2.250 | | | 12/14/18 | | | 9,055 | |
| | 9,525,000 | | | | | Rio Tinto Finance USA plc | | 2.875 | | | 08/21/22 | | | 8,878 | |
| | 5,000,000 | | | | | Rock Tenn Co | | 3.500 | | | 03/01/20 | | | 4,918 | |
| | 3,000,000 | | | | | Rock Tenn Co | | 4.000 | | | 03/01/23 | | | 2,865 | |
| | 12,475,000 | | | | | Sherwin-Williams Co | | 1.350 | | | 12/15/17 | | | 12,147 | |
| | 4,625,000 | | | | | Teck Resources Ltd | | 2.500 | | | 02/01/18 | | | 4,653 | |
| | 9,950,000 | | | | | Teck Resources Ltd | | 3.750 | | | 02/01/23 | | | 9,275 | |
| | 1,940,000 | | | | | Teck Resources Ltd | | 6.000 | | | 08/15/40 | | | 1,854 | |
| | 3,950,000 | | | | | Teck Resources Ltd | | 5.200 | | | 03/01/42 | | | 3,486 | |
| | 4,550,000 | | | g | | Turkiye Sise ve Cam Fabrikalari AS. | | 4.250 | | | 05/09/20 | | | 4,004 | |
| | | | | | | TOTAL MATERIALS | | | | | | | | 207,358 | |
| | | | | | | | | | | | | | | | |
| MEDIA - 1.6% | | | | | | | | | |
| | 1,000,000 | | | | | Cinemark USA, Inc | | 5.125 | | | 12/15/22 | | | 967 | |
| | 4,275,000 | | | | | Cinemark USA, Inc | | 4.875 | | | 06/01/23 | | | 4,019 | |
| | 33,000,000 | | | | | Comcast Corp | | 4.250 | | | 01/15/33 | | | 30,654 | |
| | 7,000,000 | | | | | DIRECTV Holdings LLC | | 2.400 | | | 03/15/17 | | | 7,126 | |
| | 6,850,000 | | | | | DIRECTV Holdings LLC | | 3.800 | | | 03/15/22 | | | 6,580 | |
| | 8,725,000 | | | | | Discovery Communications LLC | | 3.300 | | | 05/15/22 | | | 8,261 | |
| | 6,300,000 | | | | | Discovery Communications LLC | | 4.875 | | | 04/01/43 | | | 5,812 | |
| | 3,250,000 | | | | | DISH DBS Corp | | 4.250 | | | 04/01/18 | | | 3,315 | |
| | 4,250,000 | | | | | DISH DBS Corp | | 5.125 | | | 05/01/20 | | | 4,261 | |
| | 2,050,000 | | | | | DISH DBS Corp | | 5.000 | | | 03/15/23 | | | 1,912 | |
| | 11,500,000 | | | | | Grupo Televisa S.A. | | 6.000 | | | 05/15/18 | | | 12,809 | |
| | 2,160,000 | | | | | Lamar Media Corp | | 7.875 | | | 04/15/18 | | | 2,282 | |
| | 1,850,000 | | | | | Lamar Media Corp | | 5.875 | | | 02/01/22 | | | 1,896 | |
| | 10,000,000 | | | | | Lamar Media Corp | | 5.000 | | | 05/01/23 | | | 9,500 | |
| | 7,250,000 | | | g | | NBC Universal Enterprise, Inc | | 1.662 | | | 04/15/18 | | | 7,081 | |
| | 7,700,000 | | | g | | NBC Universal Enterprise, Inc | | 1.974 | | | 04/15/19 | | | 7,532 | |
| | 10,350,000 | | | | | NBC Universal Media LLC | | 2.875 | | | 01/15/23 | | | 9,582 | |
| | 2,105,000 | | | | | News America, Inc | | 7.625 | | | 11/30/28 | | | 2,611 | |
| | 1,578,000 | | | | | News America, Inc | | 6.550 | | | 03/15/33 | | | 1,794 | |
| | 3,575,000 | | | | | News America, Inc | | 6.650 | | | 11/15/37 | | | 4,173 | |
| | 3,800,000 | | | | | News America, Inc | | 6.900 | | | 08/15/39 | | | 4,529 | |
| | 3,315,000 | | | | | Nielsen Finance LLC | | 7.750 | | | 10/15/18 | | | 3,580 | |
| | 2,800,000 | | | | | Nielsen Finance LLC | | 4.500 | | | 10/01/20 | | | 2,723 | |
| | 11,850,000 | | | | | Time Warner Cable, Inc | | 8.250 | | | 04/01/19 | | | 13,882 | |
| | 4,830,000 | | | | | Time Warner Cable, Inc | | 4.500 | | | 09/15/42 | | | 3,659 | |
| | 3,000,000 | | | | | Time Warner, Inc | | 3.150 | | | 07/15/15 | | | 3,108 | |
| | 3,825,000 | | | | | Time Warner, Inc | | 6.500 | | | 11/15/36 | | | 4,322 | |
| | 10,525,000 | | | | | Time Warner, Inc | | 4.900 | | | 06/15/42 | | | 9,991 | |
COLLEGE RETIREMENT EQUITIES FUND - Bond Market Account
| | | | | | | | | | | MATURITY | | VALUE | |
| PRINCIPAL | | | | | ISSUER | | RATE | | DATE | | (000) | |
| $ | 7,000,000 | | | g | | Univision Communications, Inc | | 5.125 | % | | 05/15/23 | | $ | 6,991 | |
| | 4,850,000 | | | | | Viacom, Inc | | 1.250 | | | 02/27/15 | | | 4,874 | |
| | 5,400,000 | | | | | Viacom, Inc | | 2.500 | | | 12/15/16 | | | 5,585 | |
| | 3,000,000 | | | | | Viacom, Inc | | 3.500 | | | 04/01/17 | | | 3,171 | |
| | 7,375,000 | | | | | Viacom, Inc | | 5.850 | | | 09/01/43 | | | 7,753 | |
| | | | | | | TOTAL MEDIA | | | | | | | | 206,335 | |
| | | | | | | | | | | | | | | | |
| PHARMACEUTICALS, BIOTECHNOLOGY & LIFE SCIENCES - 0.3% | | | | | | | |
| | 3,140,000 | | | | | Life Technologies Corp | | 3.500 | | | 01/15/16 | | | 3,271 | |
| | 4,115,000 | | | | | Mead Johnson Nutrition Co | | 4.900 | | | 11/01/19 | | | 4,487 | |
| | 2,750,000 | | | | | Mead Johnson Nutrition Co | | 5.900 | | | 11/01/39 | | | 2,962 | |
| | 7,400,000 | | | | | Mylan, Inc | | 2.550 | | | 03/28/19 | | | 7,326 | |
| 3,500,000 | | | g | | Mylan, Inc | | 7.875 | | | 07/15/20 | | | 3,960 | |
| | 1,750,000 | | | | | NBTY, Inc | | 9.000 | | | 10/01/18 | | | 1,919 | |
| | 3,450,000 | | | | | Watson Pharmaceuticals, Inc | | 1.875 | | | 10/01/17 | | | 3,414 | |
| | 5,700,000 | | | | | Watson Pharmaceuticals, Inc | | 3.250 | | | 10/01/22 | | | 5,317 | |
| | | | | | | TOTAL PHARMACEUTICALS, BIOTECHNOLOGY & LIFE SCIENCES | | | 32,656 | |
| | | | | | | | | | | | | | | | |
| REAL ESTATE - 0.9% | | | | | | | | | |
| | 2,310,000 | | | | | AMB Property LP | | 4.500 | | | 08/15/17 | | | 2,495 | |
| | 3,750,000 | | | | | Boston Properties LP | | 3.125 | | | 09/01/23 | | | 3,425 | |
| | 2,000,000 | | | | | Brandywine Operating Partnership LP | | 5.400 | | | 11/01/14 | | | 2,073 | |
| | 3,965,000 | | | | | Camden Property Trust | | 4.625 | | | 06/15/21 | | | 4,156 | |
| | 3,000,000 | | | | | Camden Property Trust | | 2.950 | | | 12/15/22 | | | 2,711 | |
| | 5,175,000 | | | g | | DCT Industrial Operating Partnership LP | | 4.500 | | | 10/15/23 | | | 5,029 | |
| | 6,800,000 | | | | | Developers Diversified Realty Corp | | 4.750 | | | 04/15/18 | | | 7,335 | |
| | 3,460,000 | | | | | Developers Diversified Realty Corp | | 7.875 | | | 09/01/20 | | | 4,274 | |
| | 255,000 | | | | | Federal Realty Investment Trust | | 5.650 | | | 06/01/16 | | | 281 | |
| | 700,000 | | | | | Federal Realty Investment Trust | | 5.900 | | | 04/01/20 | | | 804 | |
| | 2,225,000 | | | | | Federal Realty Investment Trust | | 3.000 | | | 08/01/22 | | | 2,079 | |
| | 10,700,000 | | | | | Federal Realty Investment Trust | | 2.750 | | | 06/01/23 | | | 9,616 | |
| | 2,775,000 | | | | | Healthcare Realty Trust, Inc | | 5.750 | | | 01/15/21 | | | 3,016 | |
| | 1,625,000 | | | | | Healthcare Realty Trust, Inc | | 3.750 | | | 04/15/23 | | | 1,503 | |
| | 3,550,000 | | | | | Healthcare Trust of America Holdings LP | | 3.700 | | | 04/15/23 | | | 3,271 | |
| | 1,600,000 | | | | | Highwoods Properties, Inc | | 5.850 | | | 03/15/17 | | | 1,762 | |
| | 5,000,000 | | | | | Highwoods Realty LP | | 3.625 | | | 01/15/23 | | | 4,571 | |
| | 9,205,000 | | | | | Kilroy Realty LP | | 3.800 | | | 01/15/23 | | | 8,584 | |
| | 6,400,000 | | | | | Liberty Property LP | | 4.125 | | | 06/15/22 | | | 6,299 | |
| | 3,600,000 | | | | | Mid-America Apartments LP | | 4.300 | | | 10/15/23 | | | 3,500 | |
| | 4,000,000 | | | | | National Retail Properties, Inc | | 5.500 | | | 07/15/21 | | | 4,348 | |
| | 5,425,000 | | | | | National Retail Properties, Inc | | 3.300 | | | 04/15/23 | | | 4,925 | |
| | 2,325,000 | | | | | Regency Centers LP | | 5.250 | | | 08/01/15 | | | 2,469 | |
| | 225,000 | | | | | Regency Centers LP | | 5.875 | | | 06/15/17 | | | 251 | |
| | 800,000 | | | | | Simon Property Group LP | | 5.250 | | | 12/01/16 | | | 886 | |
| | 4,150,000 | | | | | Simon Property Group LP | | 2.800 | | | 01/30/17 | | | 4,292 | |
| | 3,040,000 | | | | | Simon Property Group LP | | 10.350 | | | 04/01/19 | | | 4,114 | |
COLLEGE RETIREMENT EQUITIES FUND - Bond Market Account
| | | | | | | | | | | MATURITY | | VALUE | |
| PRINCIPAL | | | | | ISSUER | | RATE | | DATE | | (000) | |
| $ | 1,360,000 | | | | | Ventas Realty LP | | 3.125 | % | | 11/30/15 | | $ | 1,414 | |
| | 8,050,000 | | | | | Ventas Realty LP | | 2.000 | | | 02/15/18 | | | 7,913 | |
| | 3,375,000 | | | | | Ventas Realty LP | | 2.700 | | | 04/01/20 | | | 3,227 | |
| | 2,175,000 | | | | | Ventas Realty LP | | 3.250 | | | 08/15/22 | | | 2,015 | |
| | 4,800,000 | | | | | Weingarten Realty Investors | | 3.500 | | | 04/15/23 | | | 4,413 | |
| | | | | | | TOTAL REAL ESTATE | | | | | | | | 117,051 | |
| | | | | | | | | | | | | | | | |
| RETAILING - 0.6% | | | | | | | | | |
| | 6,600,000 | | | | | AmeriGas Finance LLC | | 3.750 | | | 05/01/21 | | | 6,204 | |
| | 3,000,000 | | | | | AmeriGas Partners LP | | 6.250 | | | 08/20/19 | | | 3,225 | |
| | 2,500,000 | | | | | AutoNation, Inc | | 5.500 | | | 02/01/20 | | | 2,685 | |
| | 8,500,000 | | | g | | Golden Eagle Retail Group Ltd | | 4.625 | | | 05/21/23 | | | 7,261 | |
| | 6,125,000 | | | | | Home Depot, Inc | | 2.250 | | | 09/10/18 | | | 6,209 | |
| | 3,150,000 | | | | | Limited Brands, Inc | | 7.000 | | | 05/01/20 | | | 3,536 | |
| | 8,105,000 | | | | | Limited Brands, Inc | | 5.625 | | | 02/15/22 | | | 8,287 | |
| | 15,225,000 | | | | | Macy’s Retail Holdings, Inc | | 2.875 | | | 02/15/23 | | | 13,779 | |
| | 8,315,000 | | | | | O’Reilly Automotive, Inc | | 4.625 | | | 09/15/21 | | | 8,579 | |
| | 4,550,000 | | | | | O’Reilly Automotive, Inc | | 3.800 | | | 09/01/22 | | | 4,391 | |
| | 2,000,000 | | | g | | QVC, Inc | | 7.500 | | | 10/01/19 | | | 2,156 | |
| 2,475,000 | | | | | QVC, Inc | | 5.125 | | | 07/02/22 | | | 2,448 | |
| | 4,400,000 | | | | | QVC, Inc | | 4.375 | | | 03/15/23 | | | 4,114 | |
| | 1,275,000 | | | | | Sonic Automotive, Inc | | 5.000 | | | 05/15/23 | | | 1,195 | |
| | 875,000 | | | | | Wal-Mart Stores, Inc | | 3.000 | | | 02/03/14 | | | 877 | |
| | 5,000,000 | | | | | Wal-Mart Stores, Inc | | 2.550 | | | 04/11/23 | | | 4,568 | |
| | 3,900,000 | | | g | | WEX, Inc | | 4.750 | | | 02/01/23 | | | 3,588 | |
| | | | | | | TOTAL RETAILING | | | | | | | | 83,102 | |
| | | | | | | | | | | | | | | | |
| SOFTWARE & SERVICES - 0.2% | | | | | | | | | |
| | 3,500,000 | | | g | | Activision Blizzard, Inc | | 5.625 | | | 09/15/21 | | | 3,622 | |
| | 2,075,000 | | | | | Equinix, Inc | | 4.875 | | | 04/01/20 | | | 2,065 | |
| | 11,500,000 | | | | | Fidelity National Information Services, Inc | | 5.000 | | | 03/15/22 | | | 11,744 | |
| | 3,075,000 | | | | | NCR Corp | | 4.625 | | | 02/15/21 | | | 2,944 | |
| | 525,000 | | | g | | NCR Escrow Corp | | 5.875 | | | 12/15/21 | | | 535 | |
| | 3,925,000 | | | | | Oracle Corp | | 3.750 | | | 07/08/14 | | | 3,993 | |
| | 1,000,000 | | | | | SunGard Data Systems, Inc | | 7.375 | | | 11/15/18 | | | 1,059 | |
| | | | | | | TOTAL SOFTWARE & SERVICES | | | | | | | | 25,962 | |
| | | | | | | | | | | | | | | | |
| TECHNOLOGY HARDWARE & EQUIPMENT - 0.9% | | | | | | | | | |
| | 3,575,000 | | | | | American Tower Corp | | 4.700 | | | 03/15/22 | | | 3,573 | |
| | 4,000,000 | | | | | Amphenol Corp | | 4.750 | | | 11/15/14 | | | 4,133 | |
| | 1,000,000 | | | | | Brocade Communications Systems, Inc | | 6.875 | | | 01/15/20 | | | 1,073 | |
| | 1,975,000 | | | | | CC Holdings GS V LLC | | 2.381 | | | 12/15/17 | | | 1,956 | |
| | 5,962,000 | | | | | Flextronics International Ltd | | 4.625 | | | 02/15/20 | | | 5,813 | |
| | 38,125,000 | | | | | General Electric Co | | 0.850 | | | 10/09/15 | | | 38,303 | |
| | 3,300,000 | | | | | General Electric Co | | 5.250 | | | 12/06/17 | | | 3,735 | |
| | 11,950,000 | | | | | General Electric Co | | 2.700 | | | 10/09/22 | | | 11,185 | |
| | 5,325,000 | | | | | General Electric Co | | 4.125 | | | 10/09/42 | | | 4,920 | |
| | 6,480,000 | | | | | Jabil Circuit, Inc | | 5.625 | | | 12/15/20 | | | 6,723 | |
COLLEGE RETIREMENT EQUITIES FUND - Bond Market Account
| | | | | | | | | | | MATURITY | | VALUE | |
| PRINCIPAL | | | | | ISSUER | | RATE | | DATE | | (000) | |
| $ | 7,776,000 | | | | | Jabil Circuit, Inc | | 4.700 | % | | 09/15/22 | | $ | 7,465 | |
| | 2,000,000 | | | | | L-3 Communications Corp | | 4.950 | | | 02/15/21 | | | 2,092 | |
| | 4,625,000 | | | g | | NXP BV | | 3.750 | | | 06/01/18 | | | 4,660 | |
| | 5,000,000 | | | | | Scientific Games International, Inc | | 6.250 | | | 09/01/20 | | | 5,125 | |
| | 5,050,000 | | | | | Tyco Electronics Group S.A. | | 2.375 | | | 12/17/18 | | | 4,980 | |
| | 3,600,000 | | | | | Xerox Corp | | 8.250 | | | 05/15/14 | | | 3,696 | |
| | 2,725,000 | | | | | Xerox Corp | | 4.500 | | | 05/15/21 | | | 2,805 | |
| | | | | | | TOTAL TECHNOLOGY HARDWARE & EQUIPMENT | | | | | 112,237 | |
| | | | | | | | | | | | | | | | |
| TELECOMMUNICATION SERVICES - 2.1% | | | | | | | | | |
| | 2,870,000 | | | | | America Movil SAB de C.V. | | 2.375 | | | 09/08/16 | | | 2,954 | |
| | 4,875,000 | | | | | America Movil SAB de C.V. | | 3.125 | | | 07/16/22 | | | 4,500 | |
| | 7,500,000 | | | | | American Tower Corp | | 3.500 | | | 01/31/23 | | | 6,838 | |
| | 2,500,000 | | | | | AT&T, Inc | | 2.500 | | | 08/15/15 | | | 2,567 | |
| | 21,350,000 | | | | | AT&T, Inc | | 1.400 | | | 12/01/17 | | | 21,048 | |
| | 8,200,000 | | | | | AT&T, Inc | | 2.625 | | | 12/01/22 | | | 7,399 | |
| | 13,125,000 | | | | | BellSouth Corp | | 5.200 | | | 09/15/14 | | | 13,553 | |
| | 8,500,000 | | | g | | Bharti Airtel International Netherlands BV | | 5.125 | | | 03/11/23 | | | 7,806 | |
| | 5,525,000 | | | | | British Telecommunications plc | | 1.625 | | | 06/28/16 | | | 5,574 | |
| | 13,850,000 | | | | | Cellco Partnership | | 8.500 | | | 11/15/18 | | | 17,536 | |
| | 4,825,000 | | | | | CenturyLink, Inc | | 6.750 | | | 12/01/23 | | | 4,885 | |
| | 4,000,000 | | | g | | Deutsche Telekom International Finance BV | | 2.250 | | | 03/06/17 | | | 4,057 | |
| | 4,000,000 | | | | | Deutsche Telekom International Finance BV | | 8.750 | | | 06/15/30 | | | 5,643 | |
| | 3,625,000 | | | g | | Deutsche Telekom International Finance BV | | 4.875 | | | 03/06/42 | | | 3,459 | |
| 4,025,000 | | | g | | Intelsat Jackson Holdings S.A. | | 5.500 | | | 08/01/23 | | | 3,829 | |
| | 8,020,000 | | | g | | Oi S.A. | | 5.750 | | | 02/10/22 | | | 7,378 | |
| | 2,050,000 | | | g | | SES | | 3.600 | | | 04/04/23 | | | 1,910 | |
| | 4,275,000 | | | g | | SK Telecom Co Ltd | | 2.125 | | | 05/01/18 | | | 4,150 | |
| | 7,475,000 | | | g | | Sprint Corp | | 7.250 | | | 09/15/21 | | | 8,026 | |
| | 1,225,000 | | | | | Sprint Nextel Corp | | 6.000 | | | 12/01/16 | | | 1,337 | |
| | 1,998,000 | | | | | Telecom Italia Capital S.A. | | 6.175 | | | 06/18/14 | | | 2,043 | |
| | 11,100,000 | | | | | Telefonica Emisiones SAU | | 3.992 | | | 02/16/16 | | | 11,659 | |
| | 8,725,000 | | | | | Telefonica Emisiones SAU | | 3.192 | | | 04/27/18 | | | 8,886 | |
| | 7,625,000 | | | | | Telefonica Emisiones SAU | | 4.570 | | | 04/27/23 | | | 7,519 | |
| | 4,500,000 | | | | | Telefonos de Mexico SAB de C.V. | | 5.500 | | | 11/15/19 | | | 4,916 | |
| | 21,600,000 | | | | | Verizon Communications, Inc | | 0.700 | | | 11/02/15 | | | 21,540 | |
| | 1,250,000 | | | | | Verizon Communications, Inc | | 6.100 | | | 04/15/18 | | | 1,452 | |
| | 13,900,000 | | | | | Verizon Communications, Inc | | 3.650 | | | 09/14/18 | | | 14,714 | |
| | 1,888,000 | | | | | Verizon Communications, Inc | | 8.750 | | | 11/01/18 | | | 2,416 | |
| | 22,425,000 | | | | | Verizon Communications, Inc | | 5.150 | | | 09/15/23 | | | 24,078 | |
| | 10,550,000 | | | | | Verizon Communications, Inc | | 3.850 | | | 11/01/42 | | | 8,617 | |
| | 24,300,000 | | | | | Verizon Communications, Inc | | 6.550 | | | 09/15/43 | | | 28,430 | |
| | 735,000 | | | | | Windstream Corp | | 8.125 | | | 09/01/18 | | | 790 | |
| | | | | | | TOTAL TELECOMMUNICATION SERVICES | | | | | | 271,509 | |
COLLEGE RETIREMENT EQUITIES FUND - Bond Market Account
| | | | | | | | | | | MATURITY | | VALUE | |
| PRINCIPAL | | | | | ISSUER | | RATE | | DATE | | (000) | |
| TRANSPORTATION - 0.4% | | | | | | | | | |
| $ | 1,800,000 | | | g | | Asciano Finance Ltd | | 3.125 | % | | 09/23/15 | | $ | 1,841 | |
| | 5,730,000 | | | g | | Asciano Finance Ltd | | 5.000 | | | 04/07/18 | | | 6,075 | |
| | 2,000,000 | | | g | | DP World Ltd | | 6.850 | | | 07/02/37 | | | 1,965 | |
| | 6,695,000 | | | g | | Embraer Overseas Ltd | | 5.696 | | | 09/16/23 | | | 6,695 | |
| | 3,900,000 | | | g | | ERAC USA Finance LLC | | 3.300 | | | 10/15/22 | | | 3,624 | |
| | 4,150,000 | | | g | | ERAC USA Finance LLC | | 5.625 | | | 03/15/42 | | | 4,239 | |
| | 4,075,000 | | | | | Kansas City Southern de Mexico S.A. de C.V. | | 2.350 | | | 05/15/20 | | | 3,796 | |
| | 2,400,000 | | | g | | Kansas City Southern Railway | | 4.300 | | | 05/15/43 | | | 2,094 | |
| | 2,625,000 | | | | | Northrop Grumman Corp | | 1.750 | | | 06/01/18 | | | 2,561 | |
| | 5,850,000 | | | | | Northrop Grumman Corp | | 3.250 | | | 08/01/23 | | | 5,457 | |
| | 7,750,000 | | | | | United Parcel Service, Inc | | 3.125 | | | 01/15/21 | | | 7,759 | |
| | 4,900,000 | | | | | United Parcel Service, Inc | | 3.625 | | | 10/01/42 | | | 4,125 | |
| | | | | | | TOTAL TRANSPORTATION | | | | | | | | 50,231 | |
| | | | | | | | | | | | | | | | |
| UTILITIES - 3.2% | | | | | | | | | |
| | 1,325,000 | | | g | | Abu Dhabi National Energy Co | | 2.500 | | | 01/12/18 | | | 1,325 | |
| | 3,630,000 | | | g | | Abu Dhabi National Energy Co | | 5.875 | | | 12/13/21 | | | 4,025 | |
| | 6,225,000 | | | | | AES Corp | | 4.875 | | | 05/15/23 | | | 5,820 | |
| | 6,325,000 | | | | | AGL Capital Corp | | 4.400 | | | 06/01/43 | | | 5,703 | |
| | 5,150,000 | | | | | Alabama Power Co | | 3.550 | | | 12/01/23 | | | 5,055 | |
| | 8,435,000 | | | | | Alliant Energy Corp | | 4.000 | | | 10/15/14 | | | 8,656 | |
| | 15,000,000 | | | | | American Electric Power Co, Inc | | 1.650 | | | 12/15/17 | | | 14,697 | |
| | 6,000,000 | | | | | American Electric Power Co, Inc | | 2.950 | | | 12/15/22 | | | 5,549 | |
| | 1,667,000 | | | | | Arizona Public Service Co | | 5.050 | | | 09/01/41 | | | 1,711 | |
| | 5,500,000 | | | | | Atmos Energy Corp | | 8.500 | | | 03/15/19 | | | 7,048 | |
| | 7,150,000 | | | | | Atmos Energy Corp | | 4.150 | | | 01/15/43 | | | 6,431 | |
| | 6,225,000 | | | | | Black Hills Corp | | 4.250 | | | 11/30/23 | | | 6,197 | |
| | 1,599,000 | | | g | | Calpine Corp | | 7.500 | | | 02/15/21 | | | 1,745 | |
| | 4,750,000 | | | | | Carolina Power & Light Co | | 5.300 | | | 01/15/19 | | | 5,403 | |
| | 2,750,000 | | | | | Carolina Power & Light Co | | 5.700 | | | 04/01/35 | | | 3,033 | |
| | 3,670,000 | | | | | CenterPoint Energy Resources Corp | | 4.500 | | | 01/15/21 | | | 3,915 | |
| 3,550,000 | | | | | CenterPoint Energy Resources Corp | | 6.250 | | | 02/01/37 | | | 3,948 | |
| | 3,500,000 | | | g | | CEZ AS. | | 4.250 | | | 04/03/22 | | | 3,496 | |
| | 6,125,000 | | | | | CLP Power Hong Kong Financing Ltd | | 3.375 | | | 10/26/27 | | | 5,154 | |
| | 2,500,000 | | | | | CMS Energy Corp | | 5.050 | | | 02/15/18 | | | 2,741 | |
| | 5,450,000 | | | | | CMS Energy Corp | | 4.700 | | | 03/31/43 | | | 5,085 | |
| | 2,500,000 | | | g | | Comision Federal de Electricidad | | 4.875 | | | 05/26/21 | | | 2,581 | |
| | 1,700,000 | | | g | | Comision Federal de Electricidad | | 4.875 | | | 01/15/24 | | | 1,687 | |
| | 2,075,000 | | | g | | Comision Federal de Electricidad | | 5.750 | | | 02/14/42 | | | 1,935 | |
| | 3,055,000 | | | | | Commonwealth Edison Co | | 4.000 | | | 08/01/20 | | | 3,244 | |
| | 4,200,000 | | | | | Commonwealth Edison Co | | 5.900 | | | 03/15/36 | | | 4,798 | |
| | 2,750,000 | | | | | Connecticut Light & Power Co | | 5.500 | | | 02/01/19 | | | 3,150 | |
| | 9,050,000 | | | | | Consolidated Edison Co of New York, Inc | | 3.950 | | | 03/01/43 | | | 7,985 | |
| | 4,250,000 | | | | | Consolidated Natural Gas Co | | 5.000 | | | 12/01/14 | | | 4,425 | |
| | 3,650,000 | | | g | | Dominion Gas Holdings LLC | | 3.550 | | | 11/01/23 | | | 3,516 | |
| | 4,250,000 | | | g | | Dominion Gas Holdings LLC | | 4.800 | | | 11/01/43 | | | 4,109 | |
| | 1,400,000 | | | | | Duke Energy Carolinas LLC | | 4.300 | | | 06/15/20 | | | 1,501 | |
COLLEGE RETIREMENT EQUITIES FUND - Bond Market Account
| | | | | | | | | | | MATURITY | | VALUE | |
| PRINCIPAL | | | | | ISSUER | | RATE | | DATE | | (000) | |
| $ | 3,375,000 | | | | | Duke Energy Ohio, Inc | | 3.800 | % | | 09/01/23 | | $ | 3,373 | |
| | 8,800,000 | | | | | Florida Power & Light Co | | 2.750 | | | 06/01/23 | | | 8,237 | |
| | 2,000,000 | | | | | Florida Power Corp | | 6.400 | | | 06/15/38 | | | 2,466 | |
| | 3,500,000 | | | | | FPL Group Capital, Inc | | 2.600 | | | 09/01/15 | | | 3,593 | |
| | 3,000,000 | | | | | Georgia Power Co | | 5.400 | | | 06/01/40 | | | 3,132 | |
| | 2,000,000 | | | | | Georgia Power Co | | 4.300 | | | 03/15/42 | | | 1,799 | |
| | 5,000,000 | | | | | Indiana Michigan Power Co | | 7.000 | | | 03/15/19 | | | 5,946 | |
| | 2,725,000 | | | | | Integrys Energy Group, Inc | | 4.170 | | | 11/01/20 | | | 2,826 | |
| | 3,350,000 | | | g | | Israel Electric Corp Ltd | | 6.700 | | | 02/10/17 | | | 3,641 | |
| | 3,000,000 | | | g | | Israel Electric Corp Ltd | | 5.625 | | | 06/21/18 | | | 3,173 | |
| �� | 1,000,000 | | | g | | Kansas Gas & Electric | | 6.700 | | | 06/15/19 | | | 1,198 | |
| | 625,000 | | | g | | KazMunayGas National Co JSC | | 4.400 | | | 04/30/23 | | | 580 | |
| | 6,225,000 | | | | | Kentucky Utilities Co | | 4.650 | | | 11/15/43 | | | 6,200 | |
| | 2,825,000 | | | | | Kinder Morgan Energy Partners LP | | 9.000 | | | 02/01/19 | | | 3,589 | |
| | 1,850,000 | | | g | | Korea Hydro & Nuclear Power Co Ltd | | 3.125 | | | 09/16/15 | | | 1,906 | |
| | 1,500,000 | | | g | | Korea Hydro & Nuclear Power Co Ltd | | 2.875 | | | 10/02/18 | | | 1,491 | |
| | 5,000,000 | | | | | LG&E and KU Energy LLC | | 3.750 | | | 11/15/20 | | | 5,059 | |
| | 4,950,000 | | | | | Louisville Gas & Electric Co | | 4.650 | | | 11/15/43 | | | 4,914 | |
| | 1,000,000 | | | g | | Majapahit Holding BV | | 7.875 | | | 06/29/37 | | | 1,040 | |
| | 8,000,000 | | | g | | MidAmerican Energy Holdings Co | | 5.150 | | | 11/15/43 | | | 8,067 | |
| | 2,800,000 | | | | | Nevada Power Co | | 6.500 | | | 08/01/18 | | | 3,315 | |
| | 3,335,000 | | | | | Nevada Power Co | | 5.450 | | | 05/15/41 | | | 3,612 | |
| | 3,500,000 | | | | | NiSource Finance Corp | | 4.800 | | | 02/15/44 | | | 3,158 | |
| | 3,375,000 | | | | | Northeast Utilities | | 1.450 | | | 05/01/18 | | | 3,269 | |
| | 2,500,000 | | | | | NTPC Ltd | | 5.625 | | | 07/14/21 | | | 2,483 | |
| | 1,000,000 | | | | | NTPC Ltd | | 4.750 | | | 10/03/22 | | | 916 | |
| | 2,850,000 | | | | | Oncor Electric Delivery Co LLC | | 5.250 | | | 09/30/40 | | | 2,935 | |
| | 8,400,000 | | | | | Oncor Electric Delivery Co LLC | | 4.550 | | | 12/01/41 | | | 7,900 | |
| | 4,850,000 | | | | | ONEOK Partners LP | | 3.375 | | | 10/01/22 | | | 4,534 | |
| | 3,900,000 | | | | | Pacific Gas & Electric Co | | 8.250 | | | 10/15/18 | | | 4,878 | |
| | 8,875,000 | | | | | Pacific Gas & Electric Co | | 3.850 | | | 11/15/23 | | | 8,827 | |
| | 7,475,000 | | | | | Pacific Gas & Electric Co | | 5.125 | | | 11/15/43 | | | 7,719 | |
| | 6,375,000 | | | | | PacifiCorp | | 2.950 | | | 02/01/22 | | | 6,128 | |
| | 4,825,000 | | | | | Pepco Holdings, Inc | | 2.700 | | | 10/01/15 | | | 4,948 | |
| | 3,000,000 | | | g | | Perusahaan Listrik Negara PT | | 5.500 | | | 11/22/21 | | | 2,888 | |
| | 6,750,000 | | | | | PG&E Corp | | 5.750 | | | 04/01/14 | | | 6,833 | |
| | 750,000 | | | | | Potomac Electric Power Co | | 7.900 | | | 12/15/38 | | | 1,059 | |
| 6,925,000 | | | | | PPL Capital Funding, Inc | | 4.200 | | | 06/15/22 | | | 6,912 | |
| | 2,000,000 | | | | | PPL Electric Utilities Corp | | 3.000 | | | 09/15/21 | | | 1,968 | |
| | 1,750,000 | | | | | PPL Electric Utilities Corp | | 5.200 | | | 07/15/41 | | | 1,858 | |
| | 3,825,000 | | | | | Progress Energy, Inc | | 7.050 | | | 03/15/19 | | | 4,585 | |
| | 4,625,000 | | | | | Public Service Co of Colorado | | 3.200 | | | 11/15/20 | | | 4,649 | |
| | 8,800,000 | | | | | Public Service Co of Oklahoma | | 5.150 | | | 12/01/19 | | | 9,749 | |
| | 2,640,000 | | | | | Public Service Electric & Gas Co | | 5.300 | | | 05/01/18 | | | 2,983 | |
| | 5,000,000 | | | | | Public Service Electric & Gas Co | | 3.500 | | | 08/15/20 | | | 5,156 | |
| | 11,475,000 | | | | | Public Service Electric & Gas Co | | 2.375 | | | 05/15/23 | | | 10,318 | |
| | 2,940,000 | | | | | QEP Resources, Inc | | 5.375 | | | 10/01/22 | | | 2,830 | |
| | 1,250,000 | | | | | Questar Market Resources, Inc | | 6.875 | | | 03/01/21 | | | 1,341 | |
COLLEGE RETIREMENT EQUITIES FUND - Bond Market Account
| | | | | | | | | | | MATURITY | | VALUE | |
| PRINCIPAL | | | | | ISSUER | | RATE | | DATE | | (000) | |
| $ | 2,300,000 | | | | | Sabine Pass LNG LP | | 6.500 | % | | 11/01/20 | | $ | 2,386 | |
| | 4,275,000 | | | | | San Diego Gas & Electric Co | | 3.000 | | | 08/15/21 | | | 4,213 | |
| | 3,000,000 | | | | | Sempra Energy | | 2.300 | | | 04/01/17 | | | 3,039 | |
| | 4,000,000 | | | | | Sempra Energy | | 6.000 | | | 10/15/39 | | | 4,394 | |
| | 7,425,000 | | | | | Southern California Edison Co | | 4.650 | | | 10/01/43 | | | 7,431 | |
| | 2,325,000 | | | | | Tampa Electric Co | | 4.100 | | | 06/15/42 | | | 2,092 | |
| | 5,950,000 | | | g | | Transportadora de Gas del Peru S.A. | | 4.250 | | | 04/30/28 | | | 5,206 | |
| | 3,680,000 | | | | | Virginia Electric and Power Co | | 2.950 | | | 01/15/22 | | | 3,555 | |
| | 6,150,000 | | | | | Virginia Electric and Power Co | | 4.650 | | | 08/15/43 | | | 6,125 | |
| | 3,000,000 | | | | | Williams Partners LP | | 3.800 | | | 02/15/15 | | | 3,099 | |
| | 5,075,000 | | | | | Williams Partners LP | | 4.000 | | | 11/15/21 | | | 5,012 | |
| | 7,250,000 | | | | | Williams Partners LP | | 4.500 | | | 11/15/23 | | | 7,201 | |
| | 6,000,000 | | | | | Williams Partners LP | | 5.800 | | | 11/15/43 | | | 6,124 | |
| | 14,000,000 | | | g | | WPD Investment Holdings Ltd | | 3.900 | | | 05/01/16 | | | 14,630 | |
| | 4,000,000 | | | | | Xcel Energy, Inc | | 4.800 | | | 09/15/41 | | | 3,895 | |
| | | | | | | TOTAL UTILITIES | | | | | | | | 424,051 | |
| | | | | | | | | | | | | | | | |
| | | | | | | TOTAL CORPORATE BONDS | | | | | | | | 4,167,707 | |
| | | | | | | (Cost $4,142,357) | | | | | | | | | |
| | | | | | | | | | | | | | | | |
| GOVERNMENT BONDS - 52.4% | | | | | | | | | |
| | | | | | | | | | | | | | | | |
| AGENCY SECURITIES - 2.9% | | | | | | | | | |
| | 17,248,561 | | | | | AMAL Ltd | | 3.465 | | | 08/21/21 | | | 18,185 | |
| | 3,000,000 | | | | | Amber Circle Funding Ltd | | 3.250 | | | 12/04/22 | | | 2,730 | |
| | 4,454,339 | | | | | Cal Dive I- Title XI, Inc | | 4.930 | | | 02/01/27 | | | 4,710 | |
| | 20,000,000 | | | | | Federal Home Loan Mortgage Corp (FHLMC) | | 3.000 | | | 07/28/14 | | | 20,320 | |
| | 35,000,000 | | | | | Federal National Mortgage Association (FNMA) | | 2.625 | | | 11/20/14 | | | 35,766 | |
| | 5,000,000 | | | | | International Bank for Reconstruction & Development | | 0.500 | | | 04/15/16 | | | 4,992 | |
| | 26,540,000 | | | | | Lutheran Medical Center | | 1.982 | | | 02/20/30 | | | 24,533 | |
| | 1,169,067 | | | | | National Credit Union Administration | | 1.840 | | | 10/07/20 | | | 1,179 | |
| | 16,887,908 | | | | | Premier Aircraft Leasing | | 3.576 | | | 02/06/22 | | | 17,871 | |
| | 10,000,000 | | | | | Private Export Funding Corp (PEFCO) | | 3.050 | | | 10/15/14 | | | 10,219 | |
| | 7,000,000 | | | | | PEFCO | | 4.550 | | | 05/15/15 | | | 7,406 | |
| | 15,000,000 | | | | | PEFCO | | 2.125 | | | 07/15/16 | | | 15,559 | |
| | 34,000,000 | | | | | PEFCO | | 1.375 | | | 02/15/17 | | | 34,319 | |
| | 17,000,000 | | | | | PEFCO | | 5.450 | | | 09/15/17 | | | 19,466 | |
| | 10,000,000 | | | | | PEFCO | | 2.250 | | | 12/15/17 | | | 10,299 | |
| | 5,000,000 | | | | | PEFCO | | 4.375 | | | 03/15/19 | | | 5,521 | |
| | 17,300,000 | | | | | PEFCO | | 1.450 | | | 08/15/19 | | | 16,455 | |
| | 35,000,000 | | | | | PEFCO | | 4.300 | | | 12/15/21 | | | 38,023 | |
| | 30,000,000 | | | | | PEFCO | | 2.050 | | | 11/15/22 | | | 26,889 | |
| 2,521,875 | | | | | Totem Ocean Trailer Express, Inc | | 4.514 | | | 12/18/19 | | | 2,644 | |
| | 62,753,000 | | | | | Tunisia Government AID Bonds | | 1.686 | | | 07/16/19 | | | 60,648 | |
COLLEGE RETIREMENT EQUITIES FUND - Bond Market Account
| | | | | | | | | | | MATURITY | | VALUE | |
| PRINCIPAL | | | | | ISSUER | | RATE | | DATE | | (000) | |
| $ | 3,000,000 | | | | | United States Department of Housing and Urban Development (HUD) | | 5.380 | % | | 08/01/18 | | $ | 3,346 | |
| | 15,000,000 | | | | | UNM Sandoval Regional Medical Center | | 4.500 | | | 07/20/36 | | | 14,451 | |
| | | | | | | TOTAL AGENCY SECURITIES | | | | | | | | 395,531 | |
| | | | | | | | | | | | | | | | |
| FOREIGN GOVERNMENT BONDS - 6.4% | | | | | | | | | |
| | 4,300,000 | | | g | | Barbados Government International Bond | | 7.000 | | | 08/04/22 | | | 3,762 | |
| | 8,300,000 | | | g | | Brazil Minas SPE via State of Minas Gerais | | 5.333 | | | 02/15/28 | | | 7,698 | |
| | 4,210,000 | | | | | Brazilian Government International Bond | | 5.875 | | | 01/15/19 | | | 4,715 | |
| | 2,500,000 | | | | | Brazilian Government International Bond | | 4.250 | | | 01/07/25 | | | 2,381 | |
| | 825,000 | | | | | Brazilian Government International Bond | | 7.125 | | | 01/20/37 | | | 945 | |
| | 2,000,000 | | | | | Brazilian Government International Bond | | 5.625 | | | 01/07/41 | | | 1,940 | |
| | 10,000,000 | | | g | | Caisse d’Amortissement de la Dette Sociale | | 2.000 | | | 04/17/20 | | | 9,579 | |
| | 12,200,000 | | | | | Canada Government International Bond | | 2.375 | | | 09/10/14 | | | 12,381 | |
| | 25,275,000 | | | | | Canada Government International Bond | | 0.875 | | | 02/14/17 | | | 25,275 | |
| | 3,630,000 | | | | | Chile Government International Bond | | 3.875 | | | 08/05/20 | | | 3,775 | |
| | 740,000 | | | | | Chile Government International Bond | | 2.250 | | | 10/30/22 | | | 657 | |
| | 2,675,000 | | | | | Colombia Government International Bond | | 4.375 | | | 07/12/21 | | | 2,755 | |
| | 1,775,000 | | | | | Colombia Government International Bond | | 2.625 | | | 03/15/23 | | | 1,555 | |
| | 4,450,000 | | | | | Colombia Government International Bond | | 4.000 | | | 02/26/24 | | | 4,290 | |
| | 1,500,000 | | | | | Colombia Government International Bond | | 6.125 | | | 01/18/41 | | | 1,605 | |
| | 3,350,000 | | | g | | Croatia Government International Bond | | 6.375 | | | 03/24/21 | | | 3,506 | |
| | 2,325,000 | | | g | | Croatia Government International Bond | | 5.500 | | | 04/04/23 | | | 2,261 | |
| | 3,600,000 | | | g | | Croatia Government International Bond | | 6.000 | | | 01/26/24 | | | 3,573 | |
| | 2,500,000 | | | g | | Dominican Republic International Bond | | 5.875 | | | 04/18/24 | | | 2,387 | |
| | 32,500,000 | | | | | European Investment Bank | | 1.125 | | | 04/15/15 | | | 32,834 | |
| | 3,500,000 | | | | | European Investment Bank | | 4.875 | | | 02/15/36 | | | 3,825 | |
| | 15,350,000 | | | | | Export Development Canada | | 2.250 | | | 05/28/15 | | | 15,764 | |
| | 5,825,000 | | | | | Export-Import Bank of Korea | | 1.250 | | | 11/20/15 | | | 5,843 | |
| | 4,200,000 | | | | | Export-Import Bank of Korea | | 4.375 | | | 09/15/21 | | | 4,381 | |
| | 3,000,000 | | | | | Federative Republic of Brazil | | 6.000 | | | 01/17/17 | | | 3,324 | |
| | 4,950,000 | | | | | Hungary Government International Bond | | 5.750 | | | 11/22/23 | | | 4,975 | |
| | 40,200,000 | | | | | Hydro Quebec | | 1.375 | | | 06/19/17 | | | 40,336 | |
| | 2,000,000 | | | g | | Iceland Government International Bond | | 4.875 | | | 06/16/16 | | | 2,075 | |
| | 1,660,000 | | | g | | Indonesia Government International Bond | | 3.750 | | | 04/25/22 | | | 1,496 | |
| | 2,000,000 | | | | | Israel Government International Bond | | 4.000 | | | 06/30/22 | | | 2,080 | |
| | 4,400,000 | | | | | Italy Government International Bond | | 5.375 | | | 06/12/17 | | | 4,796 | |
| | 1,610,000 | | | | | Italy Government International Bond | | 6.875 | | | 09/27/23 | | | 1,908 | |
| | 18,750,000 | | | | | KFW | | 2.625 | | | 01/25/22 | | | 18,295 | |
| | 13,000,000 | | | g | | Kommunalbanken AS. | | 1.375 | | | 06/08/17 | | | 13,069 | |
| | 5,800,000 | | | g,i | | Kommunalbanken AS. | | 0.417 | | | 02/20/18 | | | 5,793 | |
| | 2,400,000 | | | | | Korea Development Bank | | 1.500 | | | 01/22/18 | | | 2,301 | |
| | 3,670,000 | | | g | | Korea Housing Finance Corp | | 3.500 | | | 12/15/16 | | | 3,861 | |
| | 3,250,000 | | | g | | Korea Housing Finance Corp | | 1.625 | | | 09/15/18 | | | 3,064 | |
| | 1,000,000 | | | | | Mexico Government International Bond | | 5.625 | | | 01/15/17 | | | 1,118 | |
| | 2,900,000 | | | | | Mexico Government International Bond | | 6.750 | | | 09/27/34 | | | 3,422 | |
| | 1,500,000 | | | | | Mexico Government International Bond | | 6.050 | | | 01/11/40 | | | 1,631 | |
| | 1,500,000 | | | | | Mexico Government International Bond | | 4.750 | | | 03/08/44 | | | 1,352 | |
COLLEGE RETIREMENT EQUITIES FUND - Bond Market Account
| | | | | | | | | | | MATURITY | | VALUE | |
| PRINCIPAL | | | | | ISSUER | | RATE | | DATE | | (000) | |
| $ | 3,000,000 | | | g | | Morocco Government International Bond | | 4.250 | % | | 12/11/22 | | $ | 2,775 | |
| | 3,600,000 | | | g | | Namibia International Bonds | | 5.500 | | | 11/03/21 | | | 3,672 | |
| | 9,250,000 | | | g | | National Bank of Canada | | 1.650 | | | 01/30/14 | | | 9,260 | |
| 5,000,000 | | | g | | Nederlandse Waterschapsbank NV | | 2.125 | | | 02/09/17 | | | 5,147 | |
| | 43,950,000 | | | | | North American Development Bank | | 2.400 | | | 10/26/22 | | | 39,004 | |
| | 10,300,000 | | | | | Panama Government International Bond | | 5.200 | | | 01/30/20 | | | 11,214 | |
| | 1,000,000 | | | | | Peruvian Government International Bond | | 7.125 | | | 03/30/19 | | | 1,209 | |
| | 1,200,000 | | | | | Peruvian Government International Bond | | 7.350 | | | 07/21/25 | | | 1,512 | |
| | 1,250,000 | | | | | Peruvian Government International Bond | | 6.550 | | | 03/14/37 | | | 1,437 | |
| | 6,350,000 | | | | | Poland Government International Bond | | 6.375 | | | 07/15/19 | | | 7,422 | |
| | 6,167,000 | | | | | Poland Government International Bond | | 5.125 | | | 04/21/21 | | | 6,699 | |
| | 1,135,000 | | | | | Poland Government International Bond | | 3.000 | | | 03/17/23 | | | 1,033 | |
| | 25,000,000 | | | g | | Province of Alberta Canada | | 1.000 | | | 06/21/17 | | | 24,954 | |
| | 13,825,000 | | | | | Province of British Columbia Canada | | 2.850 | | | 06/15/15 | | | 14,322 | |
| | 21,000,000 | | | | | Province of British Columbia Canada | | 1.200 | | | 04/25/17 | | | 21,098 | |
| | 15,000,000 | | | | | Province of British Columbia Canada | | 2.000 | | | 10/23/22 | | | 13,464 | |
| | 20,000,000 | | | | | Province of Manitoba Canada | | 1.375 | | | 04/28/14 | | | 20,072 | |
| | 20,750,000 | | | | | Province of Manitoba Canada | | 1.750 | | | 05/30/19 | | | 20,301 | |
| | 20,000,000 | | | | | Province of New Brunswick Canada | | 2.750 | | | 06/15/18 | | | 20,687 | |
| | 12,000,000 | | | | | Province of Nova Scotia Canada | | 2.375 | | | 07/21/15 | | | 12,337 | |
| | 27,400,000 | | | | | Province of Ontario Canada | | 4.100 | | | 06/16/14 | | | 27,874 | |
| | 24,250,000 | | | | | Province of Ontario Canada | | 2.950 | | | 02/05/15 | | | 24,926 | |
| | 35,525,000 | | | | | Province of Ontario Canada | | 2.700 | | | 06/16/15 | | | 36,693 | |
| | 24,000,000 | | | | | Province of Ontario Canada | | 2.300 | | | 05/10/16 | | | 24,830 | |
| | 2,250,000 | | | | | Province of Quebec Canada | | 5.125 | | | 11/14/16 | | | 2,512 | |
| | 8,835,000 | | | | | Province of Quebec Canada | | 4.625 | | | 05/14/18 | | | 9,878 | |
| | 22,500,000 | | | | | Province of Quebec Canada | | 3.500 | | | 07/29/20 | | | 23,357 | |
| | 20,000,000 | | | | | Province of Quebec Canada | | 2.750 | | | 08/25/21 | | | 19,295 | |
| | 6,000,000 | | | | | Province of Quebec Canada | | 7.500 | | | 09/15/29 | | | 7,934 | |
| | 2,500,000 | | | g | | Qatar Government International Bond | | 4.500 | | | 01/20/22 | | | 2,646 | |
| | 4,230,000 | | | g | | Republic of Indonesia | | 4.875 | | | 05/05/21 | | | 4,188 | |
| | 1,070,000 | | | g | | Republic of Serbia | | 7.250 | | | 09/28/21 | | | 1,126 | |
| | 1,510,492 | | | i | | Republic of Serbia | | 6.750 | | | 11/01/24 | | | 1,486 | |
| | 1,225,000 | | | g | | Republic of Trinidad & Tobago | | 4.375 | | | 01/16/24 | | | 1,257 | |
| | 4,500,000 | | | | | Republic of Turkey | | 7.500 | | | 07/14/17 | | | 5,024 | |
| | 1,650,000 | | | | | Republic of Turkey | | 6.000 | | | 01/14/41 | | | 1,449 | |
| | 4,200,000 | | | g | | Romanian Government International Bond | | 6.750 | | | 02/07/22 | | | 4,767 | |
| | 5,025,000 | | | g | | Romanian Government International Bond | | 4.375 | | | 08/22/23 | | | 4,849 | |
| | 3,900,000 | | | g | | Russian Foreign Bond - Eurobond | | 3.250 | | | 04/04/17 | | | 4,070 | |
| | 3,375,000 | | | g | | Russian Foreign Bond - Eurobond | | 5.000 | | | 04/29/20 | | | 3,610 | |
| | 4,502,000 | | | | | South Africa Government International Bond | | 6.875 | | | 05/27/19 | | | 5,149 | |
| | 3,500,000 | | | | | South Africa Government International Bond | | 5.500 | | | 03/09/20 | | | 3,727 | |
| | 3,775,000 | | | | | South Africa Government International Bond | | 4.665 | | | 01/17/24 | | | 3,610 | |
| | 3,125,000 | | | | | South Africa Government International Bond | | 5.875 | | | 09/16/25 | | | 3,250 | |
| | 41,500,000 | | | | | Spain Government Bond | | 3.750 | | | 10/31/18 | | | 59,705 | |
| | 1,900,000 | | | g | | Sri Lanka Government International Bond | | 6.250 | | | 10/04/20 | | | 1,872 | |
| | 1,630,000 | | | g | | Sri Lanka Government International Bond | | 6.250 | | | 07/27/21 | | | 1,585 | |
COLLEGE RETIREMENT EQUITIES FUND - Bond Market Account
| | | | | | | | | | | MATURITY | | VALUE | |
| PRINCIPAL | | | | | ISSUER | | RATE | | DATE | | (000) | |
| $ | 1,600,000 | | | g | | Sri Lanka Government International Bond | | 5.875 | % | | 07/25/22 | | $ | 1,496 | |
| | 7,680,000 | | | | | Svensk Exportkredit AB | | 5.125 | | | 03/01/17 | | | 8,631 | |
| | 7,050,000 | | | | | Svensk Exportkredit AB | | 1.125 | | | 04/05/18 | | | 6,878 | |
| | 8,000,000 | | | | | Turkey Government International Bond | | 6.750 | | | 04/03/18 | | | 8,688 | |
| | 2,180,000 | | | | | United Mexican States | | 5.875 | | | 02/17/14 | | | 2,190 | |
| | 3,500,000 | | | | | United Mexican States | | 5.950 | | | 03/19/19 | | | 4,043 | |
| | 500,000 | | | | | United Mexican States | | 5.125 | | | 01/15/20 | | | 554 | |
| | 1,732,000 | | | | | Uruguay Government International Bond | | 4.500 | | | 08/14/24 | | | 1,732 | |
| | | | | | | TOTAL FOREIGN GOVERNMENT BONDS | | | | | | 835,083 | |
| | | | | | | | | | | | | | | | |
| MORTGAGE BACKED - 25.1% | | | | | | | | | |
| 6,788,195 | | | | | Federal Home Loan Mortgage Corp (FHLMC) | | 5.500 | | | 08/01/35 | | | 7,454 | |
| | 2,327,267 | | | i | | FHLMC | | 2.427 | | | 02/01/36 | | | 2,478 | |
| | 4,682,745 | | | i | | FHLMC | | 2.564 | | | 07/01/36 | | | 4,977 | |
| | 2,497,344 | | | i | | FHLMC | | 2.259 | | | 09/01/36 | | | 2,669 | |
| | 1,770,495 | | | i | | FHLMC | | 2.358 | | | 09/01/36 | | | 1,874 | |
| | 2,394,295 | | | i | | FHLMC | | 2.368 | | | 09/01/36 | | | 2,564 | |
| | 3,009,996 | | | i | | FHLMC | | 2.420 | | | 09/01/36 | | | 3,203 | |
| | 1,599,535 | | | i | | FHLMC | | 5.675 | | | 02/01/37 | | | 1,698 | |
| | 5,611,105 | | | i | | FHLMC | | 2.633 | | | 03/01/37 | | | 5,994 | |
| | 2,376,810 | | | i | | FHLMC | | 6.010 | | | 04/01/37 | | | 2,520 | |
| | 43,928 | | | i | | FHLMC | | 6.080 | | | 05/01/37 | | | 46 | |
| | 3,164,820 | | | i | | FHLMC | | 2.500 | | | 06/01/37 | | | 3,382 | |
| | 2,757,683 | | | i | | FHLMC | | 2.615 | | | 08/01/37 | | | 2,918 | |
| | 2,748,484 | | | i | | FHLMC | | 1.702 | | | 09/01/37 | | | 2,858 | |
| | 12,964,167 | | | | | FHLMC | | 6.000 | | | 09/01/37 | | | 14,464 | |
| | 6,452,705 | | | | | FHLMC | | 3.000 | | | 08/15/42 | | | 5,235 | |
| | 277,647 | | | | | Federal Home Loan Mortgage Corp Gold (FGLMC) | | 6.500 | | | 12/01/16 | | | 290 | |
| | 1,894,124 | | | | | FGLMC | | 5.000 | | | 09/01/18 | | | 2,006 | |
| | 759,934 | | | | | FGLMC | | 4.500 | | | 10/01/18 | | | 806 | |
| | 668,791 | | | | | FGLMC | | 4.500 | | | 11/01/18 | | | 709 | |
| | 903,258 | | | | | FGLMC | | 5.500 | | | 01/01/19 | | | 978 | |
| | 275,624 | | | | | FGLMC | | 4.000 | | | 06/01/19 | | | 292 | |
| | 1,026,024 | | | | | FGLMC | | 4.500 | | | 01/01/20 | | | 1,088 | |
| | 882,935 | | | | | FGLMC | | 4.500 | | | 07/01/20 | | | 957 | |
| | 583,448 | | | | | FGLMC | | 4.500 | | | 08/01/20 | | | 620 | |
| | 143,600 | | | | | FGLMC | | 7.000 | | | 10/01/20 | | | 155 | |
| | 2,610,170 | | | | | FGLMC | | 4.500 | | | 06/01/21 | | | 2,773 | |
| | 7,610,826 | | | | | FGLMC | | 4.500 | | | 06/01/21 | | | 8,085 | |
| | 939,699 | | | | | FGLMC | | 5.000 | | | 04/01/23 | | | 1,014 | |
| | 25,948 | | | | | FGLMC | | 7.000 | | | 05/01/23 | | | 29 | |
| | 270,938 | | | | | FGLMC | | 6.000 | | | 10/01/23 | | | 303 | |
| | 235,058 | | | | | FGLMC | | 6.000 | | | 11/01/23 | | | 260 | |
| | 3,496,313 | | | | | FGLMC | | 4.000 | | | 07/01/24 | | | 3,692 | |
| | 1,142,522 | | | | | FGLMC | | 4.500 | | | 09/01/24 | | | 1,226 | |
| | 45,164 | | | | | FGLMC | | 8.000 | | | 01/01/31 | | | 52 | |
| | 83,178 | | | | | FGLMC | | 7.000 | | | 12/01/31 | | | 87 | |
COLLEGE RETIREMENT EQUITIES FUND - Bond Market Account
| | | | | | | | | | | MATURITY | | VALUE | |
| PRINCIPAL | | | | | ISSUER | | RATE | | DATE | | (000) | |
| $ | 6,199 | | | | | FGLMC | | 7.000 | % | | 01/01/32 | | $ | 6 | |
| | 206,197 | | | | | FGLMC | | 8.000 | | | 02/01/32 | | | 238 | |
| | 1,805,330 | | | | | FGLMC | | 4.500 | | | 07/01/33 | | | 1,917 | |
| | 1,161,499 | | | | | FGLMC | | 5.500 | | | 11/01/33 | | | 1,300 | |
| | 2,253,160 | | | | | FGLMC | | 5.500 | | | 12/01/33 | | | 2,520 | |
| | 4,267,091 | | | | | FGLMC | | 5.500 | | | 12/01/33 | | | 4,707 | |
| | 10,774,277 | | | | | FGLMC | | 7.000 | | | 12/01/33 | | | 12,492 | |
| | 14,370,555 | | | | | FGLMC | | 5.000 | | | 01/01/34 | | | 15,559 | |
| | 3,066,645 | | | | | FGLMC | | 5.000 | | | 05/01/34 | | | 3,321 | |
| | 2,181,510 | | | | | FGLMC | | 6.000 | | | 09/01/34 | | | 2,442 | |
| | 5,240,492 | | | | | FGLMC | | 4.500 | | | 10/01/34 | | | 5,567 | |
| | 445,484 | | | | | FGLMC | | 5.500 | | | 12/01/34 | | | 492 | |
| | 2,391,078 | | | | | FGLMC | | 4.500 | | | 04/01/35 | | | 2,536 | |
| | 3,944,483 | | | | | FGLMC | | 7.000 | | | 05/01/35 | | | 4,480 | |
| | 375,595 | | | | | FGLMC | | 5.000 | | | 10/01/35 | | | 405 | |
| 291,408 | | | | | FGLMC | | 6.500 | | | 11/01/35 | | | 324 | |
| | 323,269 | | | | | FGLMC | | 6.000 | | | 01/01/36 | | | 360 | |
| | 918,454 | | | | | FGLMC | | 5.000 | | | 02/01/36 | | | 992 | |
| | 408,376 | | | | | FGLMC | | 5.500 | | | 04/01/36 | | | 450 | |
| | 69,176 | | | | | FGLMC | | 6.500 | | | 05/01/36 | | | 77 | |
| | 3,178,141 | | | | | FGLMC | | 6.500 | | | 10/01/36 | | | 3,580 | |
| | 1,781,874 | | | | | FGLMC | | 6.500 | | | 11/01/37 | | | 1,982 | |
| | 4,892,393 | | | | | FGLMC | | 5.000 | | | 04/01/38 | | | 5,285 | |
| | 2,637,081 | | | | | FGLMC | | 6.000 | | | 11/01/38 | | | 2,907 | |
| | 3,900,199 | | | | | FGLMC | | 5.000 | | | 07/01/39 | | | 4,204 | |
| | 5,595,688 | | | | | FGLMC | | 6.000 | | | 07/01/39 | | | 6,252 | |
| | 17,235,152 | | | | | FGLMC | | 4.500 | | | 11/01/40 | | | 18,426 | |
| | 19,721,462 | | | | | FGLMC | | 4.500 | | | 12/01/40 | | | 21,013 | |
| | 64,000,000 | | | h | | FGLMC | | 3.500 | | | 01/15/44 | | | 63,500 | |
| | 101,000,000 | | | h | | FGLMC | | 4.000 | | | 01/15/44 | | | 103,722 | |
| | 100,000,000 | | | h | | FGLMC | | 4.500 | | | 01/15/44 | | | 105,809 | |
| | 127,212 | | | | | Federal National Mortgage Association (FNMA) | | 4.810 | | | 02/01/14 | | | 127 | |
| | 562,951 | | | | | FNMA | | 4.828 | | | 01/01/15 | | | 563 | |
| | 56,934 | | | | | FNMA | | 7.500 | | | 02/01/15 | | | 58 | |
| | 183,288 | | | | | FNMA | | 7.500 | | | 04/01/15 | | | 188 | |
| | 124,102 | | | | | FNMA | | 7.500 | | | 04/01/15 | | | 127 | |
| | 14,723 | | | | | FNMA | | 6.500 | | | 03/01/16 | | | 16 | |
| | 6,414 | | | | | FNMA | | 6.500 | | | 04/01/16 | | | 7 | |
| | 117,413 | | | | | FNMA | | 6.500 | | | 10/01/16 | | | 122 | |
| | 128,245 | | | | | FNMA | | 6.500 | | | 11/01/16 | | | 134 | |
| | 1,063,969 | | | | | FNMA | | 5.000 | | | 12/01/17 | | | 1,133 | |
| | 289,178 | | | | | FNMA | | 6.500 | | | 02/01/18 | | | 306 | |
| | 639,789 | | | | | FNMA | | 5.500 | | | 03/01/18 | | | 680 | |
| | 2,285,296 | | | | | FNMA | | 5.500 | | | 04/01/18 | | | 2,443 | |
| | 214,403 | | | | | FNMA | | 5.500 | | | 04/01/18 | | | 229 | |
| | 308,906 | | | | | FNMA | | 6.500 | | | 04/01/18 | | | 328 | |
| | 81,990 | | | | | FNMA | | 5.500 | | | 05/01/18 | | | 87 | |
COLLEGE RETIREMENT EQUITIES FUND - Bond Market Account
| | | | | | | | | | | MATURITY | | VALUE | |
| PRINCIPAL | | | | | ISSUER | | RATE | | DATE | | (000) | |
| $ | 4,486,723 | | | | | FNMA | | 4.500 | % | | 12/01/18 | | $ | 4,775 | |
| | 110,038 | | | | | FNMA | | 6.000 | | | 01/01/19 | | | 122 | |
| | 26,546 | | | | | FNMA | | 6.000 | | | 02/01/19 | | | 29 | |
| | 2,293,537 | | | | | FNMA | | 5.000 | | | 04/01/19 | | | 2,456 | |
| | 985,710 | | | | | FNMA | | 4.500 | | | 06/01/19 | | | 1,049 | |
| | 1,445,299 | | | | | FNMA | | 5.000 | | | 03/01/20 | | | 1,540 | |
| | 1,301,564 | | | | | FNMA | | 5.500 | | | 07/01/20 | | | 1,422 | |
| | 512,260 | | | | | FNMA | | 4.500 | | | 11/01/20 | | | 545 | |
| | 1,032,733 | | | | | FNMA | | 5.000 | | | 12/01/20 | | | 1,112 | |
| | 2,344,541 | | | | | FNMA | | 5.000 | | | 03/01/21 | | | 2,498 | |
| | 1,286,305 | | | | | FNMA | | 5.500 | | | 08/01/21 | | | 1,405 | |
| | 885,838 | | | | | FNMA | | 4.500 | | | 03/01/23 | | | 944 | |
| | 81,299 | | | | | FNMA | | 8.000 | | | 03/01/23 | | | 90 | |
| | 1,727,620 | | | | | FNMA | | 4.500 | | | 06/01/23 | | | 1,841 | |
| | 819,641 | | | | | FNMA | | 5.000 | | | 07/01/23 | | | 873 | |
| | 2,396,060 | | | | | FNMA | | 5.000 | | | 07/01/23 | | | 2,587 | |
| | 1,238,550 | | | | | FNMA | | 5.000 | | | 12/01/23 | | | 1,344 | |
| | 410,165 | | | | | FNMA | | 5.500 | | | 02/01/24 | | | 450 | |
| | 1,754,936 | | | | | FNMA | | 4.000 | | | 05/01/24 | | | 1,861 | |
| | 813,319 | | | | | FNMA | | 5.500 | | | 07/01/24 | | | 894 | |
| | 155,778 | | | | | FNMA | | 8.000 | | | 07/01/24 | | | 180 | |
| 1,431,976 | | | | | FNMA | | 4.500 | | | 08/01/24 | | | 1,525 | |
| | 1,055,615 | | | | | FNMA | | 5.500 | | | 08/01/24 | | | 1,160 | |
| | 7,008,575 | | | | | FNMA | | 4.000 | | | 09/01/24 | | | 7,432 | |
| | 3,096,520 | | | | | FNMA | | 5.000 | | | 10/01/25 | | | 3,359 | |
| | 31,882 | | | | | FNMA | | 9.000 | | | 11/01/25 | | | 37 | |
| | 10,086,753 | | | | | FNMA | | 3.000 | | | 05/01/27 | | | 10,310 | |
| | 25,000,000 | | | h | | FNMA | | 2.500 | | | 01/25/29 | | | 24,742 | |
| | 81,000,000 | | | h | | FNMA | | 3.000 | | | 01/25/29 | | | 82,661 | |
| | 31,000,000 | | | h | | FNMA | | 3.500 | | | 01/25/29 | | | 32,418 | |
| | 45,000,000 | | | h | | FNMA | | 4.000 | | | 01/25/29 | | | 47,682 | |
| | 43,000,000 | | | h | | FNMA | | 3.500 | | | 02/25/29 | | | 44,853 | |
| | 50,000,000 | | | | | FNMA | | 3.000 | | | 03/25/31 | | | 51,719 | |
| | 2,081,768 | | | | | FNMA | | 6.500 | | | 07/01/32 | | | 2,335 | |
| | 179,729 | | | | | FNMA | | 7.000 | | | 07/01/32 | | | 195 | |
| | 169,390 | | | | | FNMA | | 7.000 | | | 07/01/32 | | | 190 | |
| | 1,339,464 | | | | | FNMA | | 6.000 | | | 01/01/33 | | | 1,504 | |
| | 1,807,356 | | | | | FNMA | | 4.500 | | | 03/25/33 | | | 1,890 | |
| | 11,858,956 | | | | | FNMA | | 3.000 | | | 10/01/33 | | | 11,684 | |
| | 1,922,995 | | | | | FNMA | | 4.500 | | | 10/01/33 | | | 2,045 | |
| | 3,670,824 | | | | | FNMA | | 5.000 | | | 11/01/33 | | | 4,053 | |
| | 201,706 | | | | | FNMA | | 5.000 | | | 11/01/33 | | | 223 | |
| | 2,898,628 | | | | | FNMA | | 5.500 | | | 12/01/33 | | | 3,243 | |
| | 310,820 | | | | | FNMA | | 5.500 | | | 12/01/33 | | | 344 | |
| | 2,454,467 | | | | | FNMA | | 6.000 | | | 08/01/34 | | | 2,755 | |
| | 1,118,377 | | | | | FNMA | | 6.000 | | | 12/01/34 | | | 1,255 | |
| | 14,735,302 | | | | | FNMA | | 5.500 | | | 02/01/35 | | | 16,223 | |
COLLEGE RETIREMENT EQUITIES FUND - Bond Market Account
| | | | | | | | | | | MATURITY | | VALUE | |
| PRINCIPAL | | | | | ISSUER | | RATE | | DATE | | (000) | |
| $ | 1,527,276 | | | | | FNMA | | 6.000 | % | | 04/01/35 | | $ | 1,713 | |
| | 3,349,368 | | | | | FNMA | | 4.500 | | | 05/01/35 | | | 3,558 | |
| | 6,187,602 | | | | | FNMA | | 5.500 | | | 05/01/35 | | | 6,801 | |
| | 1,798,530 | | | | | FNMA | | 6.000 | | | 05/01/35 | | | 2,003 | |
| | 257,615 | | | | | FNMA | | 5.500 | | | 06/01/35 | | | 284 | |
| | 1,135,220 | | | | | FNMA | | 5.500 | | | 06/01/35 | | | 1,252 | |
| | 1,413,498 | | | | | FNMA | | 5.500 | | | 06/01/35 | | | 1,553 | |
| | 812,088 | | | | | FNMA | | 5.500 | | | 06/01/35 | | | 895 | |
| | 70,593 | | | | | FNMA | | 7.500 | | | 06/01/35 | | | 77 | |
| | 921,632 | | | | | FNMA | | 6.000 | | | 07/01/35 | | | 1,034 | |
| | 1,798,458 | | | | | FNMA | | 4.500 | | | 08/01/35 | | | 1,910 | |
| | 1,642,306 | | | i | | FNMA | | 2.526 | | | 02/01/36 | | | 1,750 | |
| | 4,847,278 | | | | | FNMA | | 6.000 | | | 03/01/36 | | | 5,405 | |
| | 1,266,659 | | | i | | FNMA | | 2.379 | | | 07/01/36 | | | 1,363 | |
| | 1,642,643 | | | | | FNMA | | 6.000 | | | 12/01/36 | | | 1,822 | |
| | 2,414,087 | | | | | FNMA | | 6.500 | | | 03/01/37 | | | 2,694 | |
| | 94,246 | | | | | FNMA | | 6.500 | | | 03/01/37 | | | 106 | |
| | 1,808,687 | | | | | FNMA | | 7.000 | | | 04/01/37 | | | 1,951 | |
| | 747,072 | | | | | FNMA | | 6.500 | | | 08/01/37 | | | 830 | |
| | 2,253,004 | | | | | FNMA | | 6.000 | | | 09/01/37 | | | 2,506 | |
| | 1,702,262 | | | | | FNMA | | 6.000 | | | 09/01/37 | | | 1,915 | |
| | 2,224,595 | | | | | FNMA | | 6.000 | | | 09/01/37 | | | 2,501 | |
| | 1,635,840 | | | | | FNMA | | 6.000 | | | 09/01/37 | | | 1,842 | |
| | 2,111,898 | | | | | FNMA | | 6.500 | | | 09/01/37 | | | 2,350 | |
| | 2,267,959 | | | | | FNMA | | 6.500 | | | 09/01/37 | | | 2,518 | |
| | 5,516,189 | | | i | | FNMA | | 2.400 | | | 10/01/37 | | | 5,872 | |
| | 760,166 | | | | | FNMA | | 7.000 | | | 11/01/37 | | | 841 | |
| 86,042 | | | | | FNMA | | 6.500 | | | 02/01/38 | | | 96 | |
| | 255,807 | | | | | FNMA | | 6.500 | | | 03/01/38 | | | 284 | |
| | 3,892,130 | | | | | FNMA | | 6.000 | | | 07/01/38 | | | 4,309 | |
| | 1,863,507 | | | i | | FNMA | | 2.020 | | | 10/01/38 | | | 1,989 | |
| | 6,443,002 | | | | | FNMA | | 6.000 | | | 10/01/38 | | | 7,128 | |
| | 11,101,213 | | | | | FNMA | | 5.500 | | | 12/01/38 | | | 12,194 | |
| | 1,250,779 | | | | | FNMA | | 6.000 | | | 01/01/39 | | | 1,384 | |
| | 1,652,931 | | | | | FNMA | | 6.000 | | | 01/01/39 | | | 1,829 | |
| | 5,275,588 | | | | | FNMA | | 4.500 | | | 02/01/39 | | | 5,589 | |
| | 6,268,843 | | | | | FNMA | | 4.000 | | | 04/01/39 | | | 6,473 | |
| | 48,825,123 | | | | | FNMA | | 4.000 | | | 04/25/39 | | | 51,261 | |
| | 50,000,000 | | | | | FNMA | | 4.000 | | | 06/25/39 | | | 53,250 | |
| | 4,884,643 | | | | | FNMA | | 4.500 | | | 08/01/39 | | | 5,176 | |
| | 8,539,641 | | | | | FNMA | | 5.500 | | | 08/01/39 | | | 9,409 | |
| | 39,211,704 | | | | | FNMA | | 4.500 | | | 09/01/40 | | | 41,562 | |
| | 19,985,085 | | | | | FNMA | | 4.500 | | | 11/01/40 | | | 21,228 | |
| | 15,435,446 | | | | | FNMA | | 3.500 | | | 10/01/42 | | | 15,349 | |
| | 4,871,752 | | | | | FNMA | | 3.000 | | | 02/01/43 | | | 4,635 | |
| | 54,698,719 | | | | | FNMA | | 3.000 | | | 04/01/43 | | | 51,989 | |
| | 6,801,821 | | | | | FNMA | | 3.000 | | | 05/01/43 | | | 6,465 | |
COLLEGE RETIREMENT EQUITIES FUND - Bond Market Account
| | | | | | | | | | | MATURITY | | VALUE | |
| PRINCIPAL | | | | | ISSUER | | RATE | | DATE | | (000) | |
| $ | 11,548,169 | | | | | FNMA | | 3.000 | % | | 05/01/43 | | $ | 10,979 | |
| | 20,644,235 | | | | | FNMA | | 3.000 | | | 05/01/43 | | | 19,620 | |
| | 146,000,000 | | | h | | FNMA | | 4.000 | | | 01/25/44 | | | 150,289 | |
| | 98,000,000 | | | h | | FNMA | | 4.500 | | | 01/25/44 | | | 103,838 | |
| | 291,000,000 | | | h | | FNMA | | 5.000 | | | 01/25/44 | | | 316,031 | |
| | 116,000,000 | | | h | | FNMA | | 5.500 | | | 01/25/44 | | | 127,595 | |
| | 365,000,000 | | | h | | FNMA | | 3.500 | | | 02/25/44 | | | 361,493 | |
| | 266,000,000 | | | h | | FNMA | | 4.000 | | | 02/25/44 | | | 272,982 | |
| | 7,205 | | | | | Government National Mortgage Association (GNMA) | | 9.000 | | | 06/15/16 | | | 7 | |
| | 3,262 | | | | | GNMA | | 9.000 | | | 09/15/16 | | | 3 | |
| | 2,456 | | | | | GNMA | | 9.000 | | | 09/15/16 | | | 2 | |
| | 7,167 | | | | | GNMA | | 9.000 | | | 11/15/16 | | | 7 | |
| | 2,192 | | | | | GNMA | | 9.000 | | | 12/15/16 | | | 2 | |
| | 5,053 | | | | | GNMA | | 9.000 | | | 12/15/16 | | | 5 | |
| | 34,532 | | | | | GNMA | | 9.500 | | | 12/15/16 | | | 37 | |
| | 16,222 | | | | | GNMA | | 8.000 | | | 06/15/24 | | | 18 | |
| | 32,770 | | | | | GNMA | | 8.500 | | | 11/20/30 | | | 39 | |
| | 56,630 | | | | | GNMA | | 8.500 | | | 12/20/30 | | | 67 | |
| | 1,293,528 | | | | | GNMA | | 5.500 | | | 07/15/33 | | | 1,437 | |
| | 730,738 | | | | | GNMA | | 5.500 | | | 11/20/33 | | | 812 | |
| | 2,667,022 | | | | | GNMA | | 5.500 | | | 03/20/35 | | | 2,966 | |
| | 1,385,924 | | | | | GNMA | | 5.500 | | | 12/20/35 | | | 1,535 | |
| | 828,062 | | | | | GNMA | | 6.000 | | | 10/20/36 | | | 932 | |
| | 883,878 | | | | | GNMA | | 6.000 | | | 01/20/37 | | | 996 | |
| | 2,471,419 | | | | | GNMA | | 6.000 | | | 02/20/37 | | | 2,783 | |
| | 1,911,184 | | | | | GNMA | | 5.000 | | | 04/15/38 | | | 2,074 | |
| | 1,996,241 | | | | | GNMA | | 5.500 | | | 07/15/38 | | | 2,191 | |
| | 3,136,183 | | | | | GNMA | | 5.500 | | | 07/20/38 | | | 3,458 | |
| | 1,089,709 | | | | | GNMA | | 6.000 | | | 08/20/38 | | | 1,227 | |
| | 1,761,523 | | | | | GNMA | | 6.500 | | | 11/20/38 | | | 1,974 | |
| | 1,755,018 | | | | | GNMA | | 2.176 | | | 05/16/39 | | | 1,773 | |
| | 3,886,620 | | | | | GNMA | | 5.000 | | | 06/15/39 | | | 4,287 | |
| | 4,503,925 | | | | | GNMA | | 5.000 | | | 06/15/39 | | | 4,972 | |
| 8,352,376 | | | | | GNMA | | 4.500 | | | 07/20/39 | | | 8,969 | |
| | 2,477,431 | | | | | GNMA | | 5.000 | | | 07/20/39 | | | 2,690 | |
| | 2,922,288 | | | | | GNMA | | 4.000 | | | 08/15/39 | | | 3,040 | |
| | 1,207,062 | | | | | GNMA | | 4.000 | | | 11/20/39 | | | 1,257 | |
| | 41,235,489 | | | | | GNMA | | 5.000 | | | 09/20/43 | | | 44,823 | |
| | 74,000,000 | | | h | | GNMA | | 3.000 | | | 01/15/44 | | | 71,462 | |
| | 198,000,000 | | | h | | GNMA | | 3.500 | | | 01/15/44 | | | 199,555 | |
| | 78,000,000 | | | h | | GNMA | | 4.000 | | | 01/15/44 | | | 81,050 | |
| | 95,000,000 | | | h | | GNMA | | 4.500 | | | 01/15/44 | | | 101,361 | |
| | 43,000,000 | | | h | | GNMA | | 6.000 | | | 01/15/44 | | | 47,784 | |
| | 7,734,489 | | | | | GNMA | | 6.500 | | | 01/15/44 | | | 8,107 | |
| | 67,000,000 | | | h | | GNMA | | 3.500 | | | 01/20/44 | | | 67,589 | |
| | 33,000,000 | | | h | | GNMA | | 4.500 | | | 01/20/44 | | | 35,282 | |
| | | | | | | TOTAL MORTGAGE BACKED | | | | | | | | 3,305,368 | |
COLLEGE RETIREMENT EQUITIES FUND - Bond Market Account
| | | | | | | | | | | MATURITY | | VALUE | |
| PRINCIPAL | | | | | ISSUER | | RATE | | DATE | | (000) | |
| MUNICIPAL BONDS - 4.3% | | | | | | | | | |
| $ | 2,000,000 | | | | | Charlotte-Mecklenburg Hospital Authority | | 5.000 | % | | 08/01/15 | | $ | 2,080 | |
| | 15,000,000 | | | | | City of New York NY | | 2.450 | | | 04/01/19 | | | 14,623 | |
| | 10,000,000 | | | | | City of New York NY | | 2.650 | | | 04/01/20 | | | 9,792 | |
| | 14,000,000 | | | | | Florida Hurricane Catastrophe Fund Finance Corp | | 1.298 | | | 07/01/16 | | | 14,016 | |
| | 30,000,000 | | | | | Florida Hurricane Catastrophe Fund Finance Corp | | 2.107 | | | 07/01/18 | | | 29,283 | |
| | 3,500,000 | | | | | Maine Municipal Bond Bank | | 1.708 | | | 06/01/16 | | | 3,501 | |
| | 8,800,000 | | | | | New York State Urban Development Corp | | 0.550 | | | 03/15/16 | | | 8,725 | |
| | 8,800,000 | | | | | New York State Urban Development Corp | | 1.350 | | | 03/15/18 | | | 8,600 | |
| | 2,000,000 | | | | | Permanent University Fund | | 1.439 | | | 07/01/17 | | | 1,988 | |
| | 2,625,000 | | | | | Permanent University Fund | | 1.730 | | | 07/01/18 | | | 2,580 | |
| | 4,720,000 | | | | | Permanent University Fund | | 1.880 | | | 07/01/19 | | | 4,538 | |
| | 2,320,000 | | | | | Permanent University Fund | | 2.258 | | | 07/01/20 | | | 2,209 | |
| | 2,160,000 | | | | | Permanent University Fund | | 2.408 | | | 07/01/21 | | | 2,040 | |
| | 2,750,000 | | | �� | | Permanent University Fund | | 2.508 | | | 07/01/22 | | | 2,571 | |
| | 2,855,000 | | | | | Permanent University Fund | | 2.608 | | | 07/01/23 | | | 2,635 | |
| | 3,250,000 | | | | | Permanent University Fund | | 2.708 | | | 07/01/24 | | | 2,963 | |
| | 2,335,000 | | | | | Permanent University Fund | | 2.808 | | | 07/01/25 | | | 2,119 | |
| | 3,775,000 | | | | | Permanent University Fund | | 2.908 | | | 07/01/26 | | | 3,386 | |
| | 4,000,000 | | | | | Permanent University Fund | | 3.008 | | | 07/01/27 | | | 3,562 | |
| | 18,535,000 | | | | | Permanent University Fund | | 3.575 | | | 07/01/32 | | | 15,714 | |
| | 12,300,000 | | | | | State of California | | 0.850 | | | 02/01/15 | | | 12,312 | |
| | 9,000,000 | | | | | State of California | | 5.450 | | | 04/01/15 | | | 9,542 | |
| | 15,625,000 | | | | | State of California | | 1.050 | | | 02/01/16 | | | 15,667 | |
| | 11,370,000 | | | | | State of California | | 5.950 | | | 04/01/16 | | | 12,589 | |
| | 2,915,000 | | | | | State of Georgia | | 1.750 | | | 07/01/19 | | | 2,817 | |
| | 3,060,000 | | | | | State of Georgia | | 2.000 | | | 07/01/20 | | | 2,918 | |
| | 3,215,000 | | | | | State of Georgia | | 2.150 | | | 07/01/21 | | | 3,023 | |
| | 3,905,000 | | | | | State of Georgia | | 2.750 | | | 07/01/25 | | | 3,461 | |
| | 4,100,000 | | | | | State of Georgia | | 2.850 | | | 07/01/26 | | | 3,584 | |
| | 4,305,000 | | | | | State of Georgia | | 2.950 | | | 07/01/27 | | | 3,730 | |
| | 4,520,000 | | | | | State of Georgia | | 3.050 | | | 07/01/28 | | | 3,906 | |
| | 3,245,000 | | | | | State of Georgia | | 3.150 | | | 07/01/29 | | | 2,793 | |
| | 14,385,000 | | | | | State of Illinois | | 4.511 | | | 03/01/15 | | | 14,907 | |
| | 12,500,000 | | | | | State of Illinois | | 2.000 | | | 06/15/15 | | | 12,727 | |
| | 12,500,000 | | | | | State of Illinois | | 0.750 | | | 06/15/16 | | | 12,359 | |
| | 19,760,000 | | | | | State of Illinois | | 4.833 | | | 02/01/17 | | | 21,038 | |
| | 12,500,000 | | | | | State of Illinois | | 1.750 | | | 06/15/17 | | | 12,546 | |
| 8,000,000 | | | | | State of Illinois | | 4.350 | | | 06/01/18 | | | 8,300 | |
| | 7,500,000 | | | | | State of Illinois | | 2.000 | | | 06/15/18 | | �� | 7,420 | |
| | 7,500,000 | | | | | State of Illinois | | 2.000 | | | 06/15/19 | | | 7,232 | |
| | 7,160,000 | | | | | State of Illinois | | 5.463 | | | 02/01/20 | | | 7,598 | |
| | 12,500,000 | | | | | State of Illinois | | 1.930 | | | 06/15/20 | | | 11,645 | |
| | 12,500,000 | | | | | State of Illinois | | 2.250 | | | 06/15/21 | | | 11,541 | |
| | 10,000,000 | | | | | State of Illinois | | 4.310 | | | 04/01/23 | | | 9,109 | |
| | 11,535,000 | | | | | State of Illinois | | 4.610 | | | 04/01/25 | | | 10,462 | |
COLLEGE RETIREMENT EQUITIES FUND - Bond Market Account
| | | | | | | | | | | MATURITY | | VALUE | |
| PRINCIPAL | | | | | ISSUER | | RATE | | DATE | | (000) | |
| $ | 9,350,000 | | | | | State of Illinois | | 4.760 | % | | 04/01/26 | | $ | 8,412 | |
| | 12,500,000 | | | | | State of Illinois | | 3.150 | | | 06/15/26 | | | 10,795 | |
| | 13,880,000 | | | | | State of Illinois | | 4.910 | | | 04/01/27 | | | 12,437 | |
| | 12,500,000 | | | | | State of Illinois | | 3.250 | | | 06/15/27 | | | 10,695 | |
| | 8,115,000 | | | | | State of Illinois | | 5.010 | | | 04/01/28 | | | 7,222 | |
| | 20,870,000 | | | | | State of Michigan | | 3.500 | | | 05/15/30 | | | 17,733 | |
| | 21,640,000 | | | | | State of Michigan | | 3.600 | | | 05/15/31 | | | 18,421 | |
| | 22,455,000 | | | | | State of Michigan | | 3.700 | | | 05/15/32 | | | 19,193 | |
| | 13,515,000 | | | | | University of California | | 1.296 | | | 05/15/18 | | | 13,023 | |
| | 60,000,000 | | | | | University of California | | 1.796 | | | 07/01/19 | | | 57,670 | |
| | 11,735,000 | | | | | University of California | | 1.995 | | | 05/15/20 | | | 10,979 | |
| | 4,500,000 | | | | | University of California | | 2.300 | | | 05/15/21 | | | 4,156 | |
| | 6,000,000 | | | | | University of California | | 2.570 | | | 05/15/22 | | | 5,497 | |
| | | | | | | TOTAL MUNICIPAL BONDS | | | | | | | | 556,384 | |
| | | | | | | | | | | | | | | | |
| U.S. TREASURY SECURITIES - 13.7% | | | | | | | | | |
| | 22,000,000 | | | | | United States Treasury Bond | | 6.375 | | | 08/15/27 | | | 29,212 | |
| | 49,175,000 | | | | | United States Treasury Bond | | 5.250 | | | 02/15/29 | | | 59,194 | |
| | 45,661,000 | | | | | United States Treasury Bond | | 5.375 | | | 02/15/31 | | | 55,956 | |
| | 677,000 | | | | | United States Treasury Bond | | 4.500 | | | 02/15/36 | | | 753 | |
| | 19,135,000 | | | | | United States Treasury Bond | | 4.375 | | | 05/15/41 | | | 20,761 | |
| | 16,434,000 | | | | | United States Treasury Bond | | 3.750 | | | 08/15/41 | | | 16,021 | |
| | 150,570,000 | | | | | United States Treasury Bond | | 3.625 | | | 08/15/43 | | | 142,195 | |
| | 15,000,000 | | | | | United States Treasury Note | | 0.250 | | | 02/28/14 | | | 15,003 | |
| | 60,000,000 | | | | | United States Treasury Note | | 0.250 | | | 03/31/14 | | | 60,023 | |
| | 6,050,000 | | | | | United States Treasury Note | | 0.250 | | | 05/31/14 | | | 6,054 | |
| | 35,905,000 | | | | | United States Treasury Note | | 0.250 | | | 11/30/14 | | | 35,937 | |
| | 50,485,000 | | | | | United States Treasury Note | | 0.125 | | | 12/31/14 | | | 50,469 | |
| | 175,415,000 | | | | | United States Treasury Note | | 0.250 | | | 01/31/15 | | | 175,559 | |
| | 112,305,000 | | | | | United States Treasury Note | | 0.250 | | | 02/28/15 | | | 112,375 | |
| | 72,796,000 | | | | | United States Treasury Note | | 0.250 | | | 05/31/15 | | | 72,830 | |
| | 1,000 | | | | | United States Treasury Note | | 0.375 | | | 06/30/15 | | | 1 | |
| | 12,717,000 | | | | | United States Treasury Note | | 1.875 | | | 06/30/15 | | | 13,025 | |
| | 15,952,000 | | | | | United States Treasury Note | | 1.750 | | | 07/31/15 | | | 16,324 | |
| | 141,110,000 | | | | | United States Treasury Note | | 0.250 | | | 08/15/15 | | | 141,055 | |
| | 59,005,000 | | | | | United States Treasury Note | | 0.250 | | | 09/15/15 | | | 58,957 | |
| | 3,000,000 | | | | | United States Treasury Note | | 0.250 | | | 09/30/15 | | | 2,997 | |
| | 42,788,000 | | | | | United States Treasury Note | | 0.250 | | | 10/15/15 | | | 42,733 | |
| | 18,485,000 | | | | | United States Treasury Note | | 1.250 | | | 10/31/15 | | | 18,791 | |
| | 17,747,000 | | | | | United States Treasury Note | | 0.375 | | | 11/15/15 | | | 17,757 | |
| | 3,300,000 | | | | | United States Treasury Note | | 0.375 | | | 03/15/16 | | | 3,295 | |
| | 9,800,000 | | | | | United States Treasury Note | | 2.375 | | | 03/31/16 | | | 10,223 | |
| | 10,000,000 | | | | | United States Treasury Note | | 3.125 | | | 10/31/16 | | | 10,670 | |
| | 7,655,000 | | | | | United States Treasury Note | | 0.625 | | | 12/15/16 | | | 7,624 | |
| | 17,100,000 | | | l | | United States Treasury Note | | 2.250 | | | 07/31/18 | | | 17,628 | |
| 80,466,900 | | | | | United States Treasury Note | | 1.375 | | | 09/30/18 | | | 79,486 | |
| | 10,365,000 | | | | | United States Treasury Note | | 1.750 | | | 10/31/18 | | | 10,410 | |
COLLEGE RETIREMENT EQUITIES FUND - Bond Market Account
| | | | | | | | | | | MATURITY | | VALUE | |
| PRINCIPAL | | | | | ISSUER | | RATE | | DATE | | (000) | |
| $ | 47,161,600 | | | | | United States Treasury Note | | 1.250 | % | | 11/30/18 | | $ | 46,152 | |
| | 5,625,000 | | | | | United States Treasury Note | | 1.375 | | | 02/28/19 | | | 5,509 | |
| | 5,550,000 | | | | | United States Treasury Note | | 1.000 | | | 06/30/19 | | | 5,278 | |
| | 3,870,000 | | | | | United States Treasury Note | | 1.250 | | | 10/31/19 | | | 3,702 | |
| | 319,500 | | | | | United States Treasury Note | | 2.625 | | | 11/15/20 | | | 325 | |
| | 189,872,000 | | | | | United States Treasury Note | | 8.000 | | | 11/15/21 | | | 263,744 | |
| | 110,195,000 | | | | | United States Treasury Note | | 2.750 | | | 11/15/23 | | | 107,802 | |
| | 50,000,000 | | | | | United States Treasury Note | | 3.750 | | | 11/15/43 | | | 48,328 | |
| | | | | | | TOTAL U.S. TREASURY SECURITIES | | | | | | | | 1,784,158 | |
| | | | | | | | | | | | | | | | |
| | | | | | | TOTAL GOVERNMENT BONDS | | | | | | | | 6,876,524 | |
| | | | | | | (Cost $6,871,939) | | | | | | | | | |
| | | | | | | | | | | | | | | | |
| STRUCTURED ASSETS - 13.2% | | | | | | | | | |
| | | | | | | | | | | | | | | | |
| ASSET BACKED - 9.4% | | | | | | | | | |
| | 24,500,000 | | | | | AEP Texas Central Transition Funding LLC | | 1.976 | | | 06/01/21 | | | 24,085 | |
| | | | | | | Series - 2012 1 (Class A2) | | | | | | | | | |
| | 12,183,883 | | | | | Ally Auto Receivables Trust | | 0.520 | | | 05/20/15 | | | 12,182 | |
| | | | | | | Series - 2013 SN1 (Class A2) | | | | | | | | | |
| | 52,000,000 | | | | | Ally Auto Receivables Trust | | 0.540 | | | 07/15/16 | | | 52,002 | |
| | | | | | | Series - 2013 2 (Class A2A) | | | | | | | | | |
| | 5,000,000 | | | g | | Ally Auto Receivables Trust | | 1.760 | | | 02/15/17 | | | 5,064 | |
| | | | | | | Series - 2012 2 (Class B) | | | | | | | | | |
| | 10,000,000 | | | g | | Ally Auto Receivables Trust | | 2.260 | | | 07/16/18 | | | 10,174 | |
| | | | | | | Series - 2012 2 (Class C) | | | | | | | | | |
| | 10,000,000 | | | g | | Ally Master Owner Trust | | 4.250 | | | 04/15/17 | | | 10,390 | |
| | | | | | | Series - 2010 2 (Class A) | | | | | | | | | |
| | 24,000,000 | | | | | Ally Master Owner Trust | | 1.000 | | | 02/15/18 | | | 23,981 | |
| | | | | | | Series - 2013 1 (Class A2) | | | | | | | | | |
| | 39,753,000 | | | | | Ally Master Owner Trust | | 1.720 | | | 07/15/19 | | | 39,845 | |
| | | | | | | Series - 2012 4 (Class A) | | | | | | | | | |
| | 8,710,000 | | | | | Ally Master Owner Trust | | 1.540 | | | 09/15/19 | | | 8,648 | |
| | | | | | | Series - 2012 5 (Class A) | | | | | | | | | |
| | 7,223,000 | | | | | AmeriCredit Automobile Receivables Trust | | 3.190 | | | 10/12/16 | | | 7,355 | |
| | | | | | | Series - 2011 2 (Class C) | | | | | | | | | |
| | 6,335,000 | | | | | AmeriCredit Automobile Receivables Trust | | 1.590 | | | 07/10/17 | | | 6,389 | |
| | | | | | | Series - 2012 3 (Class B) | | | | | | | | | |
| | 10,373,000 | | | | | AmeriCredit Automobile Receivables Trust | | 1.690 | | | 11/08/18 | | | 10,357 | |
| | | | | | | Series - 2012 5 (Class C) | | | | | | | | | |
| | 5,500,000 | | | | | AmeriCredit Automobile Receivables Trust | | 1.570 | | | 01/08/19 | | | 5,442 | |
| | | | | | | Series - 2013 1 (Class C) | | | | | | | | | |
| | 74,236 | | | g | | Asset Backed Funding Corp NIM Trust | | 5.900 | | | 07/26/35 | | | 0 | ^ |
| | | | | | | Series - 2006 WMC1 (Class N1) | | | | | | | | | |
| | 6,710,000 | | | g | | Avis Budget Rental Car Funding AESOP LLC | | 2.370 | | | 11/20/14 | | | 6,786 | |
| | | | | | | Series - 2011 2A (Class A) | | | | | | | | | |
| | 4,000,000 | | | g | | Avis Budget Rental Car Funding AESOP LLC | | 6.740 | | | 05/20/16 | | | 4,235 | |
| | | | | | | Series - 2010 3A (Class B) | | | | | | | | | |
COLLEGE RETIREMENT EQUITIES FUND - Bond Market Account
| | | | | | | | | | | MATURITY | | VALUE | |
| PRINCIPAL | | | | | ISSUER | | RATE | | DATE | | (000) | |
| $ | 700,000 | | | g | | Avis Budget Rental Car Funding AESOP LLC | | 3.241 | % | | 08/20/16 | | $ | 717 | |
| | | | | | | Series - 2012 1A (Class B) | | | | | | | | | |
| | 5,500,000 | | | g | | Avis Budget Rental Car Funding AESOP LLC | | 4.740 | | | 11/20/17 | | | 5,866 | |
| | | | | | | Series - 2011 3A (Class B) | | | | | | | | | |
| 11,125,000 | | | g | | Avis Budget Rental Car Funding AESOP LLC | | 4.720 | | | 02/20/18 | | | 11,881 | |
| | | | | | | Series - 2011 5A (Class B) | | | | | | | | | |
| | 4,890,000 | | | g | | Avis Budget Rental Car Funding AESOP LLC | | 3.887 | | | 05/20/18 | | | 5,102 | |
| | | | | | | Series - 2012 2A (Class B) | | | | | | | | | |
| | 11,790,000 | | | g | | Avis Budget Rental Car Funding AESOP LLC | | 1.920 | | | 09/20/19 | | | 11,565 | |
| | | | | | | Series - 2013 1A (Class A) | | | | | | | | | |
| | 50,000,000 | | | g | | Avis Budget Rental Car Funding AESOP LLC | | 2.970 | | | 02/20/20 | | | 50,952 | |
| | | | | | | Series - 2013 2A (Class A) | | | | | | | | | |
| | 3,094,725 | | | i | | Bear Stearns Asset Backed Securities Trust | | 0.905 | | | 11/25/39 | | | 3,039 | |
| | | | | | | Series - 2005 SD3 (Class 2A1) | | | | | | | | | |
| | 2,900,000 | | | | | Capital Auto Receivables Asset Trust | | 1.290 | | | 04/20/18 | | | 2,870 | |
| | | | | | | Series - 2013 1 (Class B) | | | | | | | | | |
| | 3,175,000 | | | | | Capital Auto Receivables Asset Trust | | 1.740 | | | 10/22/18 | | | 3,135 | |
| | | | | | | Series - 2013 1 (Class C) | | | | | | | | | |
| | 30,000,000 | | | | | CarMax Auto Owner Trust | | 0.520 | | | 11/15/16 | | | 30,004 | |
| | | | | | | Series - 2013 4 (Class A2) | | | | | | | | | |
| | 21,000,000 | | | | | CarMax Auto Owner Trust | | 0.800 | | | 07/16/18 | | | 20,968 | |
| | | | | | | Series - 2013 4 (Class A3) | | | | | | | | | |
| | 1,180,137 | | | i | | Chase Funding Mortgage Loan Asset-Backed Certificates | | 5.700 | | | 02/25/35 | | | 882 | |
| | | | | | | Series - 2004 2 (Class 1M2) | | | | | | | | | |
| | 1,737,361 | | | i | | CIT Group Home Equity Loan Trust | | 6.200 | | | 02/25/30 | | | 1,732 | |
| | | | | | | Series - 2002 1 (Class AF6) | | | | | | | | | |
| | 40,000,000 | | | | | Citibank Credit Card Issuance Trust | | 0.730 | | | 02/07/18 | | | 39,965 | |
| | | | | | | Series - 2013 A10 (Class A10) | | | | | | | | | |
| | 18,786,250 | | | g | | CKE Restaurant Holdings, Inc | | 4.474 | | | 03/20/43 | | | 18,765 | |
| | | | | | | Series - 2013 1A (Class A2) | | | | | | | | | |
| | 385,349 | | | i | | Countrywide Asset-Backed Certificates | | 0.985 | | | 05/25/36 | | | 383 | |
| | | | | | | Series - 2004 AB2 (Class A3) | | | | | | | | | |
| | 973,183 | | | g,i | | Credit-Based Asset Servicing and Securitization LLC | | 6.159 | | | 12/25/36 | | | 980 | |
| | | | | | | Series - 2007 MX1 (Class A1) | | | | | | | | | |
| | 5,525,000 | | | g,i | | DB/UBS Mortgage Trust | | 5.557 | | | 11/10/46 | | | 5,961 | |
| | | | | | | Series - 2011 LC1A (Class C) | | | | | | | | | |
| | 73,405,000 | | | | | Discover Card Execution Note Trust | | 0.810 | | | 08/15/17 | | | 73,662 | |
| | | | | | | Series - 2012 A1 (Class A1) | | | | | | | | | |
| | 134,080,506 | | | g | | Dominos Pizza Master Issuer LLC | | 5.216 | | | 01/25/42 | | | 142,117 | |
| | | | | | | Series - 2012 1A (Class A2) | | | | | | | | | |
| | 10,000,000 | | | g | | Enterprise Fleet Financing LLC | | 0.680 | | | 09/20/18 | | | 9,989 | |
| | | | | | | Series - 2013 1 (Class A2) | | | | | | | | | |
| | 2,098,608 | | | g,i | | Flagstar Home Equity Loan Trust | | 5.781 | | | 01/25/35 | | | 2,098 | |
| | | | | | | Series - 2007 1A (Class AF3) | | | | | | | | | |
| | 15,500,000 | | | | | Ford Credit Auto Lease Trust | | 0.590 | | | 01/15/16 | | | 15,506 | |
| | | | | | | Series - 2013 B (Class A2A) | | | | | | | | | |
| | 2,725,000 | | | | | Ford Credit Auto Owner Trust | | 3.210 | | | 07/15/17 | | | 2,810 | |
| | | | | | | Series - 2011 A (Class D) | | | | | | | | | |
COLLEGE RETIREMENT EQUITIES FUND - Bond Market Account
| | | | | | | | | | | MATURITY | | VALUE | |
| PRINCIPAL | | | | | ISSUER | | RATE | | DATE | | (000) | |
| $ | 5,250,000 | | | | | Ford Credit Auto Owner Trust | | 1.150 | % | | 07/15/18 | | $ | 5,192 | |
| | | | | | | Series - 2013 A (Class B) | | | | | | | | | |
| | 5,820,000 | | | | | Ford Credit Auto Owner Trust | | 1.110 | | | 10/15/18 | | | 5,830 | |
| | | | | | | Series - 2013 B (Class B) | | | | | | | | | |
| | 6,000,000 | | | | | Ford Credit Auto Owner Trust | | 1.360 | | | 10/15/18 | | | 5,958 | |
| | | | | | | Series - 2013 A (Class C) | | | | | | | | | |
| | 5,595,000 | | | | | Ford Credit Auto Owner Trust | | 2.430 | | | 01/15/19 | | | 5,746 | |
| | | | | | | Series - 2012 C (Class D) | | | | | | | | | |
| 12,861,000 | | | | | Ford Credit Floorplan Master | | 0.850 | | | 01/15/18 | | | 12,863 | |
| | | | | | | Series - 0 1 (Class A1) | | | | | | | | | |
| | 16,190,000 | | | | | Ford Credit Floorplan Master | | 1.880 | | | 09/15/18 | | | 16,330 | |
| | | | | | | Series - 2013 5 (Class B) | | | | | | | | | |
| | 2,330,000 | | | g | | Hertz Vehicle Financing LLC | | 5.020 | | | 02/25/15 | | | 2,340 | |
| | | | | | | Series - 2010 1A (Class B1) | | | | | | | | | |
| | 3,980,000 | | | g | | Hertz Vehicle Financing LLC | | 2.200 | | | 03/25/16 | | | 4,031 | |
| | | | | | | Series - 2011 1A (Class A1) | | | | | | | | | |
| | 38,815,000 | | | g | | Hertz Vehicle Financing LLC | | 5.290 | | | 03/25/16 | | | 40,589 | |
| | | | | | | Series - 2009 2A (Class A2) | | | | | | | | | |
| | 41,885,000 | | | g | | Hertz Vehicle Financing LLC | | 5.930 | | | 03/25/16 | | | 43,652 | |
| | | | | | | Series - 0 2A (Class B2) | | | | | | | | | |
| | 14,315,000 | | | g | | Hertz Vehicle Financing LLC | | 3.740 | | | 02/25/17 | | | 15,052 | |
| | | | | | | Series - 2010 1A (Class A2) | | | | | | | | | |
| | 5,000,000 | | | g | | Hertz Vehicle Financing LLC | | 1.860 | | | 08/25/17 | | | 4,962 | |
| | | | | | | Series - 2013 1A (Class B1) | | | | | | | | | |
| | 15,000,000 | | | g | | Hertz Vehicle Financing LLC | | 1.830 | | | 08/25/19 | | | 14,692 | |
| | | | | | | Series - 2013 1A (Class A2) | | | | | | | | | |
| | 13,500,000 | | | g | | Hertz Vehicle Financing LLC | | 2.480 | | | 08/25/19 | | | 13,170 | |
| | | | | | | Series - 2013 1A (Class B2) | | | | | | | | | |
| | 69,108,290 | | | | | Hyundai Auto Receivables Trust | | 0.620 | | | 09/15/16 | | | 69,203 | |
| | | | | | | Series - 2012 B (Class A3) | | | | | | | | | |
| | 15,000,000 | | | | | Hyundai Auto Receivables Trust | | 1.130 | | | 09/17/18 | | | 14,769 | |
| | | | | | | Series - 2013 A (Class B) | | | | | | | | | |
| | 3,167,940 | | | i | | Irwin Home Equity Corp | | 0.545 | | | 02/25/34 | | | 2,987 | |
| | | | | | | Series - 2005 A (Class A3) | | | | | | | | | |
| | 7,847,926 | | | g | | JG Wentworth XXII LLC | | 3.820 | | | 12/15/48 | | | 8,162 | |
| | | | | | | Series - 2010 3A (Class A) | | | | | | | | | |
| | 4,392,418 | | | i | | Lehman XS Trust | | 0.415 | | | 02/25/36 | | | 3,995 | |
| | | | | | | Series - 2006 1 (Class 1A1) | | | | | | | | | |
| | 16,011,608 | | | | | Lehman XS Trust | | 6.500 | | | 06/25/46 | | | 12,299 | |
| | | | | | | Series - 2006 13 (Class 2A1) | | | | | | | | | |
| | 467,708 | | | i | | Long Beach Mortgage Loan Trust | | 0.915 | | | 02/25/35 | | | 466 | |
| | | | | | | Series - 2005 1 (Class M1) | | | | | | | | | |
| | 26,000,000 | | | | | Nissan Auto Lease Trust | | 0.570 | | | 01/15/16 | | | 25,999 | |
| | | | | | | Series - 2013 B (Class A2A) | | | | | | | | | |
| | 25,000,000 | | | | | Nissan Auto Lease Trust | | 0.740 | | | 10/15/18 | | | 24,994 | |
| | | | | | | Series - 2013 A (Class A4) | | | | | | | | | |
| | 1,812,845 | | | i | | Park Place Securities, Inc | | 1.110 | | | 09/25/34 | | | 1,803 | |
| | | | | | | Series - 2004 WHQ1 (Class M1) | | | | | | | | | |
COLLEGE RETIREMENT EQUITIES FUND - Bond Market Account
| | | | | | | | | | | MATURITY | | VALUE | |
| PRINCIPAL | | | | | ISSUER | | RATE | | DATE | | (000) | |
| $ | 31,610 | | | i | | Renaissance Home Equity Loan Trust | | 1.045 | % | | 08/25/33 | | $ | 30 | |
| | | | | | | Series - 2003 2 (Class A) | | | | | | | | | |
| | 219,131 | | | i | | Residential Asset Securities Corp | | 6.489 | | | 10/25/30 | | | 219 | |
| | | | | | | Series - 2001 KS2 (Class AI6) | | | | | | | | | |
| | 1,354,053 | | | i | | Residential Asset Securities Corp | | 0.595 | | | 04/25/35 | | | 1,341 | |
| | | | | | | Series - 2005 KS3 (Class M3) | | | | | | | | | |
| | 7,260,407 | | | | | Residential Funding Mortgage Securities II, Inc | | 5.500 | | | 08/25/25 | | | 7,417 | |
| | | | | | | Series - 2006 HI5 (Class A3) | | | | | | | | | |
| | 2,076,585 | | | i | | Residential Funding Mortgage Securities II, Inc | | 5.450 | | | 08/25/34 | | | 2,146 | |
| | | | | | | Series - 2005 HI1 (Class A5) | | | | | | | | | |
| | 1,688,215 | | | | | Residential Funding Mortgage Securities II, Inc | | 5.960 | | | 02/25/36 | | | 1,705 | |
| | | | | | | Series - 2006 HI3 (Class A3) | | | | | | | | | |
| | 2,500,000 | | | i | | Residential Funding Mortgage Securities II, Inc | | 6.010 | | | 02/25/36 | | | 2,552 | |
| | | | | | | Series - 2006 HI1 (Class M1) | | | | | | | | | |
| 350,000 | | | i | | Residential Funding Mortgage Securities II, Inc | | 6.060 | | | 02/25/36 | | | 369 | |
| | | | | | | Series - 2006 HI1 (Class M2) | | | | | | | | | |
| | 4,000,000 | | | | | Santander Drive Auto Receivables Trust | | 1.760 | | | 01/15/19 | | | 3,968 | |
| | | | | | | Series - 2013 1 (Class C) | | | | | | | | | |
| | 15,000,000 | | | g | | Santander Drive Auto Receivables Trust | | 1.890 | | | 10/15/19 | | | 15,097 | |
| | | | | | | Series - 2013 A (Class B) | | | | | | | | | |
| | 1,650,769 | | | i | | Securitized Asset Backed Receivables LLC | | 0.465 | | | 10/25/35 | | | 1,610 | |
| | | | | | | Series - 2006 OP1 (Class A2C) | | | | | | | | | |
| | 754,991 | | | g | | Sierra Receivables Funding Co LLC | | 1.590 | | | 11/20/29 | | | 751 | |
| | | | | | | Series - 2013 1A (Class A) | | | | | | | | | |
| | 20,382,330 | | | g | | Sierra Timeshare 2013-3 Receivables Funding LLC | | 2.700 | | | 10/20/30 | | | 20,308 | |
| | | | | | | Series - 2013 3A (Class B) | | | | | | | | | |
| | 41,823,000 | | | g | | SLM Student Loan Trust | | 3.740 | | | 02/15/29 | | | 43,621 | |
| | | | | | | Series - 2011 B (Class A2) | | | | | | | | | |
| | 1,500,000 | | | g | | SLM Student Loan Trust | | 3.830 | | | 01/17/45 | | | 1,556 | |
| | | | | | | Series - 2012 A (Class A2) | | | | | | | | | |
| | 2,640,942 | | | i | | Soundview Home Equity Loan Trust | | 0.465 | | | 11/25/35 | | | 2,605 | |
| | | | | | | Series - 2005 OPT3 (Class A4) | | | | | | | | | |
| | 482,681 | | | i | | Structured Asset Investment Loan Trust | | 0.765 | | | 05/25/35 | | | 481 | |
| | | | | | | Series - 2005 4 (Class M1) | | | | | | | | | |
| | 9,698,508 | | | g,i | | Structured Asset Securities Corp | | 0.385 | | | 10/25/36 | | | 9,357 | |
| | | | | | | Series - 2006 GEL4 (Class A2) | | | | | | | | | |
| | 10,000,000 | | | g | | Volvo Financial Equipment LLC | | 0.740 | | | 03/15/17 | | | 9,992 | |
| | | | | | | Series - 2013 1A (Class A3) | | | | | | | | | |
| | 8,585,000 | | | g | | Vornado DP LLC | | 5.280 | | | 09/13/28 | | | 9,283 | |
| | | | | | | Series - 2010 VNO (Class C) | | | | | | | | | |
| | 900,613 | | | g,m | | Wachovia Amortization Controlled Heloc NIM | | 5.683 | | | 08/12/47 | | | 905 | |
| | | | | | | Series - 2006 N1 (Class N1) | | | | | | | | | |
| | 1,788,216 | | | g,i | | Wachovia Loan Trust | | 0.525 | | | 05/25/35 | | | 1,673 | |
| | | | | | | Series - 2005 SD1 (Class A) | | | | | | | | | |
| | 1,327,061 | | | i | | Wells Fargo Home Equity Trust | | 0.305 | | | 07/25/36 | | | 1,314 | |
| | | | | | | Series - 2006 2 (Class A3) | | | | | | | | | |
COLLEGE RETIREMENT EQUITIES FUND - Bond Market Account
| | | | | | | | | | | MATURITY | | VALUE | |
| PRINCIPAL | | | | | ISSUER | | RATE | | DATE | | (000) | |
| $ | 18,900,000 | | | | | World Financial Network Credit Card Master Trust | | 0.910 | % | | 03/16/20 | | $ | 18,779 | |
| | | | | | | Series - 2013 B (Class A) | | | | | | | | | |
| | 25,000,000 | | | | | World Omni Auto Receivables Trust | | 0.480 | | | 11/15/16 | | | 25,000 | |
| | | | | | | Series - 2013 B (Class A2) | | | | | | | | | |
| | | | | | | TOTAL ASSET BACKED | | | | | | | | 1,225,047 | |
| | | | | | | | | | | | | | | | |
| OTHER MORTGAGE BACKED - 3.8% | | | | | | | | | |
| | 17,295,000 | | | | | Banc of America Commercial Mortgage Trust | | 5.390 | | | 10/10/45 | | | 18,744 | |
| | | | | | | Series - 2006 6 (Class AM) | | | | | | | | | |
| | 24,070,000 | | | i | | Banc of America Commercial Mortgage Trust | | 6.207 | | | 02/10/51 | | | 27,454 | |
| | | | | | | Series - 2008 1 (Class A4) | | | | | | | | | |
| | 6,800,000 | | | i | | Bear Stearns Commercial Mortgage Securities | | 5.582 | | | 09/11/41 | | | 7,424 | |
| | | | | | | Series - 2006 PW13 (Class AM) | | | | | | | | | |
| | 6,765,000 | | | i | | Bear Stearns Commercial Mortgage Securities | | 5.959 | | | 09/11/42 | | | 7,233 | |
| | | | | | | Series - 2007 T28 (Class AJ) | | | | | | | | | |
| | 8,245,000 | | | | | Bear Stearns Commercial Mortgage Securities | | 5.363 | | | 02/11/44 | | | 8,490 | |
| | | | | | | Series - 2007 PW15 (Class AM) | | | | | | | | | |
| | 188,665 | | | g,i | | Citigroup Commercial Mortgage Trust | | 0.307 | | | 04/15/22 | | | 188 | |
| | | | | | | Series - 2007 FL3A (Class A2) | | | | | | | | | |
| | 5,870,000 | | | | | Citigroup Commercial Mortgage Trust | | 1.813 | | | 09/10/45 | | | 5,882 | |
| | | | | | | Series - 2012 GC8 (Class A2) | | | | | | | | | |
| 15,000,000 | | | i | | COBALT CMBS Commercial Mortgage Trust | | 5.526 | | | 04/15/47 | | | 16,582 | |
| | | | | | | Series - 2007 C2 (Class AMFX) | | | | | | | | | |
| | 14,000,000 | | | i | | COMM Mortgage Trust | | 5.752 | | | 06/10/46 | | | 15,224 | |
| | | | | | | Series - 2006 C7 (Class A4) | | | | | | | | | |
| | 9,330,000 | | | i | | Commercial Mortgage Pass Through Certificates | | 5.650 | | | 12/10/49 | | | 10,397 | |
| | | | | | | Series - 2007 C9 (Class AM) | | | | | | | | | |
| | 3,160,000 | | | i | | Commercial Mortgage Pass-Through Certificates | | 5.791 | | | 06/15/38 | | | 3,426 | |
| | | | | | | Series - 2006 C3 (Class AM) | | | | | | | | | |
| | 3,510,198 | | | | | Countrywide Alternative Loan Trust | | 5.500 | | | 08/25/16 | | | 3,561 | |
| | | | | | | Series - 2004 30CB (Class 1A15) | | | | | | | | | |
| | 2,625,648 | | | | | Countrywide Home Loan Mortgage Pass Through Trust | | 5.250 | | | 02/25/16 | | | 2,616 | |
| | | | | | | Series - 2005 6 (Class 1A10) | | | | | | | | | |
| | 265,285 | | | | | Countrywide Home Loan Mortgage Pass Through Trust | | 5.250 | | | 05/25/35 | | | 265 | |
| | | | | | | Series - 2005 12 (Class 1A5) | | | | | | | | | |
| | 990,000 | | | i | | Credit Suisse First Boston Mortgage Securities Corp | | 5.100 | | | 08/15/38 | | | 1,019 | |
| | | | | | | Series - 2005 C5 (Class C) | | | | | | | | | |
| | 2,000,000 | | | i | | Credit Suisse First Boston Mortgage Securities Corp | | 5.100 | | | 08/15/38 | | | 2,079 | |
| | | | | | | Series - 2005 C5 (Class B) | | | | | | | | | |
| | 2,964,767 | | | g,i | | Credit Suisse Mortgage Capital Certificates | | 0.347 | | | 04/15/22 | | | 2,958 | |
| | | | | | | Series - 2007 TF2A (Class A1) | | | | | | | | | |
| | 11,500,000 | | | g | | Credit Suisse Mortgage Capital Certificates | | 5.626 | | | 05/15/23 | | | 12,552 | |
| | | | | | | Series - 2006 OMA (Class D) | | | | | | | | | |
| | 12,935,000 | | | | | Credit Suisse Mortgage Capital Certificates | | 5.509 | | | 09/15/39 | | | 13,889 | |
| | | | | | | Series - 2006 C4 (Class AM) | | | | | | | | | |
| | 11,235,000 | | | g | | Credit Suisse Mortgage Capital Certificates | | 5.383 | | | 02/15/40 | | | 11,750 | |
| | | | | | | Series - 2009 RR1 (Class A3C) | | | | | | | | | |
COLLEGE RETIREMENT EQUITIES FUND - Bond Market Account
| | | | | | | | | | | MATURITY | | VALUE | |
| PRINCIPAL | | | | | ISSUER | | RATE | | DATE | | (000) | |
| $ | 3,305,000 | | | g | | GS Mortgage Securities Corp II | | 2.933 | % | | 06/05/31 | | $ | 3,302 | |
| | | | | | | Series - 2012 SHOP (Class A) | | | | | | | | | |
| | 28,050,000 | | | i | | GS Mortgage Securities Corp II | | 5.622 | | | 04/10/38 | | | 30,354 | |
| | | | | | | Series - 2006 GG6 (Class AM) | | | | | | | | | |
| | 5,910,000 | | | g,i | | GS Mortgage Securities Corp II | | 5.225 | | | 12/10/43 | | | 6,381 | |
| | | | | | | Series - 2010 C2 (Class B) | | | | | | | | | |
| | 18,861,869 | | | g | | GS Mortgage Securities Trust | | 2.059 | | | 04/10/31 | | | 18,263 | |
| | | | | | | Series - 2013 G1 (Class A1) | | | | | | | | | |
| | 4,542,265 | | | i | | HarborView Mortgage Loan Trust | | 0.386 | | | 07/19/47 | | | 3,782 | |
| | | | | | | Series - 2007 4 (Class 2A1) | | | | | | | | | |
| | 2,244,851 | | | i | | Impac CMB Trust | | 0.825 | | | 03/25/35 | | | 2,005 | |
| | | | | | | Series - 2004 11 (Class 2A1) | | | | | | | | | |
| | 6,455,000 | | | g,i | | JP Morgan Chase Commercial Mortgage Securities Corp | | 5.259 | | | 07/15/46 | | | 6,838 | |
| | | | | | | Series - 2011 C4 (Class C) | | | | | | | | | |
| | 1,965,000 | | | i | | JP Morgan Chase Commercial Mortgage Securities Corp | | 5.932 | | | 02/15/51 | | | 2,073 | |
| | | | | | | Series - 2007 C1 (Class AM) | | | | | | | | | |
| | 7,965,000 | | | i | | JP Morgan Chase Commercial Mortgage Securities Trust | | 4.911 | | | 07/15/42 | | | 7,987 | |
| | | | | | | Series - 2005 LDP2 (Class C) | | | | | | | | | |
| | 59,550,833 | | | | | JP Morgan Chase Commercial Mortgage Securities Trust | | 5.257 | | | 05/15/47 | | | 63,569 | |
| | | | | | | Series - 2006 LDP9 (Class A1A) | | | | | | | | | |
| | 2,000,000 | | | i | | JP Morgan Chase Commercial Mortgage Securities Trust | | 6.192 | | | 02/15/51 | | | 2,217 | |
| | | | | | | Series - 2007 LD12 (Class AM) | | | | | | | | | |
| | 3,350,000 | | | | | LB-UBS Commercial Mortgage Trust | | 5.378 | | | 11/15/38 | | | 3,618 | |
| | | | | | | Series - 2006 C7 (Class AM) | | | | | | | | | |
| | 3,675,000 | | | i | | LB-UBS Commercial Mortgage Trust | | 5.057 | | | 09/15/40 | | | 3,842 | |
| | | | | | | Series - 2005 C5 (Class AJ) | | | | | | | | | |
| 3,729,128 | | | i | | Merrill Lynch Mortgage Trust | | 5.107 | | | 07/12/38 | | | 3,937 | |
| | | | | | | Series - 2005 CIP1 (Class AM) | | | | | | | | | |
| | 2,210,442 | | | g,i | | Merrill Lynch Mortgage Trust | | 6.263 | | | 02/12/51 | | | 2,385 | |
| | | | | | | Series - 0 C1 (Class AJAF) | | | | | | | | | |
| | 2,205,000 | | | i | | Merrill Lynch Mortgage Trust | | 6.263 | | | 02/12/51 | | | 2,380 | |
| | | | | | | Series - 0 C1 (Class AJA) | | | | | | | | | |
| | 5,000,000 | | | i | | Merrill Lynch Mortgage Trust 2005-MCP1 | | 4.805 | | | 06/12/43 | | | 5,251 | |
| | | | | | | Series - 2005 MCP1 (Class AM) | | | | | | | | | |
| | 1,120,000 | | | g | | Morgan Stanley Capital I | | 2.695 | | | 01/11/32 | | | 1,100 | |
| | | | | | | Series - 2013 WLSR (Class A) | | | | | | | | | |
| | 2,265,000 | | | g,i | | Morgan Stanley Capital I | | 5.810 | | | 08/12/41 | | | 2,382 | |
| | | | | | | Series - 2006 T23 (Class B) | | | | | | | | | |
| | 12,300,000 | | | i | | Morgan Stanley Capital I | | 5.793 | | | 07/12/44 | | | 13,268 | |
| | | | | | | Series - 2006 HQ9 (Class AJ) | | | | | | | | | |
| | 3,550,000 | | | g,i | | Morgan Stanley Capital I | | 5.252 | | | 09/15/47 | | | 3,655 | |
| | | | | | | Series - 2011 C1 (Class D) | | | | | | | | | |
| | 1,640,841 | | | | | Residential Accredit Loans, Inc | | 4.350 | | | 03/25/34 | | | 1,668 | |
| | | | | | | Series - 2004 QS4 (Class A1) | | | | | | | | | |
| | 1,935,463 | | | | | RFMSI Trust | | 5.500 | | | 03/25/35 | | | 1,958 | |
| | | | | | | Series - 2005 S2 (Class A6) | | | | | | | | | |
| | 2,960,658 | | | g,i | | Springleaf Mortgage Loan Trust | | 2.667 | | | 09/25/57 | | | 3,025 | |
| | | | | | | Series - 2012 1A (Class A) | | | | | | | | | |
COLLEGE RETIREMENT EQUITIES FUND - Bond Market Account
| | | | | | | | | | | MATURITY | | VALUE | |
| PRINCIPAL | | | | | ISSUER | | RATE | | DATE | | (000) | |
| $ | 3,228,316 | | | g,i | | Springleaf Mortgage Loan Trust | | 2.220 | % | | 10/25/57 | | $ | 3,289 | |
| | | | | | | Series - 0 2A (Class A) | | | | | | | | | |
| | 43,250,000 | | | | | Wachovia Bank Commercial Mortgage Trust | | 5.383 | | | 12/15/43 | | | 46,537 | |
| | | | | | | Series - 2007 C30 (Class AM) | | | | | | | | | |
| | 32,660,000 | | | i | | Wachovia Bank Commercial Mortgage Trust | | 5.818 | | | 05/15/46 | | | 35,810 | |
| | | | | | | Series - 2007 C34 (Class AM) | | | | | | | | | |
| | 5,000,000 | | | i | | Wachovia Bank Commercial Mortgage Trust | | 5.969 | | | 05/15/46 | | | 5,091 | |
| | | | | | | Series - 2007 C34 (Class AJ) | | | | | | | | | |
| | 5,020,000 | | | | | Wachovia Bank Commercial Mortgage Trust | | 5.500 | | | 04/15/47 | | | 5,549 | |
| | | | | | | Series - 2007 C31 (Class A5) | | | | | | | | | |
| | 7,175,000 | | | i | | Wachovia Bank Commercial Mortgage Trust | | 5.591 | | | 04/15/47 | | | 7,812 | |
| | | | | | | Series - 2007 C31 (Class AM) | | | | | | | | | |
| | 9,500,000 | | | i | | Wachovia Bank Commercial Mortgage Trust | | 5.660 | | | 04/15/47 | | | 9,429 | |
| | | | | | | Series - 2007 C31 (Class AJ) | | | | | | | | | |
| | 7,819,290 | | | i | | WaMu Mortgage Pass-Through Certificates | | 0.515 | | | 12/25/45 | | | 6,922 | |
| | | | | | | Series - 2005 AR19 (Class A1B3) | | | | | | | | | |
| | 4,725,000 | | | g,i | | Wells Fargo Mortgage Backed Securities Trust | | 5.276 | | | 11/15/43 | | | 5,114 | |
| | | | | | | Series - 2010 C1 (Class B) | | | | | | | | | |
| | | | | | | TOTAL OTHER MORTGAGE BACKED | | | | | | | | 492,526 | |
| | | | | | | | | | | | | | | | |
| | | | | | | TOTAL STRUCTURED ASSETS | | | | | | | | 1,717,573 | |
| | | | | | | (Cost $1,720,853) | | | | | | | | | |
| | | | | | | | | | | | | | | | |
| | | | | | | TOTAL BONDS | | | | | | | | 12,761,804 | |
| | | | | | | (Cost $12,735,149) | | | | | | | | | |
| | | | | | | | | | | | | | | |
| SHARES | | | | | COMPANY | | | | | | | | | |
| PREFERRED STOCKS - 0.1% | | | | | | | | | |
| | | | | | | | | | | | | | | | |
| BANKS - 0.1% | | | | | | | | | |
| | 470,597 | | | * | | Federal Home Loan Mortgage Corp | | 8.375 | | | 12/30/49 | | | 4,221 | |
| $ | 1,527,061 | | | * | | Federal National Mortgage Association | | 8.250 | | | 12/30/49 | | | 13,362 | |
| | | | | | | TOTAL BANKS | | | | | | | | 17,583 | |
| | | | | | | TOTAL PREFERRED STOCKS | | | | | | | | 17,583 | |
| | | | | | | (Cost $49,941) | | | | | | | | | |
| | | | | | | | | | | | | | | | |
| PRINCIPAL | | | | | ISSUER | | | | | | | | | |
| SHORT-TERM INVESTMENTS - 19.9% | | | | | | | | | |
| | | | | | | | | | |
| GOVERNMENT AGENCY DEBT - 1.0% | | | | | | | | | |
| | 26,000,000 | | | | | Federal Home Loan Bank (FHLB) | | 0.085 | | | 02/19/14 | | | 25,997 | |
| | 50,000,000 | | | | | FHLB | | 0.100 | | | 03/26/14 | | | 49,995 | |
| | 8,000,000 | | | | | FHLB | | 0.035 | | | 01/17/14 | | | 8,000 | |
| | 27,500,000 | | | | | Federal Home Loan Mortgage Corp (FHLMC) | | 0.040 | | | 01/21/14 | | | 27,499 | |
| | 15,000,000 | | | w | | FHLMC | | 0.060 | | | 03/10/14 | | | 14,999 | |
| | | | | | | TOTAL GOVERNMENT AGENCY DEBT | | | | | | | | 126,490 | |
| | | | | | | | | | | | | | | | |
| TREASURY DEBT - 18.9% | | | | | | | | | |
| | 14,800,000 | | | w | | United States Treasury Bill | | 0.070 | | | 01/30/14 | | | 14,799 | |
COLLEGE RETIREMENT EQUITIES FUND - Bond Market Account
| | | | | | | | | | | MATURITY | | VALUE | |
| PRINCIPAL | | | | | ISSUER | | RATE | | DATE | | (000) | |
| $ | 66,000,000 | | | w | | United States Treasury Bill | | 0.071 | % | | 02/13/14 | | $ | 65,994 | |
| | 58,800,000 | | | w | | United States Treasury Bill | | 0.055-0.081 | | | 03/06/14 | | | 58,795 | |
| | 71,600,000 | | | w | | United States Treasury Bill | | 0.053-0.080 | | | 03/13/14 | | | 71,594 | |
| | 21,200,000 | | | w | | United States Treasury Bill | | 0.060-0.065 | | | 03/20/14 | | | 21,197 | |
| | 200,000,000 | | | w | | United States Treasury Bill | | 0.105 | | | 04/03/14 | | | 199,965 | |
| | 212,000,000 | | | w | | United States Treasury Bill | | 0.060-0.067 | | | 04/17/14 | | | 211,977 | |
| | 75,400,000 | | | w | | United States Treasury Bill | | 0.065-0.085 | | | 04/24/14 | | | 75,386 | |
| | 111,000,000 | | | w | | United States Treasury Bill | | 0.070-0.107 | | | 05/01/14 | | | 110,981 | |
| | 46,000,000 | | | w | | United States Treasury Bill | | 0.070 | | | 06/19/14 | | | 45,983 | |
| | 247,000,000 | | | w | | United States Treasury Bill | | 0.095-0.096 | | | 06/26/14 | | | 246,901 | |
| | 635,200,000 | | | w | | United States Treasury Bill | | 0.063-0.120 | | | 07/24/14 | | | 634,922 | |
| | 653,000,000 | | | w | | United States Treasury Bill | | 0.075-0.135 | | | 08/21/14 | | | 652,707 | |
| | 49,000,000 | | | w | | United States Treasury Bill | | 0.102 | | | 10/16/14 | | | 48,972 | |
| | 14,000,000 | | | w | | United States Treasury Note | | 0.250 | | | 06/30/14 | | | 14,011 | |
| | | | | | | TOTAL TREASURY DEBT | | | | | | | | 2,474,184 | |
| | | | | | | | | | | | | | | | |
| | | | | | | TOTAL SHORT-TERM INVESTMENTS | | | | | | | | 2,600,674 | |
| | | | | | | (Cost $2,600,279) | | | | | | | | | |
| | | | | | | | | | | | | | | | |
| | | | | | | TOTAL INVESTMENTS - 117.8% | | | | | | | | 15,401,061 | |
| | | | | | | (Cost $15,406,248) | | | | | | | | | |
| | | | | | | OTHER ASSETS & LIABILITIES, NET - (17.8)% | | | | | | | | (2,325,644 | ) |
| | | | | | | NET ASSETS - 100.0% | | | | | | | $ | 13,075,417 | |
| | | | | | | | |
| | * | | | | | Non-income producing. |
| | ^ | | | | | Amount represents less than $1,000. |
| | g | | | | | Security is exempt from registration under Rule 144(A) of the Securities Act of 1933 and may be resold in transactions exempt from registration to qualified institutional buyers. At December 31, 2013, the aggregate value of these securities amounted to $1,777,372,000, or 13.6% of net assets. |
| | h | | | | | All or a portion of these securities were purchased on a delayed delivery basis. |
| | i | | | | | Floating or variable rate security. Coupon rate reflects the rate at period end. |
| | l | | | | | All or a portion of these securities have been segregated by the custodian to cover collateral requirements on swap agreements. |
| | m | | | | | Indicates a security that has been deemed illiquid. |
| | w | | | | | All or a portion of these securities have been segregated by the custodian to cover collateral requirements on mortgage dollar rolls. |
| | | | | | | | |
| | | | | | | Cost amounts are in thousands. |
COLLEGE RETIREMENT EQUITIES FUND - Inflation-Linked Bond Account
COLLEGE RETIREMENT EQUITIES FUND
INFLATION-LINKED BOND ACCOUNT
SCHEDULE OF INVESTMENTS
December 31, 2013
| | | | | | | | | VALUE | |
| PRINCIPAL | | | | ISSUER | | | (000) | |
| GOVERNMENT BONDS - 99.4% | | | | | |
| | | | | | | | | | | |
| U.S. TREASURY SECURITIES - 99.4% | | | | | |
| | | | k | | United States Treasury Inflation Indexed Bonds | | | | | |
| $ | 66,438,651 | | | | 1.625%, 01/15/15 | | | $ | 68,442 | |
| | 245,516,006 | | | | 0.500%, 04/15/15 | | | | 250,906 | |
| | 196,449,244 | | | | 1.875%, 07/15/15 | | | | 207,054 | |
| | 209,998,176 | | | | 2.000%, 01/15/16 | | | | 223,796 | |
| | 408,869,160 | | | | 0.125%, 04/15/16 | | | | 419,826 | |
| | 215,781,451 | | | | 2.500%, 07/15/16 | | | | 236,753 | |
| | 173,738,576 | | | | 2.375%, 01/15/17 | | | | 191,194 | |
| | 470,893,902 | | | | 0.125%, 04/15/17 | | | | 483,990 | |
| | 142,783,298 | | | | 2.625%, 07/15/17 | | | | 160,609 | |
| | 165,059,465 | | | | 1.625%, 01/15/18 | | | | 179,386 | |
| | 188,441,465 | | | | 0.125%, 04/15/18 | | | | 192,196 | |
| | 146,872,428 | | | | 1.375%, 07/15/18 | | | | 159,184 | |
| | 144,142,775 | | | | 2.125%, 01/15/19 | | | | 160,967 | |
| | 181,585,740 | | | | 1.875%, 07/15/19 | | | | 201,773 | |
| | 220,662,387 | | | | 1.375%, 01/15/20 | | | | 236,953 | |
| | 285,555,397 | | | | 1.250%, 07/15/20 | | | | 305,500 | |
| | 355,486,697 | | | | 1.125%, 01/15/21 | | | | 373,622 | |
| | 394,623,040 | | | | 0.625%, 07/15/21 | | | | 400,573 | |
| | 336,395,061 | | | | 0.125%, 01/15/22 | | | | 323,307 | |
| | 393,064,290 | | | | 0.125%, 07/15/22 | | | | 376,513 | |
| | 215,532,570 | | | | 0.125%, 01/15/23 | | | | 203,560 | |
| | 51,185,640 | | | | 0.375%, 07/15/23 | | | | 49,366 | |
| | 266,728,666 | | | | 2.375%, 01/15/25 | | | | 306,592 | |
| | 209,851,077 | | | | 2.000%, 01/15/26 | | | | 232,312 | |
| | 163,536,428 | | | | 2.375%, 01/15/27 | | | | 188,374 | |
| | 194,994,261 | | | | 1.750%, 01/15/28 | | | | 208,766 | |
| | 170,437,542 | | | | 3.625%, 04/15/28 | | | | 225,457 | |
| | 177,214,023 | | | | 2.500%, 01/15/29 | | | | 208,254 | |
| | 166,357,959 | | | | 3.875%, 04/15/29 | | | | 227,988 | |
| | 60,871,684 | | | | 3.375%, 04/15/32 | | | | 80,983 | |
| | 84,990,763 | | | | 2.125%, 02/15/40 | | | | 95,495 | |
| | 117,747,120 | | | | 2.125%, 02/15/41 | | | | 132,300 | |
| | 234,950,918 | | | | 0.750%, 02/15/42 | | | | 188,879 | |
| | 115,812,600 | | | | 0.625%, 02/15/43 | | | | 89,049 | |
| | | | | | TOTAL U.S. TREASURY SECURITIES | | | | 7,589,919 | |
| | | | | | | | | | | |
| | | | | | TOTAL GOVERNMENT BONDS | | | | | |
| | | | | | (Cost $7,318,881) | | | | 7,589,919 | |
| | | | | | | | | | | |
| | | | | | TOTAL INVESTMENTS - 99.4% | 7,589,919 | |
| | | | | | (Cost $7,318,881) | | | | | |
| | | | | | OTHER ASSETS AND LIABILITIES, NET - 0.6% | | | | 48,191 | |
| | | | | | NET ASSETS - 100.0% | | | $ | 7,638,110 | |
| | | | | |
| | k | | Principal amount for interest accrual purposes is periodically adjusted based on changes in the Consumer Price Index. |
| | Cost amounts are in thousands. |
COLLEGE RETIREMENT EQUITIES FUND - Social Choice Account
COLLEGE RETIREMENT EQUITIES FUND
SOCIAL CHOICE ACCOUNT
SCHEDULE OF INVESTMENTS
December 31, 2013
| | | | | | | | | | | MATURITY | | VALUE | |
| PRINCIPAL | | | | | ISSUER | | RATE | | DATE | | (000) | |
| BANK LOAN OBLIGATIONS - 0.1% | | | | | | | | | |
| | | | | | | | | | | | | | | | |
| MEDIA - 0.1% | | | | | | | | | |
| $ | 9,750,000 | | | i | | Virgin Media Investment Holdings Ltd | | 3.500 | % | | 06/08/20 | | $ | 9,765 | |
| | | | | | | TOTAL MEDIA | | | | | | | | 9,765 | |
| | | | | | | | | | | | | | | | |
| | | | | | | TOTAL BANK LOAN OBLIGATIONS | | | | | | | | 9,765 | |
| | | | | | | (Cost $9,728) | | | | | | | | | |
| | | | | | | | | | | | | | | | |
| BONDS - 37.6% | | | | | | | | | |
| | | | | | | | | | | | | | | | |
| CORPORATE BONDS - 13.9% | | | | | | | | | |
| | | | | | | | | | | | | | | | |
| AUTOMOBILES & COMPONENTS - 0.2% | | | | | | | | | |
| | 2,350,000 | | | | | BorgWarner, Inc | | 4.625 | | | 09/15/20 | | | 2,484 | |
| | 10,000,000 | | | | | Ford Motor Co | | 4.750 | | | 01/15/43 | | | 9,019 | |
| | 4,500,000 | | | | | Johnson Controls, Inc | | 2.600 | | | 12/01/16 | | | 4,653 | |
| | 3,250,000 | | | | | Johnson Controls, Inc | | 5.000 | | | 03/30/20 | | | 3,550 | |
| | | | | | | TOTAL AUTOMOBILES & COMPONENTS | | | | | | | | 19,706 | |
| | | | | | | | | | | | | | | | |
| BANKS - 3.9% | | | | | | | | | |
| | 24,000,000 | | | | | Bank of America Corp | | 1.350 | | | 11/21/16 | | | 23,990 | |
| | 9,800,000 | | | g | | Bank of Nova Scotia | | 2.150 | | | 08/03/16 | | | 10,093 | |
| | 9,750,000 | | | g,i | | Bank of Tokyo-Mitsubishi UFJ Ltd | | 0.687 | | | 02/26/16 | | | 9,759 | |
| | 19,500,000 | | | | | BB&T Corp | | 2.150 | | | 03/22/17 | | | 19,715 | |
| | 7,375,000 | | | | | BB&T Corp | | 1.600 | | | 08/15/17 | | | 7,309 | |
| | 6,200,000 | | | | | BB&T Corp | | 2.050 | | | 06/19/18 | | | 6,138 | |
| | 14,000,000 | | | | | Branch Banking & Trust Co | | 1.450 | | | 10/03/16 | | | 14,131 | |
| | 7,000,000 | | | g | | Canadian Imperial Bank of Commerce | | 2.750 | | | 01/27/16 | | | 7,301 | |
| | 6,000,000 | | | | | Capital One Bank USA NA | | 3.375 | | | 02/15/23 | | | 5,578 | |
| | 9,000,000 | | | | | Capital One Financial Corp | | 2.150 | | | 03/23/15 | | | 9,149 | |
| | 9,250,000 | | | i | | Capital One Financial Corp | | 0.878 | | | 11/06/15 | | | 9,274 | |
| | 12,425,000 | | | | | Capital One Financial Corp | | 1.000 | | | 11/06/15 | | | 12,420 | |
| | 9,250,000 | | | e,i | | Capital One NA | | 0.696 | | | 03/22/16 | | | 9,241 | |
| | 9,250,000 | | | | | Capital One NA | | 1.500 | | | 03/22/18 | | | 8,995 | |
| | 10,000,000 | | | i | | Cooperatieve Centrale Raiffeisen-Boerenleenbank BA | | 0.723 | | | 03/18/16 | | | 10,037 | |
| | 8,700,000 | | | e | | Cooperatieve Centrale Raiffeisen-Boerenleenbank BA | | 1.700 | | | 03/19/18 | | | 8,592 | |
| | 7,025,000 | | | e | | Cooperatieve Centrale Raiffeisen-Boerenleenbank BA | | 3.950 | | | 11/09/22 | | | 6,807 | |
| | 7,000,000 | | | | | Cooperatieve Centrale Raiffeisen-Boerenleenbank BA | | 4.625 | | | 12/01/23 | | | 7,049 | |
| | 19,250,000 | | | | | Discover Bank | | 2.000 | | | 02/21/18 | | | 18,907 | |
| | 11,975,000 | | | | | Discover Bank | | 4.200 | | | 08/08/23 | | | 11,811 | |
| | 10,255,000 | | | | | First Niagara Financial Group, Inc | | 6.750 | | | 03/19/20 | | | 11,788 | |
| | 9,750,000 | | | | | HSBC USA, Inc | | 1.625 | | | 01/16/18 | | | 9,614 | |
| | 14,000,000 | | | e | | Huntington Bancshares, Inc | | 2.600 | | | 08/02/18 | | | 14,008 | |
COLLEGE RETIREMENT EQUITIES FUND - Social Choice Account
| | | | | | | | | | | MATURITY | | VALUE | |
| PRINCIPAL | | | | | ISSUER | | RATE | | DATE | | (000) | |
| $ | 7,325,000 | | | | | Huntington National Bank | | 1.350 | % | | 08/02/16 | | $ | 7,322 | |
| | 14,000,000 | | | | | KeyCorp | | 2.300 | | | 12/13/18 | | | 13,898 | |
| | 9,913,000 | | | | | Manufacturers & Traders Trust Co | | 6.625 | | | 12/04/17 | | | 11,476 | |
| | 19,250,000 | | | | | Manufacturers & Traders Trust Co | | 1.450 | | | 03/07/18 | | | 18,725 | |
| | 4,644,000 | | | i | | Manufacturers & Traders Trust Co | | 5.585 | | | 12/28/20 | | | 4,737 | |
| | 6,076,000 | | | i | | Manufacturers & Traders Trust Co | | 5.629 | | | 12/01/21 | | | 6,273 | |
| | 7,450,000 | | | g | | Mizuho Corporate Bank Ltd | | 1.850 | | | 03/21/18 | | | 7,261 | |
| | 3,500,000 | | | i | | National City Bank | | 0.593 | | | 12/15/16 | | | 3,470 | |
| | 9,900,000 | | | | | People’s United Financial, Inc | | 3.650 | | | 12/06/22 | | | 9,360 | |
| | 4,500,000 | | | i | | PNC Bank NA | | 0.548 | | | 01/28/16 | | | 4,506 | |
| | 8,245,000 | | | e | | PNC Bank NA | | 2.950 | | | 01/30/23 | | | 7,588 | |
| | 5,000,000 | | | | | PNC Funding Corp | | 3.625 | | | 02/08/15 | | | 5,172 | |
| | 4,750,000 | | | | | PNC Funding Corp | | 2.700 | | | 09/19/16 | | | 4,955 | |
| | 5,000,000 | | | | | PNC Funding Corp | | 5.125 | | | 02/08/20 | | | 5,616 | |
| | 14,000,000 | | | | | Regions Financial Corp | | 2.000 | | | 05/15/18 | | | 13,556 | |
| | 10,000,000 | | | | | Royal Bank of Canada | | 1.125 | | | 07/22/16 | | | 9,999 | |
| | 11,500,000 | | | | | Royal Bank of Canada | | 1.200 | | | 09/19/17 | | | 11,395 | |
| | 9,750,000 | | | | | Royal Bank of Canada | | 1.500 | | | 01/16/18 | | | 9,560 | |
| | 14,000,000 | | | e | | Royal Bank of Canada | | 2.200 | | | 07/27/18 | | | 14,057 | |
| | 9,750,000 | | | g | | Skandinaviska Enskilda Banken AB | | 1.750 | | | 03/19/18 | | | 9,551 | |
| | 14,500,000 | | | g | | Skandinaviska Enskilda Banken AB | | 1.375 | | | 05/29/18 | | | 14,116 | |
| | 4,610,000 | | | i | | State Street Bank and Trust Co | | 0.442 | | | 12/08/15 | | | 4,601 | |
| | 6,744,000 | | | e | | SVB Financial Group | | 5.375 | | | 09/15/20 | | | 7,427 | |
| | 11,000,000 | | | g | | Toronto-Dominion Bank | | 1.625 | | | 09/14/16 | | | 11,195 | |
| | 14,500,000 | | | i | | Toronto-Dominion Bank | | 0.786 | | | 04/30/18 | | | 14,531 | |
| | 5,000,000 | | | | | US Bancorp | | 2.875 | | | 11/20/14 | | | 5,107 | |
| | 14,500,000 | | | e | | US Bancorp | | 1.650 | | | 05/15/17 | | | 14,531 | |
| | 10,250,000 | | | | | US Bancorp | | 2.950 | | | 07/15/22 | | | 9,524 | |
| | 3,750,000 | | | i | | US Bank NA | | 0.524 | | | 10/14/14 | | | 3,754 | |
| | 3,000,000 | | | | | US Bank NA | | 4.950 | | | 10/30/14 | | | 3,114 | |
| | 5,000,000 | | | g | | Westpac Banking Corp | | 1.850 | | | 11/26/18 | | | 4,911 | |
| | | | | | | TOTAL BANKS | | | | | | | | 522,994 | |
| | | | | | | | | | | | | | | | |
| CAPITAL GOODS - 0.6% | | | | | | | | | |
| | 2,500,000 | | | | | 3M Co | | 6.375 | | | 02/15/28 | | | 3,058 | |
| | 9,500,000 | | | | | Eaton Corp | | 0.950 | | | 11/02/15 | | | 9,535 | |
| | 3,375,000 | | | | | Eaton Corp | | 1.500 | | | 11/02/17 | | | 3,309 | |
| | 2,500,000 | | | | | Eaton Corp | | 4.000 | | | 11/02/32 | | | 2,296 | |
| | 3,100,000 | | | g | | Ingersoll-Rand Global Holding Co Ltd | | 2.875 | | | 01/15/19 | | | 3,055 | |
| | 4,600,000 | | | g | | Ingersoll-Rand Global Holding Co Ltd | | 4.250 | | | 06/15/23 | | | 4,493 | |
| | 3,150,000 | | | | | Masco Corp | | 7.125 | | | 03/15/20 | | | 3,596 | |
| | 5,155,000 | | | | | Pall Corp | | 5.000 | | | 06/15/20 | | | 5,384 | |
| | 8,850,000 | | | | | Pentair Finance S.A. | | 1.350 | | | 12/01/15 | | | 8,904 | |
| | 1,500,000 | | | | | Pentair Finance S.A. | | 2.650 | | | 12/01/19 | | | 1,426 | |
| | 9,750,000 | | | | | Precision Castparts Corp | | 0.700 | | | 12/20/15 | | | 9,751 | |
| | 9,250,000 | | | | | Precision Castparts Corp | | 2.500 | | | 01/15/23 | | | 8,380 | |
| | 3,300,000 | | | | | Rockwell Collins, Inc | | 3.100 | | | 11/15/21 | | | 3,220 | |
| | 6,125,000 | | | | | Rockwell Collins, Inc | | 3.700 | | | 12/15/23 | | | 6,047 | |
| | 5,000,000 | | | | | Timken Co | | 6.000 | | | 09/15/14 | | | 5,178 | |
| | | | | | | TOTAL CAPITAL GOODS | | | | | | | | 77,632 | |
COLLEGE RETIREMENT EQUITIES FUND - Social Choice Account
| | | | | | | | | | | MATURITY | | VALUE | |
| PRINCIPAL | | | | | ISSUER | | RATE | | DATE | | (000) | |
| COMMERCIAL & PROFESSIONAL SERVICES - 0.1% | | | | | | | | | |
| $ | 4,750,000 | | | | | Waste Management, Inc | | 2.600 | % | | 09/01/16 | | $ | 4,903 | |
| | 2,730,000 | | | | | Waste Management, Inc | | 4.600 | | | 03/01/21 | | | 2,909 | |
| | | | | | | TOTAL COMMERCIAL & PROFESSIONAL SERVICES | | | | | 7,812 | |
| | | | | | | | | | | | | | | | |
| CONSUMER DURABLES & APPAREL - 0.0% | | | | | | | | | |
| | 1,450,000 | | | | | Mohawk Industries, Inc | | 3.850 | | | 02/01/23 | | | 1,378 | |
| | 1,100,000 | | | | | Whirlpool Corp | | 8.600 | | | 05/01/14 | | | 1,129 | |
| | 2,215,000 | | | | | Whirlpool Corp | | 3.700 | | | 03/01/23 | | | 2,117 | |
| | 1,925,000 | | | | | Whirlpool Corp | | 5.150 | | | 03/01/43 | | | 1,856 | |
| | | | | | | TOTAL CONSUMER DURABLES & APPAREL | | | | | 6,480 | |
| | | | | | | | | | | | | | | | |
| CONSUMER SERVICES - 0.2% | | | | | | | | | |
| | 4,000,000 | | | | | American National Red Cross | | 5.567 | | | 11/15/17 | | | 4,144 | |
| | 5,000,000 | | | | | Andrew W Mellon Foundation | | 3.950 | | | 08/01/14 | | | 5,102 | |
| | 1,250,000 | | | | | McDonald’s Corp | | 5.000 | | | 02/01/19 | | | 1,409 | |
| | 7,550,000 | | | | | Nature Conservancy | | 6.300 | | | 07/01/19 | | | 8,563 | |
| | 5,145,000 | | | | | Salvation Army | | 5.637 | | | 09/01/26 | | | 5,321 | |
| | 2,275,000 | | | g | | Service Corp International | | 5.375 | | | 01/15/22 | | | 2,303 | |
| | | | | | | TOTAL CONSUMER SERVICES | | | | | | | | 26,842 | |
| | | | | | | | | | | | | | | | |
| DIVERSIFIED FINANCIALS - 1.9% | | | | | | | | | |
| | 5,000,000 | | | i | | American Express Centurion Bank | | 0.689 | | | 11/13/15 | | | 5,023 | |
| | 1,675,000 | | | | | American Express Co | | 7.000 | | | 03/19/18 | | | 2,001 | |
| | 6,975,000 | | | | | American Express Co | | 1.550 | | | 05/22/18 | | | 6,810 | |
| | 18,350,000 | | | | | American Express Credit Corp | | 2.125 | | | 07/27/18 | | | 18,381 | |
| | 5,000,000 | | | | | Bank of New York Mellon Corp | | 3.100 | | | 01/15/15 | | | 5,135 | |
| | 4,750,000 | | | | | Bank of New York Mellon Corp | | 1.200 | | | 02/20/15 | | | 4,787 | |
| | 5,000,000 | | | | | Bank of New York Mellon Corp | | 2.950 | | | 06/18/15 | | | 5,176 | |
| | 19,750,000 | | | i | | Bank of New York Mellon Corp | | 0.469 | | | 10/23/15 | | | 19,761 | |
| | 5,450,000 | | | i | | Bank of New York Mellon Corp | | 1.969 | | | 06/20/17 | | | 5,509 | |
| | 15,000,000 | | | e | | Bank of New York Mellon Corp | | 1.300 | | | 01/25/18 | | | 14,623 | |
| | 14,250,000 | | | i | | Bank of New York Mellon Corp | | 0.682 | | | 03/06/18 | | | 14,245 | |
| | 2,675,000 | | | | | Bank of New York Mellon Corp | | 5.450 | | | 05/15/19 | | | 3,039 | |
| | 2,850,000 | | | | | BlackRock, Inc | | 1.375 | | | 06/01/15 | | | 2,886 | |
| | 4,000,000 | | | g | | Caisse Centrale Desjardins du Quebec | | 2.550 | | | 03/24/16 | | | 4,162 | |
| | 14,750,000 | | | g | | Caisse Centrale Desjardins du Quebec | | 1.600 | | | 03/06/17 | | | 14,934 | |
| | 5,000,000 | | | | | Ford Motor Credit Co LLC | | 3.875 | | | 01/15/15 | | | 5,159 | |
| | 5,900,000 | | | | | Ford Motor Credit Co LLC | | 7.000 | | | 04/15/15 | | | 6,351 | |
| | 11,000,000 | | | i | | Ford Motor Credit Co LLC | | 1.489 | | | 05/09/16 | | | 11,161 | |
| | 9,000,000 | | | | | Ford Motor Credit Co LLC | | 2.375 | | | 01/16/18 | | | 9,090 | |
| | 8,600,000 | | | | | Ford Motor Credit Co LLC | | 5.000 | | | 05/15/18 | | | 9,580 | |
| | 10,000,000 | | | e | | Ford Motor Credit Co LLC | | 4.375 | | | 08/06/23 | | | 10,054 | |
| | 5,000,000 | | | | | John Deere Capital Corp | | 1.250 | | | 12/02/14 | | | 5,044 | |
| | 4,725,000 | | | | | John Deere Capital Corp | | 0.875 | | | 04/17/15 | | | 4,752 | |
| | 7,000,000 | | | | | John Deere Capital Corp | | 0.700 | | | 09/04/15 | | | 7,028 | |
| | 4,155,000 | | | | | John Deere Capital Corp | | 2.250 | | | 06/07/16 | | | 4,289 | |
| | 14,000,000 | | | g | | Nissan Motor Acceptance Corp | | 2.650 | | | 09/26/18 | | | 14,008 | |
| | 6,100,000 | | | | | Northern Trust Corp | | 4.625 | | | 05/01/14 | | | 6,188 | |
| | 9,750,000 | | | g | | RCI Banque S.A. | | 3.500 | | | 04/03/18 | | | 9,937 | |
| | 3,000,000 | | | | | State Street Corp | | 4.300 | | | 05/30/14 | | | 3,048 | |
| | 8,900,000 | | | | | State Street Corp | | 1.350 | | | 05/15/18 | | | 8,613 | |
| | 8,300,000 | | | | | State Street Corp | | 3.100 | | | 05/15/23 | | | 7,717 | |
| | | | | | | TOTAL DIVERSIFIED FINANCIALS | | | | | | | | 248,491 | |
COLLEGE RETIREMENT EQUITIES FUND - Social Choice Account
| | | | | | | | | | | MATURITY | | VALUE | |
| PRINCIPAL | | | | | ISSUER | | RATE | | DATE | | (000) | |
| ENERGY - 0.9% | | | | | | | | | |
| $ | 5,000,000 | | | | | Apache Corp | | 4.750 | % | | 04/15/43 | | $ | 4,850 | |
| | 4,145,000 | | | | | Continental Resources, Inc | | 5.000 | | | 09/15/22 | | | 4,306 | |
| | 2,500,000 | | | | | Devon Energy Corp | | 6.300 | | | 01/15/19 | | | 2,897 | |
| | 5,000,000 | | | | | EOG Resources, Inc | | 2.950 | | | 06/01/15 | | | 5,175 | |
| | 3,000,000 | | | | | EOG Resources, Inc | | 4.100 | | | 02/01/21 | | | 3,134 | |
| | 3,000,000 | | | | | Hess Corp | | 5.600 | | | 02/15/41 | | | 3,126 | |
| | 1,526,000 | | | | | Marathon Oil Corp | | 5.900 | | | 03/15/18 | | | 1,737 | |
| | 3,025,000 | | | | | National Oilwell Varco, Inc | | 1.350 | | | 12/01/17 | | | 2,972 | |
| | 2,500,000 | | | | | Noble Energy, Inc | | 8.250 | | | 03/01/19 | | | 3,107 | |
| | 14,000,000 | | | | | Noble Energy, Inc | | 5.250 | | | 11/15/43 | | | 13,989 | |
| | 9,886,000 | | | | | Noble Holding International Ltd | | 2.500 | | | 03/15/17 | | | 9,917 | |
| | 2,150,000 | | | e | | Noble Holding International Ltd | | 3.950 | | | 03/15/22 | | | 2,102 | |
| | 2,150,000 | | | g | | Northern Natural Gas Co | | 4.100 | | | 09/15/42 | | | 1,858 | |
| | 5,000,000 | | | | | Spectra Energy Capital LLC | | 5.650 | | | 03/01/20 | | | 5,445 | |
| | 6,975,000 | | | | | Statoil ASA | | 1.200 | | | 01/17/18 | | | 6,808 | |
| | 9,000,000 | | | i | | Statoil ASA | | 0.531 | | | 05/15/18 | | | 9,000 | |
| | 9,000,000 | | | | | Statoil ASA | | 2.900 | | | 11/08/20 | | | 8,941 | |
| | 9,500,000 | | | | | Statoil ASA | | 2.650 | | | 01/15/24 | | | 8,569 | |
| | 3,000,000 | | | | | Statoil ASA | | 3.950 | | | 05/15/43 | | | 2,624 | |
| | 5,000,000 | | | g | | Texas Eastern Transmission LP | | 4.125 | | | 12/01/20 | | | 5,142 | |
| | 12,150,000 | | | g | | Texas Eastern Transmission LP | | 2.800 | | | 10/15/22 | | | 10,865 | |
| | 6,175,000 | | | | | Weatherford International Ltd | | 4.500 | | | 04/15/22 | | | 6,214 | |
| | | | | | | TOTAL ENERGY | | | | | | | | 122,778 | |
| | | | | | | | | | | | | | | | |
| FOOD & STAPLES RETAILING - 0.2% | | | | | | | | | |
| | 7,650,000 | | | | | Kroger Co | | 1.200 | | | 10/17/16 | | | 7,653 | |
| | 4,750,000 | | | | | Kroger Co | | 2.200 | | | 01/15/17 | | | 4,808 | |
| | 9,250,000 | | | | | Kroger Co | | 2.300 | | | 01/15/19 | | | 9,204 | |
| | 7,250,000 | | | | | Safeway, Inc | | 3.400 | | | 12/01/16 | | | 7,543 | |
| | | | | | | TOTAL FOOD & STAPLES RETAILING | | | | | | | | 29,208 | |
| | | | | | | | | | | | | | | | |
| FOOD, BEVERAGE & TOBACCO - 0.1% | | | | | | | | | |
| | 7,408,000 | | | | | Kellogg Co | | 4.000 | | | 12/15/20 | | | 7,688 | |
| | 5,000,000 | | | | | PepsiCo, Inc | | 1.250 | | | 08/13/17 | | | 4,946 | |
| | 428,000 | | | | | PepsiCo, Inc | | 7.900 | | | 11/01/18 | | | 535 | |
| | | | | | | TOTAL FOOD, BEVERAGE & TOBACCO | | | | | | | | 13,169 | |
| | | | | | | | | | | | | | | | |
| HEALTH CARE EQUIPMENT & SERVICES - 0.5% | | | | | | | | | |
| | 4,750,000 | | | | | Becton Dickinson & Co | | 1.750 | | | 11/08/16 | | | 4,838 | |
| | 4,000,000 | | | | | Becton Dickinson & Co | | 5.000 | | | 05/15/19 | | | 4,485 | |
| | 2,000,000 | | | | | Becton Dickinson & Co | | 6.000 | | | 05/15/39 | | | 2,319 | |
| | 15,625,000 | | | | | Edwards Lifesciences Corp | | 2.875 | | | 10/15/18 | | | 15,534 | |
| | 9,750,000 | | | | | Laboratory Corp of America Holdings | | 2.500 | | | 11/01/18 | | | 9,616 | |
| | 3,500,000 | | | | | Medtronic, Inc | | 4.750 | | | 09/15/15 | | | 3,748 | |
| | 2,500,000 | | | | | Medtronic, Inc | | 6.500 | | | 03/15/39 | | | 3,040 | |
| | 5,000,000 | | | | | Providence Health & Services | | 5.050 | | | 10/01/14 | | | 5,154 | |
| | 10,300,000 | | | | | Thermo Fisher Scientific, Inc | | 1.300 | | | 02/01/17 | | | 10,255 | |
| | 3,650,000 | | | | | Thermo Fisher Scientific, Inc | | 2.400 | | | 02/01/19 | | | 3,616 | |
| | 5,200,000 | | | | | Thermo Fisher Scientific, Inc | | 4.150 | | | 02/01/24 | | | 5,151 | |
| | | | | | | TOTAL HEALTH CARE EQUIPMENT & SERVICES | | | | | 67,756 | |
COLLEGE RETIREMENT EQUITIES FUND - Social Choice Account
| | | | | | | | | | | MATURITY | | VALUE | |
| PRINCIPAL | | | | | ISSUER | | RATE | | DATE | | (000) | |
| HOUSEHOLD & PERSONAL PRODUCTS - 0.1% | | | | | | | | | |
| $ | 3,750,000 | | | | | Clorox Co | | 3.800 | % | | 11/15/21 | | $ | 3,774 | |
| | 4,500,000 | | | | | Colgate-Palmolive Co | | 2.300 | | | 05/03/22 | | | 4,126 | |
| | | | | | | TOTAL HOUSEHOLD & PERSONAL PRODUCTS | | | | | 7,900 | |
| | | | | | | | | | | | | | | | |
| INSURANCE - 0.5% | | | | | | | | | |
| | 5,000,000 | | | | | Berkshire Hathaway Finance Corp | | 0.950 | | | 08/15/16 | | | 5,023 | |
| | 4,750,000 | | | i | | Berkshire Hathaway, Inc | | 0.941 | | | 08/15/14 | | | 4,771 | |
| | 10,625,000 | | | g | | Five Corners Funding Trust | | 4.419 | | | 11/15/23 | | | 10,473 | |
| | 3,400,000 | | | | | Principal Financial Group, Inc | | 1.850 | | | 11/15/17 | | | 3,369 | |
| | 3,100,000 | | | | | Progressive Corp | | 3.750 | | | 08/23/21 | | | 3,161 | |
| | 3,175,000 | | | | | Prudential Financial, Inc | | 2.300 | | | 08/15/18 | | | 3,156 | |
| | 19,950,000 | | | i | | Prudential Financial, Inc | | 5.200 | | | 03/15/44 | | | 19,302 | |
| | 5,000,000 | | | g | | Swiss Re Treasury US Corp | | 2.875 | | | 12/06/22 | | | 4,604 | |
| | 3,750,000 | | | g | | Swiss Re Treasury US Corp | | 4.250 | | | 12/06/42 | | | 3,222 | |
| | 2,000,000 | | | | | Travelers Cos, Inc | | 5.900 | | | 06/02/19 | | | 2,341 | |
| | | | | | | TOTAL INSURANCE | | | | | | | | 59,422 | |
| | | | | | | | | | | | | | | | |
| MATERIALS - 0.6% | | | | | | | | | |
| | 3,335,000 | | | | | Air Products & Chemicals, Inc | | 4.375 | | | 08/21/19 | | | 3,609 | |
| | 1,000,000 | | | | | Ball Corp | | 6.750 | | | 09/15/20 | | | 1,088 | |
| | 2,275,000 | | | | | Ball Corp | | 5.000 | | | 03/15/22 | | | 2,252 | |
| | 8,930,000 | | | | | Ball Corp | | 4.000 | | | 11/15/23 | | | 7,992 | |
| | 4,000,000 | | | | | Bemis Co, Inc | | 6.800 | | | 08/01/19 | | | 4,689 | |
| | 5,750,000 | | | | | Domtar Corp | | 4.400 | | | 04/01/22 | | | 5,505 | |
| | 2,300,000 | | | | | Eastman Chemical Co | | 5.500 | | | 11/15/19 | | | 2,534 | |
| | 2,000,000 | | | | | International Paper Co | | 5.300 | | | 04/01/15 | | | 2,107 | |
| | 2,650,000 | | | | | International Paper Co | | 7.300 | | | 11/15/39 | | | 3,272 | |
| | 5,000,000 | | | | | International Paper Co | | 6.000 | | | 11/15/41 | | | 5,430 | |
| | 5,000,000 | | | | | MeadWestvaco Corp | | 7.375 | | | 09/01/19 | | | 5,934 | |
| | 14,500,000 | | | | | Nucor Corp | | 4.000 | | | 08/01/23 | | | 14,155 | |
| | 5,000,000 | | | | | Praxair, Inc | | 4.375 | | | 03/31/14 | | | 5,048 | |
| | 4,750,000 | | | | | Praxair, Inc | | 1.050 | | | 11/07/17 | | | 4,615 | |
| | 4,000,000 | | | | | Praxair, Inc | | 2.450 | | | 02/15/22 | | | 3,677 | |
| | 2,850,000 | | | | | Rock Tenn Co | | 3.500 | | | 03/01/20 | | | 2,803 | |
| | 2,850,000 | | | | | Rock Tenn Co | | 4.000 | | | 03/01/23 | | | 2,722 | |
| | 8,000,000 | | | | | Sherwin-Williams Co | | 1.350 | | | 12/15/17 | | | 7,790 | |
| | | | | | | TOTAL MATERIALS | | | | | | | | 85,222 | |
| | | | | | | | | | | | | | | | |
| MEDIA - 0.1% | | | | | | | | | |
| | 2,825,000 | | | | | Discovery Communications LLC | | 4.950 | | | 05/15/42 | | | 2,624 | |
| | 3,500,000 | | | | | Time Warner Cable, Inc | | 3.500 | | | 02/01/15 | | | 3,596 | |
| | 7,225,000 | | | | | Time Warner Cable, Inc | | 8.250 | | | 04/01/19 | | | 8,464 | |
| | 5,500,000 | | | | | Time Warner Cable, Inc | | 4.500 | | | 09/15/42 | | | 4,166 | |
| | | | | | | TOTAL MEDIA | | | | | | | | 18,850 | |
| | | | | | | | | | | | | | | | |
| PHARMACEUTICALS, BIOTECHNOLOGY & LIFE SCIENCES - 0.8% | | | | | | | |
| | 9,500,000 | | | i | | AbbVie, Inc | | 0.998 | | | 11/06/15 | | | 9,598 | |
| | 11,425,000 | | | | | AbbVie, Inc | | 1.750 | | | 11/06/17 | | | 11,405 | |
| | 2,695,000 | | | | | Bristol-Myers Squibb Co | | 3.250 | | | 08/01/42 | | | 2,093 | |
| | 2,250,000 | | | | | Gilead Sciences, Inc | | 4.400 | | | 12/01/21 | | | 2,403 | |
| | 10,000,000 | | | i | | Johnson & Johnson | | 0.331 | | | 05/15/14 | | | 10,002 | |
| | 4,600,000 | | | | | Johnson & Johnson | | 2.150 | | | 05/15/16 | | | 4,755 | |
| | 14,500,000 | | | | | Johnson & Johnson | | 0.700 | | | 11/28/16 | | | 14,411 | |
COLLEGE RETIREMENT EQUITIES FUND - Social Choice Account
| | | | | | | | | | | MATURITY | | VALUE | |
| PRINCIPAL | | | | | ISSUER | | RATE | | DATE | | (000) | |
| $ | 15,300,000 | | | | | Johnson & Johnson | | 4.375 | % | | 12/05/33 | | $ | 15,399 | |
| | 4,600,000 | | | | | Johnson & Johnson | | 4.500 | | | 09/01/40 | | | 4,526 | |
| | 8,080,000 | | | | | Life Technologies Corp | | 3.500 | | | 01/15/16 | | | 8,416 | |
| | 5,000,000 | | | | | Merck & Co, Inc | | 2.250 | | | 01/15/16 | | | 5,165 | |
| | 9,000,000 | | | i | | Merck & Co, Inc | | 0.599 | | | 05/18/18 | | | 9,024 | |
| | 2,400,000 | | | | | Merck & Co, Inc | | 4.150 | | | 05/18/43 | | | 2,193 | |
| | 4,750,000 | | | g | | Valeant Pharmaceuticals International, Inc | | 6.375 | | | 10/15/20 | | | 5,005 | |
| | 475,000 | | | g | | Valeant Pharmaceuticals International, Inc | | 5.625 | | | 12/01/21 | | | 477 | |
| | 5,750,000 | | | g | | VPII Escrow Corp | | 6.750 | | | 08/15/18 | | | 6,318 | |
| | | | | | | TOTAL PHARMACEUTICALS, BIOTECHNOLOGY & LIFE SCIENCES | | | 111,190 | |
| | | | | | | | | | | | | | | | |
| REAL ESTATE - 0.6% | | | | | | | | | |
| | 8,000,000 | | | | | AvalonBay Communities, Inc | | 2.950 | | | 09/15/22 | | | 7,346 | |
| | 3,500,000 | | | | | Boston Properties LP | | 3.125 | | | 09/01/23 | | | 3,197 | |
| | 8,325,000 | | | g | | DCT Industrial Operating Partnership LP | | 4.500 | | | 10/15/23 | | | 8,089 | |
| | 8,907,000 | | | | | Equity One, Inc | | 3.750 | | | 11/15/22 | | | 8,357 | |
| | 1,400,000 | | | | | Federal Realty Investment Trust | | 5.900 | | | 04/01/20 | | | 1,608 | |
| | 10,100,000 | | | | | Federal Realty Investment Trust | | 2.750 | | | 06/01/23 | | | 9,076 | |
| | 3,400,000 | | | | | Healthcare Realty Trust, Inc | | 5.750 | | | 01/15/21 | | | 3,695 | |
| | 3,400,000 | | | | | Kilroy Realty Corp | | 5.000 | | | 11/03/15 | | | 3,622 | |
| | 10,050,000 | | | | | Kilroy Realty LP | | 3.800 | | | 01/15/23 | | | 9,372 | |
| | 3,900,000 | | | | | Mid-America Apartments LP | | 4.300 | | | 10/15/23 | | | 3,792 | |
| | 1,673,000 | | | | | Simon Property Group LP | | 6.750 | | | 05/15/14 | | | 1,685 | |
| | 3,125,000 | | | | | Simon Property Group LP | | 2.800 | | | 01/30/17 | | | 3,232 | |
| | 9,500,000 | | | g | | Simon Property Group LP | | 1.500 | | | 02/01/18 | | | 9,229 | |
| | 6,150,000 | | | | | Ventas Realty LP | | 2.000 | | | 02/15/18 | | | 6,045 | |
| | 2,400,000 | | | | | Ventas Realty LP | | 3.250 | | | 08/15/22 | | | 2,223 | |
| | | | | | | TOTAL REAL ESTATE | | | | | | | | 80,568 | |
| | | | | | | | | | | | | | | | |
| RETAILING - 0.1% | | | | | | | | | |
| | 5,000,000 | | | | | AutoZone, Inc | | 5.750 | | | 01/15/15 | | | 5,252 | |
| | 7,536,000 | | | | | O’Reilly Automotive, Inc | | 3.800 | | | 09/01/22 | | | 7,273 | |
| | | | | | | TOTAL RETAILING | | | | | | | | 12,525 | |
| | | | | | | | | | | | | | | | |
| SEMICONDUCTORS & SEMICONDUCTOR EQUIPMENT - 0.1% | | | | | | | | | |
| | 5,425,000 | | | | | Intel Corp | | 1.350 | | | 12/15/17 | | | 5,362 | |
| | 7,500,000 | | | | | Texas Instruments, Inc | | 2.375 | | | 05/16/16 | | | 7,774 | |
| | | | | | | TOTAL SEMICONDUCTORS & SEMICONDUCTOR EQUIPMENT | | | 13,136 | |
| | | | | | | | | | | | | | | | |
| SOFTWARE & SERVICES - 0.2% | | | | | | | | | |
| | 5,000,000 | | | | | Adobe Systems, Inc | | 3.250 | | | 02/01/15 | | | 5,135 | |
| | 9,750,000 | | | | | International Business Machines Corp | | 0.550 | | | 02/06/15 | | | 9,765 | |
| | 5,250,000 | | | | | International Business Machines Corp | | 1.250 | | | 02/06/17 | | | 5,236 | |
| | | | | | | TOTAL SOFTWARE & SERVICES | | | | | | | | 20,136 | |
| | | | | | | | | | | | | | | | |
| TECHNOLOGY HARDWARE & EQUIPMENT - 0.3% | | | | | | | | | |
| | 5,000,000 | | | | | American Tower Corp | | 4.700 | | | 03/15/22 | | | 4,998 | |
| | 3,375,000 | | | | | CC Holdings GS V LLC | | 2.381 | | | 12/15/17 | | | 3,343 | |
| | 5,000,000 | | | | | Xerox Corp | | 8.250 | | | 05/15/14 | | | 5,134 | |
| | 9,750,000 | | | i | | Xerox Corp | | 1.059 | | | 05/16/14 | | | 9,758 | |
| | 4,000,000 | | | | | Xerox Corp | | 2.950 | | | 03/15/17 | | | 4,106 | |
| | 11,000,000 | | | | | Xerox Corp | | 2.750 | | | 03/15/19 | | | 10,902 | |
| | | | | | | TOTAL TECHNOLOGY HARDWARE & EQUIPMENT | | | | | 38,241 | |
COLLEGE RETIREMENT EQUITIES FUND - Social Choice Account
| | | | | | | | | | | MATURITY | | VALUE | |
| PRINCIPAL | | | | | ISSUER | | RATE | | DATE | | (000) | |
| TELECOMMUNICATION SERVICES - 0.2% | | | | | | | | | |
| $ | 3,400,000 | | | | | CenturyLink, Inc | | 6.750 | % | | 12/01/23 | | $ | 3,442 | |
| | 12,825,000 | | | g | | Sprint Corp | | 7.250 | | | 09/15/21 | | | 13,771 | |
| | 3,235,000 | | | | | Sprint Nextel Corp | | 6.000 | | | 12/01/16 | | | 3,530 | |
| | 9,750,000 | | | | | Vodafone Group plc | | 1.500 | | | 02/19/18 | | | 9,506 | |
| | 2,300,000 | | | | | Windstream Corp | | 6.375 | | | 08/01/23 | | | 2,151 | |
| | | | | | | TOTAL TELECOMMUNICATION SERVICES | | | | | 32,400 | |
| | | | | | | | | | | | | | | | |
| TRANSPORTATION - 0.4% | | | | | | | | | |
| | 4,600,000 | | | | | Burlington Northern Santa Fe LLC | | 5.050 | | | 03/01/41 | | | 4,563 | |
| | 2,100,000 | | | | | Burlington Northern Santa Fe LLC | | 4.950 | | | 09/15/41 | | | 2,070 | |
| | 7,150,000 | | | | | CSX Corp | | 3.700 | | | 11/01/23 | | | 6,917 | |
| | 6,500,000 | | | | | CSX Corp | | 4.100 | | | 03/15/44 | | | 5,508 | |
| | 4,225,000 | | | | | GATX Corp | | 3.900 | | | 03/30/23 | | | 4,002 | |
| | 2,500,000 | | | | | Norfolk Southern Corp | | 5.750 | | | 01/15/16 | | | 2,731 | |
| | 5,000,000 | | | | | Norfolk Southern Corp | | 3.250 | | | 12/01/21 | | | 4,845 | |
| | 12,775,000 | | | | | Norfolk Southern Corp | | 3.000 | | | 04/01/22 | | | 12,069 | |
| | 6,894,000 | | | | | Norfolk Southern Corp | | 2.903 | | | 02/15/23 | | | 6,368 | |
| | 475,000 | | | | | Norfolk Southern Corp | | 5.590 | | | 05/17/25 | | | 519 | |
| | 1,360,000 | | | i | | United Parcel Service of America, Inc (Step Bond 8.375% until 04/01/20, 7.620% until 04/01/30) | | 8.375 | | | 04/01/30 | | | 1,836 | |
| | 3,650,000 | | | | | United Parcel Service, Inc | | 1.125 | | | 10/01/17 | | | 3,596 | |
| | | | | | | TOTAL TRANSPORTATION | | | | | | | | 55,024 | |
| | | | | | | | | | | | | | | | |
| UTILITIES - 1.3% | | | | | | | | | |
| | 1,667,000 | | | | | Arizona Public Service Co | | 5.050 | | | 09/01/41 | | | 1,711 | |
| | 2,000,000 | | | | | Atmos Energy Corp | | 8.500 | | | 03/15/19 | | | 2,563 | |
| | 1,200,000 | | | | | Connecticut Light & Power Co | | 5.500 | | | 02/01/19 | | | 1,375 | |
| | 2,000,000 | | | | | Connecticut Light & Power Co | | 5.750 | | | 03/01/37 | | | 2,163 | |
| | 9,000,000 | | | e | | Delmarva Power & Light Co | | 3.500 | | | 11/15/23 | | | 8,848 | |
| | 1,785,523 | | | g | | Great River Energy | | 5.829 | | | 07/01/17 | | | 1,894 | |
| | 3,375,000 | | | g | | International Transmission Co | | 4.625 | | | 08/15/43 | | | 3,295 | |
| | 7,250,000 | | | | | ITC Holdings Corp | | 5.300 | | | 07/01/43 | | | 7,128 | |
| | 9,250,000 | | | g | | Narragansett Electric Co | | 4.170 | | | 12/10/42 | | | 8,089 | |
| | 9,500,000 | | | | | Nevada Power Co | | 5.875 | | | 01/15/15 | | | 10,013 | |
| | 9,750,000 | | | g | | Niagara Mohawk Power Corp | | 4.119 | | | 11/28/42 | | | 8,518 | |
| | 14,150,000 | | | | | NiSource Finance Corp | | 4.800 | | | 02/15/44 | | | 12,767 | |
| | 6,000,000 | | | | | Northeast Utilities | | 1.450 | | | 05/01/18 | | | 5,811 | |
| | 9,750,000 | | | | | Northern States Power Co | | 2.600 | | | 05/15/23 | | | 8,954 | |
| | 1,500,000 | | | | | Northwest Natural Gas Co | | 5.620 | | | 11/21/23 | | | 1,703 | |
| | 14,000,000 | | | i | | NSTAR Electric Co | | 0.479 | | | 05/17/16 | | | 13,981 | |
| | 5,000,000 | | | | | Pacific Gas & Electric Co | | 8.250 | | | 10/15/18 | | | 6,253 | |
| | 3,750,000 | | | | | Pacific Gas & Electric Co | | 5.400 | | | 01/15/40 | | | 3,987 | |
| | 3,000,000 | | | | | Pepco Holdings, Inc | | 2.700 | | | 10/01/15 | | | 3,076 | |
| | 630,000 | | | | | Public Service Co of Colorado | | 4.750 | | | 08/15/41 | | | 636 | |
| | 5,000,000 | | | | | Public Service Co of New Hampshire | | 3.500 | | | 11/01/23 | | | 4,896 | |
| | 5,500,000 | | | | | San Diego Gas & Electric Co | | 3.000 | | | 08/15/21 | | | 5,420 | |
| | 620,000 | | | | | San Diego Gas & Electric Co | | 6.000 | | | 06/01/39 | | | 739 | |
| | 10,000,000 | | | | | Sempra Energy | | 2.300 | | | 04/01/17 | | | 10,129 | |
| | 8,875,000 | | | | | Sierra Pacific Power Co | | 3.375 | | | 08/15/23 | | | 8,569 | |
| | 17,250,000 | | | g | | Topaz Solar Farms LLC | | 4.875 | | | 09/30/39 | | | 16,282 | |
COLLEGE RETIREMENT EQUITIES FUND - Social Choice Account
| | | | | | | | | | | MATURITY | | VALUE | |
| PRINCIPAL | | | | | ISSUER | | RATE | | DATE | | (000) | |
| $ | 14,500,000 | | | g | | Topaz Solar Farms LLC | | 5.750 | % | | 09/30/39 | | $ | 14,529 | |
| | 5,000,000 | | | | | Washington Gas Light Co | | 5.440 | | | 08/11/25 | | | 5,279 | |
| | | | | | | TOTAL UTILITIES | | | | | | | | 178,608 | |
| | | | | | | | | | | | | | | | |
| | | | | | | TOTAL CORPORATE BONDS | | | | | | | | 1,856,090 | |
| | | | | | | (Cost $1,855,911) | | | | | | | | | |
| | | | | | | | | | | | | | | | |
| GOVERNMENT BONDS - 22.3% | | | | | | | | | |
| | | | | | | | | | | | | | | | |
| AGENCY SECURITIES - 4.0% | | | | | | | | | |
| | 6,841,864 | | | | | Cal Dive I- Title XI, Inc | | 4.930 | | | 02/01/27 | | | 7,235 | |
| | 7,150,072 | | | | | COP I LLC | | 3.613 | | | 12/05/21 | | | 7,681 | |
| | 5,500,000 | | | | | Federal Home Loan Bank (FHLB) | | 5.000 | | | 11/17/17 | | | 6,277 | |
| | 17,166,667 | | | | | FHLB | | 2.350 | | | 08/08/22 | | | 15,942 | |
| | 4,635,000 | | | | | Federal Home Loan Mortgage Corp (FHLMC) | | 2.500 | | | 04/23/14 | | | 4,669 | |
| | 5,000,000 | | | | | FHLMC | | 1.000 | | | 09/29/17 | | | 4,941 | |
| | 3,000,000 | | | | | Federal National Mortgage Association (FNMA) | | 2.500 | | | 05/15/14 | | | 3,026 | |
| | 10,000,000 | | | | | FNMA | | 2.625 | | | 11/20/14 | | | 10,219 | |
| | 6,400,000 | | | | | FNMA | | 1.125 | | | 04/27/17 | | | 6,425 | |
| | 1,096,000 | | | j | | Government Trust Certificate | | 0.000 | | | 04/01/19 | | | 970 | |
| | 5,000,000 | | | j | | Government Trust Certificate | | 0.000 | | | 04/01/21 | | | 3,884 | |
| | 2,800,000 | | | j | | Overseas Private Investment Corp (OPIC) | | 0.000 | | | 07/12/14 | | | 2,830 | |
| | 3,850,000 | | | j | | OPIC | | 0.000 | | | 07/12/14 | | | 4,120 | |
| | 4,700,000 | | | j | | OPIC | | 0.000 | | | 07/12/14 | | | 5,410 | |
| | 2,750,000 | | | j | | OPIC | | 0.000 | | | 04/30/15 | | | 2,769 | |
| | 14,500,000 | | | j | | OPIC | | 0.000 | | | 11/17/16 | | | 14,429 | |
| | 12,750,000 | | | j | | OPIC | | 0.000 | | | 11/17/16 | | | 13,446 | |
| | 3,000,000 | | | j | | OPIC | | 0.000 | | | 04/30/18 | | | 3,063 | |
| | 11,106,470 | | | | | OPIC | | 1.030 | | | 04/15/19 | | | 10,991 | |
| | 2,160,714 | | | | | OPIC | | 1.300 | | | 06/15/19 | | | 2,132 | |
| | 3,313,659 | | | | | OPIC | | 5.142 | | | 12/15/23 | | | 3,662 | |
| | 5,748,751 | | | | | OPIC | | 2.290 | | | 09/15/26 | | | 5,495 | |
| | 3,163,839 | | | | | OPIC | | 2.040 | | | 12/15/26 | | | 3,051 | |
| | 8,236,086 | | | | | OPIC | | 4.440 | | | 02/27/27 | | | 8,651 | |
| | 2,500,000 | | | | | OPIC | | 2.610 | | | 04/15/30 | | | 2,274 | |
| | 4,750,000 | | | | | OPIC | | 2.930 | | | 05/15/30 | | | 4,385 | |
| | 7,850,000 | | | | | OPIC | | 3.040 | | | 05/15/30 | | | 7,313 | |
| | 5,000,000 | | | | | OPIC | | 3.430 | | | 05/15/30 | | | 4,807 | |
| | 4,750,000 | | | | | OPIC | | 4.010 | | | 05/15/30 | | | 4,777 | |
| | 9,705,889 | | | | | OPIC | | 3.540 | | | 06/15/30 | | | 9,727 | |
| | 2,418,250 | | | | | OPIC | | 2.310 | | | 11/15/30 | | | 2,152 | |
| | 24,500,000 | | | | | OPIC | | 3.370 | | | 12/15/30 | | | 23,996 | |
| | 9,714,286 | | | | | OPIC | | 3.590 | | | 12/15/30 | | | 9,492 | |
| | 23,250,000 | | | | | OPIC | | 3.820 | | | 12/20/32 | | | 23,142 | |
| | 15,000,000 | | | | | OPIC | | 3.938 | | | 12/20/32 | | | 14,718 | |
| | 1,050,000 | | | | | Private Export Funding Corp (PEFCO) | | 4.550 | | | 05/15/15 | | | 1,111 | |
| | 9,750,000 | | | | | PEFCO | | 2.125 | | | 07/15/16 | | | 10,113 | |
| | 11,750,000 | | | | | PEFCO | | 1.375 | | | 02/15/17 | | | 11,860 | |
| | 8,000,000 | | | | | PEFCO | | 2.250 | | | 12/15/17 | | | 8,239 | |
| | 5,000,000 | | | | | PEFCO | | 4.375 | | | 03/15/19 | | | 5,521 | |
| | 14,000,000 | | | | | PEFCO | | 1.450 | | | 08/15/19 | | | 13,316 | |
| | 17,500,000 | | | | | PEFCO | | 4.300 | | | 12/15/21 | | | 19,011 | |
| | 8,250,000 | | | | | PEFCO | | 2.050 | | | 11/15/22 | | | 7,395 | |
COLLEGE RETIREMENT EQUITIES FUND - Social Choice Account
| | | | | | | | | | | MATURITY | | VALUE | |
| PRINCIPAL | | | | | ISSUER | | RATE | | DATE | | (000) | |
| $ | 5,007,000 | | | | | United States Department of Housing and Urban Development (HUD) | 5.380 | % | | 08/01/18 | | $ | 5,584 | |
| | 750,000 | | | | | HUD | | 2.050 | | | 08/01/19 | | | 745 | |
| | 9,500,000 | | | | | HUD | | 4.870 | | | 08/01/19 | | | 10,719 | |
| | 9,000,000 | | | | | HUD | | 5.190 | | | 08/01/14 | | | 9,262 | |
| | 1,900,000 | | | | | HUD | | 2.200 | | | 08/01/15 | | | 1,955 | |
| | 5,250,000 | | | | | HUD | | 4.330 | | | 08/01/15 | | | 5,573 | |
| | 3,894,000 | | | | | HUD | | 2.910 | | | 08/01/17 | | | 4,125 | |
| | 8,000,000 | | | | | HUD | | 4.560 | | | 08/01/17 | | | 8,877 | |
| | 10,750,000 | | | | | HUD | | 1.770 | | | 08/01/18 | | | 10,710 | |
| | 13,967,000 | | | | | HUD | | 4.960 | | | 08/01/20 | | | 15,837 | |
| | 13,500,000 | | | | | HUD | | 5.050 | | | 08/01/21 | | | 15,246 | |
| | 9,689,431 | | | m | | Gate Capital Cayman One Ltd | | 1.839 | | | 03/27/21 | | | 9,699 | |
| | 6,924,380 | | | | | Gate Capital Cayman Two | | 3.550 | | | 06/11/21 | | | 7,325 | |
| | 13,500,000 | | | | | Hashemite Kingdom of Jordan | | 2.503 | | | 10/30/20 | | | 13,223 | |
| | 10,125,000 | | | i | | India Government AID Bond | | 0.342 | | | 02/01/27 | | | 9,640 | |
| | 8,845,000 | | | | | Lutheran Medical Center | | 1.982 | | | 02/20/30 | | | 8,176 | |
| | 13,550,000 | | | | | Micron Semiconductor Asia Pte Ltd | | 1.258 | | | 01/15/19 | | | 13,503 | |
| | 4,420,000 | | | g | | Montefiore Medical Center | | 3.896 | | | 05/20/27 | | | 4,472 | |
| | 649,482 | | | | | National Credit Union Administration | | 1.840 | | | 10/07/20 | | | 655 | |
| | 5,323,639 | | | | | Premier Aircraft Leasing | | 3.576 | | | 02/06/22 | | | 5,633 | |
| | 3,650,618 | | | | | Tayarra Ltd | | 3.628 | | | 02/15/22 | | | 3,870 | |
| | 3,557,708 | | | | | Tricahue Leasing LLC | | 3.503 | | | 11/19/21 | | | 3,755 | |
| | 31,044,000 | | | e | | Tunisia Government AID Bonds | | 1.686 | | | 07/16/19 | | | 30,003 | |
| | 9,583,333 | | | | | Ulani MSN 35940 LLC | | 2.227 | | | 05/16/25 | | | 9,331 | |
| | 8,650,000 | | | | | UNM Sandoval Regional Medical Center | | 4.500 | | | 07/20/36 | | | 8,333 | |
| | 2,392,820 | | | | | VRG Linhas Aereas S.A. | | 1.000 | | | 06/30/14 | | | 2,399 | |
| | | | | | | TOTAL AGENCY SECURITIES | | | | | | | | 553,317 | |
| | | | | | | | | | | | | | | | |
| FOREIGN GOVERNMENT BONDS - 4.5% | | | | | | | | | |
| | 24,000,000 | | | | | African Development Bank | | 0.750 | | | 10/18/16 | | | 23,948 | |
| | 6,000,000 | | | g | | Caisse d’Amortissement de la Dette Sociale | | 2.000 | | | 04/17/20 | | | 5,747 | |
| | 6,300,000 | | | | | Canada Government International Bond | | 0.875 | | | 02/14/17 | | | 6,300 | |
| | 8,952,338 | | | g | | Carpintero Finance Ltd | | 2.004 | | | 09/18/24 | | | 8,767 | |
| | 24,750,000 | | | | | Council of Europe Development Bank | | 1.500 | | | 01/15/15 | | | 25,044 | |
| | 14,250,000 | | | e | | Council of Europe Development Bank | | 1.000 | | | 03/07/18 | | | 13,864 | |
| | 24,000,000 | | | | | European Bank for Reconstruction & Development | | 1.625 | | | 04/10/18 | | | 24,040 | |
| | 2,000,000 | | | | | European Investment Bank | | 4.875 | | | 02/15/36 | | | 2,186 | |
| | 18,175,000 | | | e | | Export-Import Bank of Korea | | 1.750 | | | 02/27/18 | | | 17,685 | |
| | 14,500,000 | | | | | Hydro Quebec | | 2.000 | | | 06/30/16 | | | 14,889 | |
| | 10,200,000 | | | | | Hydro Quebec | | 1.375 | | | 06/19/17 | | | 10,235 | |
| | 6,082,000 | | | | | Hydro Quebec | | 8.400 | | | 01/15/22 | | | 7,948 | |
| | 49,000,000 | | | | | International Bank for Reconstruction & Development | | 0.375 | | | 08/24/15 | | | 49,000 | |
| | 3,000,000 | | | | | International Bank for Reconstruction & Development | | 2.000 | | | 10/20/16 | | | 3,104 | |
| | 55,210,000 | | | | | International Finance Corp | | 2.250 | | | 04/28/14 | | | 55,561 | |
| | 24,500,000 | | | | | International Finance Corp | | 0.500 | | | 05/15/15 | | | 24,523 | |
| | 24,000,000 | | | | | International Finance Corp | | 0.500 | | | 05/16/16 | | | 23,954 | |
| | 29,000,000 | | | g,i | | International Finance Facility for Immunisation | | 0.433 | | | 07/05/16 | | | 29,000 | |
| | 2,850,000 | | | e | | Italy Government International Bond | | 5.375 | | | 06/12/17 | | | 3,106 | |
| | 10,000,000 | | | | | KFW | | 2.625 | | | 01/25/22 | | | 9,757 | |
| | 19,000,000 | | | g | | Kommunalbanken AS. | | 0.750 | | | 11/21/16 | | | 18,903 | |
| | 3,145,000 | | | g | | National Bank of Canada | | 1.650 | | | 01/30/14 | | | 3,148 | |
| | 7,500,000 | | | g | | National Bank of Canada | | 2.200 | | | 10/19/16 | | | 7,741 | |
COLLEGE RETIREMENT EQUITIES FUND - Social Choice Account
| | | | | | | | | | | MATURITY | | VALUE | |
| PRINCIPAL | | | | | ISSUER | | RATE | | DATE | | (000) | |
| $ | 13,500,000 | | | | | North American Development Bank | | 2.300 | % | | 10/10/18 | | $ | 13,293 | |
| | 23,425,000 | | | | | North American Development Bank | | 2.400 | | | 10/26/22 | | | 20,789 | |
| | 17,500,000 | | | g | | Province of Alberta Canada | | 1.000 | | | 06/21/17 | | | 17,468 | |
| | 4,000,000 | | | | | Province of British Columbia Canada | | 2.850 | | | 06/15/15 | | | 4,144 | |
| | 5,000,000 | | | | | Province of British Columbia Canada | | 1.200 | | | 04/25/17 | | | 5,023 | |
| | 15,250,000 | | | | | Province of Manitoba Canada | | 1.750 | | | 05/30/19 | | | 14,920 | |
| | 19,500,000 | | | | | Province of Manitoba Canada | | 2.100 | | | 09/06/22 | | | 17,601 | |
| | 10,000,000 | | | | | Province of New Brunswick Canada | | 2.750 | | | 06/15/18 | | | 10,343 | |
| | 5,000,000 | | | | | Province of Nova Scotia Canada | | 2.375 | | | 07/21/15 | | | 5,140 | |
| | 8,100,000 | | | | | Province of Ontario Canada | | 2.950 | | | 02/05/15 | | | 8,326 | |
| | 9,450,000 | | | | | Province of Ontario Canada | | 2.700 | | | 06/16/15 | | | 9,761 | |
| | 15,000,000 | | | | | Province of Ontario Canada | | 2.300 | | | 05/10/16 | | | 15,519 | |
| | 9,500,000 | | | | | Province of Ontario Canada | | 1.200 | | | 02/14/18 | | | 9,317 | |
| | 5,000,000 | | | e | | Province of Ontario Canada | | 4.400 | | | 04/14/20 | | | 5,486 | |
| | 10,000,000 | | | | | Province of Quebec Canada | | 3.500 | | | 07/29/20 | | | 10,381 | |
| | 10,000,000 | | | e | | Province of Quebec Canada | | 2.750 | | | 08/25/21 | | | 9,648 | |
| | 14,500,000 | | | | | Province of Quebec Canada | | 2.625 | | | 02/13/23 | | | 13,319 | |
| | 5,000,000 | | | | | Province of Quebec Canada | | 7.500 | | | 09/15/29 | | | 6,612 | |
| | | | | | | TOTAL FOREIGN GOVERNMENT BONDS | | | | | | 585,540 | |
| | | | | | | | | | | | | | | | |
| MORTGAGE BACKED - 8.2% | | | | | | | | | |
| | 581,439 | | | | | Federal Home Loan Mortgage Corp (FHLMC) | | 5.500 | | | 08/01/35 | | | 639 | |
| | 1,196,570 | | | i | | FHLMC | | 2.427 | | | 02/01/36 | | | 1,274 | |
| | 2,906,531 | | | i | | FHLMC | | 2.564 | | | 07/01/36 | | | 3,089 | |
| | 3,746,016 | | | i | | FHLMC | | 2.259 | | | 09/01/36 | | | 4,004 | |
| | 796,674 | | | i | | FHLMC | | 2.368 | | | 09/01/36 | | | 853 | |
| | 764,995 | | | i | | FHLMC | | 5.675 | | | 02/01/37 | | | 812 | |
| | 3,059,446 | | | i | | FHLMC | | 2.633 | | | 03/01/37 | | | 3,268 | |
| | 1,298,479 | | | i | | FHLMC | | 6.010 | | | 04/01/37 | | | 1,377 | |
| | 1,373,331 | | | i | | FHLMC | | 2.615 | | | 08/01/37 | | | 1,453 | |
| | 2,576,156 | | | i | | FHLMC | | 1.702 | | | 09/01/37 | | | 2,679 | |
| | 3,405,319 | | | | | FHLMC | | 6.000 | | | 09/01/37 | | | 3,799 | |
| | 2,185,594 | | | | | FHLMC | | 3.000 | | | 08/15/42 | | | 1,773 | |
| | 72,309 | | | | | Federal Home Loan Mortgage Corp Gold (FGLMC) | | 6.500 | | | 12/01/16 | | | 76 | |
| | 154,033 | | | | | FGLMC | | 6.000 | | | 12/01/17 | | | 164 | |
| | 1,188,617 | | | | | FGLMC | | 4.500 | | | 10/01/18 | | | 1,260 | |
| | 1,475,880 | | | | | FGLMC | | 4.500 | | | 11/01/18 | | | 1,565 | |
| | 1,320,517 | | | | | FGLMC | | 4.500 | | | 11/01/18 | | | 1,400 | |
| | 2,149,641 | | | | | FGLMC | | 4.500 | | | 01/01/19 | | | 2,279 | |
| | 810,590 | | | | | FGLMC | | 5.500 | | | 01/01/19 | | | 854 | |
| | 733,037 | | | | | FGLMC | | 5.000 | | | 02/01/19 | | | 776 | |
| | 320,416 | | | | | FGLMC | | 4.500 | | | 01/01/20 | | | 340 | |
| | 95,239 | | | | | FGLMC | | 4.500 | | | 07/01/20 | | | 103 | |
| | 119,667 | | | | | FGLMC | | 7.000 | | | 10/01/20 | | | 129 | |
| | 2,431,236 | | | | | FGLMC | | 4.500 | | | 06/01/21 | | | 2,583 | |
| | 711,865 | | | | | FGLMC | | 4.500 | | | 06/01/21 | | | 756 | |
| | 378,986 | | | | | FGLMC | | 4.500 | | | 03/01/23 | | | 406 | |
| | 301,911 | | | | | FGLMC | | 5.000 | | | 04/01/23 | | | 326 | |
| | 10,385 | | | | | FGLMC | | 7.000 | | | 05/01/23 | | | 12 | |
| | 1,088,221 | | | | | FGLMC | | 4.000 | | | 07/01/24 | | | 1,149 | |
| | 367,075 | | | | | FGLMC | | 4.500 | | | 09/01/24 | | | 394 | |
| | 26,846 | | | | | FGLMC | | 8.000 | | | 01/01/31 | | | 31 | |
| | 792,324 | | | | | FGLMC | | 4.500 | | | 07/01/33 | | | 841 | |
COLLEGE RETIREMENT EQUITIES FUND - Social Choice Account
| | | | | | | | | | | MATURITY | | VALUE | |
| PRINCIPAL | | | | | ISSUER | | RATE | | DATE | | (000) | |
| $ | 1,344,775 | | | | | FGLMC | | 5.500 | % | | 09/01/33 | | $ | 1,484 | |
| | 1,368,819 | | | | | FGLMC | | 5.500 | | | 09/01/33 | | | 1,528 | |
| | 2,183,163 | | | | | FGLMC | | 5.500 | | | 12/01/33 | | | 2,408 | |
| | 4,734,214 | | | | | FGLMC | | 7.000 | | | 12/01/33 | | | 5,489 | |
| | 697,308 | | | | | FGLMC | | 6.000 | | | 09/01/34 | | | 781 | |
| | 339,855 | | | | | FGLMC | | 5.500 | | | 12/01/34 | | | 376 | |
| | 1,732,477 | | | | | FGLMC | | 7.000 | | | 05/01/35 | | | 1,968 | |
| | 1,062,136 | | | | | FGLMC | | 6.000 | | | 08/01/35 | | | 1,185 | |
| | 328,646 | | | | | FGLMC | | 5.000 | | | 10/01/35 | | | 354 | |
| | 267,882 | | | | | FGLMC | | 5.000 | | | 02/01/36 | | | 289 | |
| | 13,835 | | | | | FGLMC | | 6.500 | | | 05/01/36 | | | 15 | |
| | 532,319 | | | | | FGLMC | | 6.500 | | | 10/01/36 | | | 600 | |
| | 556,460 | | | | | FGLMC | | 6.500 | | | 11/01/37 | | | 619 | |
| | 1,869,451 | | | | | FGLMC | | 6.000 | | | 02/01/38 | | | 2,088 | |
| | 285,090 | | | | | FGLMC | | 6.000 | | | 11/01/38 | | | 314 | |
| | 1,217,872 | | | | | FGLMC | | 5.000 | | | 07/01/39 | | | 1,313 | |
| | 3,730,458 | | | | | FGLMC | | 6.000 | | | 07/01/39 | | | 4,168 | |
| | 4,481,140 | | | | | FGLMC | | 4.500 | | | 11/01/40 | | | 4,791 | |
| | 5,135,764 | | | | | FGLMC | | 4.500 | | | 12/01/40 | | | 5,472 | |
| | 10,000,000 | | | h | | FGLMC | | 3.500 | | | 01/15/44 | | | 9,922 | |
| | 9,000,000 | | | h | | FGLMC | | 4.000 | | | 01/15/44 | | | 9,243 | |
| | 1,000,000 | | | h | | FGLMC | | 4.500 | | | 01/15/44 | | | 1,058 | |
| | 726,207 | | | | | Federal National Mortgage Association (FNMA) | | 4.521 | | | 05/01/14 | | | 728 | |
| | 3,799,344 | | | | | FNMA | | 4.265 | | | 06/01/14 | | | 3,809 | |
| | 2,756,444 | | | | | FNMA | | 4.530 | | | 10/01/14 | | | 2,790 | |
| | 1,107 | | | | | FNMA | | 8.500 | | | 11/01/14 | | | 1 | |
| | 40,116 | | | | | FNMA | | 6.500 | | | 10/01/16 | | | 42 | |
| | 239,113 | | | | | FNMA | | 6.500 | | | 04/01/17 | | | 253 | |
| | 470,494 | | | | | FNMA | | 5.000 | | | 12/01/17 | | | 501 | |
| | 87,246 | | | | | FNMA | | 6.500 | | | 02/01/18 | | | 92 | |
| | 107,202 | | | | | FNMA | | 5.500 | | | 04/01/18 | | | 115 | |
| | 17,204 | | | | | FNMA | | 5.500 | | | 05/01/18 | | | 18 | |
| | 1,773,345 | | | | | FNMA | | 5.500 | | | 11/01/18 | | | 1,896 | |
| | 1,209,042 | | | | | FNMA | | 5.000 | | | 12/01/18 | | | 1,289 | |
| | 1,169,484 | | | | | FNMA | | 5.000 | | | 01/01/19 | | | 1,252 | |
| | 113,817 | | | | | FNMA | | 6.000 | | | 01/01/19 | | | 126 | |
| | 113,740 | | | | | FNMA | | 6.000 | | | 02/01/19 | | | 126 | |
| | 362,877 | | | | | FNMA | | 4.000 | | | 02/25/19 | | | 382 | |
| | 37,884 | | | | | FNMA | | 4.500 | | | 03/01/19 | | | 40 | |
| | 198,357 | | | | | FNMA | | 4.500 | | | 05/01/19 | | | 211 | |
| | 307,826 | | | | | FNMA | | 4.500 | | | 06/01/19 | | | 328 | |
| | 351,559 | | | | | FNMA | | 5.000 | | | 03/01/20 | | | 375 | |
| | 159,973 | | | | | FNMA | | 4.500 | | | 11/01/20 | | | 170 | |
| | 301,763 | | | | | FNMA | | 5.000 | | | 12/01/20 | | | 325 | |
| | 570,294 | | | | | FNMA | | 5.000 | | | 03/01/21 | | | 608 | |
| | 1,102,547 | | | | | FNMA | | 5.500 | | | 08/01/21 | | | 1,204 | |
| | 388,904 | | | | | FNMA | | 4.500 | | | 03/01/23 | | | 414 | |
| | 22,297 | | | | | FNMA | | 8.000 | | | 03/01/23 | | | 25 | |
| | 1,063,633 | | | | | FNMA | | 5.000 | | | 07/01/23 | | | 1,148 | |
| | 64,466 | | | | | FNMA | | 5.000 | | | 01/01/24 | | | 70 | |
| | 205,083 | | | | | FNMA | | 5.500 | | | 02/01/24 | | | 225 | |
| | 619,389 | | | | | FNMA | | 4.000 | | | 05/01/24 | | | 657 | |
| | 43,099 | | | | | FNMA | | 8.000 | | | 07/01/24 | | | 50 | |
COLLEGE RETIREMENT EQUITIES FUND - Social Choice Account
| | | | | | | | | | | MATURITY | | VALUE | |
| PRINCIPAL | | | | | ISSUER | | RATE | | DATE | | (000) | |
| $ | 861,636 | | | | | FNMA | | 4.500 | % | | 08/01/24 | | $ | 918 | |
| | 3,504,288 | | | | | FNMA | | 4.000 | | | 09/01/24 | | | 3,716 | |
| | 6,293,166 | | | | | FNMA | | 3.000 | | | 05/01/27 | | | 6,432 | |
| | 13,000,000 | | | h | | FNMA | | 2.500 | | | 01/25/29 | | | 12,866 | |
| | 28,000,000 | | | h | | FNMA | | 3.000 | | | 01/25/29 | | | 28,574 | |
| | 11,000,000 | | | h | | FNMA | | 3.500 | | | 01/25/29 | | | 11,503 | |
| | 13,000,000 | | | h | | FNMA | | 4.000 | | | 01/25/29 | | | 13,775 | |
| | 16,000,000 | | | h | | FNMA | | 3.500 | | | 02/25/29 | | | 16,689 | |
| | 24,000,000 | | | | | FNMA | | 3.000 | | | 03/25/31 | | | 24,825 | |
| | 647,253 | | | | | FNMA | | 6.500 | | | 07/01/32 | | | 726 | |
| | 903,678 | | | | | FNMA | | 4.500 | | | 03/25/33 | | | 945 | |
| | 196,629 | | | | | FNMA | | 4.500 | | | 09/01/33 | | | 211 | |
| | 5,929,478 | | | | | FNMA | | 3.000 | | | 10/01/33 | | | 5,842 | |
| | 893,203 | | | | | FNMA | | 5.000 | | | 11/01/33 | | | 985 | |
| | 1,368,887 | | | | | FNMA | | 5.500 | | | 11/01/33 | | | 1,531 | |
| | 1,045,934 | | | | | FNMA | | 5.500 | | | 11/01/33 | | | 1,170 | |
| | 767,843 | | | | | FNMA | | 5.500 | | | 11/01/33 | | | 851 | |
| | 1,140,343 | | | | | FNMA | | 5.500 | | | 11/01/33 | | | 1,275 | |
| | 686,220 | | | | | FNMA | | 5.500 | | | 11/01/33 | | | 768 | |
| | 140,720 | | | | | FNMA | | 5.500 | | | 12/01/33 | | | 156 | |
| | 87,798 | | | | | FNMA | | 7.000 | | | 01/01/34 | | | 96 | |
| | 14,304 | | | | | FNMA | | 4.500 | | | 05/01/34 | | | 15 | |
| | 11,871 | | | | | FNMA | | 4.500 | | | 05/01/34 | | | 13 | |
| | 196,056 | | | | | FNMA | | 4.500 | | | 05/01/34 | | | 208 | |
| | 13,806 | | | | | FNMA | | 4.500 | | | 06/01/34 | | | 15 | |
| | 17,946 | | | | | FNMA | | 4.500 | | | 06/01/34 | | | 19 | |
| | 11,235 | | | | | FNMA | | 4.500 | | | 06/01/34 | | | 12 | |
| | 67,420 | | | | | FNMA | | 4.500 | | | 06/01/34 | | | 72 | |
| | 13,968 | | | | | FNMA | | 4.500 | | | 07/01/34 | | | 15 | |
| | 29,700 | | | | | FNMA | | 4.500 | | | 07/01/34 | | | 32 | |
| | 89,514 | | | | | FNMA | | 4.500 | | | 07/01/34 | | | 95 | |
| | 583,742 | | | | | FNMA | | 4.500 | | | 08/01/34 | | | 618 | |
| | 13,361 | | | | | FNMA | | 4.500 | | | 08/01/34 | | | 14 | |
| | 25,275 | | | | | FNMA | | 4.500 | | | 09/01/34 | | | 27 | |
| | 289,950 | | | | | FNMA | | 6.000 | | | 12/01/34 | | | 326 | |
| | 531,080 | | | | | FNMA | | 5.500 | | | 04/01/35 | | | 585 | |
| | 1,194,854 | | | | | FNMA | | 6.000 | | | 05/01/35 | | | 1,342 | |
| | 35,822 | | | | | FNMA | | 7.500 | | | 06/01/35 | | | 39 | |
| | 258,852 | | | | | FNMA | | 6.000 | | | 07/01/35 | | | 290 | |
| | 575,163 | | | | | FNMA | | 4.500 | | | 08/01/35 | | | 611 | |
| | 419,700 | | | i | | FNMA | | 2.526 | | | 02/01/36 | | | 447 | |
| | 833,147 | | | | | FNMA | | 6.500 | | | 02/01/36 | | | 926 | |
| | 885,632 | | | | | FNMA | | 6.000 | | | 03/01/36 | | | 988 | |
| | 748,111 | | | i | | FNMA | | 2.379 | | | 07/01/36 | | | 805 | |
| | 479,453 | | | | | FNMA | | 6.000 | | | 12/01/36 | | | 532 | |
| | 3,823,956 | | | i | | FNMA | | 5.784 | | | 01/01/37 | | | 4,088 | |
| | 461,114 | | | | | FNMA | | 7.000 | | | 02/01/37 | | | 523 | |
| | 1,207,043 | | | | | FNMA | | 6.500 | | | 03/01/37 | | | 1,347 | |
| | 361,737 | | | | | FNMA | | 7.000 | | | 04/01/37 | | | 390 | |
| | 329,387 | | | | | FNMA | | 6.500 | | | 08/01/37 | | | 366 | |
| | 1,206,966 | | | | | FNMA | | 6.000 | | | 09/01/37 | | | 1,342 | |
| | 1,191,747 | | | | | FNMA | | 6.000 | | | 09/01/37 | | | 1,340 | |
| | 876,343 | | | | | FNMA | | 6.000 | | | 09/01/37 | | | 987 | |
COLLEGE RETIREMENT EQUITIES FUND - Social Choice Account
| | | | | | | | | | | MATURITY | | VALUE | |
| PRINCIPAL | | | | | ISSUER | | RATE | | DATE | | (000) | |
| $ | 911,926 | | | | | FNMA | | 6.000 | % | | 09/01/37 | | $ | 1,026 | |
| | 195,547 | | | | | FNMA | | 6.500 | | | 09/01/37 | | | 218 | |
| | 425,242 | | | | | FNMA | | 6.500 | | | 09/01/37 | | | 472 | |
| | 513,312 | | | i | | FNMA | | 2.400 | | | 10/01/37 | | | 546 | |
| | 388,640 | | | | | FNMA | | 7.000 | | | 11/01/37 | | | 430 | |
| | 22,921 | | | | | FNMA | | 6.500 | | | 02/01/38 | | | 26 | |
| | 68,198 | | | | | FNMA | | 6.500 | | | 03/01/38 | | | 76 | |
| | 715,830 | | | i | | FNMA | | 2.020 | | | 10/01/38 | | | 764 | |
| | 8,972,771 | | | | | FNMA | | 5.500 | | | 12/01/38 | | | 9,856 | |
| | 401,524 | | | | | FNMA | | 6.000 | | | 01/01/39 | | | 444 | |
| | 502,975 | | | | | FNMA | | 6.000 | | | 01/01/39 | | | 556 | |
| | 2,279,579 | | | | | FNMA | | 4.000 | | | 04/01/39 | | | 2,354 | |
| | 1,580,511 | | | | | FNMA | | 4.500 | | | 08/01/39 | | | 1,675 | |
| | 3,097,816 | | | | | FNMA | | 5.500 | | | 08/01/39 | | | 3,413 | |
| | 2,880,365 | | | | | FNMA | | 3.500 | | | 10/01/42 | | | 2,864 | |
| | 1,948,702 | | | | | FNMA | | 3.000 | | | 02/01/43 | | | 1,854 | |
| | 27,783,476 | | | | | FNMA | | 3.000 | | | 04/01/43 | | | 26,407 | |
| | 10,322,117 | | | | | FNMA | | 3.000 | | | 05/01/43 | | | 9,810 | |
| | 5,774,085 | | | | | FNMA | | 3.000 | | | 05/01/43 | | | 5,490 | |
| | 3,886,755 | | | | | FNMA | | 3.000 | | | 05/01/43 | | | 3,694 | |
| | 61,000,000 | | | h | | FNMA | | 4.000 | | | 01/25/44 | | | 62,792 | |
| | 58,000,000 | | | h | | FNMA | | 4.500 | | | 01/25/44 | | | 61,455 | |
| | 65,000,000 | | | h | | FNMA | | 5.000 | | | 01/25/44 | | | 70,591 | |
| | 17,000,000 | | | h | | FNMA | | 5.500 | | | 01/25/44 | | | 18,699 | |
| | 161,000,000 | | | h | | FNMA | | 3.500 | | | 02/25/44 | | | 159,453 | |
| | 109,000,000 | | | h | | FNMA | | 4.000 | | | 02/25/44 | | | 111,861 | |
| | 25,426 | | | | | Government National Mortgage Association (GNMA) | | 9.000 | | | 12/15/17 | | | 28 | |
| | 5,439,683 | | | | | GNMA | | 2.300 | | | 10/15/19 | | | 5,587 | |
| | 18,864 | | | | | GNMA | | 8.000 | | | 06/15/22 | | | 21 | |
| | 25,301 | | | | | GNMA | | 6.500 | | | 08/15/23 | | | 28 | |
| | 9,718 | | | | | GNMA | | 6.500 | | | 08/15/23 | | | 11 | |
| | 7,973,821 | | | | | GNMA | | 2.580 | | | 08/15/25 | | | 8,127 | |
| | 134,241 | | | | | GNMA | | 6.500 | | | 05/20/31 | | | 155 | |
| | 9,660,009 | | | | | GNMA | | 2.640 | | | 01/15/33 | | | 9,200 | |
| | 366,144 | | | | | GNMA | | 5.500 | | | 07/15/33 | | | 407 | |
| | 221,757 | | | | | GNMA | | 6.000 | | | 10/20/36 | | | 250 | |
| | 236,699 | | | | | GNMA | | 6.000 | | | 01/20/37 | | | 267 | |
| | 783,061 | | | | | GNMA | | 5.500 | | | 02/15/37 | | | 861 | |
| | 1,237,276 | | | | | GNMA | | 6.000 | | | 02/20/37 | | | 1,393 | |
| | 581,560 | | | | | GNMA | | 5.000 | | | 04/15/38 | | | 631 | |
| | 455,984 | | | | | GNMA | | 6.000 | | | 08/20/38 | | | 513 | |
| | 880,762 | | | | | GNMA | | 6.500 | | | 11/20/38 | | | 987 | |
| | 2,448,737 | | | | | GNMA | | 4.500 | | | 07/20/39 | | | 2,630 | |
| | 773,676 | | | | | GNMA | | 5.000 | | | 07/20/39 | | | 840 | |
| | 938,888 | | | | | GNMA | | 4.000 | | | 08/15/39 | | | 977 | |
| | 8,855,081 | | | | | GNMA | | 5.000 | | | 09/20/43 | | | 9,625 | |
| | 56,000,000 | | | h | | GNMA | | 3.000 | | | 01/15/44 | | | 54,079 | |
| | 70,000,000 | | | h | | GNMA | | 3.500 | | | 01/15/44 | | | 70,550 | |
| | 22,000,000 | | | h | | GNMA | | 4.000 | | | 01/15/44 | | | 22,860 | |
| | 37,000,000 | | | h | | GNMA | | 4.500 | | | 01/15/44 | | | 39,477 | |
| | 11,000,000 | | | h | | GNMA | | 6.000 | | | 01/15/44 | | | 12,224 | |
| | 23,000,000 | | | h | | GNMA | | 3.500 | | | 01/20/44 | | | 23,202 | |
| | 8,000,000 | | | h | | GNMA | | 4.500 | | | 01/20/44 | | | 8,553 | |
| | | | | | | TOTAL MORTGAGE BACKED | | | | | | | | 1,097,791 | |
COLLEGE RETIREMENT EQUITIES FUND - Social Choice Account
| | | | | | | | | | | MATURITY | | VALUE | |
| PRINCIPAL | | | | | ISSUER | | RATE | | DATE | | (000) | |
| MUNICIPAL BONDS - 2.6% | | | | | | | | |
| $ | 6,520,000 | | | | | American Municipal Power | | 6.270 | % | | 02/15/50 | | $ | 6,859 | |
| | 4,500,000 | | | g | | Basin Electric Power Coop | | 6.127 | | | 06/01/41 | | | 4,471 | |
| | 1,090,000 | | | | | Bay Area Water Supply & Conservation Agency | | 1.311 | | | 10/01/17 | | | 1,072 | |
| | 3,790,000 | | | | | Bay Area Water Supply & Conservation Agency | | 2.535 | | | 10/01/21 | | | 3,555 | |
| | 3,325,000 | | | | | Bay Area Water Supply & Conservation Agency | | 2.735 | | | 10/01/22 | | | 3,096 | |
| | 2,635,000 | | | | | Bay Area Water Supply & Conservation Agency | | 3.015 | | | 10/01/24 | | | 2,399 | |
| | 3,000,000 | | | | | Broward County FL Water & Sewer Utility Revenue | | 1.350 | | | 10/01/16 | | | 2,967 | |
| | 1,410,000 | | | | | Broward County FL Water & Sewer Utility Revenue | | 1.910 | | | 10/01/18 | | | 1,358 | |
| | 6,165,000 | | | | | California Pollution Control Financing Authority | | 5.000 | | | 07/01/27 | | | 6,088 | |
| | 8,020,000 | | | | | California Pollution Control Financing Authority | | 5.000 | | | 07/01/37 | | | 7,072 | |
| | 3,700,000 | | | | | Calleguas Municipal Water District | | 2.030 | | | 07/01/18 | | | 3,600 | |
| | 2,390,000 | | | | | Charlotte-Mecklenburg Hospital Authority | | 5.000 | | | 08/01/15 | | | 2,485 | |
| | 1,400,000 | | | | | Chelan County Public Utility District No | | 1.398 | | | 07/01/14 | | | 1,405 | |
| | 2,300,000 | | | | | Chelan County Public Utility District No | | 1.867 | | | 07/01/15 | | | 2,329 | |
| | 5,000,000 | | | | | Chicago Metropolitan Water Reclamation District-Greater Chicago | | 5.720 | | | 12/01/38 | | | 5,316 | |
| | 1,250,000 | | | | | City & County of Honolulu, HI | | 6.114 | | | 07/01/29 | | | 1,349 | |
| | 4,000,000 | | | | | City of Dallas, TX | | 5.078 | | | 02/15/22 | | | 4,326 | |
| | 1,500,000 | | | | | City of Dallas, TX | | 5.195 | | | 02/15/35 | | | 1,517 | |
| | 810,000 | | | | | City of Eugene, OR | | 6.320 | | | 08/01/22 | | | 863 | |
| | 260,000 | | | | | City of Jersey City NJ | | 0.942 | | | 09/01/14 | | | 260 | |
| | 1,615,000 | | | | | City of Jersey City NJ | | 1.192 | | | 09/01/15 | | | 1,614 | |
| | 2,200,000 | | | | | City of Jersey City NJ | | 1.509 | | | 09/01/16 | | | 2,189 | |
| | 2,180,000 | | | | | City of Jersey City NJ | | 1.829 | | | 09/01/17 | | | 2,155 | |
| | 500,000 | | | | | City of Jersey City NJ | | 2.079 | | | 09/01/18 | | | 488 | |
| | 925,000 | | | | | City of Jersey City NJ | | 2.423 | | | 09/01/19 | | | 893 | |
| | 5,000,000 | | | | | City of New York, NY | | 4.500 | | | 06/01/15 | | | 5,078 | |
| | 4,500,000 | | | | | City of Seattle WA Municipal Light & Power Revenue | | 3.500 | | | 06/01/30 | | | 4,001 | |
| | 1,000,000 | | | | | Commonwealth Financing Authority | | 1.159 | | | 06/01/16 | | | 994 | |
| | 1,000,000 | | | | | Commonwealth Financing Authority | | 2.675 | | | 06/01/21 | | | 922 | |
| | 1,150,000 | | | | | Commonwealth Financing Authority | | 2.875 | | | 06/01/22 | | | 1,047 | |
| | 2,310,000 | | | | | Commonwealth Financing Authority | | 3.075 | | | 06/01/23 | | | 2,079 | |
| | 24,000,000 | | | | | Commonwealth of Massachusetts | | 5.000 | | | 08/01/33 | | | 25,571 | |
| | 5,000,000 | | | | | Commonwealth of Massachusetts | | 5.456 | | | 12/01/39 | | | 5,351 | |
| | 1,435,000 | | | | | County of Mercer, NJ | | 5.380 | | | 02/01/17 | | | 1,464 | |
| | 4,000,000 | | | | | Dallas County Hospital District | | 5.621 | | | 08/15/44 | | | 4,380 | |
| | 1,680,000 | | | | | Douglas County Public Utility District No 1 Wells Hydroelectric | | 5.112 | | | 09/01/18 | | | 1,770 | |
| | 5,750,000 | | | | | Fiscal Year 2005 Securitization Corp | | 4.760 | | | 08/15/19 | | | 6,135 | |
| | 500,000 | | | | | Florida Governmental Utility Authority | | 2.000 | | | 10/01/16 | | | 494 | |
| | 9,750,000 | | | | | Florida Hurricane Catastrophe Fund Finance Corp | | 1.298 | | | 07/01/16 | | | 9,761 | |
| | 8,875,000 | | | j | | Garden State Preservation Trust | | 0.000 | | | 11/01/22 | | | 6,587 | |
| | 500,000 | | | | | Grant County Public Utility District No 2 | | 4.700 | | | 01/01/28 | | | 485 | |
| | 1,000,000 | | | | | Grant County Public Utility District No 2 | | 5.470 | | | 01/01/34 | | | 1,010 | |
| | 1,250,000 | | | | | Grant County Public Utility District No 2 | | 4.164 | | | 01/01/35 | | | 1,131 | |
| | 4,135,000 | | | | | Greene County OH | | 2.720 | | | 12/01/21 | | | 3,926 | |
| | 4,365,000 | | | | | Greene County OH | | 3.120 | | | 12/01/23 | | | 4,052 | |
| | 4,615,000 | | | | | Greene County OH | | 3.270 | | | 12/01/24 | | | 4,249 | |
| | 4,755,000 | | | | | Greene County OH | | 3.420 | | | 12/01/25 | | | 4,367 | |
| | 1,800,000 | | | | | Guadalupe Valley Electric Coop, Inc | | 5.671 | | | 10/01/32 | | | 1,606 | |
COLLEGE RETIREMENT EQUITIES FUND - Social Choice Account
| | | | | | | | | | | MATURITY | | VALUE | |
| PRINCIPAL | | | | | ISSUER | | RATE | | DATE | | (000) | |
| $ | 975,000 | | | | | Guadalupe-Blanco River Authority Industrial Development Corp | | 3.287 | % | | 04/15/23 | | $ | 924 | |
| | 3,490,000 | | | | | Guadalupe-Blanco River Authority Industrial Development Corp | | 4.633 | | | 04/15/33 | | | 3,263 | |
| | 17,985,000 | | | | | Irvine Ranch Water District Joint Powers Agency | | 2.388 | | | 03/15/14 | | | 17,999 | |
| | 1,000,000 | | | | | Kansas Development Finance Authority | | 4.592 | | | 05/01/14 | | | 1,011 | |
| | 1,350,000 | | | | | Kansas Development Finance Authority | | 4.722 | | | 05/01/15 | | | 1,405 | |
| | 995,000 | | | | | Massachusetts Housing Finance Agency | | 1.306 | | | 06/01/16 | | | 986 | |
| | 545,000 | | | | | Massachusetts Housing Finance Agency | | 1.776 | | | 06/01/17 | | | 536 | |
| | 5,655,000 | | | | | Massachusetts Housing Finance Agency | | 4.782 | | | 12/01/20 | | | 5,819 | |
| | 5,400,000 | | | | | Massachusetts St. Water Pollution Abatement | | 5.192 | | | 08/01/40 | | | 5,722 | |
| | 3,500,000 | | | | | Metropolitan Council | | 1.750 | | | 09/01/20 | | | 3,277 | |
| | 3,000,000 | | | | | Metropolitan Washington Airports Authority | | 5.690 | | | 10/01/30 | | | 3,107 | |
| | 5,000,000 | | | | | Metropolitan Water District of Southern California | | 6.250 | | | 07/01/39 | | | 5,294 | |
| | 750,000 | | | | | Metropolitan Water Reclamation District of Greater Chicago | | 2.229 | | | 12/01/16 | | | 768 | |
| | 5,000,000 | | | | | Mississippi Development Bank Special Obligation | | 5.320 | | | 07/01/14 | | | 5,079 | |
| | 1,130,000 | | | | | New York State Energy Research & Development Authority | | 1.028 | | | 07/01/16 | | | 1,124 | |
| | 1,590,000 | | | | | New York State Energy Research & Development Authority | | 2.372 | | | 07/01/19 | | | 1,568 | |
| | 1,285,000 | | | | | New York State Energy Research & Development Authority | | 2.772 | | | 07/01/20 | | | 1,262 | |
| | 1,590,000 | | | | | New York State Energy Research & Development Authority | | 3.206 | | | 07/01/22 | | | 1,557 | |
| | 1,000,000 | | | | | New York State Environmental Facilities Corp | | 1.755 | | | 06/15/18 | | | 976 | |
| | 1,200,000 | | | | | New York State Environmental Facilities Corp | | 2.005 | | | 06/15/19 | | | 1,157 | |
| | 1,220,000 | | | | | New York State Environmental Facilities Corp | | 2.595 | | | 06/15/21 | | | 1,155 | |
| | 1,255,000 | | | | | New York State Environmental Facilities Corp | | 3.045 | | | 06/15/24 | | | 1,150 | |
| | 1,225,000 | | | | | New York State Environmental Facilities Corp | | 3.195 | | | 06/15/25 | | | 1,117 | |
| | 500,000 | | | | | New York State Environmental Facilities Corp | | 3.684 | | | 12/15/29 | | | 449 | |
| | 3,000,000 | | | | | New York State Urban Development Corp | | 6.500 | | | 12/15/18 | | | 3,339 | |
| | 2,230,000 | | | | | Newport News Economic Development Authority | | 5.640 | | | 01/15/29 | | | 2,422 | |
| | 270,000 | | | | | Newport News Economic Development Authority | | 5.640 | | | 01/15/29 | | | 279 | |
| | 1,250,000 | | | | | Niagara Area Development Corp | | 4.000 | | | 11/01/24 | | | 1,140 | |
| | 4,750,000 | | | | | Northern California Power Agency | | 4.320 | | | 07/01/24 | | | 4,484 | |
| | 2,450,000 | | | | | Ohio State Water Development Authority | | 4.879 | | | 12/01/34 | | | 2,509 | |
| | 2,500,000 | | | | | Oklahoma Capital Improvement Authority | | 5.180 | | | 07/01/14 | | | 2,559 | |
| | 825,000 | | | | | Pend Oreille County Public Utility District No Box Canyon | | 0.984 | | | 01/01/14 | | | 825 | |
| | 715,000 | | | | | Pend Oreille County Public Utility District No Box Canyon | | 1.406 | | | 01/01/15 | | | 716 | |
| | 1,220,000 | | | | | Pend Oreille County Public Utility District No Box Canyon | | 1.987 | | | 01/01/16 | | | 1,222 | |
| | 1,000,000 | | | | | Pend Oreille County Public Utility District No Box Canyon | | 2.417 | | | 01/01/17 | | | 1,002 | |
| | 1,000,000 | | | | | Pend Oreille County Public Utility District No Box Canyon | | 2.787 | | | 01/01/18 | | | 991 | |
| | 1,000,000 | | | | | Pend Oreille County Public Utility District No Box Canyon | | 3.037 | | | 01/01/19 | | | 983 | |
| | 1,070,000 | | | | | Pend Oreille County Public Utility District No Box Canyon | | 3.621 | | | 01/01/21 | | | 1,039 | |
| | 10,110,000 | | | | | Semitropic Improvement District | | 2.800 | | | 12/01/22 | | | 9,495 | |
| | 1,750,000 | | | | | South Dakota Conservancy District | | 1.013 | | | 08/01/16 | | | 1,743 | |
| | 3,330,000 | | | | | South Dakota Conservancy District | | 1.648 | | | 08/01/18 | | | 3,274 | |
| | 3,975,000 | | | | | State of California | | 1.050 | | | 02/01/16 | | | 3,986 | |
| | 7,050,000 | | | | | State of California | | 4.988 | | | 04/01/39 | | | 6,654 | |
| | 5,000,000 | | | | | State of Connecticut | | 5.090 | | | 10/01/30 | | | 5,097 | |
| | 2,050,000 | | | | | State of Hawaii | | 4.670 | | | 05/01/14 | | | 2,075 | |
| | 5,000,000 | | | | | State of Illinois | | 4.071 | | | 01/01/14 | | | 5,000 | |
| | 5,570,000 | | | | | State of Illinois | | 4.350 | | | 06/01/18 | | | 5,779 | |
| | 9,000,000 | | | | | State of Illinois | | 5.520 | | | 04/01/38 | | | 8,100 | |
| | 5,000,000 | | | | | State of Michigan | | 2.302 | | | 11/01/14 | | | 5,082 | |
| | 4,505,000 | | | | | State of Michigan | | 3.375 | | | 12/01/20 | | | 4,517 | |
| | 2,500,000 | | | | | State of Ohio | | 5.412 | | | 09/01/28 | | | 2,718 | |
COLLEGE RETIREMENT EQUITIES FUND - Social Choice Account
| | | | | | | | | | | MATURITY | | VALUE | |
| PRINCIPAL | | | | | ISSUER | | RATE | | DATE | | (000) | |
| $ | 3,050,000 | | | | | State of Oregon | | 5.030 | % | | 08/01/14 | | $ | 3,126 | |
| | 3,265,000 | | | | | State of Texas | | 4.900 | | | 08/01/20 | | | 3,405 | |
| | 5,000,000 | | | | | State of Texas | | 6.072 | | | 10/01/29 | | | 5,473 | |
| | 3,165,000 | | | | | State of Washington | | 5.050 | | | 01/01/18 | | | 3,157 | |
| | 1,033,000 | | | | | State of Wisconsin | | 5.700 | | | 05/01/26 | | | 1,137 | |
| | 5,000,000 | | | | | Tuolumne Wind Project Authority | | 6.918 | | | 01/01/34 | | | 5,301 | |
| | 600,000 | | | | | West Virginia Water Development Authority | | 5.000 | | | 11/01/21 | | | 694 | |
| | 1,345,000 | | | | | West Virginia Water Development Authority | | 5.000 | | | 11/01/22 | | | 1,552 | |
| | 1,000,000 | | | | | West Virginia Water Development Authority | | 5.000 | | | 11/01/23 | | | 1,152 | |
| | | | | | | TOTAL MUNICIPAL BONDS | | | | | | | | 344,918 | |
| | | | | | | | | | | | | | | | |
| U.S. TREASURY SECURITIES - 3.0% | | | | | | | | | |
| | 6,000,000 | | | | | United States Treasury Bond | | 3.125 | | | 02/15/43 | | | 5,137 | |
| | 131,045,000 | | | | | United States Treasury Bond | | 2.875 | | | 05/15/43 | | | 106,208 | |
| | 62,390,000 | | | | | United States Treasury Bond | | 3.625 | | | 08/15/43 | | | 58,920 | |
| | 5,985,000 | | | | | United States Treasury Note | | 0.250 | | | 05/31/14 | | | 5,989 | |
| | 22,395,000 | | | | | United States Treasury Note | | 2.375 | | | 08/31/14 | | | 22,725 | |
| | 3,631,000 | | | | | United States Treasury Note | | 2.500 | | | 04/30/15 | | | 3,741 | |
| | 10,690,000 | | | | | United States Treasury Note | | 0.250 | | | 05/31/15 | | | 10,695 | |
| | 17,895,000 | | | | | United States Treasury Note | | 1.875 | | | 06/30/15 | | | 18,328 | |
| | 21,500,000 | | | | | United States Treasury Note | | 0.250 | | | 07/31/15 | | | 21,499 | |
| | 25,195,000 | | | | | United States Treasury Note | | 0.500 | | | 06/15/16 | | | 25,169 | |
| | 6,000,000 | | | | | United States Treasury Note | | 0.625 | | | 07/15/16 | | | 6,007 | |
| | 6,606,000 | | | | | United States Treasury Note | | 0.875 | | | 09/15/16 | | | 6,645 | |
| | 5,140,000 | | | | | United States Treasury Note | | 0.625 | | | 12/15/16 | | | 5,119 | |
| | 32,466,900 | | | | | United States Treasury Note | | 1.250 | | | 11/30/18 | | | 31,772 | |
| | 6,500,000 | | | | | United States Treasury Note | | 1.500 | | | 12/31/18 | | | 6,427 | |
| | 4,300,000 | | | | | United States Treasury Note | | 1.875 | | | 06/30/20 | | | 4,196 | |
| | 12,234,500 | | | | | United States Treasury Note | | 1.625 | | | 11/15/22 | | | 11,044 | |
| | 49,910,000 | | | | | United States Treasury Note | | 2.750 | | | 11/15/23 | | | 48,826 | |
| | | | | | | TOTAL U.S. TREASURY SECURITIES | | | | | | | | 398,447 | |
| | | | | | | | | | | | | | | | |
| | | | | | | TOTAL GOVERNMENT BONDS | | | | | | | | 2,980,013 | |
| | | | | | | (Cost $2,984,883) | | | | | | | | | |
| | | | | | | | | | | | | | | | |
| STRUCTURED ASSETS - 1.4% | | | | | | | | | |
| | | | | | | | | | | | | | | | |
| ASSET BACKED - 0.6% | | | | | | | | | |
| | 1,500,000 | | | | | AmeriCredit Automobile Receivables Trust | | 1.570 | | | 01/08/19 | | | 1,484 | |
| | | | | | | Series - 2013 1 (Class C) | | | | | | | | | |
| | 3,750,000 | | | g | | Avis Budget Rental Car Funding AESOP LLC | | 6.740 | | | 05/20/16 | | | 3,970 | |
| | | | | | | Series - 2010 3A (Class B) | | | | | | | | | |
| | 4,500,000 | | | g | | Avis Budget Rental Car Funding AESOP LLC | | 5.110 | | | 03/20/17 | | | 4,813 | |
| | | | | | | Series - 2010 5A (Class B) | | | | | �� | | | | |
| | 4,000,000 | | | g | | Avis Budget Rental Car Funding AESOP LLC | | 4.720 | | | 02/20/18 | | | 4,272 | |
| | | | | | | Series - 2011 5A (Class B) | | | | | | | | | |
| | 803,818 | | | i | | Bear Stearns Asset Backed Securities Trust | | 0.905 | | | 11/25/39 | | | 789 | |
| | | | | | | Series - 2005 SD3 (Class 2A1) | | | | | | | | | |
| | 900,000 | | | | | Capital Auto Receivables Asset Trust | | 1.290 | | | 04/20/18 | | | 891 | |
| | | | | | | Series - 2013 1 (Class B) | | | | | | | | | |
| | 975,000 | | | | | Capital Auto Receivables Asset Trust | | 1.740 | | | 10/22/18 | | | 963 | |
| | | | | | | Series - 2013 1 (Class C) | | | | | | | | | |
| | 3,501,139 | | | i | | Chase Funding Loan Acquisition Trust | | 1.020 | | | 06/25/34 | | | 3,220 | |
| | | | | | | Series - 2004 OPT1 (Class M1) | | | | | | | | | |
COLLEGE RETIREMENT EQUITIES FUND - Social Choice Account
| | | | | | | | | | | MATURITY | | VALUE | |
| PRINCIPAL | | | | | ISSUER | | RATE | | DATE | | (000) | |
| $ | 548,521 | | | g,i | | Credit-Based Asset Servicing and Securitization LLC | | 6.159 | % | | 12/25/36 | | $ | 552 | |
| | | | | | | Series - 2007 MX1 (Class A1) | | | | | | | | | |
| | 1,715,000 | | | g,i | | DB/UBS Mortgage Trust | | 5.557 | | | 11/10/46 | | | 1,850 | |
| | | | | | | Series - 2011 LC1A (Class C) | | | | | | | | | |
| | 12,658,750 | | | g | | Dominos Pizza Master Issuer LLC | | 5.216 | | | 01/25/42 | | | 13,418 | |
| | | | | | | Series - 2012 1A (Class A2) | | | | | | | | | |
| | 1,007,332 | | | g,i | | Flagstar Home Equity Loan Trust | | 5.781 | | | 01/25/35 | | | 1,007 | |
| | | | | | | Series - 2007 1A (Class AF3) | | | | | | | | | |
| | 1,500,000 | | | | | Ford Credit Auto Owner Trust | | 3.210 | | | 07/15/17 | | | 1,547 | |
| | | | | | | Series - 2011 A (Class D) | | | | | | | | | |
| | 500,000 | | | g | | Hertz Vehicle Financing LLC | | 6.440 | | | 02/25/19 | | | 561 | |
| | | | | | | Series - 2010 1A (Class B3) | | | | | | | | | |
| | 2,114,768 | | | i | | Lehman XS Trust | | 0.415 | | | 02/25/36 | | | 1,923 | |
| | | | | | | Series - 2006 1 (Class 1A1) | | | | | | | | | |
| | 5,705,286 | | | | | Lehman XS Trust | | 6.500 | | | 06/25/46 | | | 4,382 | |
| | | | | | | Series - 2006 13 (Class 2A1) | | | | | | | | | |
| | 214,982 | | | i | | Long Beach Mortgage Loan Trust | | 0.915 | | | 02/25/35 | | | 214 | |
| | | | | | | Series - 2005 1 (Class M1) | | | | | | | | | |
| | 1,724,970 | | | i | | Park Place Securities, Inc Asset-Backed Pass-Through Certificates | | 0.685 | | | 01/25/36 | | | 1,714 | |
| | | | | | | Series - 2005 WCH1 (Class M2) | | | | | | | | | |
| | 613,946 | | | i | | Residential Asset Mortgage Products, Inc | | 4.970 | | | 09/25/33 | | | 635 | |
| | | | | | | Series - 2003 RZ5 (Class A7) | | | | | | | | | |
| | 475,615 | | | i | | Residential Asset Securities Corp | | 0.595 | | | 04/25/35 | | | 471 | |
| | | | | | | Series - 2005 KS3 (Class M3) | | | | | | | | | |
| | 4,840,271 | | | | | Residential Funding Mortgage Securities II, Inc | | 5.500 | | | 08/25/25 | | | 4,945 | |
| | | | | | | Series - 2006 HI5 (Class A3) | | | | | | | | | |
| | 1,603,077 | | | | | Residential Funding Mortgage Securities II, Inc | | 5.960 | | | 02/25/36 | | | 1,619 | |
| | | | | | | Series - 2006 HI3 (Class A3) | | | | | | | | | |
| | 2,000,000 | | | i | | Residential Funding Mortgage Securities II, Inc | | 6.010 | | | 02/25/36 | | | 2,041 | |
| | | | | | | Series - 2006 HI1 (Class M1) | | | | | | | | | |
| | 200,000 | | | i | | Residential Funding Mortgage Securities II, Inc | | 6.060 | | | 02/25/36 | | | 211 | |
| | | | | | | Series - 2006 HI1 (Class M2) | | | | | | | | | |
| | 2,000,000 | | | | | Santander Drive Auto Receivables Trust | | 1.760 | | | 01/15/19 | | | 1,984 | |
| | | | | | | Series - 2013 1 (Class C) | | | | | | | | | |
| | 620,449 | | | i | | Securitized Asset Backed Receivables LLC | | 0.465 | | | 10/25/35 | | | 605 | |
| | | | | | | Series - 2006 OP1 (Class A2C) | | | | | | | | | |
| | 3,370,224 | | | g | | Sierra Receivables Funding Co LLC | | 3.420 | | | 03/20/29 | | | 3,420 | |
| | | | | | | Series - 2012 2A (Class B) | | | | | | | | | |
| | 2,717,967 | | | g | | Sierra Receivables Funding Co LLC | | 1.590 | | | 11/20/29 | | | 2,705 | |
| | | | | | | Series - 2013 1A (Class A) | | | | | | | | | |
| | 10,045,000 | | | g | | SLM Student Loan Trust | | 3.740 | | | 02/15/29 | | | 10,477 | |
| | | | | | | Series - 2011 B (Class A2) | | | | | | | | | |
| | 950,739 | | | i | | Soundview Home Equity Loan Trust | | 0.465 | | | 11/25/35 | | | 938 | |
| | | | | | | Series - 2005 OPT3 (Class A4) | | | | | | | | | |
| | 310,122 | | | i | | Structured Asset Investment Loan Trust | | 0.765 | | | 05/25/35 | | | 309 | |
| | | | | | | Series - 2005 4 (Class M1) | | | | | | | | | |
| | 2,174,797 | | | g,i | | Structured Asset Securities Corp | | 0.385 | | | 10/25/36 | | | 2,098 | |
| | | | | | | Series - 2006 GEL4 (Class A2) | | | | | | | | | |
| | 2,750,000 | | | g | | Vornado DP LLC | | 5.280 | | | 09/13/28 | | | 2,974 | |
| | | | | | | Series - 2010 VNO (Class C) | | | | | | | | | |
| | 658,985 | | | g,m | | Wachovia Amortization Controlled Heloc NIM | | 5.683 | | | 08/12/47 | | | 662 | |
| | | | | | | Series - 2006 N1 (Class N1) | | | | | | | | | |
COLLEGE RETIREMENT EQUITIES FUND - Social Choice Account
| | | | | | | | | | | MATURITY | | VALUE | |
| PRINCIPAL | | | | | ISSUER | | RATE | | DATE | | (000) | |
| $ | 927,223 | | | g,i | | Wachovia Loan Trust | | 0.525 | % | | 05/25/35 | | $ | 867 | |
| | | | | | | Series - 2005 SD1 (Class A) | | | | | | | | | |
| | 434,510 | | | i | | Wells Fargo Home Equity Trust | | 0.305 | | | 07/25/36 | | | 430 | |
| | | | | | | Series - 2006 2 (Class A3) | | | | | | | | | |
| | | | | | | TOTAL ASSET BACKED | | | | | | | | 84,961 | |
| | | | | | | | | | | | | | | | |
| OTHER MORTGAGE BACKED - 0.8% | | | | | | | | | |
| | 4,075,000 | | | | | Banc of America Commercial Mortgage Trust | | 5.390 | | | 10/10/45 | | | 4,416 | |
| | | | | | | Series - 2006 6 (Class AM) | | | | | | | | | |
| | 2,200,000 | | | i | | Bear Stearns Commercial Mortgage Securities | | 5.582 | | | 09/11/41 | | | 2,402 | |
| | | | | | | Series - 2006 PW13 (Class AM) | | | | | | | | | |
| | 1,590,000 | | | i | | Bear Stearns Commercial Mortgage Securities | | 5.959 | | | 09/11/42 | | | 1,700 | |
| | | | | | | Series - 2007 T28 (Class AJ) | | | | | | | | | |
| | 1,950,000 | | | | | Bear Stearns Commercial Mortgage Securities | | 5.363 | | | 02/11/44 | | | 2,008 | |
| | | | | | | Series - 2007 PW15 (Class AM) | | | | | | | | | |
| | 46,917 | | | g,i | | Citigroup Commercial Mortgage Trust | | 0.307 | | | 04/15/22 | | | 47 | |
| | | | | | | Series - 2007 FL3A (Class A2) | | | | | | | | | |
| | 5,000,000 | | | i | | COBALT CMBS Commercial Mortgage Trust | | 5.526 | | | 04/15/47 | | | 5,527 | |
| | | | | | | Series - 2007 C2 (Class AMFX) | | | | | | | | | |
| | 2,515,000 | | | i | | Commercial Mortgage Pass Through Certificates | | 5.650 | | | 12/10/49 | | | 2,803 | |
| | | | | | | Series - 2007 C9 (Class AM) | | | | | | | | | |
| | 840,000 | | | i | | Commercial Mortgage Pass-Through Certificates | | 5.791 | | | 06/15/38 | | | 911 | |
| | | | | | | Series - 2006 C3 (Class AM) | | | | | | | | | |
| | 1,720,068 | | | | | Countrywide Alternative Loan Trust | | 5.500 | | | 08/25/16 | | | 1,745 | |
| | | | | | | Series - 2004 30CB (Class 1A15) | | | | | | | | | |
| | 123,274 | | | | | Countrywide Alternative Loan Trust | | 5.500 | | | 08/25/34 | | | 123 | |
| | | | | | | Series - 2004 14T2 (Class A2) | | | | | | | | | |
| | 925,815 | | | | | Countrywide Home Loan Mortgage Pass Through Trust | | 5.250 | | | 02/25/16 | | | 922 | |
| | | | | | | Series - 2005 6 (Class 1A10) | | | | | | | | | |
| | 843,062 | | | | | Countrywide Home Loan Mortgage Pass Through Trust | | 4.750 | | | 09/25/18 | | | 863 | |
| | | | | | | Series - 2003 35 (Class 1A1) | | | | | | | | | |
| | 93,506 | | | | | Countrywide Home Loan Mortgage Pass Through Trust | | 5.250 | | | 05/25/35 | | | 93 | |
| | | | | | | Series - 2005 12 (Class 1A5) | | | | | | | | | |
| | 280,000 | | | i | | Credit Suisse First Boston Mortgage Securities Corp | | 5.100 | | | 08/15/38 | | | 288 | |
| | | | | | | Series - 2005 C5 (Class C) | | | | | | | | | |
| | 1,013,858 | | | g,i | | Credit Suisse Mortgage Capital Certificates | | 0.347 | | | 04/15/22 | | | 1,012 | |
| | | | | | | Series - 2007 TF2A (Class A1) | | | | | | | | | |
| | 3,550,000 | | | g | | Credit Suisse Mortgage Capital Certificates | | 5.626 | | | 05/15/23 | | | 3,875 | |
| | | | | | | Series - 2006 OMA (Class D) | | | | | | | | | |
| | 5,965,000 | | | | | Credit Suisse Mortgage Capital Certificates | | 5.509 | | | 09/15/39 | | | 6,405 | |
| | | | | | | Series - 2006 C4 (Class AM) | | | | | | | | | |
| | 3,500,000 | | | g | | Credit Suisse Mortgage Capital Certificates | | 5.383 | | | 02/15/40 | | | 3,661 | |
| | | | | | | Series - 2009 RR1 (Class A3C) | | | | | | | | | |
| | 2,535,000 | | | g,i | | GS Mortgage Securities Corp II | | 5.225 | | | 12/10/43 | | | 2,737 | |
| | | | | | | Series - 2010 C2 (Class B) | | | | | | | | | |
| | 1,593,988 | | | i | | HarborView Mortgage Loan Trust | | 0.386 | | | 07/19/47 | | | 1,327 | |
| | | | | | | Series - 2007 4 (Class 2A1) | | | | | | | | | |
| | 1,080,588 | | | i | | Impac CMB Trust | | 0.825 | | | 03/25/35 | | | 965 | |
| | | | | | | Series - 2004 11 (Class 2A1) | | | | | | | | | |
| | 2,125,000 | | | g,i | | JP Morgan Chase Commercial Mortgage Securities Corp | | 5.259 | | | 07/15/46 | | | 2,251 | |
| | | | | | | Series - 2011 C4 (Class C) | | | | | | | | | |
| | 2,030,000 | | | i | | JP Morgan Chase Commercial Mortgage Securities Corp | | 5.932 | | | 02/15/51 | | | 2,141 | |
| | | | | | | Series - 2007 C1 (Class AM) | | | | | | | | | |
COLLEGE RETIREMENT EQUITIES FUND - Social Choice Account
| | | | | | | | | | | MATURITY | | VALUE | |
| PRINCIPAL | | | | | ISSUER | | RATE | | DATE | | (000) | |
| $ | 3,780,000 | | | i | | JP Morgan Chase Commercial Mortgage Securities Trust | | 4.911 | % | | 07/15/42 | | $ | 3,790 | |
| | | | | | | Series - 2005 LDP2 (Class C) | | | | | | | | | |
| | 11,910,167 | | | | | JP Morgan Chase Commercial Mortgage Securities Trust | | 5.257 | | | 05/15/47 | | | 12,714 | |
| | | | | | | Series - 2006 LDP9 (Class A1A) | | | | | | | | | |
| | 3,990,000 | | | i | | JP Morgan Chase Commercial Mortgage Securities Trust | | 6.192 | | | 02/15/51 | | | 4,423 | |
| | | | | | | Series - 2007 LD12 (Class AM) | | | | | | | | | |
| | 570,000 | | | | | LB-UBS Commercial Mortgage Trust | | 5.378 | | | 11/15/38 | | | 616 | |
| | | | | | | Series - 2006 C7 (Class AM) | | | | | | | | | |
| | 7,895,000 | | | i | | LB-UBS Commercial Mortgage Trust | | 5.493 | | | 02/15/40 | | | 8,331 | |
| | | | | | | Series - 2007 C2 (Class AM) | | | | | | | | | |
| | 275,000 | | | i | | LB-UBS Commercial Mortgage Trust | | 5.057 | | | 09/15/40 | | | 288 | |
| | | | | | | Series - 2005 C5 (Class AJ) | | | | | | | | | |
| | 1,645,209 | | | i | | Merrill Lynch Mortgage Trust | | 5.107 | | | 07/12/38 | | | 1,737 | |
| | | | | | | Series - 2005 CIP1 (Class AM) | | | | | | | | | |
| | 645,000 | | | i | | Merrill Lynch Mortgage Trust | | 6.263 | | | 02/12/51 | | | 696 | |
| | | | | | | Series - 0 C1 (Class AJA) | | | | | | | | | |
| | 855,000 | | | g,i | | Morgan Stanley Capital I | | 5.810 | | | 08/12/41 | | | 899 | |
| | | | | | | Series - 2006 T23 (Class B) | | | | | | | | | |
| | 710,000 | | | g,i | | Morgan Stanley Capital I | | 5.252 | | | 09/15/47 | | | 731 | |
| | | | | | | Series - 2011 C1 (Class D) | | | | | | | | | |
| | 2,750,000 | | | g | | OBP Depositor LLC Trust | | 4.646 | | | 07/15/45 | | | 2,982 | |
| | | | | | | Series - 2010 OBP (Class A) | | | | | | | | | |
| | 812,640 | | | | | Residential Accredit Loans, Inc | | 4.350 | | | 03/25/34 | | | 826 | |
| | | | | | | Series - 2004 QS4 (Class A1) | | | | | | | | | |
| | 694,782 | | | | | RFMSI Trust | | 5.500 | | | 03/25/35 | | | 703 | |
| | | | | | | Series - 2005 S2 (Class A6) | | | | | | | | | |
| | 1,303,256 | | | g,i | | Springleaf Mortgage Loan Trust | | 2.667 | | | 09/25/57 | | | 1,332 | |
| | | | | | | Series - 2012 1A (Class A) | | | | | | | | | |
| | 1,042,477 | | | g,i | | Springleaf Mortgage Loan Trust | | 2.220 | | | 10/25/57 | | | 1,062 | |
| | | | | | | Series - 0 2A (Class A) | | | | | | | | | |
| | 6,315,000 | | | | | Wachovia Bank Commercial Mortgage Trust | | 5.383 | | | 12/15/43 | | | 6,795 | |
| | | | | | | Series - 2007 C30 (Class AM) | | | | | | | | | |
| | 890,000 | | | i | | Wachovia Bank Commercial Mortgage Trust | | 5.818 | | | 05/15/46 | | | 976 | |
| | | | | | | Series - 2007 C34 (Class AM) | | | | | | | | | |
| | 1,655,000 | | | | | Wachovia Bank Commercial Mortgage Trust | | 5.500 | | | 04/15/47 | | | 1,829 | |
| | | | | | | Series - 2007 C31 (Class A5) | | | | | | | | | |
| | 1,975,000 | | | i | | Wachovia Bank Commercial Mortgage Trust | | 5.591 | | | 04/15/47 | | | 2,150 | |
| | | | | | | Series - 2007 C31 (Class AM) | | | | | | | | | |
| | 3,000,000 | | | i | | Wachovia Bank Commercial Mortgage Trust | | 5.660 | | | 04/15/47 | | | 2,978 | |
| | | | | | | Series - 2007 C31 (Class AJ) | | | | | | | | | |
| | 2,778,553 | | | i | | WaMu Mortgage Pass-Through Certificates | | 0.515 | | | 12/25/45 | | | 2,460 | |
| | | | | | | Series - 2005 AR19 (Class A1B3) | | | | | | | | | |
| | | | | | | TOTAL OTHER MORTGAGE BACKED | | | | | | | | 106,540 | |
| | | | | | | | | | | | | | | | |
| | | | | | | TOTAL STRUCTURED ASSETS | | | | | | | | 191,501 | |
| | | | | | | (Cost $189,314) | | | | | | | | | |
| | | | | | | | | | | | | | | | |
| | | | | | | TOTAL BONDS | | | | | | | | 5,027,604 | |
| | | | | | | (Cost $5,030,108) | | | | | | | | | |
COLLEGE RETIREMENT EQUITIES FUND - Social Choice Account
| | | | | | | | VALUE | |
| SHARES | | | | | COMPANY | | (000) | |
| COMMON STOCKS - 60.4% | | | | |
| | | | | | | | | | | |
| AUTOMOBILES & COMPONENTS - 1.5% | | | | |
| | 67,500 | | | | | Aisin Seiki Co Ltd | | $ | 2,744 | |
| | 127,203 | | | | | Bayerische Motoren Werke AG. | | | 14,938 | |
| | 37,510 | | | | | Bayerische Motoren Werke AG. (Preference) | | | 3,208 | |
| | 15,584 | | | | | BorgWarner, Inc | | | 871 | |
| | 3,000 | | | | | Delphi Automotive plc | | | 180 | |
| | 187,700 | | | | | Denso Corp | | | 9,916 | |
| | 897 | | | * | | Dorman Products, Inc | | | 50 | |
| | 2,776,029 | | | | | Ford Motor Co | | | 42,834 | |
| | 71,000 | | | | | Fuji Heavy Industries Ltd | | | 2,040 | |
| | 252,970 | | | | | GKN plc | | | 1,568 | |
| | 236,929 | | | | | Harley-Davidson, Inc | | | 16,405 | |
| | 384,280 | | | | | Honda Motor Co Ltd | | | 15,862 | |
| | 755,892 | | | | | Johnson Controls, Inc | | | 38,777 | |
| | 25,400 | | | *,e | | Mitsubishi Motors Corp | | | 273 | |
| | 38,400 | | | * | | Modine Manufacturing Co | | | 492 | |
| | 910,900 | | | | | Nissan Motor Co Ltd | | | 7,633 | |
| | 97,815 | | | | | Pirelli & C S.p.A. | | | 1,692 | |
| | 109,499 | | | | | Renault S.A. | | | 8,812 | |
| | 9,200 | | | | | Stanley Electric Co Ltd | | | 211 | |
| | 123,300 | | | | | Suzuki Motor Corp | | | 3,323 | |
| | 107,999 | | | * | | Tenneco, Inc | | | 6,110 | |
| | 7,617 | | | *,e | | Tesla Motors, Inc | | | 1,145 | |
| | 2,900 | | | | | Toyoda Gosei Co Ltd | | | 68 | |
| | 3,500 | | | e | | Toyota Boshoku Corp | | | 44 | |
| | 81,600 | | | | | Toyota Industries Corp | | | 3,689 | |
| | 31,714 | | | | | Volkswagen AG. (Preference) | | | 8,925 | |
| | 102,500 | | | | | Yamaha Motor Co Ltd | | | 1,541 | |
| | | | | | | TOTAL AUTOMOBILES & COMPONENTS | | | 193,351 | |
| | | | | | | | | | | |
| BANKS - 3.6% | | | | |
| | 1,120 | | | e | | Arrow Financial Corp | | | 30 | |
| | 51,058 | | | | | Associated Banc-Corp | | | 888 | |
| | 4,424 | | | | | Astoria Financial Corp | | | 61 | |
| | 532,495 | | | | | Australia & New Zealand Banking Group Ltd | | | 15,372 | |
| | 2,231,892 | | | | | Banca Intesa S.p.A. | | | 5,490 | |
| | 1,640,672 | | | | | Banco Bilbao Vizcaya Argentaria S.A. | | | 20,296 | |
| | 1,723,582 | | | * | | Banco Espirito Santo S.A. | | | 2,462 | |
| | 21,859 | | | | | Bank Mutual Corp | | | 153 | |
| | 25,289 | | | | | Bank of Hawaii Corp | | | 1,496 | |
| | 207,400 | | | e | | Bank of Nova Scotia | | | 12,970 | |
| | 1,632 | | | | | Bank of the Ozarks, Inc | | | 92 | |
| | 971,529 | | | | | BB&T Corp | | | 36,258 | |
| | 10,404 | | | | | BBCN Bancorp, Inc | | | 173 | |
| | 4,422 | | | | | Bendigo Bank Ltd | | | 47 | |
| | 1,093 | | | * | | Beneficial Mutual Bancorp, Inc | | | 12 | |
| | 20,397 | | | | | Boston Private Financial Holdings, Inc | | | 257 | |
| | 47,100 | | | | | CapitalSource, Inc | | | 677 | |
| | 7,221 | | | | | Capitol Federal Financial | | | 87 | |
| | 3,360 | | | | | Cathay General Bancorp | | | 90 | |
COLLEGE RETIREMENT EQUITIES FUND - Social Choice Account
| | | | | | | | VALUE | |
| SHARES | | | | | COMPANY | | (000) | |
| | 5,743 | | | | | Centerstate Banks of Florida, Inc | | $ | 58 | |
| | 10,000 | | | | | CIT Group, Inc | | | 521 | |
| | 2,120 | | | | | Columbia Banking System, Inc | | | 58 | |
| | 165,930 | | | | | Comerica, Inc | | | 7,888 | |
| | 1,273 | | | | | Commerce Bancshares, Inc | | | 57 | |
| | 301,281 | | | | | Commonwealth Bank of Australia | | | 20,992 | |
| | 3,936 | | | | | Community Bank System, Inc | | | 156 | |
| | 753,986 | | | | | Criteria Caixacorp S.A. | | | 3,927 | |
| | 9,127 | | | e | | Cullen/Frost Bankers, Inc | | | 679 | |
| | 236,588 | | | | | DNB NOR Holding ASA | | | 4,246 | |
| | 10,051 | | | | | East West Bancorp, Inc | | | 352 | |
| | 715 | | | | | Federal Agricultural Mortgage Corp (Class C) | | | 25 | |
| | 451 | | | | | First Citizens Bancshares, Inc (Class A) | | | 100 | |
| | 23,976 | | | | | First Commonwealth Financial Corp | | | 212 | |
| | 1,352 | | | | | First Interstate Bancsystem, Inc | | | 38 | |
| | 3,693 | | | | | First Merchants Corp | | | 84 | |
| | 14,422 | | | | | First Midwest Bancorp, Inc | | | 253 | |
| | 2,500 | | | * | | Flagstar Bancorp, Inc | | | 49 | |
| | 16,186 | | | | | FNB Corp | | | 204 | |
| | 2,590 | | | | | Glacier Bancorp, Inc | | | 77 | |
| | 5,441 | | | | | Hancock Holding Co | | | 200 | |
| | 508,500 | | | | | Hang Seng Bank Ltd | | | 8,259 | |
| | 1,267 | | | | | Heartland Financial USA, Inc | | | 37 | |
| | 3,263,060 | | | | | HSBC Holdings plc | | | 35,809 | |
| | 174,643 | | | | | Huntington Bancshares, Inc | | | 1,685 | |
| | 9,593 | | | | | IBERIABANK Corp | | | 603 | |
| | 1,147 | | | | | International Bancshares Corp | | | 30 | |
| | 8,084 | | | | | Investors Bancorp, Inc | | | 207 | |
| | 104,876 | | | | | KBC Groep NV | | | 5,963 | |
| | 1,625,945 | | | | | Keycorp | | | 21,820 | |
| | 16,906 | | | | | Lakeland Bancorp, Inc | | | 209 | |
| | 269,235 | | | e | | M&T Bank Corp | | | 31,344 | |
| | 1,800 | | | | | MB Financial, Inc | | | 58 | |
| | 61,360 | | | * | | MGIC Investment Corp | | | 518 | |
| | 4,070,000 | | | | | Mizuho Financial Group, Inc | | | 8,836 | |
| | 471,296 | | | | | National Australia Bank Ltd | | | 14,710 | |
| | 6,490 | | | | | National Penn Bancshares, Inc | | | 74 | |
| | 1,124,730 | | | | | Natixis | | | 6,617 | |
| | 1,500 | | | | | NBT Bancorp, Inc | | | 39 | |
| | 145,456 | | | e | | New York Community Bancorp, Inc | | | 2,451 | |
| | 644,338 | | | | | Nordea Bank AB | | | 8,688 | |
| | 11,094 | | | | | Northfield Bancorp, Inc | | | 146 | |
| | 19,938 | | | | | Old National Bancorp | | | 307 | |
| | 9,549 | | | e | | PacWest Bancorp | | | 403 | |
| | 4,182 | | | | | Peoples Bancorp, Inc | | | 94 | |
| | 2,728 | | | e | | People’s United Financial, Inc | | | 41 | |
| | 2,500 | | | | | Pinnacle Financial Partners, Inc | | | 81 | |
| | 516,232 | | | | | PNC Financial Services Group, Inc | | | 40,049 | |
| | 55,249 | | | * | | Popular, Inc | | | 1,587 | |
| | 20,422 | | | | | PrivateBancorp, Inc | | | 591 | |
| | 53,363 | | | | | Provident Financial Services, Inc | | | 1,031 | |
| | 577,056 | | | e | | Radian Group, Inc | | | 8,148 | |
COLLEGE RETIREMENT EQUITIES FUND - Social Choice Account
| | | | | | | | VALUE | |
| SHARES | | | | | COMPANY | | (000) | |
| | 155,400 | | | | | Resona Holdings, Inc | | $ | 793 | |
| | 2,569 | | | | | Rockville Financial, Inc | | | 37 | |
| | 250,810 | | | | | Royal Bank of Canada (Toronto) | | | 16,861 | |
| | 1,000 | | | | | S&T Bancorp, Inc | | | 25 | |
| | 3,487 | | | * | | Signature Bank | | | 375 | |
| | 221,278 | | | | | Skandinaviska Enskilda Banken AB (Class A) | | | 2,923 | |
| | 580,389 | | | | | Standard Chartered plc | | | 13,109 | |
| | 261,500 | | | | | Sumitomo Mitsui Financial Group, Inc | | | 13,599 | |
| | 13,277 | | | * | | Sun Bancorp, Inc | | | 47 | |
| | 16,927 | | | | | Susquehanna Bancshares, Inc | | | 217 | |
| | 28,454 | | | * | | SVB Financial Group | | | 2,984 | |
| | 45,092 | | | | | Swedbank AB (A Shares) | | | 1,270 | |
| | 800 | | | * | | Texas Capital Bancshares, Inc | | | 50 | |
| | 157,511 | | | | | Toronto-Dominion Bank | | | 14,844 | |
| | 1,700 | | | | | Trustmark Corp | | | 46 | |
| | 5,465 | | | | | UMB Financial Corp | | | 351 | |
| | 3,150 | | | e | | Umpqua Holdings Corp | | | 60 | |
| | 2,479 | | | e | | Union Bankshares Corp | | | 62 | |
| | 10,908 | | | e | | United Bankshares, Inc | | | 343 | |
| | 1,292,980 | | | | | US Bancorp | | | 52,237 | |
| | 13,956 | | | | | Webster Financial Corp | | | 435 | |
| | 3,652 | | | | | WesBanco, Inc | | | 117 | |
| | 5,233 | | | e | | Westamerica Bancorporation | | | 296 | |
| | 5,690 | | | * | | Western Alliance Bancorp | | | 136 | |
| | 629,923 | | | | | Westpac Banking Corp | | | 18,261 | |
| | 16,588 | | | | | Wilshire Bancorp, Inc | | | 181 | |
| | 1,110 | | | | | Wintrust Financial Corp | | | 51 | |
| | 37,356 | | | | | Zions Bancorporation | | | 1,119 | |
| | | | | | | TOTAL BANKS | | | 478,351 | |
| | | | | | | | | | | |
| CAPITAL GOODS - 5.0% | | | | |
| | 440,679 | | | | | 3M Co | | | 61,805 | |
| | 6,372 | | | | | A.O. Smith Corp | | | 344 | |
| | 13,978 | | | | | Actuant Corp (Class A) | | | 512 | |
| | 5,085 | | | | | Acuity Brands, Inc | | | 556 | |
| | 2,117 | | | * | | Aerovironment, Inc | | | 62 | |
| | 75,930 | | | | | Alfa Laval AB | | | 1,951 | |
| | 464,724 | | | | | Ametek, Inc | | | 24,477 | |
| | 56,219 | | | * | | ArvinMeritor, Inc | | | 586 | |
| | 368,000 | | | e | | Asahi Glass Co Ltd | | | 2,291 | |
| | 51,800 | | | | | Assa Abloy AB (Class B) | | | 2,743 | |
| | 10,969 | | | | | Astec Industries, Inc | | | 424 | |
| | 153,909 | | | | | Atlas Copco AB (A Shares) | | | 4,273 | |
| | 135,146 | | | | | Atlas Copco AB (B Shares) | | | 3,436 | |
| | 116,424 | | | | | Barnes Group, Inc | | | 4,460 | |
| | 2,120 | | | * | | Beacon Roofing Supply, Inc | | | 85 | |
| | 106,747 | | | e | | Bouygues S.A. | | | 4,037 | |
| | 29,997 | | | | | Briggs & Stratton Corp | | | 653 | |
| | 108,048 | | | * | | Builders FirstSource, Inc | | | 771 | |
| | 299,328 | | | | | Bunzl plc | | | 7,193 | |
| | 4,279 | | | * | | Chart Industries, Inc | | | 409 | |
| | 92,756 | | | | | Cintra Concesiones de Infraestructuras de Transporte S.A. | | | 1,797 | |
COLLEGE RETIREMENT EQUITIES FUND - Social Choice Account
| | | | | | | | VALUE | |
| SHARES | | | | | COMPANY | | (000) | |
| | 10,922 | | | | | Clarcor, Inc | | $ | 703 | |
| | 144,300 | | | * | | CNH Industrial NV | | | 1,645 | |
| | 10,768 | | | * | | Colfax Corp | | | 686 | |
| | 159,066 | | | | | Compagnie de Saint-Gobain | | | 8,762 | |
| | 210,677 | | | | | Cummins, Inc | | | 29,699 | |
| | 46,600 | | | | | Daikin Industries Ltd | | | 2,908 | |
| | 594,737 | | | | | Danaher Corp | | | 45,913 | |
| | 389,540 | | | | | Deere & Co | | | 35,577 | |
| | 67,977 | | | | | Dover Corp | | | 6,563 | |
| | 340,868 | | | | | Eaton Corp | | | 25,947 | |
| | 4,941 | | | | | EMCOR Group, Inc | | | 210 | |
| | 657,321 | | | | | Emerson Electric Co | | | 46,131 | |
| | 7,019 | | | | | EnerSys | | | 492 | |
| | 2,909 | | | * | | Esterline Technologies Corp | | | 297 | |
| | 143,829 | | | | | Fastenal Co | | | 6,833 | |
| | 1,000 | | | | | Fluor Corp | | | 80 | |
| | 11,291 | | | | | Fortune Brands Home & Security, Inc | | | 516 | |
| | 2,237 | | | | | GATX Corp | | | 117 | |
| | 21,353 | | | | | GEA Group AG. | | | 1,018 | |
| | 11,801 | | | | | Geberit AG. | | | 3,580 | |
| | 66,177 | | | | | Graco, Inc | | | 5,170 | |
| | 1,400 | | | * | | H&E Equipment Services, Inc | | | 41 | |
| | 5,606 | | | | | Heico Corp | | | 325 | |
| | 14,756 | | | * | | Hexcel Corp | | | 659 | |
| | 32,600 | | | e | | Hitachi Construction Machinery Co Ltd | | | 698 | |
| | 12,125 | | | | | Hochtief AG. | | | 1,038 | |
| | 4,000 | | | | | Houston Wire & Cable Co | | | 54 | |
| | 481,422 | | | | | Illinois Tool Works, Inc | | | 40,478 | |
| | 133,866 | | | | | Ingersoll-Rand plc | | | 8,246 | |
| | 279,876 | | | | | Invensys plc | | | 2,366 | |
| | 500 | | | * | | Jacobs Engineering Group, Inc | | | 32 | |
| | 2,187 | | | e | | Joy Global, Inc | | | 128 | |
| | 25,600 | | | | | JTEKT Corp | | | 437 | |
| | 92,000 | | | | | Kawasaki Heavy Industries Ltd | | | 386 | |
| | 213,800 | | | | | Komatsu Ltd | | | 4,390 | |
| | 331,267 | | | | | Koninklijke Philips Electronics NV | | | 12,198 | |
| | 320,000 | | | | | Kubota Corp | | | 5,308 | |
| | 6,983 | | | *,e | | Layne Christensen Co | | | 119 | |
| | 26,197 | | | | | Lincoln Electric Holdings, Inc | | | 1,869 | |
| | 15,600 | | | | | Makita Corp | | | 820 | |
| | 700,000 | | | | | Marubeni Corp | | | 5,039 | |
| | 463,592 | | | | | Masco Corp | | | 10,556 | |
| | 44,896 | | | | | Metso Oyj | | | 1,920 | |
| | 367 | | | * | | Middleby Corp | | | 88 | |
| | 521,800 | | | | | Mitsubishi Corp | | | 10,017 | |
| | 482,000 | | | | | Mitsubishi Electric Corp | | | 6,061 | |
| | 7,683 | | | | | MSC Industrial Direct Co (Class A) | | | 621 | |
| | 83,000 | | | | | NGK Insulators Ltd | | | 1,580 | |
| | 132,713 | | | | | Nordson Corp | | | 9,861 | |
| | 86,000 | | | | | NSK Ltd | | | 1,072 | |
| | 165,398 | | | * | | Owens Corning, Inc | | | 6,735 | |
| | 287,127 | | | | | Paccar, Inc | | | 16,989 | |
COLLEGE RETIREMENT EQUITIES FUND - Social Choice Account
| | | | | | | | VALUE | |
| SHARES | | | | | COMPANY | | (000) | |
| | 25,360 | | | | | Pall Corp | | $ | 2,164 | |
| | 35,299 | | | | | Parker Hannifin Corp | | | 4,541 | |
| | 100,159 | | | | | Pentair Ltd | | | 7,779 | |
| | 2,753 | | | * | | Pike Electric Corp | | | 29 | |
| | 43,401 | | | *,e | | Polypore International, Inc | | | 1,688 | |
| | 161,687 | | | | | Precision Castparts Corp | | | 43,542 | |
| | 118,919 | | | * | | Quanta Services, Inc | | | 3,753 | |
| | 94,352 | | | | | Rockwell Automation, Inc | | | 11,149 | |
| | 10,342 | | | | | Rockwell Collins, Inc | | | 764 | |
| | 14,308 | | | | | Roper Industries, Inc | | | 1,984 | |
| | 3,300 | | | * | | Rush Enterprises, Inc (Class A) | | | 98 | |
| | 236,880 | | | | | Sandvik AB | | | 3,343 | |
| | 172,100 | | | | | Scania AB (B Shares) | | | 3,373 | |
| | 182,088 | | | | | Schneider Electric S.A. | | | 15,886 | |
| | 98,000 | | | | | Shimizu Corp | | | 495 | |
| | 43,110 | | | | | Skanska AB (B Shares) | | | 882 | |
| | 42,500 | | | | | SKF AB (B Shares) | | | 1,115 | |
| | 69,349 | | | | | Smiths Group plc | | | 1,703 | |
| | 17,535 | | | | | Snap-On, Inc | | | 1,920 | |
| | 210,153 | | | * | | Spirit Aerosystems Holdings, Inc (Class A) | | | 7,162 | |
| | 13,734 | | | | | Sulzer AG. | | | 2,219 | |
| | 161,300 | | | | | Sumitomo Electric Industries Ltd | | | 2,696 | |
| | 5,435 | | | e | | TAL International Group, Inc | | | 312 | |
| | 104,755 | | | | | Tennant Co | | | 7,103 | |
| | 18,487 | | | | | Timken Co | | | 1,018 | |
| | 6,400 | | | | | Toyota Tsusho Corp | | | 159 | |
| | 38,902 | | | *,e | | United Rentals, Inc | | | 3,032 | |
| | 49,198 | | | | | Vallourec | | | 2,684 | |
| | 1,160 | | | e | | Valmont Industries, Inc | | | 173 | |
| | 176,760 | | | | | Vinci S.A. | | | 11,619 | |
| | 436,090 | | | | | Volvo AB (B Shares) | | | 5,738 | |
| | 3,755 | | | | | W.W. Grainger, Inc | | | 959 | |
| | 25,258 | | | * | | Wabash National Corp | | | 312 | |
| | 38,428 | | | * | | WABCO Holdings, Inc | | | 3,590 | |
| | 2,022 | | | | | Watsco, Inc | | | 194 | |
| | 27,403 | | | *,e | | WESCO International, Inc | | | 2,496 | |
| | 16,889 | | | | | Westinghouse Air Brake Technologies Corp | | | 1,254 | |
| | 121,923 | | | | | Wolseley plc | | | 6,932 | |
| | 20,710 | | | | | Woodward Governor Co | | | 945 | |
| | 12,153 | | | | | Xylem, Inc | | | 420 | |
| | | | | | | TOTAL CAPITAL GOODS | | | 663,068 | |
| | | | | | | | | | | |
| COMMERCIAL & PROFESSIONAL SERVICES - 0.4% | | | | |
| | 2,604 | | | | | ABM Industries, Inc | | | 74 | |
| | 197,072 | | | * | | ACCO Brands Corp | | | 1,324 | |
| | 14,675 | | | | | Aggreko plc | | | 416 | |
| | 205,697 | | | | | Brambles Ltd | | | 1,685 | |
| | 11,200 | | | | | Bureau Veritas S.A. | | | 327 | |
| | 120,569 | | | | | Capita Group plc | | | 2,075 | |
| | 2,000 | | | | | CDI Corp | | | 37 | |
| | 2,394 | | | * | | Copart, Inc | | | 88 | |
| | 9,841 | | | | | Corporate Executive Board Co | | | 762 | |
COLLEGE RETIREMENT EQUITIES FUND - Social Choice Account
| | | | | | | | VALUE | |
| SHARES | | | | | COMPANY | | (000) | |
| | 218,000 | | | | | Dai Nippon Printing Co Ltd | | $ | 2,316 | |
| | 24,020 | | | | | Deluxe Corp | | | 1,254 | |
| | 82,626 | | | | | Dun & Bradstreet Corp | | | 10,142 | |
| | 22,336 | | | | | Equifax, Inc | | | 1,543 | |
| | 2,000 | | | | | Heidrick & Struggles International, Inc | | | 40 | |
| | 21,504 | | | | | HNI Corp | | | 835 | |
| | 9,308 | | | * | | IHS, Inc (Class A) | | | 1,114 | |
| | 1,660 | | | * | | Innerworkings, Inc | | | 13 | |
| | 19,643 | | | | | Interface, Inc | | | 431 | |
| | 7,700 | | | | | Intertek Group plc | | | 402 | |
| | 122,588 | | | | | Iron Mountain, Inc | | | 3,721 | |
| | 1,800 | | | | | Kelly Services, Inc (Class A) | | | 45 | |
| | 29,712 | | | | | Manpower, Inc | | | 2,551 | |
| | 3,562 | | | * | | Mistras Group, Inc | | | 74 | |
| | 2,100 | | | * | | Mobile Mini, Inc | | | 87 | |
| | 13,621 | | | * | | Navigant Consulting, Inc | | | 262 | |
| | 1,000 | | | * | | On Assignment, Inc | | | 35 | |
| | 18,371 | | | e | | R.R. Donnelley & Sons Co | | | 373 | |
| | 34,400 | | | | | Randstad Holdings NV | | | 2,232 | |
| | 2,311 | | | | | Resources Connection, Inc | | | 33 | |
| | 162,118 | | | | | Robert Half International, Inc | | | 6,807 | |
| | 16,303 | | | * | | RPX Corp | | | 276 | |
| | 58,400 | | | | | Secom Co Ltd | | | 3,524 | |
| | 472 | | | | | SGS S.A. | | | 1,087 | |
| | 400 | | | | | Societe BIC S.A. | | | 49 | |
| | 1,544 | | | * | | SP Plus Corp | | | 40 | |
| | 44,676 | | | * | | Tetra Tech, Inc | | | 1,250 | |
| | 179,000 | | | | | Toppan Printing Co Ltd | | | 1,433 | |
| | 2,100 | | | | | Viad Corp | | | 58 | |
| | 174,423 | | | | | Waste Management, Inc | | | 7,826 | |
| | | | | | | TOTAL COMMERCIAL & PROFESSIONAL SERVICES | | | 56,641 | |
| | | | | | | | | | | |
| CONSUMER DURABLES & APPAREL - 0.8% | | | | |
| | 29,048 | | | | | Adidas-Salomon AG. | | | 3,704 | |
| | 14,697 | | | e | | Blyth, Inc | | | 160 | |
| | 32,738 | | | | | Callaway Golf Co | | | 276 | |
| | 30,920 | | | | | Christian Dior S.A. | | | 5,853 | |
| | 24,000 | | | | | Electrolux AB (Series B) | | | 627 | |
| | 7,187 | | | e | | Ethan Allen Interiors, Inc | | | 219 | |
| | 11,700 | | | | | Gildan Activewear, Inc | | | 623 | |
| | 6,676 | | | | | Hanesbrands, Inc | | | 469 | |
| | 573,700 | | | | | Matsushita Electric Industrial Co Ltd | | | 6,688 | |
| | 520,280 | | | | | Mattel, Inc | | | 24,755 | |
| | 7,456 | | | * | | Meritage Homes Corp | | | 358 | |
| | 9,802 | | | * | | Mohawk Industries, Inc | | | 1,459 | |
| | 23,800 | | | | | Movado Group, Inc | | | 1,047 | |
| | 519,225 | | | | | Nike, Inc (Class B) | | | 40,832 | |
| | 126,600 | | | | | Nikon Corp | | | 2,419 | |
| | 18,943 | | | | | Oxford Industries, Inc | | | 1,528 | |
| | 9,478 | | | * | | Perry Ellis International, Inc | | | 150 | |
| | 2,000 | | | | | Pool Corp | | | 116 | |
| | 27,543 | | | | | Ryland Group, Inc | | | 1,196 | |
COLLEGE RETIREMENT EQUITIES FUND - Social Choice Account
| | | | | | | | VALUE | |
| SHARES | | | | | COMPANY | | (000) | |
| | 50,000 | | | | | Sekisui Chemical Co Ltd | | $ | 614 | |
| | 96,000 | | | | | Sekisui House Ltd | | | 1,343 | |
| | 141,000 | | | * | | Sharp Corp | | | 449 | |
| | 234,000 | | | e | | Sony Corp | | | 4,034 | |
| | 5,138 | | | | | Tupperware Corp | | | 486 | |
| | 13,953 | | | *,e | | Under Armour, Inc (Class A) | | | 1,218 | |
| | 4,500 | | | * | | Unifi, Inc | | | 123 | |
| | 31,176 | | | | | VF Corp | | | 1,943 | |
| | 10,000 | | | | | Whirlpool Corp | | | 1,569 | |
| | | | | | | TOTAL CONSUMER DURABLES & APPAREL | | | 104,258 | |
| | | | | | | | | | | |
| CONSUMER SERVICES - 1.2% | | | | |
| | 79,580 | | | | | Accor S.A. | | | 3,759 | |
| | 35,220 | | | * | | AFC Enterprises | | | 1,356 | |
| | 30,700 | | | | | Benesse Corp | | | 1,233 | |
| | 1,289 | | | | | Bob Evans Farms, Inc | | | 65 | |
| | 25,421 | | | | | Brinker International, Inc | | | 1,178 | |
| | 7,675 | | | * | | Chipotle Mexican Grill, Inc (Class A) | | | 4,089 | |
| | 103,153 | | | e | | Choice Hotels International, Inc | | | 5,066 | |
| | 86,851 | | | | | Darden Restaurants, Inc | | | 4,722 | |
| | 1,346 | | | | | DineEquity, Inc | | | 113 | |
| | 4,313 | | | | | Domino’s Pizza, Inc | | | 300 | |
| | 7,832 | | | | | Dunkin Brands Group, Inc | | | 378 | |
| | 366,180 | | | | | Marriott International, Inc (Class A) | | | 18,075 | |
| | 558,634 | | | | | McDonald’s Corp | | | 54,204 | |
| | 2,000 | | | * | | MGM Mirage | | | 47 | |
| | 725 | | | * | | Panera Bread Co (Class A) | | | 128 | |
| | 2,600 | | | | | Papa John’s International, Inc | | | 118 | |
| | 33,974 | | | | | Royal Caribbean Cruises Ltd | | | 1,611 | |
| | 11,375 | | | * | | Ruby Tuesday, Inc | | | 79 | |
| | 29,578 | | | * | | Sonic Corp | | | 597 | |
| | 586,295 | | | | | Starbucks Corp | | | 45,960 | |
| | 136,400 | | | | | Starwood Hotels & Resorts Worldwide, Inc | | | 10,837 | |
| | 10,004 | | | * | | Strayer Education, Inc | | | 345 | |
| | 9,100 | | | | | Tim Hortons, Inc (Toronto) | | | 531 | |
| | 10,000 | | | e | | Weight Watchers International, Inc | | | 329 | |
| | 11,685 | | | | | Whitbread plc | | | 727 | |
| | | | | | | TOTAL CONSUMER SERVICES | | | 155,847 | |
| | | | | | | | | | | |
| DIVERSIFIED FINANCIALS - 3.9% | | | | |
| | 780,959 | | | | | 3i Group plc | | | 4,990 | |
| | 358,183 | | | | | Aberdeen Asset Management plc | | | 2,979 | |
| | 4,200 | | | | | Aeon Credit Service Co Ltd | | | 113 | |
| | 251,412 | | | * | | American Capital Ltd | | | 3,932 | |
| | 630,747 | | | | | American Express Co | | | 57,228 | |
| | 16,675 | | | | | Ares Capital Corp | | | 296 | |
| | 1,215,403 | | | | | Bank of New York Mellon Corp | | | 42,466 | |
| | 136,180 | | | | | BlackRock, Inc | | | 43,097 | |
| | 579,810 | | | | | Capital One Financial Corp | | | 44,419 | |
| | 1,431,454 | | | | | Charles Schwab Corp | | | 37,218 | |
| | 310,655 | | | | | CME Group, Inc | | | 24,374 | |
| | 1,362 | | | e | | Cohen & Steers, Inc | | | 55 | |
COLLEGE RETIREMENT EQUITIES FUND - Social Choice Account
| | | | | | | | VALUE | |
| SHARES | | | | | COMPANY | | (000) | |
| | 3,361 | | | * | | Credit Acceptance Corp | | $ | 437 | |
| | 69,415 | | | | | Deutsche Boerse AG. | | | 5,753 | |
| | 687,952 | | | | | Discover Financial Services | | | 38,491 | |
| | 8,100 | | | | | Eurazeo | | | 635 | |
| | 51,550 | | | | | Evercore Partners, Inc (Class A) | | | 3,082 | |
| | 86,902 | | | | | Exor S.p.A. | | | 3,454 | |
| | 626,613 | | | | | Franklin Resources, Inc | | | 36,174 | |
| | 7,024 | | | e | | Golub Capital BDC, Inc | | | 134 | |
| | 24,115 | | | * | | Green Dot Corp | | | 606 | |
| | 530,217 | | | | | Hong Kong Exchanges and Clearing Ltd | | | 8,863 | |
| | 178,621 | | | * | | ING Groep NV | | | 2,495 | |
| | 134,009 | | | | | IntercontinentalExchange Group, Inc | | | 30,141 | |
| | 1,750 | | | * | | International Assets Holding Corp | | | 32 | |
| | 5,728 | | | * | | Internet Capital Group, Inc | | | 107 | |
| | 508,141 | | | | | Invesco Ltd | | | 18,496 | |
| | 800,553 | | | | | Investec plc | | | 5,814 | |
| | 3,030 | | | * | | Investment Technology Group, Inc | | | 62 | |
| | 61,166 | | | | | Janus Capital Group, Inc | | | 757 | |
| | 60,728 | | | | | Kinnevik Investment AB (Series B) | | | 2,815 | |
| | 62,663 | | | | | Legg Mason, Inc | | | 2,725 | |
| | 10,701 | | | e | | Main Street Capital Corp | | | 350 | |
| | 336,200 | | | | | Mitsubishi UFJ Lease & Finance Co Ltd | | | 2,067 | |
| | 1,847 | | | | | MVC Capital, Inc | | | 25 | |
| | 76,231 | | | | | Nasdaq Stock Market, Inc | | | 3,034 | |
| | 513,669 | | | | | Northern Trust Corp | | | 31,791 | |
| | 22,527 | | | * | | PHH Corp | | | 549 | |
| | 5,879 | | | * | | Pico Holdings, Inc | | | 136 | |
| | 52,696 | | | e | | Prospect Capital Corp | | | 591 | |
| | 10,635 | | | * | | Safeguard Scientifics, Inc | | | 214 | |
| | 62,441 | | | | | Schroders plc | | | 2,693 | |
| | 12,117 | | | | | Solar Capital Ltd | | | 273 | |
| | 489,115 | | | | | State Street Corp | | | 35,896 | |
| | 287,043 | | | | | T Rowe Price Group, Inc | | | 24,046 | |
| | 3,000 | | | | | TD Ameritrade Holding Corp | | | 92 | |
| | 16,754 | | | | | Triangle Capital Corp | | | 463 | |
| | | | | | | TOTAL DIVERSIFIED FINANCIALS | | | 524,460 | |
| | | | | | | | | | | |
| ENERGY - 6.0% | | | | |
| | 40,000 | | | | | Acergy S.A. | | | 767 | |
| | 46,000 | | | | | Aker Kvaerner ASA | | | 824 | |
| | 52,019 | | | | | AMEC plc | | | 939 | |
| | 315,610 | | | | | Apache Corp | | | 27,123 | |
| | 45,500 | | | e | | ARC Energy Trust | | | 1,267 | |
| | 13,661 | | | * | | Atwood Oceanics, Inc | | | 729 | |
| | 854,626 | | | | | BG Group plc | | | 18,390 | |
| | 15,745 | | | *,e | | BPZ Energy, Inc | | | 29 | |
| | 5,088 | | | *,e | | C&J Energy Services, Inc | | | 118 | |
| | 270,701 | | | * | | Cameron International Corp | | | 16,115 | |
| | 1,618 | | | e | | CARBO Ceramics, Inc | | | 189 | |
| | 14,005 | | | * | | Carrizo Oil & Gas, Inc | | | 627 | |
| | 287,400 | | | e | | Cenovus Energy, Inc (Toronto) | | | 8,225 | |
| | 165,841 | | | * | | Cheniere Energy, Inc | | | 7,151 | |
COLLEGE RETIREMENT EQUITIES FUND - Social Choice Account
| | | | | | | | VALUE | |
| SHARES | | | | | COMPANY | | (000) | |
| | 98,049 | | | | | Cimarex Energy Co | | $ | 10,286 | |
| | 1,826 | | | * | | Clayton Williams Energy, Inc | | | 150 | |
| | 260,946 | | | *,e | | Clean Energy Fuels Corp | | | 3,361 | |
| | 157,932 | | | * | | Compagnie Generale de Geophysique S.A. | | | 2,741 | |
| | 31,699 | | | | | Comstock Resources, Inc | | | 580 | |
| | 29,437 | | | * | | Concho Resources, Inc | | | 3,179 | |
| | 46,605 | | | * | | Contango Oil & Gas Co | | | 2,203 | |
| | 146,657 | | | *,e | | Continental Resources, Inc | | | 16,502 | |
| | 2,554 | | | | | Core Laboratories NV | | | 488 | |
| | 57,300 | | | e | | Crescent Point Energy Corp | | | 2,225 | |
| | 17,312 | | | | | CVR Energy, Inc | | | 752 | |
| | 11,452 | | | * | | Dawson Geophysical Co | | | 387 | |
| | 16,742 | | | | | Delek Group Ltd | | | 6,395 | |
| | 2,500 | | | | | Delek US Holdings, Inc | | | 86 | |
| | 486,380 | | | * | | Denbury Resources, Inc | | | 7,991 | |
| | 430,963 | | | | | Devon Energy Corp | | | 26,664 | |
| | 268,074 | | | | | Enbridge, Inc | | | 11,712 | |
| | 21,600 | | | e | | EnCana Corp | | | 390 | |
| | 1,150 | | | | | Energen Corp | | | 81 | |
| | 72,600 | | | e | | Enerplus Resources Fund | | | 1,319 | |
| | 624,899 | | | | | ENI S.p.A. | | | 15,100 | |
| | 247,176 | | | | | EOG Resources, Inc | | | 41,486 | |
| | 320,742 | | | | | Equitable Resources, Inc | | | 28,796 | |
| | 11,351 | | | * | | Exterran Holdings, Inc | | | 388 | |
| | 228,089 | | | * | | FMC Technologies, Inc | | | 11,909 | |
| | 19,000 | | | e | | Fugro NV | | | 1,133 | |
| | 203,657 | | | | | Galp Energia SGPS S.A. | | | 3,338 | |
| | 8,642 | | | *,e | | Geospace Technologies Corp | | | 819 | |
| | 187,072 | | | * | | Hercules Offshore, Inc | | | 1,222 | |
| | 366,724 | | | | | Hess Corp | | | 30,438 | |
| | 155,177 | | | * | | Hornbeck Offshore Services, Inc | | | 7,639 | |
| | 315,600 | | | | | Inpex Holdings, Inc | | | 4,048 | |
| | 60,455 | | | * | | ION Geophysical Corp | | | 199 | |
| | 44,211 | | | * | | Key Energy Services, Inc | | | 349 | |
| | 7,603 | | | * | | Kinder Morgan Management LLC | | | 575 | |
| | 676,402 | | | * | | Kodiak Oil & Gas Corp | | | 7,582 | |
| | 749,902 | | | | | Marathon Oil Corp | | | 26,472 | |
| | 398,430 | | | | | Marathon Petroleum Corp | | | 36,548 | |
| | 2,100 | | | * | | Matrix Service Co | | | 51 | |
| | 141,335 | | | * | | MEG Energy Corp | | | 4,073 | |
| | 458,618 | | | | | National Oilwell Varco, Inc | | | 36,474 | |
| | 3,769 | | | * | | Natural Gas Services Group, Inc | | | 104 | |
| | 134,199 | | | e | | Neste Oil Oyj | | | 2,654 | |
| | 180,694 | | | | | Noble Corp plc | | | 6,771 | |
| | 425,982 | | | | | Noble Energy, Inc | | | 29,014 | |
| | 29,282 | | | *,e | | Northern Oil And Gas, Inc | | | 441 | |
| | 21,344 | | | * | | Oasis Petroleum, Inc | | | 1,003 | |
| | 405,959 | | | | | Occidental Petroleum Corp | | | 38,607 | |
| | 34,436 | | | | | Oceaneering International, Inc | | | 2,716 | |
| | 28,748 | | | * | | Oil States International, Inc | | | 2,924 | |
| | 209,409 | | | | | OMV AG. | | | 10,022 | |
| | 516,973 | | | | | Origin Energy Ltd | | | 6,515 | |
COLLEGE RETIREMENT EQUITIES FUND - Social Choice Account
| | | | | | | | VALUE | |
| SHARES | | | | | COMPANY | | (000) | |
| | 37,146 | | | * | | PDC Energy, Inc | | $ | 1,977 | |
| | 302,936 | | | e | | Pengrowth Energy Trust | | | 1,874 | |
| | 265,014 | | | e | | Penn West Energy Trust | | | 2,213 | |
| | 68,060 | | | * | | Petroquest Energy, Inc | | | 294 | |
| | 434,904 | | | | | Phillips 66 | | | 33,544 | |
| | 170,278 | | | | | Pioneer Natural Resources Co | | | 31,343 | |
| | 282,498 | | | | | Questar Market Resources, Inc | | | 8,659 | |
| | 150,641 | | | *,e | | Quicksilver Resources, Inc | | | 462 | |
| | 95,054 | | | | | Range Resources Corp | | | 8,014 | |
| | 310,203 | | | | | Repsol YPF S.A. | | | 7,827 | |
| | 36,777 | | | * | | Rex Energy Corp | | | 725 | |
| | 48,811 | | | | | Saipem S.p.A. | | | 1,047 | |
| | 894 | | | * | | SEACOR Holdings, Inc | | | 82 | |
| | 58,600 | | | e | | Showa Shell Sekiyu KK | | | 596 | |
| | 29,250 | | | *,e | | Solazyme, Inc | | | 319 | |
| | 337,955 | | | * | | Southwestern Energy Co | | | 13,292 | |
| | 954,987 | | | | | Spectra Energy Corp | | | 34,017 | |
| | 108,961 | | | | | St. Mary Land & Exploration Co | | | 9,056 | |
| | 403,405 | | | | | Statoil ASA | | | 9,809 | |
| | 482,904 | | | | | Suncor Energy, Inc | | | 16,929 | |
| | 88,722 | | | * | | Superior Energy Services | | | 2,361 | |
| | 22,440 | | | | | Technip S.A. | | | 2,160 | |
| | 159,456 | | | | | Tenaris S.A. | | | 3,475 | |
| | 11,099 | | | * | | Tesco Corp | | | 220 | |
| | 2,784 | | | | | Tesoro Corp | | | 163 | |
| | 262,191 | | | | | Tullow Oil plc | | | 3,721 | |
| | 80,823 | | | *,e | | Ultra Petroleum Corp | | | 1,750 | |
| | 46,868 | | | * | | Unit Corp | | | 2,419 | |
| | 933,272 | | | * | | Weatherford International Ltd | | | 14,456 | |
| | 320,238 | | | e | | Western Refining, Inc | | | 13,581 | |
| | 130,361 | | | * | | Whiting Petroleum Corp | | | 8,065 | |
| | 443,674 | | | | | Williams Cos, Inc | | | 17,112 | |
| | 100,721 | | | | | Woodside Petroleum Ltd | | | 3,508 | |
| | | | | | | TOTAL ENERGY | | | 794,465 | |
| | | | | | | | | | | |
| FOOD & STAPLES RETAILING - 0.8% | | | | |
| | 173,400 | | | | | Aeon Co Ltd | | | 2,351 | |
| | 179,256 | | | | | Carrefour S.A. | | | 7,115 | |
| | 13,324 | | | | | Casey’s General Stores, Inc | | | 936 | |
| | 13,576 | | | | | Casino Guichard Perrachon S.A. | | | 1,566 | |
| | 5,000 | | | | | Colruyt S.A. | | | 279 | |
| | 31,318 | | | | | Delhaize Group | | | 1,863 | |
| | 275,568 | | | | | J Sainsbury plc | | | 1,668 | |
| | 59,300 | | | | | Jeronimo Martins SGPS S.A. | | | 1,160 | |
| | 93,117 | | | | | Koninklijke Ahold NV | | | 1,673 | |
| | 364,512 | | | | | Kroger Co | | | 14,409 | |
| | 3,600 | | | | | Lawson, Inc | | | 269 | |
| | 42,800 | | | e | | Loblaw Cos Ltd | | | 1,708 | |
| | 68,666 | | | | | Metro AG. | | | 3,329 | |
| | 615 | | | | | Pricesmart, Inc | | | 71 | |
| | 316,705 | | | | | Safeway, Inc | | | 10,315 | |
| | 149,700 | | | | | Seven & I Holdings Co Ltd | | | 5,961 | |
COLLEGE RETIREMENT EQUITIES FUND - Social Choice Account
| | | | | | | | VALUE | |
| SHARES | | | | | COMPANY | | (000) | |
| | 16,307 | | | | | Spartan Stores, Inc | | $ | 396 | |
| | 814,218 | | | | | Sysco Corp | | | 29,393 | |
| | 1,918,076 | | | | | Tesco plc | | | 10,652 | |
| | 1,270 | | | * | | United Natural Foods, Inc | | | 96 | |
| | 2,285 | | | | | Weis Markets, Inc | | | 120 | |
| | 64,198 | | | | | Wesfarmers Ltd | | | 2,528 | |
| | 186,154 | | | | | Whole Foods Market, Inc | | | 10,765 | |
| | 386,938 | | | | | WM Morrison Supermarkets plc | | | 1,675 | |
| | | | | | | TOTAL FOOD & STAPLES RETAILING | | | 110,298 | |
| | | | | | | | | | | |
| FOOD, BEVERAGE & TOBACCO - 2.2% | | | | |
| | 161,000 | | | | | Ajinomoto Co, Inc | | | 2,331 | |
| | 93,070 | | | | | Aryzta AG. | | | 7,151 | |
| | 191,588 | | | | | Associated British Foods plc | | | 7,770 | |
| | 16,050 | | | | | Bunge Ltd | | | 1,318 | |
| | 454 | | | | | Calavo Growers, Inc | | | 14 | |
| | 261,990 | | | e | | Campbell Soup Co | | | 11,339 | |
| | 131,532 | | | | | ConAgra Foods, Inc | | | 4,433 | |
| | 19,775 | | | * | | Darling International, Inc | | | 413 | |
| | 30,775 | | | | | Dr Pepper Snapple Group, Inc | | | 1,499 | |
| | 14,539 | | | | | Flowers Foods, Inc | | | 312 | |
| | 745,771 | | | | | General Mills, Inc | | | 37,221 | |
| | 66,296 | | | *,e | | Green Mountain Coffee Roasters, Inc | | | 5,011 | |
| | 171,325 | | | | | Groupe Danone | | | 12,360 | |
| | 5,759 | | | * | | Hain Celestial Group, Inc | | | 523 | |
| | 65,855 | | | | | Hillshire Brands Co | | | 2,202 | |
| | 2,074 | | | | | Hormel Foods Corp | | | 94 | |
| | 39,791 | | | | | J.M. Smucker Co | | | 4,123 | |
| | 495,526 | | | | | Kellogg Co | | | 30,262 | |
| | 28,997 | | | | | Kerry Group plc (Class A) | | | 2,014 | |
| | 31,000 | | | | | Kikkoman Corp | | | 586 | |
| | 141,000 | | | | | Kraft Foods Group, Inc | | | 7,603 | |
| | 458 | | | | | Lindt & Spruengli AG. | | | 2,064 | |
| | 21 | | | | | Lindt & Spruengli AG. (Registered) | | | 1,132 | |
| | 16,031 | | | | | McCormick & Co, Inc | | | 1,105 | |
| | 74,148 | | | | | Mead Johnson Nutrition Co | | | 6,211 | |
| | 1,188,820 | | | | | Mondelez International, Inc | | | 41,965 | |
| | 13,000 | | | | | Nippon Meat Packers, Inc | | | 223 | |
| | 42,800 | | | e | | Nisshin Seifun Group, Inc | | | 443 | |
| | 14,500 | | | e | | Nissin Food Products Co Ltd | | | 612 | |
| | 152,793 | | | | | Orkla ASA | | | 1,194 | |
| | 801,664 | | | | | PepsiCo, Inc | | | 66,490 | |
| | 13,800 | | | | | Suedzucker AG. | | | 373 | |
| | 12,546 | | | | | Tate & Lyle plc | | | 168 | |
| | 11,769 | | | e | | Tootsie Roll Industries, Inc | | | 383 | |
| | 674 | | | * | | TreeHouse Foods, Inc | | | 46 | |
| | 405,114 | | | | | Unilever NV | | | 16,288 | |
| | 451,826 | | | | | Unilever plc | | | 18,591 | |
| | 42,800 | | | | | Yakult Honsha Co Ltd | | | 2,163 | |
| | | | | | | TOTAL FOOD, BEVERAGE & TOBACCO | | | 298,030 | |
COLLEGE RETIREMENT EQUITIES FUND - Social Choice Account
| | | | | | | | VALUE | |
| SHARES | | | | | COMPANY | | (000) | |
| HEALTH CARE EQUIPMENT & SERVICES - 1.7% | | | | |
| | 1,196,888 | | | | | Abbott Laboratories | | $ | 45,877 | |
| | 450,512 | | | | | Aetna, Inc | | | 30,901 | |
| | 8,037 | | | * | | Align Technology, Inc | | | 459 | |
| | 67,982 | | | * | | Amedisys, Inc | | | 995 | |
| | 7,087 | | | | | AmerisourceBergen Corp | | | 498 | |
| | 10,800 | | | * | | Amsurg Corp | | | 496 | |
| | 322,043 | | | | | Becton Dickinson & Co | | | 35,583 | |
| | 28,176 | | | * | | BioScrip, Inc | | | 209 | |
| | 10,000 | | | * | | Brookdale Senior Living, Inc | | | 272 | |
| | 54,777 | | | * | | Centene Corp | | | 3,229 | |
| | 20,000 | | | * | | Cerner Corp | | | 1,115 | |
| | 4,495 | | | e | | Chemed Corp | | | 344 | |
| | 186,841 | | | | | Cigna Corp | | | 16,345 | |
| | 1,249 | | | | | Computer Programs & Systems, Inc | | | 77 | |
| | 700 | | | * | | Cyberonics, Inc | | | 46 | |
| | 1,000 | | | * | | DaVita, Inc | | | 63 | |
| | 5,764 | | | | | Dentsply International, Inc | | | 279 | |
| | 15,359 | | | * | | Edwards Lifesciences Corp | | | 1,010 | |
| | 24,043 | | | * | | ExamWorks Group, Inc | | | 718 | |
| | 25,217 | | | * | | Five Star Quality Care, Inc | | | 138 | |
| | 8,354 | | | * | | Gentiva Health Services, Inc | | | 104 | |
| | 6,176 | | | * | | Greatbatch, Inc | | | 273 | |
| | 4,374 | | | * | | Haemonetics Corp | | | 184 | |
| | 11,942 | | | * | | Henry Schein, Inc | | | 1,365 | |
| | 10,561 | | | * | | HMS Holdings Corp | | | 240 | |
| | 119,187 | | | | | Humana, Inc | | | 12,303 | |
| | 1,185 | | | * | | ICU Medical, Inc | | | 76 | |
| | 43,082 | | | *,e | | Idexx Laboratories, Inc | | | 4,583 | |
| | 2,446 | | | | | Invacare Corp | | | 57 | |
| | 61,900 | | | * | | Inverness Medical Innovations, Inc | | | 2,241 | |
| | 3,014 | | | * | | IPC The Hospitalist Co, Inc | | | 179 | |
| | 759 | | | * | | Laboratory Corp of America Holdings | | | 69 | |
| | 743 | | | | | Landauer, Inc | | | 39 | |
| | 6,078 | | | * | | LHC Group, Inc | | | 146 | |
| | 58,522 | | | * | | LifePoint Hospitals, Inc | | | 3,092 | |
| | 1,730 | | | * | | MedAssets, Inc | | | 34 | |
| | 1,474 | | | * | | Medidata Solutions, Inc | | | 89 | |
| | 819,631 | | | | | Medtronic, Inc | | | 47,038 | |
| | 9,612 | | | * | | Merit Medical Systems, Inc | | | 151 | |
| | 55,639 | | | * | | Molina Healthcare, Inc | | | 1,933 | |
| | 8,672 | | | * | | MWI Veterinary Supply, Inc | | | 1,479 | |
| | 9,301 | | | * | | Natus Medical, Inc | | | 209 | |
| | 1,976 | | | * | | NuVasive, Inc | | | 64 | |
| | 2,364 | | | * | | NxStage Medical, Inc | | | 24 | |
| | 3,000 | | | * | | Omnicell, Inc | | | 77 | |
| | 7,475 | | | * | | OraSure Technologies, Inc | | | 47 | |
| | 2,718 | | | e | | Owens & Minor, Inc | | | 99 | |
| | 86,208 | | | | | Patterson Cos, Inc | | | 3,552 | |
| | 4,910 | | | | | Quality Systems, Inc | | | 103 | |
| | 3,688 | | | * | | Sirona Dental Systems, Inc | | | 259 | |
| | 56,474 | | | | | Sonic Healthcare Ltd | | | 838 | |
| | 4,400 | | | | | Suzuken Co Ltd | | | 143 | |
COLLEGE RETIREMENT EQUITIES FUND - Social Choice Account
| | | | | | | | VALUE | |
| SHARES | | | | | COMPANY | | (000) | |
| | 7,700 | | | | | Sysmex Corp | | $ | 455 | |
| | 6,446 | | | * | | Tornier BV | | | 121 | |
| | 8,101 | | | | | Universal American Corp | | | 59 | |
| | 2,101 | | | | | US Physical Therapy, Inc | | | 74 | |
| | 500 | | | * | | Varian Medical Systems, Inc | | | 39 | |
| | 19,709 | | | * | | Vocera Communications, Inc | | | 308 | |
| | | | | | | TOTAL HEALTH CARE EQUIPMENT & SERVICES | | | 220,800 | |
| | | | | | | | | | | |
| HOUSEHOLD & PERSONAL PRODUCTS - 1.9% | | | | |
| | 4 | | | | | Avon Products, Inc | | | 0 | ^ |
| | 9,680 | | | | | Beiersdorf AG. | | | 981 | |
| | 43,936 | | | e | | Clorox Co | | | 4,076 | |
| | 707,780 | | | | | Colgate-Palmolive Co | | | 46,154 | |
| | 270 | | | | | Energizer Holdings, Inc | | | 29 | |
| | 281,616 | | | | | Estee Lauder Cos (Class A) | | | 21,211 | |
| | 210 | | | | | Henkel KGaA | | | 22 | |
| | 142,770 | | | | | Henkel KGaA (Preference) | | | 16,595 | |
| | 23,052 | | | e | | Herbalife Ltd | | | 1,814 | |
| | 41,500 | | | | | Kao Corp | | | 1,307 | |
| | 329,981 | | | | | Kimberly-Clark Corp | | | 34,470 | |
| | 63,795 | | | | | L’Oreal S.A. | | | 11,203 | |
| | 35,987 | | | * | | Medifast, Inc | | | 940 | |
| | 16,029 | | | | | Nu Skin Enterprises, Inc (Class A) | | | 2,216 | |
| | 1,202,803 | | | | | Procter & Gamble Co | | | 97,920 | |
| | 152,666 | | | | | Reckitt Benckiser Group plc | | | 12,127 | |
| | 43,160 | | | | | Svenska Cellulosa AB (B Shares) | | | 1,330 | |
| | | | | | | TOTAL HOUSEHOLD & PERSONAL PRODUCTS | | | 252,395 | |
| | | | | | | | | | | |
| INSURANCE - 3.5% | | | | |
| | 345,544 | | | | | ACE Ltd | | | 35,774 | |
| | 588,249 | | | | | Aflac, Inc | | | 39,295 | |
| | 1,543,100 | | | | | AMP Ltd | | | 6,065 | |
| | 1,319 | | | e | | Amtrust Financial Services, Inc | | | 43 | |
| | 13,380 | | | | | Arthur J. Gallagher & Co | | | 628 | |
| | 131,054 | | | | | Aspen Insurance Holdings Ltd | | | 5,414 | |
| | 421,903 | | | | | Assicurazioni Generali S.p.A. | | | 9,912 | |
| | 78,885 | | | | | AXA S.A. | | | 2,197 | |
| | 30,787 | | | | | Axis Capital Holdings Ltd | | | 1,464 | |
| | 798,759 | | | * | | Berkshire Hathaway, Inc (Class B) | | | 94,701 | |
| | 370,028 | | | | | Chubb Corp | | | 35,756 | |
| | 5,304 | | | * | | Citizens, Inc (Class A) | | | 46 | |
| | 280,593 | | | | | CNP Assurances | | | 5,754 | |
| | 102,203 | | | | | Delta Lloyd NV | | | 2,538 | |
| | 1,400 | | | | | Donegal Group, Inc (Class A) | | | 22 | |
| | 4,146 | | | * | | eHealth, Inc | | | 193 | |
| | 2,400 | | | | | Employers Holdings, Inc | | | 76 | |
| | 10,644 | | | | | Endurance Specialty Holdings Ltd | | | 624 | |
| | 1,155 | | | * | | Enstar Group Ltd | | | 160 | |
| | 11,630 | | | | | First American Financial Corp | | | 328 | |
| | 608,847 | | | * | | Genworth Financial, Inc (Class A) | | | 9,455 | |
| | 1,000 | | | | | Hartford Financial Services Group, Inc | | | 36 | |
| | 3,500 | | | * | | Hilltop Holdings, Inc | | | 81 | |
COLLEGE RETIREMENT EQUITIES FUND - Social Choice Account
| | | | | | | | VALUE | |
| SHARES | | | | | COMPANY | | (000) | |
| | 588,027 | | | | | Insurance Australia Group Ltd | | $ | 3,062 | |
| | 1,916 | | | | | Kemper Corp | | | 78 | |
| | 106,450 | | | | | Marsh & McLennan Cos, Inc | | | 5,148 | |
| | 4,850 | | | | | Meadowbrook Insurance Group, Inc | | | 34 | |
| | 123,177 | | | | | Montpelier Re Holdings Ltd | | | 3,584 | |
| | 75,286 | | | | | Muenchener Rueckver AG. | | | 16,606 | |
| | 700 | | | * | | Navigators Group, Inc | | | 44 | |
| | 2,849,807 | | | | | Old Mutual plc | | | 8,942 | |
| | 3,027 | | | | | OneBeacon Insurance Group Ltd (Class A) | | | 48 | |
| | 13,746 | | | | | PartnerRe Ltd | | | 1,449 | |
| | 56,579 | | | | | Platinum Underwriters Holdings Ltd | | | 3,467 | |
| | 2,297 | | | | | Primerica, Inc | | | 99 | |
| | 357,357 | | | | | Principal Financial Group | | | 17,621 | |
| | 929,925 | | | | | Progressive Corp | | | 25,359 | |
| | 42,513 | | | | | Protective Life Corp | | | 2,154 | |
| | 477,529 | | | | | Prudential Financial, Inc | | | 44,038 | |
| | 912,978 | | | | | Prudential plc | | | 20,400 | |
| | 6,511 | | | | | RenaissanceRe Holdings Ltd | | | 634 | |
| | 89 | | | | | RLI Corp | | | 9 | |
| | 2,022,246 | | | | | Royal & Sun Alliance Insurance Group plc | | | 3,061 | |
| | 900 | | | | | Safety Insurance Group, Inc | | | 51 | |
| | 2,400 | | | | | Selective Insurance Group, Inc | | | 65 | |
| | 2,490 | | | | | Stancorp Financial Group, Inc | | | 165 | |
| | 1,244,153 | | | | | Standard Life plc | | | 7,430 | |
| | 13,455 | | | | | Stewart Information Services Corp | | | 434 | |
| | 169,853 | | | | | Swiss Re Ltd | | | 15,658 | |
| | 177,900 | | | | | T&D Holdings, Inc | | | 2,490 | |
| | 433,143 | | | | | Travelers Cos, Inc | | | 39,217 | |
| | 800 | | | | | TrygVesta AS | | | 77 | |
| | 2,328 | | | | | United Fire & Casualty Co | | | 67 | |
| | 10,000 | | | | | Willis Group Holdings plc | | | 448 | |
| | | | | | | TOTAL INSURANCE | | | 472,501 | |
| | | | | | | |
| MATERIALS - 3.6% |
| | 52,958 | | | | | Agnico-Eagle Mines Ltd | | | 1,397 | |
| | 23,600 | | | | | Agrium, Inc (Toronto) | | | 2,159 | |
| | 96,390 | | | | | Air Liquide | | | 13,642 | |
| | 308,797 | | | | | Air Products & Chemicals, Inc | | | 34,517 | |
| | 23,600 | | | | | Akzo Nobel NV | | | 1,830 | |
| | 500 | | | | | Albemarle Corp | | | 32 | |
| | 744,736 | | | | | Alcoa, Inc | | | 7,917 | |
| | 148,535 | | | *,e | | Allied Nevada Gold Corp | | | 527 | |
| | 3,627,279 | | | * | | Alumina Ltd | | | 3,601 | |
| | 128,690 | | | | | AMCOL International Corp | | | 4,373 | |
| | 92,400 | | | | | Amcor Ltd | | | 873 | |
| | 26,351 | | | | | Aptargroup, Inc | | | 1,787 | |
| | 232,000 | | | | | Asahi Kasei Corp | | | 1,820 | |
| | 176,082 | | | | | Avery Dennison Corp | | | 8,838 | |
| | 63,073 | | | | | Ball Corp | | | 3,258 | |
| | 132,610 | | | | | BASF AG. | | | 14,154 | |
| | 48,884 | | | | | Bemis Co, Inc | | | 2,002 | |
| | 244,955 | | | | | Boliden AB | | | 3,756 | |
COLLEGE RETIREMENT EQUITIES FUND - Social Choice Account
| | | | | | | | VALUE | |
| SHARES | | | | | COMPANY | | (000) | |
| | 19,633 | | | | | Boral Ltd | | $ | 84 | |
| | 8,161 | | | | | Carpenter Technology Corp | | | 508 | |
| | 3,000 | | | * | | Castle (A.M.) & Co | | | 44 | |
| | 44,916 | | | | | Celanese Corp (Series A) | | | 2,484 | |
| | 2,372 | | | * | | Clearwater Paper Corp | | | 125 | |
| | 131,361 | | | | | Commercial Metals Co | | | 2,671 | |
| | 14,183 | | | | | Compass Minerals International, Inc | | | 1,135 | |
| | 295,427 | | | | | CRH plc | | | 7,487 | |
| | 17,000 | | | | | Daido Steel Co Ltd | | | 85 | |
| | 5,617 | | | | | Domtar Corp | | | 530 | |
| | 9,400 | | | | | DSM NV | | | 740 | |
| | 36,695 | | | | | Eastman Chemical Co | | | 2,961 | |
| | 361,834 | | | | | Ecolab, Inc | | | 37,728 | |
| | 5,690 | | | * | | Ferro Corp | | | 73 | |
| | 646,464 | | | | | Fletcher Building Ltd | | | 4,530 | |
| | 33,738 | | | * | | Flotek Industries, Inc | | | 677 | |
| | 1,019,115 | | | e | | Fortescue Metals Group Ltd | | | 5,324 | |
| | 111,806 | | | | | Fresnillo plc | | | 1,390 | |
| | 2,179 | | | | | Givaudan S.A. | | | 3,117 | |
| | 2,623 | | | | | Globe Specialty Metals, Inc | | | 47 | |
| | 94,290 | | | | | H.B. Fuller Co | | | 4,907 | |
| | 48,214 | | | | | HeidelbergCement AG. | | | 3,661 | |
| | 50,000 | | | | | Hitachi Metals Ltd | | | 707 | |
| | 900 | | | | | Imerys S.A. | | | 78 | |
| | 23,190 | | | | | Innophos Holdings, Inc | | | 1,127 | |
| | 9,797 | | | | | International Flavors & Fragrances, Inc | | | 842 | |
| | 238,995 | | | | | International Paper Co | | | 11,718 | |
| | 113,200 | | | | | JFE Holdings, Inc | | | 2,698 | |
| | 10,464 | | | | | Johnson Matthey plc | | | 569 | |
| | 48,900 | | | | | JSR Corp | | | 948 | |
| | 77,699 | | | e | | K&S AG. | | | 2,394 | |
| | 18,000 | | | | | Kaneka Corp | | | 118 | |
| | 333,300 | | | | | Kinross Gold Corp | | | 1,459 | |
| | 643,000 | | | * | | Kobe Steel Ltd | | | 1,102 | |
| | 7,764 | | | * | | Kraton Polymers LLC | | | 179 | |
| | 10,783 | | | e | | Kronos Worldwide, Inc | | | 205 | |
| | 58,000 | | | | | Kuraray Co Ltd | | | 692 | |
| | 46,374 | | | | | Linde AG. | | | 9,710 | |
| | 173,029 | | | * | | Louisiana-Pacific Corp | | | 3,203 | |
| | 388,286 | | | | | LyondellBasell Industries AF S.C.A | | | 31,172 | |
| | 71,436 | | | *,e | | McEwen Mining, Inc | | | 140 | |
| | 212,757 | | | | | MeadWestvaco Corp | | | 7,857 | |
| | 53,088 | | | | | Minerals Technologies, Inc | | | 3,189 | |
| | 120,960 | | | | | Mitsui Chemicals, Inc | | | 293 | |
| | 80,290 | | | | | Mosaic Co | | | 3,795 | |
| | 2,100 | | | | | Myers Industries, Inc | | | 44 | |
| | 2,220 | | | | | Neenah Paper, Inc | | | 95 | |
| | 360,702 | | | | | Newcrest Mining Ltd | | | 2,533 | |
| | 3,308,000 | | | | | Nippon Steel Corp | | | 11,094 | |
| | 31,500 | | | | | Nitto Denko Corp | | | 1,332 | |
| | 996,190 | | | e | | Norsk Hydro ASA | | | 4,456 | |
| | 532,256 | | | | | Nucor Corp | | | 28,412 | |
COLLEGE RETIREMENT EQUITIES FUND - Social Choice Account
| | | | | | | | VALUE | |
| SHARES | | | | | COMPANY | | (000) | |
| | 53,242 | | | | | Orica Ltd | | $ | 1,139 | |
| | 64,561 | | | * | | Owens-Illinois, Inc | | | 2,310 | |
| | 11,843 | | | | | PolyOne Corp | | | 419 | |
| | 123,900 | | | e | | Potash Corp of Saskatchewan (Toronto) | | | 4,085 | |
| | 322,338 | | | | | Praxair, Inc | | | 41,914 | |
| | 1,380 | | | | | Quaker Chemical Corp | | | 106 | |
| | 2,289,845 | | | * | | Rentech, Inc | | | 4,007 | |
| | 38,970 | | | | | Rexam plc | | | 343 | |
| | 6,623 | | | | | Rock-Tenn Co (Class A) | | | 696 | |
| | 15,925 | | | | | Rockwood Holdings, Inc | | | 1,145 | |
| | 144,474 | | | | | Royal Gold, Inc | | | 6,656 | |
| | 6,424 | | | * | | RTI International Metals, Inc | | | 220 | |
| | 850 | | | | | Schnitzer Steel Industries, Inc (Class A) | | | 28 | |
| | 18,931 | | | | | Sealed Air Corp | | | 645 | |
| | 17,916 | | | | | Sherwin-Williams Co | | | 3,288 | |
| | 92,200 | | | | | Shin-Etsu Chemical Co Ltd | | | 5,393 | |
| | 215,146 | | | | | Sigma-Aldrich Corp | | | 20,226 | |
| | 802 | | | | | Sika AG. | | | 2,858 | |
| | 237,200 | | | | | Silver Wheaton Corp | | | 4,790 | |
| | 1,200 | | | | | Stepan Co | | | 79 | |
| | 74,982 | | | *,e | | Stillwater Mining Co | | | 925 | |
| | 334,517 | | | | | Stora Enso Oyj (R Shares) | | | 3,361 | |
| | 360,000 | | | | | Sumitomo Chemical Co Ltd | | | 1,413 | |
| | 524,000 | | | | | Sumitomo Metal Mining Co Ltd | | | 6,866 | |
| | 42,000 | | | | | Taiyo Nippon Sanso Corp | | | 299 | |
| | 485,500 | | | e | | Teck Cominco Ltd | | | 12,637 | |
| | 74,000 | | | | | Teijin Ltd | | | 165 | |
| | 305,000 | | | | | Toray Industries, Inc | | | 2,113 | |
| | 117,300 | | | | | Toyo Seikan Kaisha Ltd | | | 2,525 | |
| | 69,914 | | | | | Tredegar Corp | | | 2,014 | |
| | 15,649 | | | | | Umicore | | | 731 | |
| | 198,855 | | | | | UPM-Kymmene Oyj | | | 3,373 | |
| | 60,125 | | | | | Valspar Corp | | | 4,286 | |
| | 4,790 | | | | | Wausau Paper Corp | | | 61 | |
| | 300,696 | | | | | Worthington Industries, Inc | | | 12,653 | |
| | | | | | | TOTAL MATERIALS | | | 472,721 | |
| | | | | | | | | | | |
| MEDIA - 1.8% | | | | |
| | 185,416 | | | e | | Cablevision Systems Corp (Class A) | | | 3,325 | |
| | 19,805 | | | | | Cinemark Holdings, Inc | | | 660 | |
| | 10,955 | | | | | Clear Channel Outdoor Holdings, Inc (Class A) | | | 111 | |
| | 146,722 | | | *,e | | Digital Generation, Inc | | | 1,871 | |
| | 388,492 | | | * | | Discovery Communications, Inc (Class A) | | | 35,127 | |
| | 57,029 | | | * | | Discovery Communications, Inc (Class C) | | | 4,782 | |
| | 52,293 | | | * | | DreamWorks Animation SKG, Inc (Class A) | | | 1,856 | |
| | 1,900 | | | | | JC Decaux S.A. | | | 78 | |
| | 10,069 | | | | | John Wiley & Sons, Inc (Class A) | | | 556 | |
| | 235,872 | | | * | | Journal Communications, Inc (Class A) | | | 2,196 | |
| | 15,813 | | | | | Lagardere S.C.A. | | | 588 | |
| | 71,532 | | | * | | Liberty Global plc | | | 6,032 | |
| | 391,960 | | | * | | Liberty Global plc (Class A) | | | 34,881 | |
| | 68,352 | | | * | | Liberty Media Corp | | | 10,010 | |
COLLEGE RETIREMENT EQUITIES FUND - Social Choice Account
| | | | | | | | VALUE | |
| SHARES | | | | | COMPANY | | (000) | |
| | 10,000 | | | * | | Madison Square Garden, Inc | | $ | 576 | |
| | 215,655 | | | *,e | | McClatchy Co (Class A) | | | 733 | |
| | 228,929 | | | e | | New York Times Co (Class A) | | | 3,633 | |
| | 551,411 | | | | | Pearson plc | | | 12,294 | |
| | 18,429 | | | | | ProSiebenSat. Media AG. | | | 915 | |
| | 1,550 | | | | | Scholastic Corp | | | 53 | |
| | 15,051 | | | | | Scripps Networks Interactive (Class A) | | | 1,301 | |
| | 1,067,000 | | | e | | Singapore Press Holdings Ltd | | | 3,487 | |
| | 317,680 | | | | | Time Warner Cable, Inc | | | 43,046 | |
| | 724,009 | | | | | Time Warner, Inc | | | 50,478 | |
| | 52,156 | | | e | | Valassis Communications, Inc | | | 1,786 | |
| | 46,200 | | | | | Wolters Kluwer NV | | | 1,319 | |
| | 683,960 | | | | | WPP plc | | | 15,665 | |
| | | | | | | TOTAL MEDIA | | | 237,359 | |
| | | | | | | | | | | |
| PHARMACEUTICALS, BIOTECHNOLOGY & LIFE SCIENCES - 4.8% | | | | |
| | 1,969 | | | * | | Acorda Therapeutics, Inc | | | 57 | |
| | 68,628 | | | | | Actelion Ltd | | | 5,821 | |
| | 17,804 | | | *,e | | Affymetrix, Inc | | | 153 | |
| | 375,014 | | | | | Agilent Technologies, Inc | | | 21,447 | |
| | 107,729 | | | *,e | | Akorn, Inc | | | 2,653 | |
| | 2,000 | | | * | | Alexion Pharmaceuticals, Inc | | | 266 | |
| | 324,767 | | | | | Amgen, Inc | | | 37,075 | |
| | 174,280 | | | | | Astellas Pharma, Inc | | | 10,333 | |
| | 13,554 | | | * | | Auxilium Pharmaceuticals, Inc | | | 281 | |
| | 177,187 | | | * | | Biogen Idec, Inc | | | 49,568 | |
| | 57,262 | | | * | | Biovail Corp (Toronto) | | | 6,718 | |
| | 1,067,635 | | | | | Bristol-Myers Squibb Co | | | 56,745 | |
| | 8,887 | | | * | | Cadence Pharmaceuticals, Inc | | | 80 | |
| | 14,305 | | | * | | Cambrex Corp | | | 255 | |
| | 57,720 | | | *,e | | Cepheid, Inc | | | 2,697 | |
| | 180,400 | | | e | | Chugai Pharmaceutical Co Ltd | | | 3,993 | |
| | 19,300 | | | | | Dainippon Sumitomo Pharma Co Ltd | | | 302 | |
| | 23,451 | | | * | | Depomed, Inc | | | 248 | |
| | 49,400 | | | | | Eisai Co Ltd | | | 1,915 | |
| | 130,212 | | | *,e | | Endo Pharmaceuticals Holdings, Inc | | | 8,784 | |
| | 4,519 | | | * | | Fluidigm Corp | | | 173 | |
| | 875,403 | | | * | | Gilead Sciences, Inc | | | 65,786 | |
| | 963,615 | | | | | GlaxoSmithKline plc | | | 25,745 | |
| | 4,270 | | | *,e | | Immunogen, Inc | | | 63 | |
| | 15,329 | | | *,e | | Immunomedics, Inc | | | 71 | |
| | 117,675 | | | * | | Incyte Corp | | | 5,958 | |
| | 13,244 | | | *,e | | Ironwood Pharmaceuticals, Inc | | | 154 | |
| | 1,177,080 | | | | | Johnson & Johnson | | | 107,809 | |
| | 145,415 | | | * | | Life Technologies Corp | | | 11,022 | |
| | 1,526,938 | | | | | Merck & Co, Inc | | | 76,423 | |
| | 22,815 | | | | | Merck KGaA | | | 4,094 | |
| | 1,392 | | | * | | Mettler-Toledo International, Inc | | | 338 | |
| | 2,769 | | | * | | Momenta Pharmaceuticals, Inc | | | 49 | |
| | 243,310 | | | * | | Nektar Therapeutics | | | 2,762 | |
| | 429,250 | | | | | Novartis AG. | | | 34,404 | |
| | 91,145 | | | | | Novo Nordisk AS (Class B) | | | 16,707 | |
COLLEGE RETIREMENT EQUITIES FUND - Social Choice Account
| | | | | | | | VALUE | |
| SHARES | | | | | COMPANY | | (000) | |
| | 138,654 | | | e | | PDL BioPharma, Inc | | $ | 1,170 | |
| | 12,565 | | | | | PerkinElmer, Inc | | | 518 | |
| | 133,613 | | | | | Roche Holding AG. | | | 37,428 | |
| | 83,791 | | | * | | Salix Pharmaceuticals Ltd | | | 7,536 | |
| | 85,573 | | | *,e | | Sangamo Biosciences, Inc | | | 1,189 | |
| | 232,800 | | | | | Takeda Pharmaceutical Co Ltd | | | 10,677 | |
| | 2,965 | | | | | Techne Corp | | | 281 | |
| | 20,142 | | | | | Thermo Electron Corp | | | 2,243 | |
| | 1,800 | | | e | | Tsumura & Co | | | 48 | |
| | 16,960 | | | * | | United Therapeutics Corp | | | 1,918 | |
| | 103,739 | | | * | | Vertex Pharmaceuticals, Inc | | | 7,708 | |
| | 10,081 | | | * | | Viropharma, Inc | | | 503 | |
| | 240,243 | | | *,e | | Vivus, Inc | | | 2,181 | |
| | 61,330 | | | * | | Waters Corp | | | 6,133 | |
| | 10,632 | | | * | | Xenoport, Inc | | | 61 | |
| | | | | | | TOTAL PHARMACEUTICALS, BIOTECHNOLOGY & LIFE SCIENCES | | | 640,543 | |
| | | | | | | | | | | |
| REAL ESTATE - 2.0% | | | | |
| | 64,700 | | | | | Aeon Mall Co Ltd | | | 1,812 | |
| | 10,892 | | | | | American Campus Communities, Inc | | | 351 | |
| | 445,452 | | | | | American Tower Corp | | | 35,556 | |
| | 1,099,494 | | | | | Annaly Capital Management, Inc | | | 10,962 | |
| | 1,000 | | | | | AvalonBay Communities, Inc | | | 118 | |
| | 120,047 | | | | | Boston Properties, Inc | | | 12,049 | |
| | 248,240 | | | | | British Land Co plc | | | 2,588 | |
| | 2,125,000 | | | | | CapitaLand Ltd | | | 5,122 | |
| | 3,498,000 | | | | | CapitaMall Trust | | | 5,294 | |
| | 553,000 | | | | | CapitaMalls Asia Ltd | | | 862 | |
| | 195,955 | | | * | | CBRE Group, Inc | | | 5,154 | |
| | 198,835 | | | | | CFS Gandel Retail Trust | | | 346 | |
| | 151,000 | | | e | | City Developments Ltd | | | 1,154 | |
| | 207,000 | | | | | Daiwa House Industry Co Ltd | | | 4,011 | |
| | 2,200,199 | | | | | DB RREEF Trust | | | 1,979 | |
| | 22,121 | | | | | Douglas Emmett, Inc | | | 515 | |
| | 165,551 | | | | | Duke Realty Corp | | | 2,490 | |
| | 129,435 | | | | | Equity Residential | | | 6,714 | |
| | 17,634 | | | | | Federal Realty Investment Trust | | | 1,788 | |
| | 300,754 | | | | | First Industrial Realty Trust, Inc | | | 5,248 | |
| | 2,732 | | | * | | Forest City Enterprises, Inc (Class A) | | | 52 | |
| | 15,042 | | | | | Gecina S.A. | | | 1,992 | |
| | 435,396 | | | | | GPT Group (ASE) | | | 1,324 | |
| | 533,654 | | | | | HCP, Inc | | | 19,382 | |
| | 100,037 | | | | | Health Care REIT, Inc | | | 5,359 | |
| | 12,227 | | | | | Healthcare Realty Trust, Inc | | | 260 | |
| | 736,502 | | | | | Host Marriott Corp | | | 14,318 | |
| | 82,000 | | | | | Keppel Land Ltd | | | 218 | |
| | 291,636 | | | | | Land Securities Group plc | | | 4,659 | |
| | 16,682 | | | | | LaSalle Hotel Properties | | | 515 | |
| | 59,200 | | | | | Lend Lease Corp Ltd | | | 591 | |
| | 381,212 | | | | | Liberty International plc | | | 1,957 | |
| | 37,196 | | | | | Liberty Property Trust | | | 1,260 | |
| | 54,403 | | | | | Macerich Co | | | 3,204 | |
COLLEGE RETIREMENT EQUITIES FUND - Social Choice Account
| | | | | | | | VALUE | |
| SHARES | | | | | COMPANY | | (000) | |
| | 160,440 | | | | | Macquarie Goodman Group | | $ | 680 | |
| | 14,597 | | | | | Medical Properties Trust, Inc | | | 178 | |
| | 16,850 | | | | | Mid-America Apartment Communities, Inc | | | 1,023 | |
| | 726,832 | | | e | | Mirvac Group | | | 1,093 | |
| | 305,810 | | | | | Mitsui Fudosan Co Ltd | | | 11,031 | |
| | 2,000 | | | | | Plum Creek Timber Co, Inc | | | 93 | |
| | 13,546 | | | | | Post Properties, Inc | | | 613 | |
| | 459,590 | | | | | Prologis, Inc | | | 16,982 | |
| | 269,490 | | | e | | RAIT Investment Trust | | | 2,417 | |
| | 92,736 | | | e | | Ryman Hospitality Properties | | | 3,874 | |
| | 623,984 | | | | | Segro plc | | | 3,454 | |
| | 250,750 | | | | | Simon Property Group, Inc | | | 38,154 | |
| | 1,155,410 | | | e | | Stockland Trust Group | | | 3,735 | |
| | 35,276 | | | | | Unibail-Rodamco | | | 9,040 | |
| | 92,125 | | | | | Ventas, Inc | | | 5,277 | |
| | 142,947 | | | | | Vornado Realty Trust | | | 12,692 | |
| | 2,000 | | | | | Weyerhaeuser Co | | | 63 | |
| | 3,851 | | | | | Winthrop Realty Trust | | | 42 | |
| | | | | | | TOTAL REAL ESTATE | | | 269,645 | |
| | | | | | | | | | | |
| RETAILING - 2.5% | | | | |
| | 8,224 | | | | | Aaron’s, Inc | | | 242 | |
| | 16,615 | | | | | Advance Auto Parts, Inc | | | 1,839 | |
| | 127,624 | | | | | American Eagle Outfitters, Inc | | | 1,838 | |
| | 32,439 | | | * | | Ann Taylor Stores Corp | | | 1,186 | |
| | 47,511 | | | * | | AutoZone, Inc | | | 22,707 | |
| | 19,109 | | | * | | Barnes & Noble, Inc | | | 286 | |
| | 214,041 | | | * | | Bed Bath & Beyond, Inc | | | 17,187 | |
| | 132,772 | | | | | Best Buy Co, Inc | | | 5,295 | |
| | 810 | | | *,e | | Blue Nile, Inc | | | 38 | |
| | 7,961 | | | * | | Cabela’s, Inc | | | 531 | |
| | 7,000 | | | e | | Canadian Tire Corp Ltd | | | 656 | |
| | 81,708 | | | * | | Carmax, Inc | | | 3,842 | |
| | 12,500 | | | | | Fast Retailing Co Ltd | | | 5,163 | |
| | 7,165 | | | | | Finish Line, Inc (Class A) | | | 202 | |
| | 67,898 | | | | | Foot Locker, Inc | | | 2,814 | |
| | 511,369 | | | | | Gap, Inc | | | 19,984 | |
| | 262,371 | | | | | Genuine Parts Co | | | 21,827 | |
| | 23,293 | | | | | GNC Holdings, Inc | | | 1,361 | |
| | 2,200 | | | | | Haverty Furniture Cos, Inc | | | 69 | |
| | 197,899 | | | | | Hennes & Mauritz AB (B Shares) | | | 9,114 | |
| | 39,551 | | | | | HSN, Inc | | | 2,464 | |
| | 48,910 | | | | | Inditex S.A. | | | 8,076 | |
| | 50,000 | | | | | Jardine Cycle & Carriage Ltd | | | 1,428 | |
| | 417,700 | | | | | Kingfisher plc | | | 2,667 | |
| | 235,947 | | | | | Kohl’s Corp | | | 13,390 | |
| | 2,891,620 | | | e | | Li & Fung Ltd | | | 3,738 | |
| | 756,126 | | | * | | Liberty Interactive Corp | | | 22,192 | |
| | 19,712 | | | * | | LKQ Corp | | | 648 | |
| | 941,190 | | | | | Lowe’s Companies, Inc | | | 46,636 | |
| | 203,285 | | | | | Macy’s, Inc | | | 10,855 | |
| | 210,991 | | | | | Marks & Spencer Group plc | | | 1,515 | |
COLLEGE RETIREMENT EQUITIES FUND - Social Choice Account
| | | | | | | | VALUE | |
| SHARES | | | | | COMPANY | | (000) | |
| | 676 | | | * | | NetFlix, Inc | | $ | 249 | |
| | 6,288 | | | * | | New York & Co, Inc | | | 27 | |
| | 6,625 | | | | | Next plc | | | 599 | |
| | 66,728 | | | | | Nordstrom, Inc | | | 4,124 | |
| | 2,000 | | | | | Nutri/System, Inc | | | 33 | |
| | 217,335 | | | * | | Office Depot, Inc | | | 1,150 | |
| | 9,311 | | | * | | O’Reilly Automotive, Inc | | | 1,198 | |
| | 8,683 | | | *,e | | Outerwall, Inc | | | 584 | |
| | 39,348 | | | | | Petsmart, Inc | | | 2,863 | |
| | 35,119 | | | | | Pier 1 Imports, Inc | | | 811 | |
| | 147 | | | | | PPR | | | 31 | |
| | 16,391 | | | | | Ross Stores, Inc | | | 1,228 | |
| | 23,447 | | | * | | Sally Beauty Holdings, Inc | | | 709 | |
| | 9,136 | | | *,e | | Shutterfly, Inc | | | 465 | |
| | 14,679 | | | | | Signet Jewelers Ltd | | | 1,155 | |
| | 567,973 | | | | | Staples, Inc | | | 9,025 | |
| | 3,300 | | | | | Stein Mart, Inc | | | 44 | |
| | 570,917 | | | | | Target Corp | | | 36,122 | |
| | 16,714 | | | | | Tiffany & Co | | | 1,551 | |
| | 696,291 | | | | | TJX Companies, Inc | | | 44,375 | |
| | 2,742 | | | * | | TripAdvisor, Inc | | | 227 | |
| | 10,000 | | | * | | Tuesday Morning Corp | | | 160 | |
| | 111,000 | | | | | Yamada Denki Co Ltd | | | 363 | |
| | | | | | | TOTAL RETAILING | | | 336,883 | |
| | | | | | | | | | | |
| SEMICONDUCTORS & SEMICONDUCTOR EQUIPMENT - 1.3% | | | | |
| | 80,003 | | | * | | Advanced Energy Industries, Inc | | | 1,829 | |
| | 66,931 | | | *,e | | Advanced Micro Devices, Inc | | | 259 | |
| | 10,479 | | | | | Analog Devices, Inc | | | 534 | |
| | 1,971,232 | | | | | Applied Materials, Inc | | | 34,871 | |
| | 82,331 | | | | | ASML Holding NV | | | 7,711 | |
| | 15,582 | | | *,e | | Cirrus Logic, Inc | | | 318 | |
| | 22,358 | | | e | | Cypress Semiconductor Corp | | | 235 | |
| | 5,894 | | | * | | Freescale Semiconductor Holdings Ltd | | | 95 | |
| | 558 | | | * | | Hittite Microwave Corp | | | 34 | |
| | 2,727,539 | | | | | Intel Corp | | | 70,807 | |
| | 6,138 | | | * | | International Rectifier Corp | | | 160 | |
| | 21,682 | | | * | | Lam Research Corp | | | 1,181 | |
| | 9,064 | | | e | | Microchip Technology, Inc | | | 406 | |
| | 1,140 | | | | | MKS Instruments, Inc | | | 34 | |
| | 541,931 | | | * | | ON Semiconductor Corp | | | 4,466 | |
| | 24,898 | | | * | | RF Micro Devices, Inc | | | 128 | |
| | 97,903 | | | * | | Skyworks Solutions, Inc | | | 2,796 | |
| | 266,513 | | | e | | STMicroelectronics NV | | | 2,139 | |
| | 72,694 | | | *,e | | SunPower Corp | | | 2,167 | |
| | 40,230 | | | * | | Teradyne, Inc | | | 709 | |
| | 1,006,837 | | | | | Texas Instruments, Inc | | | 44,210 | |
| | 6,900 | | | | | Tokyo Electron Ltd | | | 380 | |
| | 41,101 | | | * | | Triquint Semiconductor, Inc | | | 343 | |
| | | | | | | TOTAL SEMICONDUCTORS & SEMICONDUCTOR EQUIPMENT | | | 175,812 | |
COLLEGE RETIREMENT EQUITIES FUND - Social Choice Account
| | | | | | | | VALUE | |
| SHARES | | | | | COMPANY | | (000) | |
| SOFTWARE & SERVICES - 4.6% | | | | |
| | 527,384 | | | | | Accenture plc | | $ | 43,361 | |
| | 528,194 | | | * | | Adobe Systems, Inc | | | 31,628 | |
| | 1,660 | | | | | Advent Software, Inc | | | 58 | |
| | 25,647 | | | *,e | | Angie’s List, Inc | | | 389 | |
| | 165,842 | | | * | | AOL, Inc | | | 7,732 | |
| | 1,856 | | | * | | Aspen Technology, Inc | | | 78 | |
| | 2,133 | | | | | Atos Origin S.A. | | | 193 | |
| | 201,046 | | | * | | Autodesk, Inc | | | 10,119 | |
| | 128,405 | | | | | Broadridge Financial Solutions, Inc | | | 5,075 | |
| | 485,524 | | | | | CA, Inc | | | 16,338 | |
| | 24,502 | | | * | | Cadence Design Systems, Inc | | | 344 | |
| | 37,120 | | | | | Cap Gemini S.A. | | | 2,512 | |
| | 24,400 | | | * | | CGI Group, Inc | | | 816 | |
| | 401,348 | | | * | | Cognizant Technology Solutions Corp (Class A) | | | 40,528 | |
| | 124,867 | | | | | Compuware Corp | | | 1,400 | |
| | 6,178 | | | * | | comScore, Inc | | | 177 | |
| | 20,058 | | | | | Convergys Corp | | | 422 | |
| | 33,183 | | | * | | Demand Media, Inc | | | 191 | |
| | 5,179 | | | *,e | | E2open, Inc | | | 124 | |
| | 2,100 | | | | | EPIQ Systems, Inc | | | 34 | |
| | 6,214 | | | e | | Factset Research Systems, Inc | | | 675 | |
| | 5,718 | | | | | Fair Isaac Corp | | | 359 | |
| | 30,365 | | | * | | Fortinet, Inc | | | 581 | |
| | 592,000 | | | * | | Fujitsu Ltd | | | 3,068 | |
| | 13,395 | | | | | Global Payments, Inc | | | 871 | |
| | 109,496 | | | * | | Google, Inc (Class A) | | | 122,713 | |
| | 2,815 | | | * | | Higher One Holdings, Inc | | | 27 | |
| | 91,530 | | | * | | Informatica Corp | | | 3,798 | |
| | 467,530 | | | | | International Business Machines Corp | | | 87,695 | |
| | 402,600 | | | | | Intuit, Inc | | | 30,726 | |
| | 1,740 | | | e | | j2 Global, Inc | | | 87 | |
| | 28,341 | | | *,e | | Liquidity Services, Inc | | | 642 | |
| | 1,000 | | | | | MAXIMUS, Inc | | | 44 | |
| | 3,035 | | | * | | NetSuite, Inc | | | 313 | |
| | 19,743 | | | * | | NeuStar, Inc (Class A) | | | 984 | |
| | 10,700 | | | | | Nomura Research Institute Ltd | | | 338 | |
| | 20,400 | | | | | NTT Data Corp | | | 754 | |
| | 3,900 | | | | | Open Text Corp | | | 359 | |
| | 6,221 | | | *,e | | OpenTable, Inc | | | 494 | |
| | 1,919,450 | | | | | Oracle Corp | | | 73,438 | |
| | 22,849 | | | * | | QuinStreet, Inc | | | 199 | |
| | 0 | | | * | | Recall Holdings Ltd | | | 0 | ^ |
| | 10,721 | | | * | | Responsys, Inc | | | 294 | |
| | 2,376 | | | * | | Rosetta Stone, Inc | | | 29 | |
| | 7,887 | | | * | | Rovi Corp | | | 155 | |
| | 579,288 | | | * | | Salesforce.com, Inc | | | 31,971 | |
| | 228,532 | | | | | SAP AG. | | | 19,819 | |
| | 10,057 | | | * | | Seachange International, Inc | | | 122 | |
| | 23,784 | | | * | | ServiceSource International LLC | | | 199 | |
| | 4,823 | | | * | | SolarWinds, Inc | | | 182 | |
| | 2,000 | | | * | | SPS Commerce, Inc | | | 131 | |
| | 948,597 | | | | | Symantec Corp | | | 22,368 | |
COLLEGE RETIREMENT EQUITIES FUND - Social Choice Account
| | | | | | | | VALUE | |
| SHARES | | | | | COMPANY | | (000) | |
| | 6,468 | | | * | | Syntel, Inc | | $ | 588 | |
| | 4,529 | | | *,e | | Tangoe, Inc | | | 82 | |
| | 20,999 | | | * | | Teradata Corp | | | 955 | |
| | 507 | | | * | | Ultimate Software Group, Inc | | | 78 | |
| | 16,010 | | | * | | Unisys Corp | | | 537 | |
| | 14,487 | | | *,e | | Valueclick, Inc | | | 339 | |
| | 1,015,045 | | | * | | Yahoo!, Inc | | | 41,048 | |
| | | | | | | TOTAL SOFTWARE & SERVICES | | | 608,581 | |
| | | | | | | | | | | |
| TECHNOLOGY HARDWARE & EQUIPMENT - 2.3% | | | | |
| | 8,103 | | | | | Adtran, Inc | | | 219 | |
| | 4,847 | | | * | | ARRIS Group, Inc | | | 118 | |
| | 116,347 | | | * | | Aruba Networks, Inc | | | 2,083 | |
| | 11,531 | | | * | | Avid Technology, Inc | | | 94 | |
| | 4,234 | | | | | Belden CDT, Inc | | | 298 | |
| | 2,571 | | | * | | Benchmark Electronics, Inc | | | 59 | |
| | 900 | | | | | Black Box Corp | | | 27 | |
| | 3,303 | | | * | | Calix Networks, Inc | | | 32 | |
| | 254,100 | | | *,e | | Canon, Inc | | | 8,108 | |
| | 2,299 | | | * | | Checkpoint Systems, Inc | | | 36 | |
| | 2,721,726 | | | | | Cisco Systems, Inc | | | 61,103 | |
| | 53,700 | | | | | Citizen Watch Co Ltd | | | 453 | |
| | 9,600 | | | * | | Cognex Corp | | | 367 | |
| | 909 | | | * | | Coherent, Inc | | | 68 | |
| | 208,957 | | | | | Corning, Inc | | | 3,724 | |
| | 190,535 | | | * | | Cray, Inc | | | 5,232 | |
| | 4,840 | | | * | | Digi International, Inc | | | 59 | |
| | 3,605 | | | * | | DTS, Inc | | | 86 | |
| | 1,318 | | | * | | Electronics for Imaging, Inc | | | 51 | |
| | 1,720,163 | | | | | EMC Corp | | | 43,262 | |
| | 1,358 | | | | | FEI Co | | | 121 | |
| | 103,068 | | | * | | Finisar Corp | | | 2,465 | |
| | 90,753 | | | * | | Flextronics International Ltd | | | 705 | |
| | 195,900 | | | | | Fuji Folms Holdings Corp | | | 5,561 | |
| | 37,319 | | | *,e | | Fusion-io, Inc | | | 332 | |
| | 1,649,254 | | | | | Hewlett-Packard Co | | | 46,146 | |
| | 5,600 | | | | | Hitachi High-Technologies Corp | | | 141 | |
| | 59,600 | | | | | Ibiden Co Ltd | | | 1,116 | |
| | 43,639 | | | * | | Ingram Micro, Inc (Class A) | | | 1,024 | |
| | 11,659 | | | * | | Insight Enterprises, Inc | | | 265 | |
| | 1,676 | | | e | | InterDigital, Inc | | | 49 | |
| | 5,000 | | | *,e | | InvenSense, Inc | | | 104 | |
| | 30,066 | | | *,e | | IPG Photonics Corp | | | 2,333 | |
| | 1,920 | | | * | | Itron, Inc | | | 80 | |
| | 24,389 | | | | | Jabil Circuit, Inc | | | 425 | |
| | 188,500 | | | | | Konica Minolta Holdings, Inc | | | 1,884 | |
| | 69,200 | | | | | Kyocera Corp | | | 3,459 | |
| | 54,381 | | | e | | Lexmark International, Inc (Class A) | | | 1,932 | |
| | 1,068 | | | | | Littelfuse, Inc | | | 99 | |
| | 185,861 | | | | | Motorola, Inc | | | 12,546 | |
| | 32,300 | | | | | Murata Manufacturing Co Ltd | | | 2,873 | |
| | 2,100 | | | | | National Instruments Corp | | | 67 | |
COLLEGE RETIREMENT EQUITIES FUND - Social Choice Account
| | | | | | | | VALUE | |
| SHARES | | | | | COMPANY | | (000) | |
| | 7,919 | | | * | | Netgear, Inc | | $ | 261 | |
| | 45,500 | | | | | Omron Corp | | | 2,011 | |
| | 69,596 | | | * | | Oplink Communications, Inc | | | 1,294 | |
| | 500 | | | * | | OSI Systems, Inc | | | 27 | |
| | 1,774 | | | | | Plantronics, Inc | | | 82 | |
| | 1,420 | | | * | | Plexus Corp | | | 61 | |
| | 3,167 | | | *,e | | Procera Networks, Inc | | | 48 | |
| | 53,913 | | | * | | QLogic Corp | | | 638 | |
| | 847,188 | | | | | Qualcomm, Inc | | | 62,904 | |
| | 23,440 | | | * | | RealD, Inc | | | 200 | |
| | 2,500 | | | * | | Rofin-Sinar Technologies, Inc | | | 68 | |
| | 1,300 | | | * | | Scansource, Inc | | | 55 | |
| | 6,268 | | | * | | Super Micro Computer, Inc | | | 108 | |
| | 1,417 | | | * | | SYNNEX Corp | | | 95 | |
| | 48,800 | | | | | TDK Corp | | | 2,341 | |
| | 4,637 | | | * | | Tech Data Corp | | | 239 | |
| | 13,773 | | | * | | TTM Technologies, Inc | | | 118 | |
| | 10,708 | | | *,e | | Universal Display Corp | | | 368 | |
| | 2,708 | | | * | | Vishay Precision Group, Inc | | | 40 | |
| | 2,622,193 | | | | | Xerox Corp | | | 31,912 | |
| | | | | | | TOTAL TECHNOLOGY HARDWARE & EQUIPMENT | | | 312,076 | |
| | | | | | | | | | | |
| TELECOMMUNICATION SERVICES - 1.3% | | | | |
| | 22,599 | | | * | | Boingo Wireless, Inc | | | 145 | |
| | 137,474 | | | | | BT Group plc | | | 867 | |
| | 9,017 | | | * | | Cbeyond Communications, Inc | | | 62 | |
| | 960,099 | | | | | CenturyTel, Inc | | | 30,579 | |
| | 161,417 | | | * | | Cincinnati Bell, Inc | | | 575 | |
| | 2,650 | | | | | Consolidated Communications Holdings, Inc | | | 52 | |
| | 322,673 | | | * | | Crown Castle International Corp | | | 23,694 | |
| | 1,648,150 | | | e | | Frontier Communications Corp | | | 7,664 | |
| | 5,000 | | | *,e | | Iridium Communications, Inc | | | 31 | |
| | 178,800 | | | | | KDDI Corp | | | 11,017 | |
| | 29,997 | | | * | | Level 3 Communications, Inc | | | 995 | |
| | 102,800 | | | | | Nippon Telegraph & Telephone Corp | | | 5,537 | |
| | 532,600 | | | | | NTT DoCoMo, Inc | | | 8,770 | |
| | 86,400 | | | e | | Rogers Communications, Inc (Class B) | | | 3,910 | |
| | 23,411 | | | * | | SBA Communications Corp (Class A) | | | 2,103 | |
| | 166,700 | | | | | Softbank Corp | | | 14,628 | |
| | 958,511 | | | * | | Sprint Corp | | | 10,304 | |
| | 14,008 | | | | | Swisscom AG. | | | 7,403 | |
| | 699,891 | | | | | TeliaSonera AB | | | 5,837 | |
| | 68,610 | | | * | | tw telecom inc (Class A) | | | 2,091 | |
| | 1,580 | | | | | USA Mobility, Inc | | | 23 | |
| | 8,830,263 | | | | | Vodafone Group plc | | | 34,766 | |
| | 728,258 | | | e | | Windstream Holdings, Inc | | | 5,811 | |
| | | | | | | TOTAL TELECOMMUNICATION SERVICES | | | 176,864 | |
| | | | | | | | | | | |
| TRANSPORTATION - 1.5% | | | | |
| | 44,483 | | | | | Abertis Infraestructuras S.A. (Continuous) | | | 989 | |
| | 11,311 | | | | | Alaska Air Group, Inc | | | 830 | |
| | 773 | | | * | | Allegiant Travel Co | | | 82 | |
COLLEGE RETIREMENT EQUITIES FUND - Social Choice Account
| | | | | | | | VALUE | |
| SHARES | | | | | COMPANY | | (000) | |
| | 639,647 | | | e | | Auckland International Airport Ltd | | $ | 1,858 | |
| | 104,766 | | | e | | Autostrade S.p.A. | | | 2,347 | |
| | 24,956 | | | * | | Avis Budget Group, Inc | | | 1,009 | |
| | 203,200 | | | | | Canadian National Railway Co | | | 11,585 | |
| | 1,437,000 | | | | | Cathay Pacific Airways Ltd | | | 3,045 | |
| | 30,500 | | | | | Central Japan Railway Co | | | 3,595 | |
| | 13,726 | | | | | CH Robinson Worldwide, Inc | | | 801 | |
| | 1,070,310 | | | | | CSX Corp | | | 30,793 | |
| | 134,669 | | | * | | Deutsche Lufthansa AG. | | | 2,855 | |
| | 480,498 | | | | | Deutsche Post AG. | | | 17,550 | |
| | 71,700 | | | | | East Japan Railway Co | | | 5,711 | |
| | 8,074 | | | * | | Echo Global Logistics, Inc | | | 173 | |
| | 5 | | | | | Expeditors International of Washington, Inc | | | 0 | ^ |
| | 5,413 | | | | | Fraport AG. Frankfurt Airport Services Worldwide | | | 406 | |
| | 231 | | | * | | Genesee & Wyoming, Inc (Class A) | | | 22 | |
| | 3,331 | | | | | J.B. Hunt Transport Services, Inc | | | 257 | |
| | 103,000 | | | * | | Mitsui OSK Lines Ltd | | | 465 | |
| | 2,037,197 | | | | | MTR Corp | | | 7,721 | |
| | 265,109 | | | | | Norfolk Southern Corp | | | 24,610 | |
| | 413,000 | | | | | Singapore Airlines Ltd | | | 3,411 | |
| | 228,000 | | | | | Tokyu Corp | | | 1,477 | |
| | 104,281 | | | | | Transurban Group | | | 638 | |
| | 160,145 | | | | | Union Pacific Corp | | | 26,904 | |
| | 510,592 | | | | | United Parcel Service, Inc (Class B) | | | 53,653 | |
| | | | | | | TOTAL TRANSPORTATION | | | 202,787 | |
| | | | | | | | | | | |
| UTILITIES - 2.2% | | | | |
| | 29,928 | | | | | AGL Energy Ltd | | | 402 | |
| | 8,000 | | | | | American States Water Co | | | 230 | |
| | 13,544 | | | | | American Water Works Co, Inc | | | 572 | |
| | 257,758 | | | * | | Calpine Corp | | | 5,029 | |
| | 255,104 | | | | | Centerpoint Energy, Inc | | | 5,913 | |
| | 837,282 | | | | | Centrica plc | | | 4,828 | |
| | 574 | | | | | Chesapeake Utilities Corp | | | 34 | |
| | 380,249 | | | | | Cleco Corp | | | 17,727 | |
| | 881,500 | | | | | CLP Holdings Ltd | | | 6,972 | |
| | 449,000 | | | | | Consolidated Edison, Inc | | | 24,821 | |
| | 211,007 | | | | | Contact Energy Ltd | | | 891 | |
| | 177,133 | | | | | Duke Energy Corp | | | 12,224 | |
| | 2,474 | | | | | Empire District Electric Co | | | 56 | |
| | 28,688 | | | | | Enel Green Power S.p.A | | | 72 | |
| | 714,259 | | | | | Energias de Portugal S.A. | | | 2,624 | |
| | 2,769,736 | | | | | Hong Kong & China Gas Ltd | | | 6,359 | |
| | 1,107,925 | | | | | Iberdrola S.A. | | | 7,071 | |
| | 7,771 | | | | | Integrys Energy Group, Inc | | | 423 | |
| | 2,000 | | | | | ITC Holdings Corp | | | 192 | |
| | 14,435 | | | | | MDU Resources Group, Inc | | | 441 | |
| | 65,300 | | | | | MGE Energy, Inc | | | 3,781 | |
| | 1,088,320 | | | | | National Grid plc | | | 14,234 | |
| | 29,147 | | | | | New Jersey Resources Corp | | | 1,348 | |
| | 443,338 | | | | | NextEra Energy, Inc | | | 37,959 | |
| | 620,350 | | | | | NiSource, Inc | | | 20,397 | |
COLLEGE RETIREMENT EQUITIES FUND - Social Choice Account
| | | | | | | | VALUE | |
| SHARES | | | | | COMPANY | | (000) | |
| | 334,247 | | | | | Northeast Utilities | | $ | 14,169 | |
| | 8,434 | | | | | Northwest Natural Gas Co | | | 361 | |
| | 153,232 | | | | | Oneok, Inc | | | 9,528 | |
| | 1,420 | | | e | | Ormat Technologies, Inc | | | 39 | |
| | 51,000 | | | | | Osaka Gas Co Ltd | | | 200 | |
| | 814,693 | | | e | | Pepco Holdings, Inc | | | 15,585 | |
| | 513,157 | | | | | PG&E Corp | | | 20,670 | |
| | 218,962 | | | | | Piedmont Natural Gas Co, Inc | | | 7,261 | |
| | 11,683 | | | | | Pinnacle West Capital Corp | | | 618 | |
| | 9,375 | | | | | PNM Resources, Inc | | | 226 | |
| | 5,000 | | | | | Public Service Enterprise Group, Inc | | | 160 | |
| | 455,571 | | | | | Scottish & Southern Energy plc | | | 10,352 | |
| | 253,916 | | | | | Sempra Energy | | | 22,792 | |
| | 27,089 | | | | | SJW Corp | | | 807 | |
| | 69,460 | | | | | South Jersey Industries, Inc | | | 3,887 | |
| | 54,917 | | | | | SP AusNet | | | 61 | |
| | 50,626 | | | | | Suez Environnement S.A. | | | 908 | |
| | 46,813 | | | e | | TECO Energy, Inc | | | 807 | |
| | 658,790 | | | | | Tokyo Gas Co Ltd | | | 3,247 | |
| | 11,190 | | | | | UGI Corp | | | 464 | |
| | 1,494 | | | | | Unitil Corp | | | 46 | |
| | 5,427 | | | | | UNS Energy Corp | | | 325 | |
| | 6,615 | | | | | Vectren Corp | | | 235 | |
| | 27,296 | | | | | WGL Holdings, Inc | | | 1,093 | |
| | 42,159 | | | | | Wisconsin Energy Corp | | | 1,743 | |
| | 98,438 | | | | | Xcel Energy, Inc | | | 2,750 | |
| | | | | | | TOTAL UTILITIES | | | 292,934 | |
| | | | | | | | | | | |
| | | | | | | TOTAL COMMON STOCKS | | | 8,050,670 | |
| | | | | | | (Cost $5,190,127) | | | | |
| | | | | | | | | | | |
| PREFERRED STOCKS - 0.2% | | | | |
| | | | | |
| BANKS - 0.2% | | | | |
| | 233,115 | | | * | | Federal Home Loan Mortgage Corp | | | 2,091 | |
| | 740,991 | | | * | | Federal National Mortgage Association | | | 6,483 | |
| | 14,500 | | | e | | M&T Bank Corp | | | 13,275 | |
| | | | | | | TOTAL BANKS | | | 21,849 | |
| | | | | | | | | | | |
| | | | | | | TOTAL PREFERRED STOCKS | | | 21,849 | |
| | | | | | | (Cost $38,865) | | | | |
| | | | | | | | | | | |
| RIGHTS / WARRANTS - 0.0% | | | | |
| | | | | |
| ENERGY - 0.0% | | | | |
| | 310,203 | | | | | Repsol S.A. | | | 212 | |
| | | | | | | TOTAL ENERGY | | | 212 | |
| | | | | | | | | | | |
| | | | | | | TOTAL RIGHTS / WARRANTS | | | 212 | |
| | | | | | | (Cost $203) | | | | |
COLLEGE RETIREMENT EQUITIES FUND - Social Choice Account
| PRINCIPAL | | | | | ISSUER | | RATE | | MATURITY
DATE | | VALUE
(000) | |
| SHORT-TERM INVESTMENTS - 10.1% | | | | | | | | | |
| | | | | | | | | | |
| GOVERNMENT AGENCY DEBT - 0.6% | | | | | | | | | |
| $ | 18,000,000 | | | | | Federal Home Loan Bank (FHLB) | | 0.030 | % | | 01/17/14 | | $ | 18,000 | |
| | 24,000,000 | | | | | FHLB | | 0.085 | | | 02/19/14 | | | 23,997 | |
| | 10,000,000 | | | | | FHLB | | 0.065 | | | 02/26/14 | | | 9,999 | |
| | 22,000,000 | | | w | | FHLB | | 0.060 | | | 03/21/14 | | | 21,998 | |
| | 3,540,000 | | | | | Federal Home Loan Mortgage Corp (FHLMC) | | 0.035 | | | 01/22/14 | | | 3,540 | |
| | | | | | | TOTAL GOVERNMENT AGENCY DEBT | | | | | | | | 77,534 | |
| | | | | | | | | | | | | | | | |
| TREASURY DEBT - 6.8% | | | | | | | | | |
| | 76,000,000 | | | w | | United States Treasury Bill | | 0.056-0.075 | | | 02/27/14 | | | 75,993 | |
| | 54,500,000 | | | | | United States Treasury Bill | | 0.055-0.081 | | | 03/06/14 | | | 54,495 | |
| | 21,000,000 | | | w | | United States Treasury Bill | | 0.061-0.080 | | | 03/13/14 | | | 20,998 | |
| | 19,000,000 | | | | | United States Treasury Bill | | 0.065 | | | 03/20/14 | | | 18,998 | |
| | 31,000,000 | | | w | | United States Treasury Bill | | 0.078 | | | 03/27/14 | | | 30,995 | |
| | 42,600,000 | | | w | | United States Treasury Bill | | 0.030-0.071 | | | 04/03/14 | | | 42,592 | |
| | 21,000,000 | | | w | | United States Treasury Bill | | 0.060 | | | 04/17/14 | | | 20,998 | |
| | 136,000,000 | | | w | | United States Treasury Bill | | 0.065-0.085 | | | 04/24/14 | | | 135,975 | |
| | 77,000,000 | | | w | | United States Treasury Bill | | 0.105 | | | 05/01/14 | | | 76,987 | |
| | 7,000,000 | | | w | | United States Treasury Bill | | 0.088 | | | 05/29/14 | | | 6,998 | |
| | 3,000,000 | | | | | United States Treasury Bill | | 0.070 | | | 06/19/14 | | | 2,999 | |
| | 28,000,000 | | | w | | United States Treasury Bill | | 0.101 | | | 06/26/14 | | | 27,989 | |
| | 256,300,000 | | | w | | United States Treasury Bill | | 0.063-0.116 | | | 07/24/14 | | | 256,188 | |
| | 129,000,000 | | | w | | United States Treasury Bill | | 0.075-0.135 | | | 08/21/14 | | | 128,942 | |
| | 18,000,000 | | | w | | United States Treasury Note | | 0.250 | | | 03/31/14 | | | 18,007 | |
| | | | | | | TOTAL TREASURY DEBT | | | | | | | | 919,154 | |
| | | | | | | | | | | | | | | | |
| INVESTMENT OF CASH COLLATERAL FOR SECURITIES LOANED - 2.7% | | | | | |
| GOVERNMENT AGENCY DEBT - 0.6% | | | | | | |
| | 45,000,000 | | | | | Federal Home Loan Bank (FHLB) | | 0.035-0.050 | | | 01/24/14 | | | 44,999 | |
| | 12,000,000 | | | | | FHLB | | 0.060 | | | 03/21/14 | | | 11,999 | |
| | 10,000,000 | | | | | FHLB | | 0.100 | | | 03/26/14 | | | 9,999 | |
| | 8,696,000 | | | | | Federal Home Loan Mortgage Corp (FHLMC) | | 0.030 | | | 01/21/14 | | | 8,696 | |
| | | | | | | TOTAL GOVERNMENT AGENCY DEBT | | | | | | | | 75,693 | |
| | | | | | | | | | | | | | | | |
| TREASURY DEBT - 2.1% | | | | | | | | | |
| | 5,000,000 | | | | | United States Treasury Bill | | 0.071 | | | 01/30/14 | | | 5,000 | |
| | 10,000,000 | | | | | United States Treasury Bill | | 0.071 | | | 02/20/14 | | | 9,999 | |
| | 10,000,000 | | | | | United States Treasury Bill | | 0.075 | | | 02/27/14 | | | 9,999 | |
| | 1,200,000 | | | | | United States Treasury Bill | | 0.073 | | | 03/06/14 | | | 1,200 | |
| | 20,000,000 | | | | | United States Treasury Bill | | 0.065 | | | 03/13/14 | | | 19,998 | |
| | 15,000,000 | | | | | United States Treasury Bill | | 0.060 | | | 03/20/14 | | | 14,998 | |
| | 10,000,000 | | | | | United States Treasury Bill | | 0.070 | | | 04/03/14 | | | 9,998 | |
| | 26,000,000 | | | | | United States Treasury Bill | | 0.070-0.086 | | | 04/17/14 | | | 25,997 | |
| | 29,000,000 | | | | | United States Treasury Bill | | 0.071-0.085 | | | 04/24/14 | | | 28,994 | |
| | 20,000,000 | | | | | United States Treasury Bill | | 0.088 | | | 06/26/14 | | | 19,992 | |
| | 23,000,000 | | | | | United States Treasury Bill | | 0.091-0.110 | | | 07/24/14 | | | 22,990 | |
| | 54,000,000 | | | | | United States Treasury Bill | | 0.075-0.138 | | | 08/21/14 | | | 53,976 | |
| | 30,000,000 | | | | | United States Treasury Note | | 0.250 | | | 03/31/14 | | | 30,012 | |
| | 32,000,000 | | | | | United States Treasury Note | | 0.250 | | | 06/30/14 | | | 32,025 | |
| | | | | | | TOTAL TREASURY DEBT | | | | | | | | 285,178 | |
COLLEGE RETIREMENT EQUITIES FUND - Social Choice Account
| | | | | | | | | | | VALUE
(000) | |
| | | | | | | TOTAL INVESTMENT OF CASH COLLATERAL FOR SECURITIES LOANED | | $ | 360,871 | |
| | | | | | | | | | | | | | | | |
| | | | | | | TOTAL SHORT-TERM INVESTMENTS | | | | | | | | 1,357,559 | |
| | | | | | | (Cost $1,357,440) | | | | | | | | | |
| | | | | | | | | | | | | | | | |
| | | | | | | TOTAL INVESTMENTS - 108.4% | | | | | | | | 14,467,659 | |
| | | | | | | (Cost $11,626,471) | | | | | | | | | |
| | | | | | | OTHER ASSETS & LIABILITIES, NET - (8.4)% | | | | | | (1,126,699 | ) |
| | | | | | | NET ASSETS - 100.0% | | | | | | | $ | 13,340,960 | |
| | | | |
| | | Abbreviation(s): |
| REIT | | Real Estate Investment Trust |
| | | |
| * | | Non-income producing. |
| ^ | | Amount represents less than $1,000. |
| e | | All or a portion of these securities are out on loan. The aggregate value of securities on loan is $356,841,000. |
| g | | Security is exempt from registration under Rule 144(A) of the Securities Act of 1933 and may be resold in transactions exempt from registration to qualified institutional buyers. At December 31, 2013, the aggregate value of these securities amounted to $432,691,000, or 3.2% of net assets. |
| h | | All or a portion of these securities were purchased on a delayed delivery basis. |
| i | | Floating or variable rate security. Coupon rate reflects the rate at period end. |
| j | | Zero coupon |
| m | | Indicates a security that has been deemed illiquid. |
| w | | All or a portion of these securities have been segregated by the custodian to cover collateral requirements on mortgage dollar rolls. |
| | | |
| | | Cost amounts are in thousands. |
COLLEGE RETIREMENT EQUITIES FUND - Money Market Account
COLLEGE RETIREMENT EQUITIES FUND
MONEY MARKET ACCOUNT
SCHEDULE OF INVESTMENTS
December 31, 2013
| PRINCIPAL | | | | | ISSUER | | RATE | | MATURITY
DATE | | VALUE
(000) | |
| SHORT-TERM INVESTMENTS - 100.0% | | | | | | | | |
| | | | | | | | | | | | | | |
| CERTIFICATE OF DEPOSIT - 6.0% | | | | | | | | |
| $ | 50,000,000 | | | | | Australia & New Zealand Banking Group Ltd | | 0.180 | % | | 01/28/14 | | $ | 50,000 | |
| | 50,000,000 | | | | | Banco Del Estado De Chile | | 0.210 | | | 02/11/14 | | | 50,000 | |
| | 25,000,000 | | | | | Banco Del Estado De Chile | | 0.215 | | | 02/19/14 | | | 25,000 | |
| | 35,000,000 | | | | | Banco Del Estado De Chile | | 0.210 | | | 02/20/14 | | | 35,000 | |
| | 40,000,000 | | | | | Banco Del Estado De Chile | | 0.200 | | | 03/07/14 | | | 40,000 | |
| | 50,000,000 | | | | | Bank of Montreal | | 0.200 | | | 01/09/14 | | | 50,000 | |
| | 50,000,000 | | | | | Bank of Montreal | | 0.100 | | | 02/28/14 | | | 50,000 | |
| | 30,000,000 | | | | | Bank of Nova Scotia | | 0.170 | | | 04/01/14 | | | 30,000 | |
| | 50,000,000 | | | | | Bank of Nova Scotia | | 0.190 | | | 04/04/14 | | | 50,000 | |
| | 70,000,000 | | | | | Toronto-Dominion Bank | | 0.150 | | | 01/06/14 | | | 70,000 | |
| | 25,000,000 | | | | | Toronto-Dominion Bank | | 0.135 | | | 01/30/14 | | | 25,000 | |
| | 45,000,000 | | | | | Toronto-Dominion Bank | | 0.150 | | | 03/06/14 | | | 45,000 | |
| | 25,000,000 | | | | | Toronto-Dominion Bank | | 0.170 | | | 03/11/14 | | | 25,000 | |
| | 50,000,000 | | | | | Wells Fargo Bank NA | | 0.130 | | | 02/06/14 | | | 50,000 | |
| | 50,000,000 | | | | | Wells Fargo Bank NA | | 0.130 | | | 02/10/14 | | | 50,000 | |
| | 75,000,000 | | | | | Wells Fargo Bank NA | | 0.160 | | | 03/03/14 | | | 75,000 | |
| | | | | | | TOTAL CERTIFICATE OF DEPOSIT | | | | | | | | 720,000 | |
| | | | | | | | | | | | | | | | |
| COMMERCIAL PAPER - 35.2% | | | | | | | | | |
| | 4,175,000 | | | | | American Honda Finance Corp | | 0.100 | | | 01/06/14 | | | 4,175 | |
| | 27,000,000 | | | | | American Honda Finance Corp | | 0.090 | | | 01/10/14 | | | 26,999 | |
| | 35,000,000 | | | | | American Honda Finance Corp | | 0.110 | | | 01/23/14 | | | 34,998 | |
| | 8,550,000 | | | | | American Honda Finance Corp | | 0.100 | | | 02/19/14 | | | 8,549 | |
| | 10,000,000 | | | | | American Honda Finance Corp | | 0.100 | | | 02/25/14 | | | 9,998 | |
| | 50,000,000 | | | | | American Honda Finance Corp | | 0.130 | | | 03/05/14 | | | 49,989 | |
| | 43,750,000 | | | | | American Honda Finance Corp | | 0.115 | | | 03/10/14 | | | 43,740 | |
| | 21,000,000 | | | | | American Honda Finance Corp | | 0.120 | | | 03/17/14 | | | 20,995 | |
| | 11,540,000 | | | y | | Australia & New Zealand Banking Group Ltd | | 0.175 | | | 03/04/14 | | | 11,537 | |
| | 44,600,000 | | | y | | Australia & New Zealand Banking Group Ltd | | 0.180 | | | 03/19/14 | | | 44,583 | |
| | 75,000,000 | | | y | | Australia & New Zealand Banking Group Ltd | | 0.170-0.175 | | | 03/25/14 | | | 74,970 | |
| | 20,000,000 | | | | | Bank of Nova Scotia | | 0.175 | | | 01/02/14 | | | 20,000 | |
| | 25,000,000 | | | | | Bank of Nova Scotia | | 0.170 | | | 01/03/14 | | | 25,000 | |
| | 20,000,000 | | | | | Bank of Nova Scotia | | 0.175 | | | 01/08/14 | | | 19,999 | |
| | 9,000,000 | | | | | Bank of Nova Scotia | | 0.175 | | | 01/14/14 | | | 8,999 | |
| | 25,000,000 | | | | | Bank of Nova Scotia | | 0.175 | | | 04/02/14 | | | 24,989 | |
| | 15,000,000 | | | | | Bank of Tokyo-Mitsubishi UFJ Ltd | | 0.100 | | | 01/07/14 | | | 15,000 | |
| | 14,390,000 | | | | | Bank of Tokyo-Mitsubishi UFJ Ltd | | 0.170 | | | 01/09/14 | | | 14,389 | |
| | 20,000,000 | | | | | Bank of Tokyo-Mitsubishi UFJ Ltd | | 0.170 | | | 01/10/14 | | | 19,999 | |
| | 23,725,000 | | | | | Bank of Tokyo-Mitsubishi UFJ Ltd | | 0.170-0.180 | | | 01/17/14 | | | 23,723 | |
| | 11,130,000 | | | | | Bank of Tokyo-Mitsubishi UFJ Ltd | | 0.170 | | | 02/04/14 | | | 11,128 | |
| | 25,000,000 | | | y | | Bedford Row Funding Corp | | 0.220 | | | 02/03/14 | | | 24,995 | |
| | 5,067,000 | | | y | | Coca-Cola Co | | 0.190 | | | 01/06/14 | | | 5,067 | |
| | 25,800,000 | | | y | | Coca-Cola Co | | 0.060-0.100 | | | 01/07/14 | | | 25,800 | |
COLLEGE RETIREMENT EQUITIES FUND - Money Market Account
| PRINCIPAL | | | | | ISSUER | | RATE | | MATURITY
DATE | | VALUE
(000) | |
| $ | 37,987,000 | | | y | | Coca-Cola Co | | 0.170 | % | | 01/14/14 | | $ | 37,985 | |
| | 10,000,000 | | | y | | Coca-Cola Co | | 0.160 | | | 01/22/14 | | | 9,999 | |
| | 25,000,000 | | | y | | Coca-Cola Co | | 0.130 | | | 01/23/14 | | | 24,998 | |
| | 19,000,000 | | | y | | Coca-Cola Co | | 0.125 | | | 02/11/14 | | | 18,997 | |
| | 35,000,000 | | | y | | Coca-Cola Co | | 0.190 | | | 02/27/14 | | | 34,989 | |
| | 6,980,000 | | | y | | Coca-Cola Co | | 0.100 | | | 03/11/14 | | | 6,979 | |
| | 22,500,000 | | | y | | Coca-Cola Co | | 0.110 | | | 03/20/14 | | | 22,495 | |
| | 3,000,000 | | | y | | Coca-Cola Co | | 0.135 | | | 04/08/14 | | | 2,999 | |
| | 25,000,000 | | | y | | Coca-Cola Co | | 0.125 | | | 04/10/14 | | | 24,991 | |
| | 40,365,000 | | | y | | Commonwealth Bank of Australia | | 0.155-0.160 | | | 01/02/14 | | | 40,365 | |
| | 37,500,000 | | | y | | Commonwealth Bank of Australia | | 0.150-0.175 | | | 01/06/14 | | | 37,499 | |
| | 12,000,000 | | | y | | Commonwealth Bank of Australia | | 0.180 | | | 01/13/14 | | | 11,999 | |
| | 10,000,000 | | | y | | Commonwealth Bank of Australia | | 0.160 | | | 02/10/14 | | | 9,998 | |
| | 25,000,000 | | | y | | Commonwealth Bank of Australia | | 0.155 | | | 02/21/14 | | | 24,995 | |
| | 15,000,000 | | | y | | Commonwealth Bank of Australia | | 0.215 | | | 02/28/14 | | | 14,995 | |
| | 1,500,000 | | | y | | DBS Bank Ltd | | 0.150 | | | 01/06/14 | | | 1,500 | |
| | 30,000,000 | | | y | | DBS Bank Ltd | | 0.165 | | | 01/07/14 | | | 29,999 | |
| | 50,000,000 | | | y | | DBS Bank Ltd | | 0.170 | | | 02/27/14 | | | 49,987 | |
| | 12,935,000 | | | y | | DBS Bank Ltd | | 0.250 | | | 04/01/14 | | | 12,927 | |
| | 3,000,000 | | | | | Exxon Mobil Corp | | 0.080 | | | 01/17/14 | | | 3,000 | |
| | 30,000,000 | | | | | Exxon Mobil Corp | | 0.085 | | | 01/21/14 | | | 29,999 | |
| | 30,000,000 | | | | | Exxon Mobil Corp | | 0.090 | | | 01/28/14 | | | 29,998 | |
| | 27,050,000 | | | | | Exxon Mobil Corp | | 0.070 | | | 02/06/14 | | | 27,048 | |
| | 20,000,000 | | | | | Exxon Mobil Corp | | 0.075 | | | 02/13/14 | | | 19,998 | |
| | 20,000,000 | | | | | Exxon Mobil Corp | | 0.085 | | | 02/25/14 | | | 19,997 | |
| | 20,000,000 | | | y | | Fairway Finance LLC | | 0.150 | | | 01/09/14 | | | 19,999 | |
| | 25,020,000 | | | y | | Fairway Finance LLC | | 0.190 | | | 01/13/14 | | | 25,018 | |
| | 30,000,000 | | | y | | Fairway Finance LLC | | 0.180 | | | 01/27/14 | | | 29,996 | |
| | 10,000,000 | | | y | | Fairway Finance LLC | | 0.155 | | | 01/28/14 | | | 9,999 | |
| | 10,000,000 | | | y | | Fairway Finance LLC | | 0.190 | | | 01/30/14 | | | 9,999 | |
| | 24,346,000 | | | y | | Fairway Finance LLC | | 0.150-0.175 | | | 02/10/14 | | | 24,341 | |
| | 30,337,000 | | | y | | Fairway Finance LLC | | 0.140-0.200 | | | 02/11/14 | | | 30,332 | |
| | 43,498,000 | | | y | | Fairway Finance LLC | | 0.170-0.175 | | | 02/13/14 | | | 43,489 | |
| | 3,691,000 | | | y | | Fairway Finance LLC | | 0.180 | | | 02/19/14 | | | 3,690 | |
| | 20,000,000 | | | y | | Fairway Finance LLC | | 0.170 | | | 03/04/14 | | | 19,994 | |
| | 30,000,000 | | | | | General Electric Capital Corp | | 0.100 | | | 01/07/14 | | | 30,000 | |
| | 30,000,000 | | | | | General Electric Capital Corp | | 0.130 | | | 01/22/14 | | | 29,998 | |
| | 50,000,000 | | | | | General Electric Capital Corp | | 0.130 | | | 01/24/14 | | | 49,996 | |
| | 30,000,000 | | | | | General Electric Capital Corp | | 0.130 | | | 01/27/14 | | | 29,997 | |
| | 9,825,000 | | | | | General Electric Capital Corp | | 0.180 | | | 02/04/14 | | | 9,823 | |
| | 30,000,000 | | | | | General Electric Capital Corp | | 0.170 | | | 02/18/14 | | | 29,993 | |
| | 20,000,000 | | | | | General Electric Capital Corp | | 0.170 | | | 02/25/14 | | | 19,995 | |
| | 20,000,000 | | | | | General Electric Capital Corp | | 0.140 | | | 03/04/14 | | | 19,995 | |
| | 50,000,000 | | | | | General Electric Capital Corp | | 0.120 | | | 03/13/14 | | | 49,988 | |
| | 30,000,000 | | | | | General Electric Capital Corp | | 0.120 | | | 03/24/14 | | | 29,992 | |
| | 45,000,000 | | | y | | International Business Machines Corp | | 0.150 | | | 01/07/14 | | | 44,999 | |
| | 7,500,000 | | | | | International Business Machines Corp | | 1.250 | | | 05/12/14 | | | 7,528 | |
| | 59,880,000 | | | y | | Liberty Street Funding LLC | | 0.175-0.185 | | | 02/18/14 | | | 59,866 | |
| | 47,960,000 | | | y | | Liberty Street Funding LLC | | 0.175 | | | 02/24/14 | | | 47,947 | |
| | 30,000,000 | | | y | | Mitsubishi UFJ Trust & Banking Corp | | 0.170 | | | 02/11/14 | | | 29,994 | |
COLLEGE RETIREMENT EQUITIES FUND - Money Market Account
| PRINCIPAL | | | | | ISSUER | | RATE | | MATURITY
DATE | | VALUE
(000) | |
| $ | 25,000,000 | | | y | | Mitsubishi UFJ Trust & Banking Corp | | 0.180 | % | | 02/25/14 | | $ | 24,993 | |
| | 11,500,000 | | | y | | National Australia Funding Delaware, Inc | | 0.120 | | | 01/02/14 | | | 11,500 | |
| | 5,000,000 | | | y | | National Australia Funding Delaware, Inc | | 0.120 | | | 02/10/14 | | | 4,999 | |
| | 20,000,000 | | | y | | National Australia Funding Delaware, Inc | | 0.120 | | | 02/18/14 | | | 19,997 | |
| | 20,000,000 | | | y | | National Australia Funding Delaware, Inc | | 0.130 | | | 03/04/14 | | | 19,996 | |
| | 30,000,000 | | | y | | National Australia Funding Delaware, Inc | | 0.140 | | | 03/24/14 | | | 29,990 | |
| | 20,000,000 | | | y | | National Australia Funding Delaware, Inc | | 0.140 | | | 04/02/14 | | | 19,993 | |
| | 43,000,000 | | | y | | Nestle Capital Corp | | 0.095 | | | 02/11/14 | | | 42,995 | |
| | 39,300,000 | | | y | | Nestle Capital Corp | | 0.090-0.100 | | | 02/12/14 | | | 39,296 | |
| | 95,000,000 | | | y | | Nestle Capital Corp | | 0.100-0.105 | | | 02/13/14 | | | 94,988 | |
| | 20,000,000 | | | y | | Nestle Capital Corp | | 0.110 | | | 02/26/14 | | | 19,997 | |
| | 20,000,000 | | | y | | Nestle Capital Corp | | 0.100 | | | 03/06/14 | | | 19,996 | |
| | 43,300,000 | | | y | | Old Line Funding LLC | | 0.180 | | | 02/05/14 | | | 43,293 | |
| | 59,004,000 | | | y | | Old Line Funding LLC | | 0.180 | | | 02/07/14 | | | 58,993 | |
| | 20,000,000 | | | y | | Old Line Funding LLC | | 0.240 | | | 02/12/14 | | | 19,994 | |
| | 37,700,000 | | | y | | Old Line Funding LLC | | 0.180 | | | 02/25/14 | | | 37,690 | |
| | 36,690,000 | | | | | PACCAR Financial Corp | | 0.115 | | | 01/30/14 | | | 36,687 | |
| | 13,700,000 | | | | | PACCAR Financial Corp | | 0.110 | | | 02/06/14 | | | 13,698 | |
| | 22,200,000 | | | y | | Private Export Funding Corp | | 0.130-0.140 | | | 01/08/14 | | | 22,199 | |
| | 25,000,000 | | | y | | Private Export Funding Corp | | 0.120 | | | 01/16/14 | | | 24,999 | |
| | 23,000,000 | | | y | | Private Export Funding Corp | | 0.160 | | | 01/17/14 | | | 22,998 | |
| | 29,015,000 | | | y | | Private Export Funding Corp | | 0.250 | | | 04/07/14 | | | 28,996 | |
| | 25,000,000 | | | y | | Procter & Gamble Co | | 0.100 | | | 01/08/14 | | | 25,000 | |
| | 25,000,000 | | | y | | Procter & Gamble Co | | 0.100 | | | 01/13/14 | | | 24,999 | |
| | 10,100,000 | | | y | | Procter & Gamble Co | | 0.100 | | | 02/13/14 | | | 10,099 | |
| | 20,000,000 | | | y | | Procter & Gamble Co | | 0.100 | | | 02/20/14 | | | 19,997 | |
| | 63,000,000 | | | y | | Procter & Gamble Co | | 0.090-0.095 | | | 03/04/14 | | | 62,990 | |
| | 65,000,000 | | | y | | Procter & Gamble Co | | 0.100 | | | 03/18/14 | | | 64,986 | |
| | 15,000,000 | | | y | | Procter & Gamble Co | | 0.100 | | | 03/19/14 | | | 14,997 | |
| | 15,000,000 | | | | | Province of British Columbia | | 0.100 | | | 01/07/14 | | | 15,000 | |
| | 37,102,000 | | | | | Province of Ontario Canada | | 0.060-0.080 | | | 01/06/14 | | | 37,102 | |
| | 15,000,000 | | | | | Province of Ontario Canada | | 0.085 | | | 01/16/14 | | | 14,999 | |
| | 15,000,000 | | | | | Province of Ontario Canada | | 0.090 | | | 01/22/14 | | | 14,999 | |
| | 20,000,000 | | | | | Province of Ontario Canada | | 0.080 | | | 02/03/14 | | | 19,999 | |
| | 41,280,000 | | | | | Province of Ontario Canada | | 0.090 | | | 02/20/14 | | | 41,275 | |
| | 20,000,000 | | | | | Province of Ontario Canada | | 0.100 | | | 02/21/14 | | | 19,997 | |
| | 32,242,000 | | | | | Province of Ontario Canada | | 0.100 | | | 03/11/14 | | | 32,236 | |
| | 35,000,000 | | | | | Province of Ontario Canada | | 0.100 | | | 03/13/14 | | | 34,993 | |
| | 6,700,000 | | | y | | Province of Quebec Canada | | 0.070-0.100 | | | 01/03/14 | | | 6,700 | |
| | 50,000,000 | | | y | | Province of Quebec Canada | | 0.080 | | | 01/08/14 | | | 49,999 | |
| | 17,300,000 | | | y | | Province of Quebec Canada | | 0.070-0.085 | | | 01/14/14 | | | 17,299 | |
| | 12,500,000 | | | y | | Province of Quebec Canada | | 0.080 | | | 01/15/14 | | | 12,500 | |
| | 45,620,000 | | | y | | Province of Quebec Canada | | 0.080-0.090 | | | 01/21/14 | | | 45,618 | |
| | 38,800,000 | | | y | | Province of Quebec Canada | | 0.100 | | | 01/24/14 | | | 38,797 | |
| | 45,306,000 | | | y | | Province of Quebec Canada | | 0.085-0.090 | | | 01/30/14 | | | 45,303 | |
| | 16,200,000 | | | y | | Province of Quebec Canada | | 0.100-0.105 | | | 02/10/14 | | | 16,198 | |
| | 50,000,000 | | | y | | Province of Quebec Canada | | 0.085 | | | 03/03/14 | | | 49,993 | |
| | 76,000,000 | | | y | | PSP Capital, Inc | | 0.110-0.125 | | | 01/14/14 | | | 75,997 | |
| | 25,000,000 | | | y | | PSP Capital, Inc | | 0.120 | | | 01/16/14 | | | 24,998 | |
| | 31,700,000 | | | y | | PSP Capital, Inc | | 0.130-0.140 | | | 01/29/14 | | | 31,697 | |
COLLEGE RETIREMENT EQUITIES FUND - Money Market Account
| PRINCIPAL | | | | | ISSUER | | RATE | | MATURITY
DATE | | VALUE
(000) | |
| $ | 20,000,000 | | | y | | PSP Capital, Inc | | 0.130 | % | | 02/11/14 | | $ | 19,997 | |
| | 31,000,000 | | | y | | PSP Capital, Inc | | 0.150 | | | 03/11/14 | | | 30,991 | |
| | 10,000,000 | | | y | | PSP Capital, Inc | | 0.150 | | | 03/18/14 | | | 9,997 | |
| | 10,000,000 | | | y | | PSP Capital, Inc | | 0.150 | | | 03/20/14 | | | 9,997 | |
| | 4,350,000 | | | y | | PSP Capital, Inc | | 0.270 | | | 07/28/14 | | | 4,343 | |
| | 50,000,000 | | | y | | Shell International Finance BV | | 0.100 | | | 02/19/14 | | | 49,993 | |
| | 25,000,000 | | | y | | Shell International Finance BV | | 0.090 | | | 02/20/14 | | | 24,997 | |
| | 67,700,000 | | | | | Shell International Finance BV | | 4.000 | | | 03/21/14 | | | 68,254 | |
| | 30,000,000 | | | y | | Standard Chartered Bank | | 0.170 | | | 01/29/14 | | | 29,996 | |
| | 33,875,000 | | | y | | Standard Chartered Bank | | 0.150 | | | 02/14/14 | | | 33,869 | |
| | 22,000,000 | | | y | | Standard Chartered Bank | | 0.230 | | | 02/25/14 | | | 21,992 | |
| | 6,500,000 | | | y | | Standard Chartered Bank | | 0.230 | | | 02/27/14 | | | 6,498 | |
| | 27,875,000 | | | y | | Standard Chartered Bank | | 0.173 | | | 03/10/14 | | | 27,866 | |
| | 30,000,000 | | | y | | Standard Chartered Bank | | 0.260 | | | 04/01/14 | | | 29,980 | |
| | 1,675,000 | | | y | | Thunder Bay Funding LLC | | 0.200 | | | 01/06/14 | | | 1,675 | |
| | 13,000,000 | | | y | | Thunder Bay Funding LLC | | 0.160 | | | 01/16/14 | | | 12,999 | |
| | 10,035,000 | | | y | | Thunder Bay Funding LLC | | 0.150-0.190 | | | 02/03/14 | | | 10,033 | |
| | 20,000,000 | | | y | | Toronto-Dominion Holdings USA, Inc | | 0.170 | | | 02/06/14 | | | 19,997 | |
| | 10,000,000 | | | y | | Toronto-Dominion Holdings USA, Inc | | 0.150 | | | 02/10/14 | | | 9,998 | |
| | 40,000,000 | | | | | Toyota Motor Credit Corp | | 0.140 | | | 03/05/14 | | | 39,990 | |
| | 50,000,000 | | | | | Toyota Motor Credit Corp | | 0.160 | | | 03/06/14 | | | 49,986 | |
| | 30,000,000 | | | | | Toyota Motor Credit Corp | | 0.160 | | | 03/07/14 | | | 29,991 | |
| | 50,000,000 | | | | | Toyota Motor Credit Corp | | 0.180 | | | 04/10/14 | | | 49,975 | |
| | 25,000,000 | | | | | Toyota Motor Credit Corp | | 0.170 | | | 04/17/14 | | | 24,988 | |
| | 20,000,000 | | | y | | United Overseas Bank Ltd | | 0.170 | | | 01/07/14 | | | 20,000 | |
| | 20,000,000 | | | y | | United Overseas Bank Ltd | | 0.160 | | | 01/14/14 | | | 19,999 | |
| | 32,300,000 | | | y | | United Overseas Bank Ltd | | 0.180 | | | 01/28/14 | | | 32,296 | |
| | 50,000,000 | | | y | | United Overseas Bank Ltd | | 0.210 | | | 02/21/14 | | | 49,985 | |
| | 20,000,000 | | | y | | United Overseas Bank Ltd | | 0.175 | | | 03/10/14 | | | 19,993 | |
| | 10,000,000 | | | y | | United Overseas Bank Ltd | | 0.185 | | | 03/14/14 | | | 9,996 | |
| | 40,000,000 | | | y | | United Overseas Bank Ltd | | 0.225 | | | 03/21/14 | | | 39,980 | |
| | 18,970,000 | | | y | | United Overseas Bank Ltd | | 0.210 | | | 04/14/14 | | | 18,959 | |
| | 2,000,000 | | | | | US Bank NA | | 0.200 | | | 02/12/14 | | | 2,000 | |
| | 20,000,000 | | | y | | Wal-Mart Stores, Inc | | 0.200 | | | 01/21/14 | | | 19,998 | |
| | 17,570,000 | | | y | | Wal-Mart Stores, Inc | | 0.125 | | | 01/28/14 | | | 17,568 | |
| | | | | | | TOTAL COMMERCIAL PAPER | | | | | | | | 4,221,555 | |
| | | | | | | | | | | | | | | | |
| GOVERNMENT AGENCY DEBT - 32.6% | | | | | | | | | |
| | 44,970,000 | | | | | Federal Home Loan Bank (FHLB) | | 0.040-0.130 | | | 01/02/14 | | | 44,970 | |
| | 61,660,000 | | | | | FHLB | | 0.035-0.050 | | | 01/03/14 | | | 61,660 | |
| | 5,000,000 | | | | | FHLB | | 0.040 | | | 01/07/14 | | | 5,000 | |
| | 80,610,000 | | | | | FHLB | | 0.035-0.065 | | | 01/08/14 | | | 80,609 | |
| | 15,320,000 | | | | | FHLB | | 0.050-0.145 | | | 01/09/14 | | | 15,320 | |
| | 144,200,000 | | | | | FHLB | | 0.035-0.130 | | | 01/10/14 | | | 144,197 | |
| | 73,070,000 | | | | | FHLB | | 0.040-0.140 | | | 01/13/14 | | | 73,069 | |
| | 7,000,000 | | | | | FHLB | | 0.045 | | | 01/14/14 | | | 7,000 | |
| | 73,210,000 | | | | | FHLB | | 0.040-0.050 | | | 01/15/14 | | | 73,209 | |
| | 38,500,000 | | | | | FHLB | | 0.047 | | | 01/16/14 | | | 38,499 | |
| | 161,400,000 | | | | | FHLB | | 0.020-0.175 | | | 01/17/14 | | | 161,393 | |
| | 112,185,000 | | | | | FHLB | | 0.040-0.100 | | | 01/22/14 | | | 112,182 | |
COLLEGE RETIREMENT EQUITIES FUND - Money Market Account
| PRINCIPAL | | | | | ISSUER | | RATE | | MATURITY
DATE | | VALUE
(000) | |
| $ | 105,000,000 | | | | | FHLB | | 0.050-0.070 | % | | 01/24/14 | | $ | 104,996 | |
| | 7,000,000 | | | | | FHLB | | 0.065 | | | 01/27/14 | | | 7,000 | |
| | 8,000,000 | | | | | FHLB | | 0.070 | | | 01/28/14 | | | 8,000 | |
| | 81,002,000 | | | | | FHLB | | 0.057-0.060 | | | 01/29/14 | | | 80,998 | |
| | 64,549,000 | | | | | FHLB | | 0.050-0.070 | | | 01/31/14 | | | 64,546 | |
| | 13,800,000 | | | | | FHLB | | 0.065-0.077 | | | 02/03/14 | | | 13,799 | |
| | 126,200,000 | | | | | FHLB | | 0.063-0.083 | | | 02/05/14 | | | 126,191 | |
| | 117,620,000 | | | | | FHLB | | 0.055-0.085 | | | 02/07/14 | | | 117,611 | |
| | 91,320,000 | | | | | FHLB | | 0.080-0.085 | | | 02/12/14 | | | 91,311 | |
| | 86,901,000 | | | | | FHLB | | 0.055-0.083 | | | 02/14/14 | | | 86,893 | |
| | 31,000,000 | | | | | FHLB | | 0.060-0.085 | | | 02/18/14 | | | 30,997 | |
| | 116,335,000 | | | | | FHLB | | 0.083-0.090 | | | 02/19/14 | | | 116,321 | |
| | 86,450,000 | | | | | FHLB | | 0.065-0.110 | | | 02/21/14 | | | 86,441 | |
| | 87,950,000 | | | | | FHLB | | 0.060-0.090 | | | 02/26/14 | | | 87,940 | |
| | 92,400,000 | | | | | FHLB | | 0.065-0.090 | | | 02/28/14 | | | 92,389 | |
| | 16,300,000 | | | | | FHLB | | 0.085 | | | 03/03/14 | | | 16,298 | |
| | 50,000,000 | | | | | FHLB | | 0.090 | | | 03/05/14 | | | 49,992 | |
| | 30,000,000 | | | | | FHLB | | 0.092 | | | 03/06/14 | | | 29,995 | |
| | 113,000,000 | | | | | FHLB | | 0.090-0.100 | | | 03/07/14 | | | 112,981 | |
| | 147,600,000 | | | | | FHLB | | 0.085-0.100 | | | 03/12/14 | | | 147,573 | |
| | 109,900,000 | | | | | FHLB | | 0.090-0.095 | | | 03/14/14 | | | 109,880 | |
| | 39,400,000 | | | | | FHLB | | 0.095 | | | 03/17/14 | | | 39,392 | |
| | 26,500,000 | | | | | FHLB | | 0.100-0.105 | | | 03/21/14 | | | 26,494 | |
| | 78,000,000 | | | | | FHLB | | 0.085-0.100 | | | 03/26/14 | | | 77,984 | |
| | 56,750,000 | | | | | FHLB | | 0.095-0.100 | | | 03/28/14 | | | 56,736 | |
| | 16,000,000 | | | | | FHLB | | 0.060 | | | 04/02/14 | | | 15,997 | |
| | 5,000,000 | | | | | FHLB | | 0.110 | | | 04/04/14 | | | 4,999 | |
| | 4,100,000 | | | | | FHLB | | 0.105 | | | 05/01/14 | | | 4,098 | |
| | 28,241,000 | | | | | Federal Home Loan Mortgage Corp (FHLMC) | | 0.030-0.150 | | | 01/06/14 | | | 28,241 | |
| | 39,918,000 | | | | | FHLMC | | 0.050-0.108 | | | 01/13/14 | | | 39,917 | |
| | 30,500,000 | | | | | FHLMC | | 0.040-0.125 | | | 01/14/14 | | | 30,499 | |
| | 6,800,000 | | | | | FHLMC | | 0.030 | | | 01/15/14 | | | 6,800 | |
| | 57,150,000 | | | | | FHLMC | | 0.040-0.060 | | | 01/21/14 | | | 57,148 | |
| | 11,400,000 | | | | | FHLMC | | 0.030-0.100 | | | 01/22/14 | | | 11,400 | |
| | 38,785,000 | | | | | FHLMC | | 0.075-0.130 | | | 01/23/14 | | | 38,783 | |
| | 65,900,000 | | | | | FHLMC | | 0.050-0.140 | | | 01/27/14 | | | 65,896 | |
| | 95,500,000 | | | | | FHLMC | | 0.060-0.125 | | | 02/03/14 | | | 95,492 | |
| | 57,540,000 | | | | | FHLMC | | 0.050-0.135 | | | 02/04/14 | | | 57,536 | |
| | 6,229,000 | | | | | FHLMC | | 0.080 | | | 02/10/14 | | | 6,228 | |
| | 8,865,000 | | | | | FHLMC | | 0.125 | | | 02/11/14 | | | 8,864 | |
| | 73,160,000 | | | | | FHLMC | | 0.065-0.067 | | | 02/14/14 | | | 73,154 | |
| | 15,000,000 | | | | | FHLMC | | 0.088 | | | 02/18/14 | | | 14,998 | |
| | 2,850,000 | | | | | FHLMC | | 0.070 | | | 02/19/14 | | | 2,850 | |
| | 113,775,000 | | | | | FHLMC | | 0.050-0.140 | | | 02/24/14 | | | 113,760 | |
| | 30,000,000 | | | | | FHLMC | | 0.090 | | | 03/03/14 | | | 29,995 | |
| | 7,700,000 | | | | | FHLMC | | 0.060 | | | 03/10/14 | | | 7,699 | |
| | 48,320,000 | | | | | FHLMC | | 0.082-0.090 | | | 03/11/14 | | | 48,312 | |
| | 32,000,000 | | | | | FHLMC | | 0.090-0.092 | | | 03/12/14 | | | 31,994 | |
| | 19,700,000 | | | | | FHLMC | | 0.095 | | | 03/13/14 | | | 19,696 | |
| | 87,732,000 | | | | | FHLMC | | 0.088-0.090 | | | 03/17/14 | | | 87,716 | |
COLLEGE RETIREMENT EQUITIES FUND - Money Market Account
| PRINCIPAL | | | | | ISSUER | | RATE | | MATURITY
DATE | | VALUE
(000) | |
| $ | 5,000,000 | | | | | FHLMC | | 0.100 | % | | 03/25/14 | | $ | 4,999 | |
| | 5,000,000 | | | | | FHLMC | | 0.105 | | | 04/14/14 | | | 4,999 | |
| | 10,125,000 | | | | | Federal National Mortgage Association (FNMA) | | 0.050-0.055 | | | 01/02/14 | | | 10,125 | |
| | 13,540,000 | | | | | FNMA | | 0.125 | | | 01/09/14 | | | 13,540 | |
| | 9,625,000 | | | | | FNMA | | 0.110-0.140 | | | 01/21/14 | | | 9,624 | |
| | 4,525,000 | | | | | FNMA | | 0.055 | | | 01/22/14 | | | 4,525 | |
| | 30,191,000 | | | | | FNMA | | 0.060-0.120 | | | 01/27/14 | | | 30,190 | |
| | 18,100,000 | | | | | FNMA | | 0.070-0.150 | | | 01/29/14 | | | 18,099 | |
| | 27,102,000 | | | | | FNMA | | 0.070-0.075 | | | 02/03/14 | | | 27,100 | |
| | 25,394,000 | | | | | FNMA | | 0.060-0.065 | | | 02/05/14 | | | 25,392 | |
| | 40,060,000 | | | | | FNMA | | 0.070-0.105 | | | 02/12/14 | | | 40,056 | |
| | 35,600,000 | | | | | FNMA | | 0.085 | | | 02/18/14 | | | 35,596 | |
| | 32,300,000 | | | | | FNMA | | 0.076 | | | 02/19/14 | | | 32,297 | |
| | 18,951,000 | | | | | FNMA | | 0.050-0.135 | | | 02/24/14 | | | 18,949 | |
| | 8,700,000 | | | | | FNMA | | 0.065 | | | 02/25/14 | | | 8,699 | |
| | 59,895,000 | | | | | FNMA | | 0.070-0.090 | | | 02/26/14 | | | 59,887 | |
| | 45,665,000 | | | | | FNMA | | 0.075-0.085 | | | 03/05/14 | | | 45,659 | |
| | 8,000,000 | | | | | FNMA | | 0.105 | | | 05/01/14 | | | 7,997 | |
| | | | | | | TOTAL GOVERNMENT AGENCY DEBT | | | | | | | | 3,899,671 | |
| | | | | | | | | | | | |
| TREASURY DEBT - 14.9% | | | | | |
| | 15,975,000 | | | | | United States Treasury Bill | | 0.033-0.045 | | | 01/02/14 | | | 15,975 | |
| | 59,770,000 | | | | | United States Treasury Bill | | 0.031-0.070 | | | 01/09/14 | | | 59,769 | |
| | 80,000,000 | | | | | United States Treasury Bill | | 0.026-0.068 | | | 01/16/14 | | | 79,999 | |
| | 50,000,000 | | | | | United States Treasury Bill | | 0.032-0.043 | | | 01/23/14 | | | 49,999 | |
| | 30,000,000 | | | | | United States Treasury Bill | | 0.310-0.039 | | | 01/30/14 | | | 29,999 | |
| | 83,355,000 | | | | | United States Treasury Bill | | 0.021-0.150 | | | 02/06/14 | | | 83,350 | |
| | 50,000,000 | | | | | United States Treasury Bill | | 0.033-0.043 | | | 03/20/14 | | | 49,996 | |
| | 19,720,000 | | | | | United States Treasury Bill | | 0.035 | | | 03/27/14 | | | 19,718 | |
| | 92,000,000 | | | | | United States Treasury Bill | | 0.076-0.088 | | | 06/26/14 | | | 91,962 | |
| | 735,000 | | | | | United States Treasury Bill | | 0.078 | | | 07/24/14 | | | 735 | |
| | 86,225,000 | | | | | United States Treasury Bill | | 0.089-0.096 | | | 08/21/14 | | | 86,173 | |
| | 9,190,000 | | | | | United States Treasury Bill | | 0.128-0.133 | | | 12/11/14 | | | 9,179 | |
| | 117,630,000 | | | | | United States Treasury Note | | 1.000 | | | 01/15/14 | | | 117,671 | |
| | 100,000,000 | | | | | United States Treasury Note | | 0.250 | | | 01/31/14 | | | 100,011 | |
| | 100,000,000 | | | | | United States Treasury Note | | 0.250 | | | 02/28/14 | | | 100,020 | |
| | 5,100,000 | | | | | United States Treasury Note | | 1.250 | | | 03/15/14 | | | 5,112 | |
| | 98,510,000 | | | | | United States Treasury Note | | 0.250 | | | 03/31/14 | | | 98,540 | |
| | 100,175,000 | | | | | United States Treasury Note | | 1.250 | | | 04/15/14 | | | 100,502 | |
| | 100,000,000 | | | | | United States Treasury Note | | 0.250 | | | 04/30/14 | | | 100,038 | |
| | 99,625,000 | | | | | United States Treasury Note | | 1.000 | | | 05/15/14 | | | 99,940 | |
| | 61,970,000 | | | | | United States Treasury Note | | 0.750 | | | 06/15/14 | | | 62,141 | |
| | 101,610,000 | | | | | United States Treasury Note | | 0.250 | | | 06/30/14 | | | 101,672 | |
| | 111,325,000 | | | | | United States Treasury Note | | 0.625 | | | 07/15/14 | | | 111,609 | |
| | 100,000,000 | | | | | United States Treasury Note | | 0.125 | | | 07/31/14 | | | 100,007 | |
| | 68,050,000 | | | | | United States Treasury Note | | 0.500 | | | 08/15/14 | | | 68,202 | |
| | 10,000,000 | | | | | United States Treasury Note | | 0.250 | | | 09/15/14 | | | 10,006 | |
| | 6,625,000 | | | | | United States Treasury Note | | 0.250 | | | 11/30/14 | | | 6,631 | |
| | 20,000,000 | | | | | United States Treasury Note | | 0.250 | | | 12/15/14 | | | 20,019 | |
| | 7,950,000 | | | | | United States Treasury Note | | 0.250 | | | 01/15/15 | | | 7,957 | |
| | | | | | | TOTAL TREASURY DEBT | | | | | | | | 1,786,932 | |
COLLEGE RETIREMENT EQUITIES FUND - Money Market Account
| PRINCIPAL | | | | | ISSUER | | RATE | | MATURITY
DATE | | VALUE
(000) | |
| VARIABLE RATE SECURITIES - 11.3% | | | | | | | | | |
| $ | 50,000,000 | | | i | | Canadian Imperial Bank of Commerce | | 0.275 | % | | 01/03/14 | | $ | 50,000 | |
| | 94,500,000 | | | i | | Federal Farm Credit Bank (FFCB) | | 0.180 | | | 01/01/14 | | | 94,486 | |
| | 95,000,000 | | | i | | FFCB | | 0.180 | | | 01/01/14 | | | 95,000 | |
| | 54,500,000 | | | i | | FFCB | | 0.200 | | | 01/01/14 | | | 54,522 | |
| | 10,000,000 | | | i | | FFCB | | 0.250 | | | 01/02/14 | | | 10,014 | |
| | 42,000,000 | | | i | | FFCB | | 0.146 | | | 01/07/14 | | | 41,978 | |
| | 35,000,000 | | | i | | FFCB | | 0.211 | | | 01/07/14 | | | 35,004 | |
| | 10,000,000 | | | i | | FFCB | | 0.130 | | | 01/21/14 | | | 10,000 | |
| | 91,000,000 | | | i | | FFCB | | 0.250 | | | 02/10/14 | | | 90,998 | |
| | 50,000,000 | | | i | | FFCB | | 0.185 | | | 03/09/14 | | | 50,000 | |
| | 50,000,000 | | | i | | FFCB | | 0.150 | | | 03/13/14 | | | 49,999 | |
| | 45,000,000 | | | i | | FFCB | | 0.250 | | | 03/21/14 | | | 45,051 | |
| | 50,000,000 | | | i | | FFCB | | 0.137 | | | 04/16/14 | | | 50,000 | |
| | 50,000,000 | | | i | | FFCB | | 0.196 | | | 07/01/14 | | | 49,991 | |
| | 65,000,000 | | | i | | FFCB | | 0.201 | | | 07/01/14 | | | 64,989 | |
| | 25,000,000 | | | i | | FFCB | | 0.145 | | | 07/10/14 | | | 24,999 | |
| | 36,600,000 | | | i | | FFCB | | 0.180 | | | 07/21/14 | | | 36,605 | |
| | 25,000,000 | | | i | | FFCB | | 0.186 | | | 09/19/14 | | | 25,000 | |
| | 23,750,000 | | | i | | FFCB | | 0.280 | | | 10/14/14 | | | 23,752 | |
| | 70,000,000 | | | i | | FFCB | | 0.120 | | | 10/27/14 | | | 70,000 | |
| | 75,000,000 | | | i | | FFCB | | 0.240 | | | 10/27/14 | | | 74,987 | |
| | 50,000,000 | | | i | | FFCB | | 0.166 | | | 12/12/14 | | | 50,000 | |
| | 50,000,000 | | | i | | Federal Home Loan Bank (FHLB) | | 0.200 | | | 01/01/14 | | | 50,000 | |
| | 20,000,000 | | | i | | FHLB | | 0.220 | | | 02/14/14 | | | 20,012 | |
| | 80,000,000 | | | i | | Federal National Mortgage Association (FNMA) | | 0.147 | | | 06/20/14 | | | 79,994 | |
| | 50,000,000 | | | i | | Royal Bank of Canada | | 0.280 | | | 06/10/14 | | | 50,000 | |
| | 50,000,000 | | | i | | Toronto-Dominion Bank | | 0.217 | | | 09/02/14 | | | 50,000 | |
| | | | | | | TOTAL VARIABLE RATE SECURITIES | | | | | | | | 1,347,381 | |
| | | | | | | | | | | | | | | | |
| | | | | | | TOTAL SHORT-TERM INVESTMENTS | | | | | | | | 11,975,539 | |
| | | | | | | (Cost $11,975,539) | | | | | | | | | |
| | | | | | | | | | | | | | | | |
| | | | | | | TOTAL INVESTMENTS - 100.0% | | | | | | | | 11,975,539 | |
| | | | | | | (Cost $11,975,539) | | | | | | | | | |
| | | | | | | OTHER ASSETS & LIABILITIES, NET - 0.0% | | | | | | | | 5,374 | |
| | | | | | | NET ASSETS - 100.0% | | | | | | | $ | 11,980,913 | |
| | | | | | | | |
| | i | | | | | Floating or variable rate security. Coupon rate reflects the rate at period end. |
| | y | | | | | Security exempt from registration under Section 4(2) of the Securities Act of 1933. Such securities are deemed liquid and may be sold in transactions exempt from registration only to dealers in that program or other “accredited investors.” At 12/31/2013, the aggregate value of these securities was $2,855,372,000, or 23.8% of net assets. |
| | | | | | | |
| | | | | | | Cost amounts are in thousands. |
Report of Independent Registered Public Accounting Firm
To the Board of Trustees and Participants of the College Retirement Equities Fund:
We have audited, in accordance with the standards of the Public Company Accounting Oversight Board (United States), the financial statements of the Stock Account, Global Equities Account, Growth Account, Equity Index Account, Bond Market Account, Inflation-Linked Bond Account, Social Choice Account, and Money Market Account (constituting the College Retirement Equities Fund, hereafter referred to as the "Accounts") as of December 31, 2013, and for the year then ended, and have issued our unqualified report thereon dated February 19, 2014 (which report and financial statements are included in Item 1 of this Certified Shareholder Report on Form N-CSR). Our audits included an audit of each of the Fund's schedule of investments in securities (the Schedules) as of December 31, 2013 appearing in Item 6 of this Form N-CSR. The Schedules are the responsibility of the Accounts' management. Our responsibility is to express an opinion on these Schedules based on our audits.
In our opinion, the Schedules referred to above, when read in conjunction with the financial statements of the Funds referred to above, present fairly, in all material respects, the information set forth therein.
/s/ PricewaterhouseCoopers LLP
Baltimore, Maryland
February 19, 2014
Item 7. Disclosure of Proxy Voting Policies and Procedures for Closed-End Management Investment Companies.
Not Applicable.
Item 8. Portfolio Managers of Closed-End Management Investment Companies.
Not Applicable.
Item 9. Purchases of Equity Securities by Closed-End Management Investment Company and Affiliated Purchasers.
Not Applicable.
Item 10. Submission of Matters to a Vote of Security Holders.
There were no material changes to the procedures by which shareholders may recommend nominees to the Registrant’s Board of Trustees.
Item 11. Controls and Procedures.
(a) An evaluation was performed within 90 days of the filing date of the report under the supervision of the Registrant’s management, including the principal executive officer and principal financial officer, of the effectiveness of the design and operation of the Registrant’s disclosure controls and procedures. Based on that evaluation, the Registrant’s management, including the principal executive officer and principal financial officer, concluded that the Registrant’s disclosure controls and procedures were effective for this annual reporting period.
(b) There were no changes in the Registrant’s internal control over financial reporting that occurred during the Registrant’s annual period covered by this report that materially affected, or are reasonably likely to materially affect, the Registrant’s internal control over financial reporting.
Item 12. Exhibits.
12(a)(1) Copy of current SOX code of ethics for Senior Financial Officers
12(a)(2)(i) Section 302 certification of the principal executive officer
12(a)(2)(ii) Section 302 certification of the principal financial officer
12(b) Section 906 certification of principal executive officer and principal financial officer
SIGNATURES
Pursuant to the requirements of the Securities Exchange Act of 1934 and the Investment Company Act of 1940, the Registrant has duly caused this report to be signed on its behalf by the undersigned, thereunto duly authorized.
| | COLLEGE RETIREMENT EQUITIES FUND |
| | | |
| | | |
| Dated: February 19, 2014 | By: | /s/ Robert G. Leary |
| | | | Robert G. Leary |
| | | | Executive Vice President |
Pursuant to the requirements of the Securities Exchange Act of 1934 and the Investment Company Act of 1940, this report has been signed below by the following persons on behalf of the Registrant and in the capacities and on the dates indicated.
| Dated: February 19, 2014 | By: | /s/ Robert G. Leary |
| | | | Robert G. Leary |
| | | | Executive Vice President |
| | | | (principal executive officer) |
| Dated: February 19, 2014 | By: | /s/ Virginia M. Wilson |
| | | | Virginia M. Wilson |
| | | | Executive Vice President, Chief Financial Officer |
| | | | and Principal Accounting Officer |
| | | | (principal financial officer) |
EXHIBIT INDEX
Item 12. Exhibits.
12(a)(1) Copy of current SOX code of ethics for Senior Financial Officers
12(a)(2)(i) Section 302 certification of the principal executive officer
12(a)(2)(ii) Section 302 certification of the principal financial officer
12(b) Section 906 certification of principal executive officer and principal financial officer