UNITED STATES
SECURITIES AND EXCHANGE COMMISSION
WASHINGTON, D.C. 20549
FORM N-CSR
CERTIFIED SHAREHOLDER REPORT OF REGISTERED
MANAGEMENT INVESTMENT COMPANIES
Investment Company Act file number 811-4410
Oppenheimer Discovery Fund
(Exact name of registrant as specified in charter)
6803 South Tucson Way, Centennial, Colorado 80112-3924
(Address of principal executive offices) (Zip code)
Arthur S. Gabinet
OFI Global Asset Management, Inc.
225 Liberty Street, New York, New York 10281-1008
(Name and address of agent for service)
Registrant’s telephone number, including area code: (303) 768-3200
Date of fiscal year end: September 30
Date of reporting period: 3/31/2015
Item 1. Reports to Stockholders.
Table of Contents
Class A Shares
AVERAGE ANNUAL TOTAL RETURNS AT 3/31/15
| | | | | | | | | | |
| | | Class A Shares of the Fund | | | | | | |
| | | Without Sales Charge | | With Sales Charge | | Russell 2000 Growth Index | | Russell 2000 Index | | S&P 500 Index |
6-Month | | 15.82% | | 9.16% | | 17.36% | | 14.46% | | 5.93% |
|
1-Year | | 7.64 | | 1.45 | | 12.06 | | 8.21 | | 12.73 |
|
5-Year | | 16.93 | | 15.55 | | 16.58 | | 14.57 | | 14.47 |
|
10-Year | | 9.93 | | 9.28 | | 10.02 | | 8.82 | | 8.01 |
|
Performance data quoted represents past performance, which does not guarantee future results. The investment return and principal value of an investment in the Fund will fluctuate so that an investor’s shares, when redeemed, may be worth more or less than their original cost. Fund returns include changes in share price, reinvested distributions, and a 5.75% maximum applicable sales charge except where “without sales charge” is indicated. Current performance may be lower or higher than the performance quoted. Returns do not consider capital gains or income taxes on an individual’s investment. Returns for periods of less than one year are cumulative and not annualized. For performance data current to the most recent month-end, visit oppenheimerfunds.com or call 1.800.CALL OPP (225.5677).
2 OPPENHEIMER DISCOVERY FUND
Fund Performance Discussion
The Fund’s Class A shares (without sales charge) produced a total return of 15.82% during the reporting period. On a relative basis, the Fund underperformed the Russell 2000 Growth Index (the “Index”), which returned 17.36%. The Fund’s underperformance stemmed primarily from weaker relative stock selection in the health care, consumer discretionary and industrials sectors. The Fund outperformed the Index in the energy sector due to stock selection and an underweight position in what was by far the worst performing sector in the Index, and due to stock selection in the information technology and financials sectors. Our focus on well-established, higher quality growth companies is designed to provide investors with both upside participation and a degree of downside protection.
MARKET OVERVIEW
Domestic equities were among the top performing asset classes in 2014, outperforming foreign equities, including those domiciled in Europe, Japan and emerging markets. In the U.S., the Federal Reserve (the “Fed”) ended its bond-buying stimulus program in October 2014. Throughout 2014, the U.S. economy provided a favorable backdrop for the positive performance of equities with steady, albeit modest growth, continued little wage inflation, and interest rates that remained low — in fact, well below initial expectations. Under these economic conditions most companies were able to demonstrate ongoing improvement with the majority beating expectations — on both the top and bottom lines. The ride throughout the year, however, was anything but smooth. Macro influences — particularly the strengthening dollar, flattening yield curve, and tumbling oil price
— played a significant role in determining which equities did and did not perform well. The start of 2015 was largely a continuation of the back half of 2014. Foreign exchange headwinds, declining energy prices, and questions as to when the Fed would finally move to raise interest rates continued to dominate the headlines. February brought renewed optimism among stock investors amid stabilization in oil’s price and some favorable corporate earnings reports. However, stocks surrendered some of those gains in March, as a better-than-expected February employment report raised the possibility that the Fed might speed up its timetable for raising short-term interest rates after a prolonged period of extremely accommodative monetary policy.
Against this backdrop, U.S. equities generally performed positively, with growth stocks
3 OPPENHEIMER DISCOVERY FUND
outperforming value for the 6-month reporting period ended March 31, 2015.
FUND REVIEW
Top performing stocks this reporting period included health care stocks Centene Corp. and Acadia Healthcare Co., Inc., and information technology stock Proofpoint, Inc. Centene, a managed care company that serves of 4 million Medicaid members across twenty states, had a solid reporting period. The company reported strong fourth quarter financial results during the period and reaffirmed 2015 guidance of 30% revenue growth. Acadia Healthcare is a leading behavioral care provider. In October, the company completed a large acquisition of a company that provides substance abuse rehab services, which is expected to be accretive. Proofpoint, a leading security-as-a-service vendor that enables companies to defend, protect, archive and govern their most sensitive data, reported strong third-quarter results with revenue and billings above consensus estimates.
Detractors from performance this reporting period included H&E Equipment Services, Inc., Stratasys Ltd. and Eagle Materials Inc. We exited our position in these stocks during the reporting period. H&E Equipment Services, one of the largest equipment rental companies in the United States focused on heavy construction and industrial equipment, had a weak period as lower oil prices impaired its growth prospects, as over 50%
of the company’s revenue and gross profit is derived from the Gulf Coast region. Stratasys, one of the leading makers of 3D printers, issued earnings per share guidance that was below consensus estimates due partly to higher than expected operating expenses. Eagle Materials is a major producer of gypsum wallboard and cement. Recently the company has been developing a frac sand business that sells into the oil and gas industry. As oil prices have come down sharply, this has increased the risk of earnings disappointments, so we exited our position.
STRATEGY & OUTLOOK
The outlook for the equity markets in 2015 is mixed. Recent U.S. economic data is solid and should benefit from the recent drop in oil and gasoline prices. However, European economies continue to struggle, growth in China continues to slow, and many emerging markets will face headwinds given their positions as exporters of commodities such as oil. Interest rate and currency volatility may be elevated in 2015 as the Fed prepares to raise short-term interest rates in the U.S. while central banks in Japan, China and the European Union move in the opposite direction with easier monetary policies.
We believe our long-term investment process is well-suited for this uncertain environment. We continue to find companies with what we view as above-average growth opportunities, structurally attractive industry segments and strong management teams. We seek dynamic
4 OPPENHEIMER DISCOVERY FUND
companies with leading market positions, above-average and sustainable revenue and earnings growth that we believe are positioned to perform well. This includes leading firms in structurally attractive industries with committed management teams that have proven records of performance.
| | |

| | 
Ronald J. Zibelli, Jr., CFA Portfolio Manager |
| | |

| | 
Ash Shah, CFA, CPA Portfolio Manager |
5 OPPENHEIMER DISCOVERY FUND
Top Holdings and Allocations
TOP TEN COMMON STOCK HOLDINGS
| | | | |
Proofpoint, Inc. | | | 2.2 | % |
Monolithic Power Systems, Inc. | | | 2.1 | |
Ultimate Software Group, Inc. (The) | | | 2.1 | |
Tyler Technologies, Inc. | | | 2.1 | |
Cavium, Inc. | | | 2.1 | |
Middleby Corp. (The) | | | 2.0 | |
Wabtec Corp. | | | 2.0 | |
CoStar Group, Inc. | | | 2.0 | |
DexCom, Inc. | | | 1.9 | |
Acadia Healthcare Co., Inc. | | | 1.9 | |
Portfolio holdings and allocations are subject to change. Percentages are as of March 31, 2015, and are based on net assets. For more current Fund holdings, please visit oppenheimerfunds.com.
TOP TEN COMMON STOCK INDUSTRIES
| | | | |
Software | | | 14.1 | % |
Hotels, Restaurants & Leisure | | | 8.5 | |
Health Care Providers & Services | | | 8.3 | |
Health Care Equipment & Supplies | | | 8.0 | |
Semiconductors & Semiconductor Equipment | | | 7.1 | |
Internet Software & Services | | | 5.0 | |
Textiles, Apparel & Luxury Goods | | | 4.1 | |
Machinery | | | 4.1 | |
Biotechnology | | | 4.0 | |
Commercial Banks | | | 4.0 | |
Portfolio holdings and allocations are subject to change. Percentages are as of March 31, 2015, and are based on net assets.
SECTOR ALLOCATION
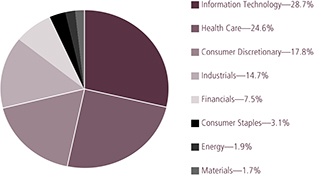
Portfolio holdings and allocations are subject to change. Percentages are as of March 31, 2015, and are based on the total market value of common stocks.
6 OPPENHEIMER DISCOVERY FUND
Share Class Performance
AVERAGE ANNUAL TOTAL RETURNS WITHOUT SALES CHARGE AS OF 3/31/15
| | | | | | | | | | | | | | |
| | | Inception Date | | 6-Month | | 1-Year | | 5-Year | | 10-Year | | | |
| Class A (OPOCX) | | 9/11/86 | | 15.82% | | 7.64% | | 16.93% | | | 9.93% | | | |
| Class B (ODIBX) | | 4/4/94 | | 15.38% | | 6.83% | | 15.99% | | | 9.42% | | | |
| Class C (ODICX) | | 10/2/95 | | 15.40% | | 6.84% | | 16.03% | | | 9.07% | | | |
| Class I (ODIIX) | | 1/27/12 | | 16.06% | | 8.11% | | 18.43%* | | | N/A | | | |
| Class R (ODINX) | | 3/1/01 | | 15.66% | | 7.33% | | 16.61% | | | 9.62% | | | |
| Class Y (ODIYX) | | 6/1/94 | | 15.97% | | 7.90% | | 17.33% | | | 10.26% | | | |
AVERAGE ANNUAL TOTAL RETURNS WITH SALES CHARGE AS OF 3/31/15
| | | | | | | | | | | | | | |
| | | Inception Date | | 6-Month | | 1-Year | | 5-Year | | 10-Year | | | |
| Class A (OPOCX) | | 9/11/86 | | 9.16% | | 1.45% | | 15.55% | | | 9.28% | | | |
| Class B (ODIBX) | | 4/4/94 | | 10.38% | | 2.10% | | 15.77% | | | 9.42% | | | |
| Class C (ODICX) | | 10/2/95 | | 14.40% | | 5.89% | | 16.03% | | | 9.07% | | | |
| Class I (ODIIX) | | 1/27/12 | | 16.06% | | 8.11% | | 18.43%* | | | N/A | | | |
| Class R (ODINX) | | 3/1/01 | | 14.66% | | 6.36% | | 16.61% | | | 9.62% | | | |
| Class Y (ODIYX) | | 6/1/94 | | 15.97% | | 7.90% | | 17.33% | | | 10.26% | | | |
* Shows performance since inception.
Performance data quoted represents past performance, which does not guarantee future results. The investment return and principal value of an investment in the Fund will fluctuate so that an investor’s shares, when redeemed, may be worth more or less than their original cost. Current performance may be lower or higher than the performance quoted. Returns do not consider capital gains or income taxes on an individual’s investment. Returns for periods of less than one year are cumulative and not annualized. For performance data current to the most recent month-end, visit oppenheimerfunds.com or call 1.800.CALL OPP (225.5677). Fund returns include changes in share price, reinvested distributions, and the applicable sales charge: for Class A shares, the current maximum initial sales charge of 5.75%; for Class B shares, the contingent deferred sales charge (“CDSC”) of 5% (1-year) and 2% (5-year); and for Class C shares, the CDSC of 1% for the 1-year period. Prior to 7/1/14, Class R shares were named Class N shares. Beginning 7/1/14, new purchases of Class R shares will no longer be subject to a CDSC upon redemption (any CDSC will remain in effect for purchases prior to 7/1/14). There is no sales charge for Class I and Class Y shares. Because Class B shares convert to Class A shares 72 months after purchase, the 10-year return for Class B shares uses Class A performance for the period after conversion.
The Fund’s performance is compared to the performance of the Russell 2000 Growth Index, the Russell 2000 Index and the S&P 500 Index. The Russell 2000 Growth Index measures the performance of the small-cap growth segment of the U.S. equity universe. It includes those Russell 2000 companies with higher price-to-book ratios and higher forecasted growth values. The Russell 2000 Index measures the performance of the small-cap segment of the U.S. equity universe. The Russell 2000 Index is a subset of the Russell 3000 Index representing approximately 10% of the total market capitalization of that index. It includes
7 OPPENHEIMER DISCOVERY FUND
approximately 2000 of the smallest securities based on a combination of their market cap and current index membership. The S&P 500 Index is a broad-based measure of domestic stock performance. The indices are unmanaged and cannot be purchased directly by investors. While index comparisons may be useful to provide a benchmark for the Fund’s performance, it must be noted that the Fund’s investments are not limited to the investments comprising the indices. Index performance includes reinvestment of income, but does not reflect transaction costs, fees, expenses or taxes. Index performance is shown for illustrative purposes only as a benchmark for the Fund’s performance, and does not predict or depict performance of the Fund. The Fund’s performance reflects the effects of the Fund’s business and operating expenses.
The Fund’s investment strategy and focus can change over time. The mention of specific fund holdings does not constitute a recommendation by OppenheimerFunds, Inc. or its affiliates.
Before investing in any of the Oppenheimer funds, investors should carefully consider a fund’s investment objectives, risks, charges and expenses. Fund prospectuses and summary prospectuses contain this and other information about the funds, and may be obtained by asking your financial advisor, visiting oppenheimerfunds.com, or calling 1.800.CALL OPP (225.5677). Read prospectuses and summary prospectuses carefully before investing.
Shares of Oppenheimer funds are not deposits or obligations of any bank, are not guaranteed by any bank, are not insured by the FDIC or any other agency, and involve investment risks, including the possible loss of the principal amount invested.
8 OPPENHEIMER DISCOVERY FUND
Fund Expenses
Fund Expenses. As a shareholder of the Fund, you incur two types of costs: (1) transaction costs, which may include sales charges (loads) on purchase payments, contingent deferred sales charges on redemptions; and (2) ongoing costs, including management fees; distribution and service fees; and other Fund expenses. These examples are intended to help you understand your ongoing costs (in dollars) of investing in the Fund and to compare these costs with the ongoing costs of investing in other mutual funds.
The examples are based on an investment of $1,000.00 invested at the beginning of the period and held for the entire 6-month period ended March 31, 2015.
Actual Expenses. The first section of the table provides information about actual account values and actual expenses. You may use the information in this section for the class of shares you hold, together with the amount you invested, to estimate the expense that you paid over the period. Simply divide your account value by $1,000.00 (for example, an $8,600.00 account value divided by $1,000.00 = 8.60), then multiply the result by the number in the first section under the heading entitled “Expenses Paid During 6 Months Ended March 31, 2015” to estimate the expenses you paid on your account during this period.
Hypothetical Example for Comparison Purposes. The second section of the table provides information about hypothetical account values and hypothetical expenses based on the Fund’s actual expense ratio for each class of shares, and an assumed rate of return of 5% per year for each class before expenses, which is not the Fund’s actual return. The hypothetical account values and expenses may not be used to estimate the actual ending account balance or expenses you paid for the period. You may use this information to compare the ongoing costs of investing in the Fund and other funds. To do so, compare this 5% hypothetical example for the class of shares you hold with the 5% hypothetical examples that appear in the shareholder reports of the other funds.
Please note that the expenses shown in the table are meant to highlight your ongoing costs only and do not reflect any transactional costs, such as front-end or contingent deferred sales charges (loads). Therefore, the “hypothetical” section of the table is useful in comparing ongoing costs only, and will not help you determine the relative total costs of owning different funds. In addition, if these transactional costs were included, your costs would have been higher.
9 OPPENHEIMER DISCOVERY FUND
| | | | | | |
| | | Beginning | | Ending | | Expenses |
| | | Account | | Account | | Paid During |
| | | Value | | Value | | 6 Months Ended |
| Actual | | October 1, 2014 | | March 31, 2015 | | March 31, 2015 |
Class A | | $ 1,000.00 | | $ 1,158.20 | | $ 5.93 |
Class B | | 1,000.00 | | 1,153.80 | | 10.03 |
Class C | | 1,000.00 | | 1,154.00 | | 10.03 |
Class I | | 1,000.00 | | 1,160.60 | | 3.61 |
Class R | | 1,000.00 | | 1,156.60 | | 7.34 |
Class Y | | 1,000.00 | | 1,159.70 | | 4.64 |
| | | |
| Hypothetical | | | | | | |
(5% return before expenses) | | | | | | |
Class A | | 1,000.00 | | 1,019.45 | | 5.55 |
Class B | | 1,000.00 | | 1,015.66 | | 9.39 |
Class C | | 1,000.00 | | 1,015.66 | | 9.39 |
Class I | | 1,000.00 | | 1,021.59 | | 3.38 |
Class R | | 1,000.00 | | 1,018.15 | | 6.87 |
Class Y | | 1,000.00 | | 1,020.64 | | 4.34 |
Expenses are equal to the Fund’s annualized expense ratio for that class, multiplied by the average account value over the period, multiplied by 182/365 (to reflect the one-half year period). Those annualized expense ratios, excluding indirect expenses from affiliated funds, based on the 6-month period ended March 31, 2015 are as follows:
| | | | |
| Class | | Expense Ratios | |
Class A | | | 1.10% | |
Class B | | | 1.86 | |
Class C | | | 1.86 | |
Class I | | | 0.67 | |
Class R | | | 1.36 | |
Class Y | | | 0.86 | |
The expense ratios reflect voluntary and/or contractual waivers and/or reimbursements of expenses by the Fund’s Manager. Some of these undertakings may be modified or terminated at any time, as indicated in the Fund’s prospectus. The “Financial Highlights” tables in the Fund’s financial statements, included in this report, also show the gross expense ratios, without such waivers or reimbursements and reduction to custodian expenses, if applicable.
10 OPPENHEIMER DISCOVERY FUND
STATEMENT OF INVESTMENTS March 31, 2015 Unaudited
| | | | | | | | |
| | | Shares | | | Value | |
| |
Common Stocks—98.3% | | | | | | | | |
| |
Consumer Discretionary—17.5% | | | | | |
| |
Diversified Consumer Services—1.5% | |
Bright Horizons Family Solutions, Inc.1 | | | 608,304 | | | $ | 31,187,746 | |
| |
Hotels, Restaurants & Leisure—8.5% | | | | | |
Buffalo Wild Wings, Inc.1 | | | 176,150 | | | | 31,925,426 | |
| |
Dave & Buster’s Entertainment, Inc.1 | | | 343,040 | | | | 10,448,999 | |
| |
Fiesta Restaurant Group, Inc.1 | | | 407,400 | | | | 24,851,400 | |
| |
Jack in the Box, Inc. | | | 374,940 | | | | 35,964,245 | |
| |
La Quinta Holdings, Inc.1 | | | 891,190 | | | | 21,103,379 | |
| |
Papa John’s International, Inc. | | | 265,220 | | | | 16,393,248 | |
| |
Popeyes Louisiana Kitchen, Inc.1 | | | 465,090 | | | | 27,821,684 | |
| |
Zoe’s Kitchen, Inc.1 | | | 456,810 | | | | 15,207,205 | |
| | | | | | | | |
| | | | | | | 183,715,586 | |
| |
Internet & Catalog Retail—0.8% | | | | | | | | |
HSN, Inc. | | | 264,140 | | | | 18,022,272 | |
| |
Multiline Retail—1.7% | | | | | | | | |
Burlington Stores, Inc.1 | | | 598,510 | | | | 35,563,464 | |
| |
Specialty Retaila—0.9% | | | | | | | | |
Michaels Cos., Inc. (The)1 | | | 710,070 | | | | 19,214,494 | |
| |
Textiles, Apparel & Luxury Goods—4.1% | |
Carter’s, Inc. | | | 239,360 | | | | 22,133,619 | |
| |
Columbia Sportswear Co. | | | 87,960 | | | | 5,356,764 | |
| |
G-III Apparel Group Ltd.1 | | | 314,682 | | | | 35,448,927 | |
| |
Skechers U.S.A., Inc., Cl. A1 | | | 361,681 | | | | 26,008,481 | |
| | | | | | | | |
| | | | | | | 88,947,791 | |
| |
Consumer Staples—3.0% | | | | | | | | |
| |
Beverages—0.9% | | | | | | | | |
Boston Beer Co., Inc. (The), Cl. A1 | | | 74,580 | | | | 19,942,692 | |
| | | | | | | | |
| | | Shares | | | Value | |
| |
Food & Staples Retailing—0.3% | | | | | | | | |
Diplomat Pharmacy, Inc.1 | | | 183,440 | | | $ | 6,343,355 | |
Food Products—1.8% | | | | | | | | |
Hain Celestial Group, Inc. (The)1 | | | 390,780 | | | | 25,029,459 | |
| |
J&J Snack Foods Corp. | | | 124,974 | | | | 13,334,726 | |
| | | | | | | | |
| | | | | | | 38,364,185 | |
| |
Energy—1.9% | | | | | | | | |
| |
Energy Equipment & Services—0.3% | | | | | |
Patterson-UTI Energy, Inc. | | | 280,490 | | | | 5,266,200 | |
| |
Oil, Gas & Consumable Fuels—1.6% | | | | | | | | |
Diamondback Energy, Inc.1 | | | 306,500 | | | | 23,551,460 | |
| |
Matador Resources Co.1 | | | 272,680 | | | | 5,977,146 | |
| |
PDC Energy, Inc.1 | | | 100,560 | | | | 5,434,262 | |
| | | | | | | | |
| | | | | | | 34,962,868 | |
| |
Financials—7.4% | | | | | | | | |
| |
Capital Markets—1.0% | | | | | |
HFF, Inc., Cl. A | | | 292,658 | | | | 10,986,381 | |
| |
Piper Jaffray Cos.1 | | | 192,790 | | | | 10,113,764 | |
| | | | | | | | |
| | | | | | | 21,100,145 | |
| |
Commercial Banks—4.0% | | | | | | | | |
Bank of the Ozarks, Inc. | | | 445,700 | | | | 16,459,701 | |
| |
PrivateBancorp, Inc. | | | 523,900 | | | | 18,425,563 | |
| |
Signature Bank1 | | | 190,729 | | | | 24,714,664 | |
| |
Western Alliance Bancorp1 | | | 887,940 | | | | 26,318,542 | |
| | | | | | | | |
| | | | | | | 85,918,470 | |
| |
Diversified Financial Services—0.9% | | | | | | | | |
MarketAxess Holdings, Inc. | | | 230,590 | | | | 19,115,911 | |
| |
Real Estate Investment Trusts (REITs)—0.5% | |
Pebblebrook Hotel Trust | | | 233,906 | | | | 10,893,002 | |
| |
Real Estate Management & Development—0.3% | |
Marcus & Millichap, Inc.1 | | | 164,290 | | | | 6,157,589 | |
11 OPPENHEIMER DISCOVERY FUND
STATEMENT OF INVESTMENTS Unaudited / Continued
| | | | | | | | |
| | | Shares | | | Value | |
| |
Thrifts & Mortgage Finance—0.7% | |
Essent Group Ltd.1 | | | 694,900 | | | $ | 16,615,059 | |
| |
Health Care—24.2% | | | | | | | | |
| |
Biotechnology—4.0% | | | | | | | | |
Bluebird Bio, Inc.1 | | | 129,800 | | | | 15,675,946 | |
| |
Celldex Therapeutics, Inc.1 | | | 348,850 | | | | 9,722,449 | |
| |
Cepheid1 | | | 263,830 | | | | 15,011,927 | |
| |
Juno Therapeutics, Inc.1 | | | 38,250 | | | | 2,320,245 | |
| |
Neurocrine Biosciences, Inc.1 | | | 138,660 | | | | 5,506,189 | |
| |
PTC Therapeutics, Inc.1 | | | 225,810 | | | | 13,740,539 | |
| |
Receptos, Inc.1 | | | 45,020 | | | | 7,423,348 | |
| |
Ultragenyx Pharmaceutical, Inc.1 | | | 293,080 | | | | 18,197,337 | |
| | | | | | | | |
| | | | | | | 87,597,980 | |
| |
Health Care Equipment & Supplies—8.0% | | | | | |
Cantel Medical Corp. | | | 350,513 | | | | 16,649,367 | |
| |
Cardiovascular Systems, Inc.1 | | | 379,550 | | | | 14,817,632 | |
| |
DexCom, Inc.1 | | | 648,098 | | | | 40,402,429 | |
| |
Inogen, Inc.1 | | | 202,440 | | | | 6,476,056 | |
| |
K2M Group Holdings, Inc.1 | | | 499,870 | | | | 11,022,134 | |
| |
NuVasive, Inc.1 | | | 119,840 | | | | 5,511,442 | |
| |
NxStage Medical, Inc.1 | | | 630,470 | | | | 10,907,131 | |
| |
Spectranetics Corp. (The)1 | | | 1,030,170 | | | | 35,808,709 | |
| |
STERIS Corp. | | | 257,030 | | | | 18,061,498 | |
| |
West Pharmaceutical Services, Inc. | | | 207,675 | | | | 12,504,112 | |
| | | | | | | | |
| | | | | | | 172,160,510 | |
| |
Health Care Providers & Services—8.3% | | | | | |
Acadia Healthcare Co., Inc.1 | | | 562,397 | | | | 40,267,625 | |
| |
Centene Corp.1 | | | 547,860 | | | | 38,728,223 | |
| |
ExamWorks Group, Inc.1 | | | 420,690 | | | | 17,509,118 | |
| |
HealthEquity, Inc.1 | | | 315,800 | | | | 7,891,842 | |
| |
LifePoint Hospitals, Inc.1 | | | 227,606 | | | | 16,717,661 | |
| |
Team Health Holdings, Inc.1 | | | 501,970 | | | | 29,370,265 | |
| | | | | | | | |
| | | Shares | | | Value | |
| |
Health Care Providers & Services (Continued) | |
| |
VCA, Inc.1 | | | 518,380 | | | $ | 28,417,591 | |
| | | | | | | | |
| | | | | | | 178,902,325 | |
| |
Health Care Technology—1.2% | | | | | |
Omnicell, Inc.1 | | | 426,433 | | | | 14,967,798 | |
| |
Veeva Systems, Inc., Cl. A1 | | | 409,473 | | | | 10,453,846 | |
| | | | | | | | |
| | | | | | | 25,421,644 | |
| |
Life Sciences Tools & Services—1.2% | | | | | |
ICON plc1 | | | 365,050 | | | | 25,746,976 | |
| |
Pharmaceuticals—1.5% | |
Akorn, Inc.1 | | | 503,504 | | | | 23,921,475 | |
| |
Pacira Pharmaceuticals, Inc.1 | | | 88,580 | | | | 7,870,333 | |
| | | | | | | | |
| | | | | | | 31,791,808 | |
|
| |
Industrials—14.5% | | | | | | | | |
| |
Aerospace & Defense—0.7% | | | | | | | | |
Curtiss-Wright Corp. | | | 192,430 | | | | 14,228,274 | |
| |
Airlines—1.8% | | | | | |
Allegiant Travel Co., Cl. A | | | 203,005 | | | | 39,035,831 | |
| |
Building Products—3.1% | |
A.O. Smith Corp. | | | 586,930 | | | | 38,537,824 | |
| |
Lennox International, Inc. | | | 242,160 | | | | 27,046,850 | |
| | | | | | | | |
| | | | | | | 65,584,674 | |
| |
Commercial Services & Supplies—1.4% | | | | | |
Mobile Mini, Inc. | | | 725,163 | | | | 30,920,950 | |
| |
Machinery—4.1% | | | | | |
Middleby Corp. (The)1 | | | 429,450 | | | | 44,083,042 | |
| |
Wabtec Corp. | | | 463,560 | | | | 44,042,836 | |
| | | | | | | | |
| | | | | | | 88,125,878 | |
| |
Professional Services—0.9% | | | | | |
Paylocity Holding Corp.1 | | | 660,970 | | | | 18,930,181 | |
| |
Road & Rail—2.5% | | | | | |
Knight Transportation, Inc. | | | 676,530 | | | | 21,818,093 | |
| |
Old Dominion Freight Line, Inc.1 | | | 313,560 | | | | 24,238,188 | |
12 OPPENHEIMER DISCOVERY FUND
| | | | | | | | |
| | | Shares | | | Value | |
| |
Road & Rail (Continued) | |
| |
Saia, Inc.1 | | | 182,850 | | | $ | 8,100,255 | |
| | | | | | | | |
| | | | | | | 54,156,536 | |
| |
Information Technology—28.2% | |
| |
Electronic Equipment, Instruments, & Components—2.0% | |
Cognex Corp.1 | | | 328,560 | | | | 16,293,291 | |
| |
IPG Photonics Corp.1 | | | 140,540 | | | | 13,028,058 | |
| |
Methode Electronics, Inc. | | | 278,060 | | | | 13,079,942 | |
| | | | | | | | |
| | | | | | | 42,401,291 | |
| |
Internet Software & Services—5.0% | |
comScore, Inc.1 | | | 62,440 | | | | 3,196,928 | |
| |
CoStar Group, Inc.1 | | | 214,580 | | | | 42,450,361 | |
| |
Demandware, Inc.1 | | | 187,340 | | | | 11,409,006 | |
| |
Envestnet, Inc.1 | | | 298,860 | | | | 16,760,069 | |
| |
GrubHub, Inc.1 | | | 486,440 | | | | 22,079,511 | |
| |
Shutterstock, Inc.1 | | | 188,470 | | | | 12,942,235 | |
| | | | | | | | |
| | | | | | | 108,838,110 | |
| |
Semiconductors & Semiconductor Equipment—7.1% | |
Ambarella, Inc.1 | | | 220,390 | | | | 16,685,727 | |
| |
Cavium, Inc.1 | | | 630,220 | | | | 44,632,180 | |
| |
Cypress Semiconductor Corp.1 | | | 1,320,987 | | | | 18,639,127 | |
| |
| M/A-COM Technology Solutions Holdings, Inc.1 | | | 431,730 | | | | 16,086,260 | |
| |
Microsemi Corp.1 | | | 155,650 | | | | 5,510,010 | |
| |
MKS Instruments, Inc. | | | 133,530 | | | | 4,514,649 | |
| |
Monolithic Power Systems, Inc. | | | 873,420 | | | | 45,985,563 | |
| | | | | | | | |
| | | | | | | 152,053,516 | |
| |
Software—14.1% | |
CyberArk Software Ltd.1 | | | 105,040 | | | | 5,837,073 | |
| | | | | | | | |
| | | Shares | | | Value | |
| |
Software (Continued) | |
| |
Guidewire Software, Inc.1 | | | 676,692 | | | $ | 35,600,766 | |
| |
HubSpot, Inc.1 | | | 334,790 | | | | 13,358,121 | |
| |
Manhattan Associates, Inc.1 | | | 334,140 | | | | 16,910,825 | |
| |
Proofpoint, Inc.1 | | | 800,600 | | | | 47,411,532 | |
| |
ServiceNow, Inc.1 | | | 353,170 | | | | 27,822,733 | |
| |
Tableau Software, Inc., Cl. A1 | | | 393,950 | | | | 36,448,254 | |
| |
Tyler Technologies, Inc.1 | | | 370,930 | | | | 44,708,193 | |
| |
| Ultimate Software Group, Inc. (The)1 | | | 268,892 | | | | 45,699,540 | |
| |
Verint Systems, Inc.1 | | | 304,400 | | | | 18,851,492 | |
| |
Zendesk, Inc.1 | | | 471,290 | | | | 10,693,570 | |
| | | | | | | | |
| | | | | | | 303,342,099 | |
| |
Materials—1.6% | | | | | | | | |
| |
Construction Materials—0.7% | |
Caesarstone Sdot-Yam Ltd. | | | 254,130 | | | | 15,428,232 | |
| |
Containers & Packaging—0.9% | |
Berry Plastics Group, Inc.1 | | | 555,250 | | | | 20,094,498 | |
| | | | | | | | |
Total Common Stocks | | | | | | | | |
(Cost $1,470,548,029) | | | | | | | 2,116,092,142 | |
| |
Investment Company—3.4% | |
| |
| Oppenheimer Institutional Money Market Fund, Cl. E, 0.12%2,3 (Cost $72,564,959) | | | 72,564,959 | | | | 72,564,959 | |
| |
| Total Investments, at Value (Cost $1,543,112,988) | | | 101.7 | % | | | 2,188,657,101 | |
| |
Net Other Assets (Liabilities) | | | (1.7 | ) | | | (37,166,147 | ) |
| | | | |
Net Assets | | | 100.0 | % | | $ | 2,151,490,954 | |
| | | | |
Footnotes to Statement of Investments
1. Non-income producing security.
2. Rate shown is the 7-day yield as of March 31, 2015.
13 OPPENHEIMER DISCOVERY FUND
STATEMENT OF INVESTMENTS Unaudited / Continued
Footnotes to Statement of Investments (Continued)
3. Is or was an affiliate, as defined in the Investment Company Act of 1940, as amended, at or during the period ended March 31, 2015, by virtue of the Fund owning at least 5% of the voting securities of the issuer or as a result of the Fund and the issuer having the same investment adviser. Transactions during the period in which the issuer was an affiliate are as follows:
| | | | | | | | | | |
| | | Shares
September 30,
2014 | | Gross
Additions | | Gross
Reductions | | Shares
March 31, 2015 | |
| |
Oppenheimer Institutional Money Market Fund, Cl. E | | 72,774,930 | | 425,138,697 | | 425,348,668 | | | 72,564,959 | |
| | | | |
| | | | | | | Value | | Income | |
| |
Oppenheimer Institutional Money Market Fund, Cl. E | | | | | | $72,564,959 | | | $26,479 | |
See accompanying Notes to Financial Statements.
14 OPPENHEIMER DISCOVERY FUND
STATEMENT OF ASSETS AND LIABILITIES March 31, 2015 Unaudited
| | | | | | |
|
Assets | | | | | | |
Investments, at value—see accompanying statement of investments: | | | | | | |
Unaffiliated companies (cost $1,470,548,029) | | $ | 2,116,092,142 | | | |
Affiliated companies (cost $72,564,959) | | | 72,564,959 | | | |
| | | |
| | | 2,188,657,101 | | | |
|
Cash | | | 999,994 | | | |
|
Receivables and other assets: | | | | | | |
Investments sold | | | 12,747,295 | | | |
Shares of beneficial interest sold | | | 1,184,857 | | | |
Dividends | | | 588,413 | | | |
Other | | | 138,312 | | | |
| | | |
Total assets | | | 2,204,315,972 | | | |
|
|
Liabilities | | | | | | |
Payables and other liabilities: | | | | | | |
Investments purchased | | | 48,147,868 | | | |
Shares of beneficial interest redeemed | | | 3,972,396 | | | |
Distribution and service plan fees | | | 346,558 | | | |
Trustees’ compensation | | | 327,372 | | | |
Shareholder communications | | | 7,705 | | | |
Dividends | | | 227 | | | |
Other | | | 22,892 | | | |
| | | |
Total liabilities | | | 52,825,018 | | | |
|
|
Net Assets | | $ | 2,151,490,954 | | | |
| | | |
| | | | | | | |
Composition of Net Assets | | | | | | |
Par value of shares of beneficial interest | | $ | 28,463 | | | |
|
Additional paid-in capital | | | 1,480,201,462 | | | |
|
Accumulated net investment loss | | | (19,520,709 | ) | | |
|
Accumulated net realized gain on investments | | | 45,237,624 | | | |
|
Net unrealized appreciation on investments | | | 645,544,114 | | | |
| | | |
Net Assets | | $ | 2,151,490,954 | | | |
| | | |
15 OPPENHEIMER DISCOVERY FUND
STATEMENT OF ASSETS AND LIABILITIES Unaudited / Continued
| | | | |
| |
Net Asset Value Per Share | | | | |
Class A Shares: | | | | |
Net asset value and redemption price per share (based on net assets of $1,367,394,750 and 17,953,740 shares of beneficial interest outstanding) | | $ | 76.16 | |
Maximum offering price per share (net asset value plus sales charge of 5.75% of offering price) | | $ | 80.81 | |
| |
Class B Shares: | | | | |
| Net asset value, redemption price (excludes applicable contingent deferred sales charge) and offering price per share (based on net assets of $40,036,878 and 685,561 shares of beneficial interest outstanding) | | $ | 58.40 | |
| |
Class C Shares: | | | | |
| Net asset value, redemption price (excludes applicable contingent deferred sales charge) and offering price per share (based on net assets of $173,646,800 and 2,877,899 shares of beneficial interest outstanding) | | $ | 60.34 | |
| |
Class I Shares: | | | | |
| Net asset value, redemption price and offering price per share (based on net assets of $76,125,463 and 907,182 shares of beneficial interest outstanding) | | $ | 83.91 | |
| |
Class R Shares: | | | | |
| Net asset value, redemption price (excludes applicable contingent deferred sales charge) and offering price per share (based on net assets of $56,833,223 and 786,999 shares of beneficial interest outstanding) | | $ | 72.22 | |
| |
Class Y Shares: | | | | |
| Net asset value, redemption price and offering price per share (based on net assets of $437,453,840 and 5,251,795 shares of beneficial interest outstanding) | | $ | 83.30 | |
See accompanying Notes to Financial Statements.
16 OPPENHEIMER DISCOVERY FUND
STATEMENT OF OPERATIONS For the Six Months Ended March 31, 2015 Unaudited
| | | | | | |
|
Investment Income | | | | | | |
Dividends: | | | | | | |
Unaffiliated companies (net of foreign withholding taxes of $32,486) | | $ | 6,735,273 | | | |
Affiliated companies | | | 26,479 | | | |
|
Interest | | | 314 | | | |
| | | |
Total investment income | | | 6,762,066 | | | |
|
|
Expenses | | | | | | |
Management fees | | | 6,507,745 | | | |
|
Distribution and service plan fees: | | | | | | |
Class A | | | 1,549,737 | | | |
Class B | | | 209,117 | | | |
Class C | | | 827,985 | | | |
Class R | | | 138,108 | | | |
|
Transfer and shareholder servicing agent fees: | | | | | | |
Class A | | | 1,422,410 | | | |
Class B | | | 46,281 | | | |
Class C | | | 182,837 | | | |
Class I | | | 9,197 | | | |
Class R | | | 60,942 | | | |
Class Y | | | 472,927 | | | |
|
Shareholder communications: | | | | | | |
Class A | | | 13,435 | | | |
Class B | | | 1,370 | | | |
Class C | | | 1,802 | | | |
Class I | | | 52 | | | |
Class R | | | 311 | | | |
Class Y | | | 2,006 | | | |
|
Trustees’ compensation | | | 22,360 | | | |
|
Custodian fees and expenses | | | 5,619 | | | |
|
Other | | | 33,486 | | | |
| | | |
Total expenses | | | 11,507,727 | | | |
Less waivers and reimbursements of expenses | | | (26,791 | ) | | |
| | | |
Net expenses | | | 11,480,936 | | | |
|
Net Investment Loss | | | (4,718,870 | ) | | |
|
Realized and Unrealized Gain | | | | | | |
Net realized gain on unaffiliated companies | | | 92,097,896 | | | |
|
Net change in unrealized appreciation/depreciation on investments | | | 214,680,157 | | | |
|
Net Increase in Net Assets Resulting from Operations | | $ | 302,059,183 | | | |
| | | |
See accompanying Notes to Financial Statements.
17 OPPENHEIMER DISCOVERY FUND
STATEMENTS OF CHANGES IN NET ASSETS
| | | | | | | | |
| | | Six Months Ended | | | | |
| | | March 31, 2015
(Unaudited) | | | Year Ended September 30, 2014 | |
Operations | | | | | | | | |
Net investment loss | | $ | (4,718,870 | ) | | $ | (20,541,798 | ) |
Net realized gain | | | 92,097,896 | | | | 249,024,873 | |
Net change in unrealized appreciation/depreciation | | | 214,680,157 | | | | (281,144,234 | ) |
Net increase (decrease) in net assets resulting from operations | | | 302,059,183 | | | | (52,661,159 | ) |
| | | | | | | | |
Dividends and/or Distributions to Shareholders | | | | | | | | |
Distributions from net realized gain: | | | | | | | | |
Class A | | | (118,870,330 | ) | | | (114,411,303 | ) |
Class B | | | (4,969,299 | ) | | | (6,012,165 | ) |
Class C | | | (18,860,323 | ) | | | (17,210,691 | ) |
Class I | | | (4,490,360 | ) | | | (3,420,454 | ) |
Class R1 | | | (5,339,440 | ) | | | (4,928,061 | ) |
Class Y | | | (37,400,883 | ) | | | (29,113,799 | ) |
| | | (189,930,635 | ) | | | (175,096,473 | ) |
| | | | | | | | |
Beneficial Interest Transactions | | | | | | | | |
Net increase (decrease) in net assets resulting from beneficial interest transactions: | | | | | | | | |
Class A | | | 36,645,522 | | | | (115,060,919 | ) |
Class B | | | (6,630,131 | ) | | | (16,544,716 | ) |
Class C | | | 4,912,975 | | | | (5,103,017 | ) |
Class I | | | 19,250,642 | | | | 8,228,755 | |
Class R1 | | | (1,061,502 | ) | | | (1,566,660 | ) |
Class Y | | | (26,664,579 | ) | | | 79,847,966 | |
| | | 26,452,927 | | | | (50,198,591 | ) |
| | | | | | | | |
Net Assets | | | | | | | | |
Total increase (decrease) | | | 138,581,475 | | | | (277,956,223 | ) |
Beginning of period | | | 2,012,909,479 | | | | 2,290,865,702 | |
| | |
End of period (including accumulated net investment loss of $19,520,709 and $14,801,839, respectively) | | $ | 2,151,490,954 | | | $ | 2,012,909,479 | |
| | | | | | | | |
1. Effective July 1, 2014, Class N shares were renamed Class R. See Note 1 of the accompanying Notes.
See accompanying Notes to Financial Statements.
18 OPPENHEIMER DISCOVERY FUND
FINANCIAL HIGHLIGHTS
| | | | | | | | | | | | | | | | | | | | | | | | | | |
| Class A | | Six Months
Ended
March 31,
2015
(Unaudited) | | | Year Ended
September 30,
2014 | | | Year Ended
September 30,
2013 | | | Year Ended
September 28,
20121 | | | Year Ended
September 30,
2011 | | | Year Ended
September 30,
2010 | | | |
|
Per Share Operating Data | | | | | | | | | | | | | | | | | | | | | | | | | | |
Net asset value, beginning of period | | $ | 72.35 | | | $ | 79.80 | | | $ | 65.78 | | | $ | 52.70 | | | $ | 47.67 | | | $ | 40.87 | | | |
|
Income (loss) from investment operations: | | | | | | | | | | | | | | | | | | | | | | | | | | |
Net investment loss2 | | | (0.16 | )3 | | | (0.66 | ) | | | (0.47 | ) | | | (0.35 | )4 | | | (0.62 | ) | | | (0.49 | ) | | |
Net realized and unrealized gain (loss) | | | 10.98 | | | | (0.80 | ) | | | 18.89 | | | | 16.61 | | | | 5.65 | | | | 7.29 | | | |
| | | |
Total from investment operations | | | 10.82 | | | | (1.46 | ) | | | 18.42 | | | | 16.26 | | | | 5.03 | | | | 6.80 | | | |
|
| Dividends and/or distributions to shareholders: | | | | | | | | | | | | | | | | | | | | | | | | | | |
Distributions from net realized gain | | | (7.01 | ) | | | (5.99 | ) | | | (4.40 | ) | | | (3.18 | ) | | | 0.00 | | | | 0.00 | | | |
|
Net asset value, end of period | | $ | 76.16 | | | $ | 72.35 | | | $ | 79.80 | | | $ | 65.78 | | | $ | 52.70 | | | $ | 47.67 | | | |
| | | |
|
|
Total Return, at Net Asset Value5 | | | 15.82% | | | | (2.21)% | | | | 30.58% | | | | 31.86% | | | | 10.55% | | | | 16.64% | | | |
|
Ratios/Supplemental Data | | | | | | | | | | | | | | | | | | | | | | | | | | |
Net assets, end of period (in thousands) | | $ | 1,367,395 | | | $ | 1,258,537 | | | $ | 1,517,368 | | | $ | 1,142,202 | | | $ | 822,073 | | | $ | 729,419 | | | |
|
Average net assets (in thousands) | | $ | 1,297,305 | | | $ | 1,469,328 | | | $ | 1,259,365 | | | $ | 1,002,017 | | | $ | 930,632 | | | $ | 718,175 | | | |
|
Ratios to average net assets:6 | | | | | | | | | | | | | | | | | | | | | | | | | | |
Net investment loss | | | (0.44)%3 | | | | (0.87)% | | | | (0.70)% | | | | (0.58)%4 | | | | (1.04)% | | | | (1.11)% | | | |
Total expenses7 | | | 1.10% | | | | 1.12% | | | | 1.24% | | | | 1.29% | | | | 1.30% | | | | 1.45% | | | |
| Expenses after payments, waivers and/or reimbursements and reduction to custodian expenses | | | 1.10% | | | | 1.12% | | | | 1.22% | | | | 1.24% | | | | 1.30% | | | | 1.34% | | | |
|
Portfolio turnover rate | | | 48% | | | | 87% | | | | 86% | | | | 100% | | | | 112% | | | | 111% | | | |
19 OPPENHEIMER DISCOVERY FUND
FINANCIAL HIGHLIGHTS Continued
1. September 28, 2012 represents the last business day of the Fund’s reporting period.
2. Per share amounts calculated based on the average shares outstanding during the period.
3. Net investment loss per share and the net investment loss ratio include $0.09 and 0.24%, respectively, resulting from a special dividend from HSN, Inc. in February 2015.
4. Net investment loss per share and the net investment loss ratio include $0.23 and 0.38%, respectively, resulting from a special dividend from H&E Equipment Services, Inc. in September 2012.
5. Assumes an initial investment on the business day before the first day of the fiscal period, with all dividends and distributions reinvested in additional shares on the reinvestment date, and redemption at the net asset value calculated on the last business day of the fiscal period. Sales charges are not reflected in the total returns. Total returns are not annualized for periods less than one full year. Returns do not reflect the deduction of taxes that a shareholder would pay on fund distributions or the redemption of fund shares. The returns do not include adjustments in accordance with generally accepted accounting principles required at the period end for financial reporting purposes.
6. Annualized for periods less than one full year.
7. Total expenses including indirect expenses from affiliated fund fees and expenses were as follows:
| | | | | | | | |
| | Six Months Ended March 31, 2015 | | | 1.10 | % | | |
| | Year Ended September 30, 2014 | | | 1.12 | % | | |
| | Year Ended September 30, 2013 | | | 1.24 | % | | |
| | Year Ended September 28, 2012 | | | 1.29 | % | | |
| | Year Ended September 30, 2011 | | | 1.30 | % | | |
| | Year Ended September 30, 2010 | | | 1.45 | % | | |
See accompanying Notes to Financial Statements.
20 OPPENHEIMER DISCOVERY FUND
| | | | | | | | | | | | | | | | | | | | | | | | | | |
| Class B | | Six Months
Ended
March 31,
2015
(Unaudited) | | | Year Ended
September 30,
2014 | | | Year Ended
September 30,
2013 | | | Year Ended
September 28,
20121 | | | Year Ended
September 30,
2011 | | | Year Ended
September 30,
2010 | | | |
|
Per Share Operating Data | | | | | | | | | | | | | | | | | | | | | | | | | | |
Net asset value, beginning of period | | $ | 57.21 | | | $ | 64.82 | | | $ | 54.73 | | | $ | 44.67 | | | $ | 40.72 | | | $ | 35.18 | | | |
|
Income (loss) from investment operations: | | | | | | | | | | | | | | | | | | | | | | | | | | |
Net investment loss2 | | | (0.34 | )3 | | | (1.05 | ) | | | (0.82 | ) | | | (0.72 | )4 | | | (0.92 | ) | | | (0.72 | ) | | |
Net realized and unrealized gain (loss) | | | 8.54 | | | | (0.57 | ) | | | 15.31 | | | | 13.96 | | | | 4.87 | | | | 6.26 | | | |
| | | |
Total from investment operations | | | 8.20 | | | | (1.62 | ) | | | 14.49 | | | | 13.24 | | | | 3.95 | | | | 5.54 | | | |
|
Dividends and/or distributions to shareholders: | | | | | | | | | | | | | | | | | | | | | | | | | | |
Distributions from net realized gain | | | (7.01 | ) | | | (5.99 | ) | | | (4.40 | ) | | | (3.18 | ) | | | 0.00 | | | | 0.00 | | | |
|
Net asset value, end of period | | $ | 58.40 | | | $ | 57.21 | | | $ | 64.82 | | | $ | 54.73 | | | $ | 44.67 | | | $ | 40.72 | | | |
| | | |
|
|
Total Return, at Net Asset Value5 | | | 15.38% | | | | (2.96)% | | | | 29.48% | | | | 30.73% | | | | 9.70% | | | | 15.75% | | | |
|
Ratios/Supplemental Data | | | | | | | | | | | | | | | | | | | | | | | | | | |
Net assets, end of period (in thousands) | | $ | 40,037 | | | $ | 45,662 | | | $ | 69,220 | | | $ | 70,099 | | | $ | 65,720 | | | $ | 77,831 | | | |
|
Average net assets (in thousands) | | $ | 42,162 | | | $ | 59,224 | | | $ | 64,723 | | | $ | 69,972 | | | $ | 86,703 | | | $ | 83,147 | | | |
|
Ratios to average net assets:6 | | | | | | | | | | | | | | | | | | | | | | | | | | |
Net investment loss | | | (1.21)%3 | | | | (1.71)% | | | | (1.52)% | | | | (1.44)%4 | | | | (1.84)% | | | | (1.90)% | | | |
Total expenses7 | | | 1.86% | | | | 1.96% | | | | 2.21% | | | | 2.30% | | | | 2.35% | | | | 2.52% | | | |
| Expenses after payments, waivers and/or reimbursements and reduction to custodian expenses | | | 1.86% | | | | 1.96% | | | | 2.05% | | | | 2.07% | | | | 2.08% | | | | 2.13% | | | |
|
Portfolio turnover rate | | | 48% | | | | 87% | | | | 86% | | | | 100% | | | | 112% | | | | 111% | | | |
1. September 28, 2012 represents the last business day of the Fund’s reporting period.
2. Per share amounts calculated based on the average shares outstanding during the period.
3. Net investment loss per share and the net investment loss ratio include $0.07 and 0.24%, respectively, resulting from a special dividend from HSN, Inc. in February 2015.
4. Net investment loss per share and the net investment loss ratio include $0.19 and 0.38%, respectively, resulting from a special dividend from H&E Equipment Services, Inc. in September 2012.
5. Assumes an initial investment on the business day before the first day of the fiscal period, with all dividends and distributions reinvested in additional shares on the reinvestment date, and redemption at the net asset value calculated on the last business day of the fiscal period. Sales charges are not reflected in the total returns. Total returns are not annualized for periods less than one full year. Returns do not reflect the deduction of taxes that a shareholder would pay on fund distributions or the redemption of fund shares. The returns do not include adjustments in accordance with generally accepted accounting principles required at the period end for financial reporting purposes.
6. Annualized for periods less than one full year.
7. Total expenses including indirect expenses from affiliated fund fees and expenses were as follows:
| | | | | | | | |
| | Six Months Ended March 31, 2015 | | | 1.86 | % | | |
| | Year Ended September 30, 2014 | | | 1.96 | % | | |
| | Year Ended September 30, 2013 | | | 2.21 | % | | |
| | Year Ended September 28, 2012 | | | 2.30 | % | | |
| | Year Ended September 30, 2011 | | | 2.35 | % | | |
| | Year Ended September 30, 2010 | | | 2.52 | % | | |
See accompanying Notes to Financial Statements.
21 OPPENHEIMER DISCOVERY FUND
FINANCIAL HIGHLIGHTS Continued
| | | | | | | | | | | | | | | | | | | | | | | | | | |
| Class C | | Six Months
Ended
March 31,
2015
(Unaudited) | | | Year Ended
September 30,
2014 | | | Year Ended
September 30,
2013 | | | Year Ended
September 28,
20121 | | | Year Ended
September 30,
2011 | | | Year Ended
September 30,
2010 | | | |
|
Per Share Operating Data | | | | | | | | | | | | | | | | | | | | | | | | | | |
Net asset value, beginning of period | | $ | 58.89 | | | $ | 66.50 | | | $ | 56.01 | | | $ | 45.63 | | | $ | 41.60 | | | $ | 35.93 | | | |
|
Income (loss) from investment operations: | | | | | | | | | | | | | | | | | | | | | | | | | | |
Net investment loss2 | | | (0.35 | )3 | | | (1.02 | ) | | | (0.83 | ) | | | (0.71 | )4 | | | (0.92 | ) | | | (0.73 | ) | | |
Net realized and unrealized gain (loss) | | | 8.81 | | | | (0.60 | ) | | | 15.72 | | | | 14.27 | | | | 4.95 | | | | 6.40 | | | |
| | | |
Total from investment operations | | | 8.46 | | | | (1.62 | ) | | | 14.89 | | | | 13.56 | | | | 4.03 | | | | 5.67 | | | |
|
Dividends and/or distributions to shareholders: | | | | | | | | | | | | | | | | | | | | | | | | | | |
Distributions from net realized gain | | | (7.01 | ) | | | (5.99 | ) | | | (4.40 | ) | | | (3.18 | ) | | | 0.00 | | | | 0.00 | | | |
|
Net asset value, end of period | | $ | 60.34 | | | $ | 58.89 | | | $ | 66.50 | | | $ | 56.01 | | | $ | 45.63 | | | $ | 41.60 | | | |
| | | |
|
|
Total Return, at Net Asset Value5 | | | 15.40% | | | | (2.94)% | | | | 29.54% | | | | 30.83% | | | | 9.69% | | | | 15.78% | | | |
|
Ratios/Supplemental Data | | | | | | | | | | | | | | | | | | | | | | | | | | |
Net assets, end of period (in thousands) | | $ | 173,647 | | | $ | 163,675 | | | $ | 191,061 | | | $ | 142,944 | | | $ | 108,443 | | | $ | 90,710 | | | |
|
Average net assets (in thousands) | | $ | 166,716 | | | $ | 187,330 | | | $ | 158,132 | | | $ | 127,254 | | | $ | 117,476 | | | $ | 88,870 | | | |
|
Ratios to average net assets:6 | | | | | | | | | | | | | | | | | | | | | | | | | | |
Net investment loss | | | (1.20)%3 | | | | (1.62)% | | | | (1.49)% | | | | (1.38)%4 | | | | (1.80)% | | | | (1.87)% | | | |
Total expenses7 | | | 1.86% | | | | 1.88% | | | | 2.00% | | | | 2.07% | | | | 2.11% | | | | 2.30% | | | |
| Expenses after payments, waivers and/or reimbursements and reduction to custodian expenses | | | 1.86% | | | | 1.87% | | | | 2.00% | | | | 2.04% | | | | 2.05% | | | | 2.10% | | | |
|
Portfolio turnover rate | | | 48% | | | | 87% | | | | 86% | | | | 100% | | | | 112% | | | | 111% | | | |
1. September 28, 2012 represents the last business day of the Fund’s reporting period.
2. Per share amounts calculated based on the average shares outstanding during the period.
3. Net investment loss per share and the net investment loss ratio include $0.07 and 0.24%, respectively, resulting from a special dividend from HSN, Inc. in February 2015.
4. Net investment loss per share and the net investment loss ratio include $0.20 and 0.38%, respectively, resulting from a special dividend from H&E Equipment Services, Inc. in September 2012.
5. Assumes an initial investment on the business day before the first day of the fiscal period, with all dividends and distributions reinvested in additional shares on the reinvestment date, and redemption at the net asset value calculated on the last business day of the fiscal period. Sales charges are not reflected in the total returns. Total returns are not annualized for periods less than one full year. Returns do not reflect the deduction of taxes that a shareholder would pay on fund distributions or the redemption of fund shares. The returns do not include adjustments in accordance with generally accepted accounting principles required at the period end for financial reporting purposes.
6. Annualized for periods less than one full year.
7. Total expenses including indirect expenses from affiliated fund fees and expenses were as follows:
| | | | | | | | |
| | Six Months Ended March 31, 2015 | | | 1.86 | % | | |
| | Year Ended September 30, 2014 | | | 1.88 | % | | |
| | Year Ended September 30, 2013 | | | 2.00 | % | | |
| | Year Ended September 28, 2012 | | | 2.07 | % | | |
| | Year Ended September 30, 2011 | | | 2.11 | % | | |
| | Year Ended September 30, 2010 | | | 2.30 | % | | |
See accompanying Notes to Financial Statements.
22 OPPENHEIMER DISCOVERY FUND
| | | | | | | | | | | | | | | | | | |
| Class I | | Six Months
Ended
March 31,
2015
(Unaudited) | | | Year Ended
September 30,
2014 | | | Year Ended
September 30,
2013 | | | Period Ended
September 28,
20121,2 | | | |
|
Per Share Operating Data | | | | | | | | | | | | | | | | | | |
Net asset value, beginning of period | | $ | 78.88 | | | $ | 86.11 | | | $ | 70.26 | | | $ | 61.45 | | | |
|
Income (loss) from investment operations: | | | | | | | | | | | | | | | | | | |
Net investment income (loss)3 | | | 0.01 | 4 | | | (0.34 | ) | | | (0.21 | ) | | | 0.06 | 5 | | |
Net realized and unrealized gain (loss) | | | 12.03 | | | | (0.90 | ) | | | 20.46 | | | | 8.75 | | | |
| | | |
Total from investment operations | | | 12.04 | | | | (1.24 | ) | | | 20.25 | | | | 8.81 | | | |
|
Dividends and/or distributions to shareholders: | | | | | | | | | | | | | | | | | | |
Distributions from net realized gain | | | (7.01 | ) | | | (5.99 | ) | | | (4.40 | ) | | | 0.00 | | | |
|
Net asset value, end of period | | $ | 83.91 | | | $ | 78.88 | | | $ | 86.11 | | | $ | 70.26 | | | |
| | | |
|
|
Total Return, at Net Asset Value6 | | | 16.06% | | | | (1.75)% | | | | 31.27% | | | | 14.36% | | | |
|
Ratios/Supplemental Data | | | | | | | | | | | | | | | | | | |
Net assets, end of period (in thousands) | | $ | 76,125 | | | $ | 51,668 | | | $ | 48,274 | | | $ | 11 | | | |
|
Average net assets (in thousands) | | $ | 61,627 | | | $ | 51,768 | | | $ | 29,818 | | | $ | 11 | | | |
|
Ratios to average net assets:7 | | | | | | | | | | | | | | | | | | |
Net investment income (loss) | | | 0.03%4 | | | | (0.41)% | | | | (0.29)% | | | | 0.13%5 | | | |
Total expenses8 | | | 0.67% | | | | 0.67% | | | | 0.68% | | | | 0.69% | | | |
| Expenses after payments, waivers and/or reimbursements and reduction to custodian expenses | | | 0.67% | | | | 0.67% | | | | 0.68% | | | | 0.69% | | | |
|
Portfolio turnover rate | | | 48% | | | | 87% | | | | 86% | | | | 100% | | | |
1. September 28, 2012 represents the last business day of the Fund’s reporting period.
2. For the period from January 27, 2012 (inception of offering) to September 28, 2012.
3. Per share amounts calculated based on the average shares outstanding during the period.
4. Net investment loss per share and the net investment loss ratio include $0.10 and 0.24%, respectively, resulting from a special dividend from HSN, Inc. in February 2015.
5. Net investment loss per share and the net investment loss ratio include $0.25 and 0.57%, respectively, resulting from a special dividend from H&E Equipment Services, Inc. in September 2012.
6. Assumes an initial investment on the business day before the first day of the fiscal period, with all dividends and distributions reinvested in additional shares on the reinvestment date, and redemption at the net asset value calculated on the last business day of the fiscal period. Sales charges are not reflected in the total returns. Total returns are not annualized for periods less than one full year. Returns do not reflect the deduction of taxes that a shareholder would pay on fund distributions or the redemption of fund shares. The returns do not include adjustments in accordance with generally accepted accounting principles required at the period end for financial reporting purposes.
7. Annualized for periods less than one full year.
8. Total expenses including indirect expenses from affiliated fund fees and expenses were as follows:
| | | | | | | | |
| | Six Months Ended March 31, 2015 | | | 0.67 | % | | |
| | Year Ended September 30, 2014 | | | 0.67 | % | | |
| | Year Ended September 30, 2013 | | | 0.68 | % | | |
| | Period Ended September 28, 2012 | | | 0.69 | % | | |
See accompanying Notes to Financial Statements.
23 OPPENHEIMER DISCOVERY FUND
FINANCIAL HIGHLIGHTS Continued
| | | | | | | | | | | | | | | | | | | | | | | | | | |
| Class R | | Six Months
Ended
March 31,
2015
(Unaudited) | | | Year Ended
September 30,
2014 | | | Year Ended
September 30,
2013 | | | Year Ended
September 28,
20121 | | | Year Ended
September 30,
2011 | | | Year Ended
September 30,
2010 | | | |
|
Per Share Operating Data | | | | | | | | | | | | | | | | | | | | | | | | | | |
Net asset value, beginning of period | | $ | 69.02 | | | $ | 76.59 | | | $ | 63.51 | | | $ | 51.12 | | | $ | 46.36 | | | $ | 39.83 | | | |
|
Income (loss) from investment operations: | | | | | | | | | | | | | | | | | | | | | | | | | | |
Net investment loss2 | | | (0.24 | )3 | | | (0.83 | ) | | | (0.65 | ) | | | (0.51 | )4 | | | (0.74 | ) | | | (0.58 | ) | | |
Net realized and unrealized gain (loss) | | | 10.45 | | | | (0.75 | ) | | | 18.13 | | | | 16.08 | | | | 5.50 | | | | 7.11 | | | |
| | | |
Total from investment operations | | | 10.21 | | | | (1.58 | ) | | | 17.48 | | | | 15.57 | | | | 4.76 | | | | 6.53 | | | |
|
Dividends and/or distributions to shareholders: | | | | | | | | | | | | | | | | | | | | | | | | | | |
Distributions from net realized gain | | | (7.01 | ) | | | (5.99 | ) | | | (4.40 | ) | | | (3.18 | ) | | | 0.00 | | | | 0.00 | | | |
|
Net asset value, end of period | | $ | 72.22 | | | $ | 69.02 | | | $ | 76.59 | | | $ | 63.51 | | | $ | 51.12 | | | $ | 46.36 | | | |
| | | |
|
|
Total Return, at Net Asset Value5 | | | 15.66% | | | | (2.45)% | | | | 30.17% | | | | 31.49% | | | | 10.27% | | | | 16.40% | | | |
|
Ratios/Supplemental Data | | | | | | | | | | | | | | | | | | | | | | | | | | |
Net assets, end of period (in thousands) | | $ | 56,833 | | | $ | 55,092 | | | $ | 62,994 | | | $ | 44,516 | | | $ | 34,945 | | | $ | 27,823 | | | |
|
Average net assets (in thousands) | | $ | 55,569 | | | $ | 62,176 | | | $ | 50,464 | | | $ | 40,753 | | | $ | 36,695 | | | $ | 26,676 | | | |
|
Ratios to average net assets:6 | | | | | | | | | | | | | | | | | | | | | | | | | | |
Net investment loss | | | (0.70)%3 | | | | (1.14)% | | | | (1.01)% | | | | (0.89)%4 | | | | (1.29)% | | | | (1.35)% | | | |
Total expenses7 | | | 1.36% | | | | 1.39% | | | | 1.51% | | | | 1.55% | | | | 1.55% | | | | 1.73% | | | |
| Expenses after payments, waivers and/or reimbursements and reduction to custodian expenses | | | 1.36% | | | | 1.39% | | | | 1.51% | | | | 1.54% | | | | 1.54% | | | | 1.57% | | | |
|
Portfolio turnover rate | | | 48% | | | | 87% | | | | 86% | | | | 100% | | | | 112% | | | | 111% | | | |
1. September 28, 2012 represents the last business day of the Fund’s reporting period.
2. Per share amounts calculated based on the average shares outstanding during the period.
3. Net investment loss per share and the net investment loss ratio include $0.08 and 0.24%, respectively, resulting from a special dividend from HSN, Inc. in February 2015.
4. Net investment loss per share and the net investment loss ratio include $0.22 and 0.38%, respectively, resulting from a special dividend from H&E Equipment Services, Inc. in September 2012.
5. Assumes an initial investment on the business day before the first day of the fiscal period, with all dividends and distributions reinvested in additional shares on the reinvestment date, and redemption at the net asset value calculated on the last business day of the fiscal period. Sales charges are not reflected in the total returns. Total returns are not annualized for periods less than one full year. Returns do not reflect the deduction of taxes that a shareholder would pay on fund distributions or the redemption of fund shares. The returns do not include adjustments in accordance with generally accepted accounting principles required at the period end for financial reporting purposes.
6. Annualized for periods less than one full year.
7. Total expenses including indirect expenses from affiliated fund fees and expenses were as follows:
| | | | | | | | |
| | Six Months Ended March 31, 2015 | | | 1.36 | % | | |
| | Year Ended September 30, 2014 | | | 1.39 | % | | |
| | Year Ended September 30, 2013 | | | 1.51 | % | | |
| | Year Ended September 28, 2012 | | | 1.55 | % | | |
| | Year Ended September 30, 2011 | | | 1.55 | % | | |
| | Year Ended September 30, 2010 | | | 1.73 | % | | |
See accompanying Notes to Financial Statements.
24 OPPENHEIMER DISCOVERY FUND
| | | | | | | | | | | | | | | | | | | | | | | | | | |
| Class Y | | Six Months
Ended
March 31,
2015
(Unaudited) | | | Year Ended
September 30,
2014 | | | Year Ended
September 30,
2013 | | | Year Ended
September 28,
20121 | | | Year Ended
September 30,
2011 | | | Year Ended
September 30,
2010 | | | |
|
Per Share Operating Data | | | | | | | | | | | | | | | | | | | | | | | | | | |
Net asset value, beginning of period | | $ | 78.42 | | | $ | 85.80 | | | $ | 70.16 | | | $ | 55.83 | | | $ | 50.30 | | | $ | 42.92 | | | |
|
Income (loss) from investment operations: | | | | | | | | | | | | | | | | | | | | | | | | | | |
Net investment loss2 | | | (0.08 | )3 | | | (0.50 | ) | | | (0.31 | ) | | | (0.11 | )4 | | | (0.38 | ) | | | (0.29 | ) | | |
Net realized and unrealized gain (loss) | | | 11.97 | | | | (0.89 | ) | | | 20.35 | | | | 17.62 | | | | 5.91 | | | | 7.67 | | | |
| | | |
Total from investment operations | | | 11.89 | | | | (1.39 | ) | | | 20.04 | | | | 17.51 | | | | 5.53 | | | | 7.38 | | | |
|
Dividends and/or distributions to shareholders: | | | | | | | | | | | | | | | | | | | | | | | | | | |
Distributions from net realized gain | | | (7.01 | ) | | | (5.99 | ) | | | (4.40 | ) | | | (3.18 | ) | | | 0.00 | | | | 0.00 | | | |
|
Net asset value, end of period | | $ | 83.30 | | | $ | 78.42 | | | $ | 85.80 | | | $ | 70.16 | | | $ | 55.83 | | | $ | 50.30 | | | |
| | | |
|
|
Total Return, at Net Asset Value5 | | | 15.97% | | | | (1.96)% | | | | 30.99% | | | | 32.34% | | | | 11.00% | | | | 17.19% | | | |
|
Ratios/Supplemental Data | | | | | | | | | | | | | | | | | | | | | | | | | | |
Net assets, end of period (in thousands) | | $ | 437,454 | | | $ | 438,275 | | | $ | 401,949 | | | $ | 157,892 | | | $ | 75,912 | | | $ | 25,772 | | | |
|
Average net assets (in thousands) | | $ | 431,109 | | | $ | 467,755 | | | $ | 271,295 | | | $ | 110,845 | | | $ | 61,766 | | | $ | 70,285 | | | |
|
Ratios to average net assets:6 | | | | | | | | | | | | | | | | | | | | | | | | | | |
Net investment loss | | | (0.21)%3 | | | | (0.61)% | | | | (0.43)% | | | | (0.17)%4 | | | | (0.60)% | | | | (0.62)% | | | |
Total expenses7 | | | 0.86% | | | | 0.87% | | | | 0.91% | | | | 0.90% | | | | 0.86% | | | | 0.83% | | | |
| Expenses after payments, waivers and/or reimbursements and reduction to custodian expenses | | | 0.86% | | | | 0.87% | | | | 0.91% | | | | 0.90% | | | | 0.86% | | | | 0.83% | | | |
|
Portfolio turnover rate | | | 48% | | | | 87% | | | | 86% | | | | 100% | | | | 112% | | | | 111% | | | |
1. September 28, 2012 represents the last business day of the Fund’s reporting period.
2. Per share amounts calculated based on the average shares outstanding during the period.
3. Net investment loss per share and the net investment loss ratio include $0.10 and 0.24%, respectively, resulting from a special dividend from HSN, Inc. in February 2015.
4. Net investment loss per share and the net investment loss ratio include $0.25 and 0.38%, respectively, resulting from a special dividend from H&E Equipment Services, Inc. in September 2012.
5. Assumes an initial investment on the business day before the first day of the fiscal period, with all dividends and distributions reinvested in additional shares on the reinvestment date, and redemption at the net asset value calculated on the last business day of the fiscal period. Sales charges are not reflected in the total returns. Total returns are not annualized for periods less than one full year. Returns do not reflect the deduction of taxes that a shareholder would pay on fund distributions or the redemption of fund shares. The returns do not include adjustments in accordance with generally accepted accounting principles required at the period end for financial reporting purposes.
6. Annualized for periods less than one full year.
7. Total expenses including indirect expenses from affiliated fund fees and expenses were as follows:
| | | | | | | | |
| | Six Months Ended March 31, 2015 | | | 0.86 | % | | |
| | Year Ended September 30, 2014 | | | 0.87 | % | | |
| | Year Ended September 30, 2013 | | | 0.91 | % | | |
| | Year Ended September 28, 2012 | | | 0.90 | % | | |
| | Year Ended September 30, 2011 | | | 0.86 | % | | |
| | Year Ended September 30, 2010 | | | 0.83 | % | | |
See accompanying Notes to Financial Statements.
25 OPPENHEIMER DISCOVERY FUND
NOTES TO FINANCIAL STATEMENTS March 31, 2015 Unaudited
1. Organization
Oppenheimer Discovery Fund (the “Fund”) is a diversified open-end management investment company registered under the Investment Company Act of 1940 (“1940 Act”), as amended. The Fund’s investment objective is to seek capital appreciation. The Fund’s investment adviser is OFI Global Asset Management, Inc. (“OFI Global” or the “Manager”), a wholly-owned subsidiary of OppenheimerFunds, Inc. (“OFI” or the “Sub-Adviser”). The Manager has entered into a sub-advisory agreement with OFI.
The Fund offers Class A, Class C, Class I, Class R and Class Y shares, and previously offered Class B shares for new purchase through June 29, 2012. Subsequent to that date, no new purchases of Class B shares are permitted, however reinvestment of dividend and/or capital gain distributions and exchanges of Class B shares into and from other Oppenheimer funds will be allowed. As of July 1, 2014, Class N shares were renamed Class R shares. Class N shares subject to a contingent deferred sales charge (“CDSC”) on July 1, 2014, will continue to be subject to a CDSC after the shares are renamed. Purchases of Class R shares occurring on or after July 1, 2014, will not be subject to a CDSC upon redemption. Class A shares are sold at their offering price, which is normally net asset value plus a front-end sales charge. Class C and Class R shares are sold, and Class B shares were sold, without a front-end sales charge but may be subject to a contingent deferred sales charge (“CDSC”). Class R shares are sold only through retirement plans. Retirement plans that offer Class R shares may impose charges on those accounts. Class I and Class Y shares are sold to certain institutional investors or intermediaries without either a front-end sales charge or a CDSC, however, the intermediaries may impose charges on their accountholders who beneficially own Class I and Class Y shares. All classes of shares have identical rights and voting privileges with respect to the Fund in general and exclusive voting rights on matters that affect that class alone. Earnings, net assets and net asset value per share may differ due to each class having its own expenses, such as transfer and shareholder servicing agent fees and shareholder communications, directly attributable to that class. Class A, B, C and R shares have separate distribution and/or service plans under which they pay fees. Class I and Class Y shares do not pay such fees. Class B shares will automatically convert to Class A shares 72 months after the date of purchase.
The following is a summary of significant accounting policies consistently followed by the Fund.
2. Significant Accounting Policies
Security Valuation. All investments in securities are recorded at their estimated fair value, as described in Note 3.
Allocation of Income, Expenses, Gains and Losses. Income, expenses (other than those attributable to a specific class), gains and losses are allocated on a daily basis to each class of shares based upon the relative proportion of net assets represented by such class. Operating expenses directly attributable to a specific class are charged against the operations of that class.
26 OPPENHEIMER DISCOVERY FUND
2. Significant Accounting Policies (Continued)
Dividends and Distributions to Shareholders. Dividends and distributions to shareholders, which are determined in accordance with income tax regulations and may differ from U.S. generally accepted accounting principles, are recorded on the ex-dividend date. Income and capital gain distributions, if any, are declared and paid annually or at other times as deemed necessary by the Manager.
The tax character of distributions is determined as of the Fund’s fiscal year end. Therefore, a portion of the Fund’s distributions made to shareholders prior to the Fund’s fiscal year end may ultimately be categorized as a tax return of capital.
Investment Income. Dividend income is recorded on the ex-dividend date or upon ex-dividend notification in the case of certain foreign dividends where the ex-dividend date may have passed. Non-cash dividends included in dividend income, if any, are recorded at the fair market value of the securities received. Interest income is recognized on an accrual basis. Discount and premium, which are included in interest income on the Statement of Operations, are amortized or accreted daily.
Custodian Fees. “Custodian fees and expenses” in the Statement of Operations may include interest expense incurred by the Fund on any cash overdrafts of its custodian account during the period. Such cash overdrafts may result from the effects of failed trades in portfolio securities and from cash outflows resulting from unanticipated shareholder redemption activity. The Fund pays interest to its custodian on such cash overdrafts, to the extent they are not offset by positive cash balances maintained by the Fund, at a rate equal to the Federal Funds Rate plus 0.50%. The “Reduction to custodian expenses” line item, if applicable, represents earnings on cash balances maintained by the Fund during the period. Such interest expense and other custodian fees may be paid with these earnings.
Security Transactions. Security transactions are recorded on the trade date. Realized gains and losses on securities sold are determined on the basis of identified cost.
Indemnifications. The Fund’s organizational documents provide current and former Trustees and officers with a limited indemnification against liabilities arising in connection with the performance of their duties to the Fund. In the normal course of business, the Fund may also enter into contracts that provide general indemnifications. The Fund’s maximum exposure under these arrangements is unknown as this would be dependent on future claims that may be made against the Fund. The risk of material loss from such claims is considered remote.
Federal Taxes. The Fund intends to comply with provisions of the Internal Revenue Code applicable to regulated investment companies and to distribute substantially all of its investment company taxable income to shareholders. Therefore, no federal income or excise tax provision is required. The Fund files income tax returns in U.S. federal and applicable state jurisdictions. The statute of limitations on the Fund’s tax return filings generally remain open for the three preceding fiscal reporting period ends.
27 OPPENHEIMER DISCOVERY FUND
NOTES TO FINANCIAL STATEMENTS Unaudited / Continued
2. Significant Accounting Policies (Continued)
During the fiscal year ended September 30, 2014, the Fund utilized $18,358,259 of capital loss carryforward to offset capital gains realized in that fiscal year. Details of the fiscal year ended September 30, 2014 capital loss carryforwards are included in the table below. Capital loss carryforwards with no expiration, if any, must be utilized prior to those with expiration dates. Capital losses with no expiration will be carried forward to future years if not offset by gains.
| | | | |
| Expiring | | | |
2016 | | $ | 36,716,518 | |
As of March 31, 2015, it is estimated that there will be no capital loss carryforwards. The estimated capital loss carryforward represents the carryforward as of the end of the last fiscal year, increased or decreased by capital losses or gains realized in the first six months of the current fiscal year. During the six months ended March 31, 2015, it is estimated that the Fund will utilize $36,716,518 of capital loss carryforward to offset realized capital gains.
Net investment income (loss) and net realized gain (loss) may differ for financial statement and tax purposes. The character of dividends and distributions made during the fiscal year from net investment income or net realized gains are determined in accordance with federal income tax requirements, which may differ from the character of net investment income or net realized gains presented in those financial statements in accordance with GAAP. Also, due to timing of dividends and distributions, the fiscal year in which amounts are distributed may differ from the fiscal year in which the income or net realized gain was recorded by the Fund.
The aggregate cost of securities and other investments and the composition of unrealized appreciation and depreciation of securities and other investments for federal income tax purposes as of March 31, 2015 are noted in the following table. The primary difference between book and tax appreciation or depreciation of securities and other investments, if applicable, is attributable to the tax deferral of losses or tax realization of financial statement unrealized gain or loss.
| | | | |
Federal tax cost of securities | | $ | 1,548,934,832 | |
| | | | |
Gross unrealized appreciation | | $ | 646,716,040 | |
Gross unrealized depreciation | | | (6,993,771) | |
| | | | |
Net unrealized appreciation | | $ | 639,722,269 | |
| | | | |
Use of Estimates. The preparation of financial statements in conformity with accounting principles generally accepted in the United States of America requires management to make estimates and assumptions that affect the reported amounts of assets and liabilities and disclosure of contingent assets and liabilities at the date of the financial statements and the reported amounts of increases and decreases in net assets from operations during the reporting period. Actual results could differ from those estimates.
3. Securities Valuation
The Fund calculates the net asset value of its shares as of the close of the New York Stock Exchange (the “Exchange”), normally 4:00 P.M. Eastern time, on each day the Exchange is open for trading.
28 OPPENHEIMER DISCOVERY FUND
3. Securities Valuation (Continued)
The Fund’s Board has adopted procedures for the valuation of the Fund’s securities and has delegated the day-to-day responsibility for valuation determinations under those procedures to the Manager. The Manager has established a Valuation Committee which is responsible for determining a “fair valuation” for any security for which market quotations are not “readily available.” The Valuation Committee’s fair valuation determinations are subject to review, approval and ratification by the Fund’s Board at its next regularly scheduled meeting covering the calendar quarter in which the fair valuation was determined.
Valuation Methods and Inputs
Securities are valued using unadjusted quoted market prices, when available, as supplied primarily by third party pricing services or dealers.
The following methodologies are used to determine the market value or the fair value of the types of securities described below:
Securities traded on a registered U.S. securities exchange (including exchange-traded derivatives other than futures and futures options) are valued based on the last sale price of the security reported on the principal exchange on which it is traded, prior to the time when the Fund’s assets are valued. In the absence of a sale, the security is valued at the last sale price on the prior trading day, if it is within the spread of the current day’s closing “bid” and “asked” prices, and if not, at the current day’s closing bid price. A security of a foreign issuer traded on a foreign exchange, but not listed on a registered U.S. securities exchange, is valued based on the last sale price on the principal exchange on which the security is traded, as identified by the third party pricing service used by the Manager, prior to the time when the Fund’s assets are valued. If the last sale price is unavailable, the security is valued at the most recent official closing price on the principal exchange on which it is traded. If the last sales price or official closing price for a foreign security is not available, the security is valued at the mean between the bid and asked price per the exchange or, if not available from the exchange, obtained from two dealers. If bid and asked prices are not available from either the exchange or two dealers, the security is valued by using one of the following methodologies (listed in order of priority): (1) using a bid from the exchange, (2) the mean between the bid and asked price as provided by a single dealer, or (3) a bid from a single dealer.
Shares of a registered investment company that are not traded on an exchange are valued at that investment company’s net asset value per share.
Corporate and government debt securities (of U.S. or foreign issuers) and municipal debt securities, event-linked bonds, loans, mortgage-backed securities, collateralized mortgage obligations, and asset-backed securities are valued at the mean between the “bid” and “asked” prices utilizing evaluated prices obtained from third party pricing services or broker-dealers who may use matrix pricing methods to determine the evaluated prices.
Short-term money market type debt securities with a remaining maturity of sixty days or less are valued at cost adjusted by the amortization of discount or premium to maturity (amortized cost), which approximates market value. Short-term debt securities with a remaining maturity in excess of sixty days are valued at the mean between the “bid” and “asked” prices utilizing evaluated prices obtained from third party pricing services or broker-dealers.
29 OPPENHEIMER DISCOVERY FUND
NOTES TO FINANCIAL STATEMENTS Unaudited / Continued
3. Securities Valuation (Continued)
A description of the standard inputs that may generally be considered by the third party pricing vendors in determining their evaluated prices is provided below.
| | |
| Security Type | | Standard inputs generally considered by third-party
pricing vendors |
|
| Corporate debt, government debt, municipal, mortgage-backed and asset-backed securities | | Reported trade data, broker-dealer price quotations, benchmark yields, issuer spreads on comparable securities, the credit quality, yield, maturity, and other appropriate factors. |
|
Loans | | Information obtained from market participants regarding reported trade data and broker-dealer price quotations. |
|
Event-linked bonds | | Information obtained from market participants regarding reported trade data and broker-dealer price quotations. |
If a market value or price cannot be determined for a security using the methodologies described above, or if, in the “good faith” opinion of the Manager, the market value or price obtained does not constitute a “readily available market quotation,” or a significant event has occurred that would materially affect the value of the security, the security is fair valued either (i) by a standardized fair valuation methodology applicable to the security type or the significant event as previously approved by the Valuation Committee and the Fund’s Board or (ii) as determined in good faith by the Manager’s Valuation Committee. The Valuation Committee considers all relevant facts that are reasonably available, through either public information or information available to the Manager, when determining the fair value of a security. Fair value determinations by the Manager are subject to review, approval and ratification by the Fund’s Board at its next regularly scheduled meeting covering the calendar quarter in which the fair valuation was determined. Those fair valuation standardized methodologies include, but are not limited to, valuing securities at the last sale price or initially at cost and subsequently adjusting the value based on: changes in company specific fundamentals, changes in an appropriate securities index, or changes in the value of similar securities which may be further adjusted for any discounts related to security-specific resale restrictions. When possible, such methodologies use observable market inputs such as unadjusted quoted prices of similar securities, observable interest rates, currency rates and yield curves. The methodologies used for valuing securities are not necessarily an indication of the risks associated with investing in those securities nor can it be assured that the Fund can obtain the fair value assigned to a security if it were to sell the security.
To assess the continuing appropriateness of security valuations, the Manager, or its third party service provider who is subject to oversight by the Manager, regularly compares prior day prices, prices on comparable securities, and sale prices to the current day prices and challenges those prices exceeding certain tolerance levels with the third party pricing service or broker source. For those securities valued by fair valuations, whether through a standardized fair valuation methodology or a fair valuation determination, the Valuation Committee reviews and affirms the reasonableness of the valuations based on such methodologies and fair valuation determinations on a regular basis after considering all relevant information that is reasonably available.
30 OPPENHEIMER DISCOVERY FUND
3. Securities Valuation (Continued)
Classifications
Each investment asset or liability of the Fund is assigned a level at measurement date based on the significance and source of the inputs to its valuation. Various data inputs are used in determining the value of each of the Fund’s investments as of the reporting period end. These data inputs are categorized in the following hierarchy under applicable financial accounting standards:
1) Level 1-unadjusted quoted prices in active markets for identical assets or liabilities (including securities actively traded on a securities exchange)
2) Level 2-inputs other than unadjusted quoted prices that are observable for the asset or liability (such as unadjusted quoted prices for similar assets and market corroborated inputs such as interest rates, prepayment speeds, credit risks, etc.)
3) Level 3-significant unobservable inputs (including the Manager’s own judgments about assumptions that market participants would use in pricing the asset or liability).
The inputs used for valuing securities are not necessarily an indication of the risks associated with investing in those securities.
The table below categorizes amounts that are included in the Fund’s Statement of Assets and Liabilities as of March 31, 2015 based on valuation input level:
| | | | | | | | | | | | | | | | |
| | | Level 1—
Unadjusted
Quoted Prices | | | Level 2—
Other Significant
Observable
Inputs | | | Level 3—
Significant
Unobservable
Inputs | | | Value | |
| |
Assets Table | | | | | | | | | | | | | | | | |
Investments, at Value: | | | | | | | | | | | | | | | | |
Common Stocks | | | | | | | | | | | | | | | | |
Consumer Discretionary | | $ | 376,651,353 | | | $ | — | | | $ | — | | | $ | 376,651,353 | |
Consumer Staples | | | 64,650,232 | | | | — | | | | — | | | | 64,650,232 | |
Energy | | | 40,229,068 | | | | — | | | | — | | | | 40,229,068 | |
Financials | | | 159,800,176 | | | | — | | | | — | | | | 159,800,176 | |
Health Care | | | 521,621,243 | | | | — | | | | — | | | | 521,621,243 | |
Industrials | | | 310,982,324 | | | | — | | | | — | | | | 310,982,324 | |
Information Technology | | | 606,635,016 | | | | — | | | | — | | | | 606,635,016 | |
Materials | | | 35,522,730 | | | | — | | | | — | | | | 35,522,730 | |
Investment Company | | | 72,564,959 | | | | — | | | | — | | | | 72,564,959 | |
| | | | |
Total Assets | | $ | 2,188,657,101 | | | $ | — | | | $ | — | | | $ | 2,188,657,101 | |
| | | | |
Forward currency exchange contracts and futures contracts, if any, are reported at their unrealized appreciation/depreciation at measurement date, which represents the change in the contract’s value from trade date. All additional assets and liabilities included in the above table are reported at their market value at measurement date.
4. Investments and Risks
Investment in Oppenheimer Institutional Money Market Fund. The Fund is permitted to invest daily available cash balances in an affiliated money market fund. The Fund may invest the available cash in Class E shares of Oppenheimer Institutional Money Market Fund (“IMMF”) to seek current income while preserving liquidity or for defensive purposes. IMMF is
31 OPPENHEIMER DISCOVERY FUND
NOTES TO FINANCIAL STATEMENTS Unaudited / Continued
4. Investments and Risks (Continued)
a registered open-end management investment company, regulated as a money market fund under the 1940 Act. The Manager is the investment adviser of IMMF, and the Sub-Adviser provides investment and related advisory services to IMMF. When applicable, the Fund’s investment in IMMF is included in the Statement of Investments. Shares of IMMF are valued at their net asset value per share. As a shareholder, the Fund is subject to its proportional share of IMMF’s Class E expenses, including its management fee. The Manager will waive fees and/or reimburse Fund expenses in an amount equal to the indirect management fees incurred through the Fund’s investment in IMMF.
Equity Security Risk. Stocks and other equity securities fluctuate in price. The value of the Fund’s portfolio may be affected by changes in the equity markets generally. Equity markets may experience significant short-term volatility and may fall sharply at times. Different markets may behave differently from each other and U.S. equity markets may move in the opposite direction from one or more foreign stock markets. Adverse events in any part of the equity or fixed-income markets may have unexpected negative effects on other market segments.
The prices of individual equity securities generally do not all move in the same direction at the same time and a variety of factors can affect the price of a particular company’s securities. These factors may include, but are not limited to, poor earnings reports, a loss of customers, litigation against the company, general unfavorable performance of the company’s sector or industry, or changes in government regulations affecting the company or its industry.
5. Shares of Beneficial Interest
The Fund has authorized an unlimited number of $0.001 par value shares of beneficial interest of each class. Transactions in shares of beneficial interest were as follows:
| | | | | | | | | | | | | | | | | | |
| | | Six Months Ended March 31, 2015 | | | Year Ended September 30, 2014 | | | |
| | | Shares | | | Amount | | | Shares | | | Amount | | | |
|
Class A | | | | | | | | | | | | | | | | | | |
Sold | | | 612,510 | | | $ | 44,480,123 | | | | 1,952,010 | | | $ | 152,631,061 | | | |
Dividends and/or distributions reinvested | | | 1,657,185 | | | | 115,903,528 | | | | 1,467,648 | | | | 111,776,053 | | | |
Redeemed | | | (1,711,446 | ) | | | (123,738,129 | ) | | | (5,039,671 | ) | | | (379,468,033 | ) | | |
| | | |
Net increase (decrease) | | | 558,249 | | | $ | 36,645,522 | | | | (1,620,013 | ) | | $ | (115,060,919 | ) | | |
| | | |
|
|
Class B | | | | | | | | | | | | | | | | | | |
Sold | | | 2,850 | | | $ | 158,096 | | | | 18,669 | | | $ | 1,192,921 | | | |
Dividends and/or distributions reinvested | | | 91,813 | | | | 4,935,863 | | | | 98,545 | | | | 5,972,839 | | | |
Redeemed | | | (207,203 | ) | | | (11,724,090 | ) | | | (387,060 | ) | | | (23,710,476 | ) | | |
| | | |
Net decrease | | | (112,540 | ) | | $ | (6,630,131 | ) | | | (269,846 | ) | | $ | (16,544,716 | ) | | |
| | | |
32 OPPENHEIMER DISCOVERY FUND
5. Shares of Beneficial Interest (Continued)
| | | | | | | | | | | | | | | | | | |
| | | Six Months Ended March 31, 2015 | | | Year Ended September 30, 2014 | | | |
| | | Shares | | | Amount | | | Shares | | | Amount | | | |
|
Class C | | | | | | | | | | | | | | | | | | |
Sold | | | 118,300 | | | $ | 6,838,375 | | | | 293,605 | | | $ | 18,787,931 | | | |
Dividends and/or distributions reinvested | | | 328,255 | | | | 18,231,290 | | | | 266,048 | | | | 16,596,087 | | | |
Redeemed | | | (347,869 | ) | | | (20,156,690 | ) | | | (653,482 | ) | | | (40,487,035 | ) | | |
| | | |
Net increase (decrease) | | | 98,686 | | | $ | 4,912,975 | | | | (93,829 | ) | | $ | (5,103,017 | ) | | |
| | | |
|
|
Class I | | | | | | | | | | | | | | | | | | |
Sold | | | 325,050 | | | $ | 25,058,241 | | | | 208,147 | | | $ | 17,526,895 | | | |
Dividends and/or distributions reinvested | | | 58,339 | | | | 4,489,219 | | | | 41,333 | | | | 3,419,479 | | | |
Redeemed | | | (131,200 | ) | | | (10,296,818 | ) | | | (155,119 | ) | | | (12,717,619 | ) | | |
| | | |
Net increase | | | 252,189 | | | $ | 19,250,642 | | | | 94,361 | | | $ | 8,228,755 | | | |
| | | |
|
|
Class R1 | | | | | | | | | | | | | | | | | | |
Sold | | | 54,557 | | | $ | 3,741,704 | | | | 161,959 | | | $ | 11,976,216 | | | |
Dividends and/or distributions reinvested | | | 76,908 | | | | 5,104,370 | | | | 64,569 | | | | 4,701,866 | | | |
Redeemed | | | (142,629 | ) | | | (9,907,576 | ) | | | (250,829 | ) | | | (18,244,742 | ) | | |
| | | |
Net decrease | | | (11,164 | ) | | $ | (1,061,502 | ) | | | (24,301 | ) | | $ | (1,566,660 | ) | | |
| | | |
|
|
Class Y | | | | | | | | | | | | | | | | | | |
Sold | | | 729,436 | | | $ | 57,730,465 | | | | 2,995,969 | | | $ | 251,026,367 | | | |
Dividends and/or distributions reinvested | | | 477,507 | | | | 36,495,880 | | | | 325,430 | | | | 26,812,173 | | | |
Redeemed | | | (1,544,022 | ) | | | (120,890,924 | ) | | | (2,417,410 | ) | | | (197,990,574 | ) | | |
| | | |
Net increase (decrease) | | | (337,079 | ) | | $ | (26,664,579 | ) | | | 903,989 | | | $ | 79,847,966 | | | |
| | | |
1. Effective July 1, 2014, Class N shares were renamed Class R.
6. Purchases and Sales of Securities
The aggregate cost of purchases and proceeds from sales of securities, other than short-term obligations and investments in IMMF, for the six months ended March 31, 2015 were as follows:
| | | | | | | | | | | | | | |
| | | Purchases | | | | | | | | | Sales | |
| |
Investment securities | | | $970,436,648 | | | | | | | | | | $1,083,818,425 | |
7. Fees and Other Transactions with Affiliates
Management Fees. Under the investment advisory agreement, the Fund pays the Manager a management fee based on the daily net assets of the Fund at an annual rate as shown in the following table:
33 OPPENHEIMER DISCOVERY FUND
NOTES TO FINANCIAL STATEMENTS Unaudited / Continued
7. Fees and Other Transactions with Affiliates (Continued)
| | | | |
| Fee Schedule | | | |
Up to $200 million | | | 0.75 | % |
Next $200 million | | | 0.72 | |
Next $200 million | | | 0.69 | |
Next $200 million | | | 0.66 | |
Next $700 million | | | 0.60 | |
Next $3.5 billion | | | 0.58 | |
Over $5 billion | | | 0.55 | |
The Fund’s management fee for the fiscal six months ended March 31, 2015 was 0.64% of average annual net assets before any applicable waivers.
Sub-Adviser Fees. The Manager has retained the Sub-Adviser to provide the day-to-day portfolio management of the Fund. Under the Sub-Advisory Agreement, the Manager pays the Sub-Adviser an annual fee in monthly installments, equal to a percentage of the investment management fee collected by the Manager from the Fund, which shall be calculated after any investment management fee waivers. The fee paid to the Sub-Adviser is paid by the Manager, not by the Fund.
Transfer Agent Fees. OFI Global (the “Transfer Agent”) serves as the transfer and shareholder servicing agent for the Fund. The Fund pays the Transfer Agent a fee based on annual net assets. Fees incurred and average net assets for each class with respect to these services are detailed in the Statement of Operations and Financial Highlights, respectively.
Sub-Transfer Agent Fees. The Transfer Agent has retained Shareholder Services, Inc., a wholly-owned subsidiary of OFI (the “Sub-Transfer Agent”), to provide the day-to-day transfer agent and shareholder servicing of the Fund. Under the Sub-Transfer Agency Agreement, the Transfer Agent pays the Sub-Transfer Agent an annual fee in monthly installments, equal to a percentage of the transfer agent fee collected by the Transfer Agent from the Fund, which shall be calculated after any applicable fee waivers. The fee paid to the Sub-Transfer Agent is paid by the Transfer Agent, not by the Fund.
Trustees’ Compensation. The Fund has adopted an unfunded retirement plan (the “Plan”) for the Fund’s Independent Trustees. Benefits are based on years of service and fees paid to each Trustee during their period of service. The Plan was frozen with respect to adding new participants effective December 31, 2006 (the “Freeze Date”) and existing Plan Participants as of the Freeze Date will continue to receive accrued benefits under the Plan. Active Independent Trustees as of the Freeze Date have each elected a distribution method with respect to their benefits under the Plan. During the six months ended March 31, 2015, the Fund’s projected benefit obligations, payments to retired Trustees and accumulated liability were as follows:
| | | | |
Projected Benefit Obligations Increased | | $ | 6,015 | |
Payments Made to Retired Trustees | | | 27,261 | |
Accumulated Liability as of March 31, 2015 | | | 194,076 | |
34 OPPENHEIMER DISCOVERY FUND
7. Fees and Other Transactions with Affiliates (Continued)
The Fund’s Board of Trustees (“Board”) has adopted a compensation deferral plan for Independent Trustees that enables Trustees to elect to defer receipt of all or a portion of the annual compensation they are entitled to receive from the Fund. For purposes of determining the amount owed to the Trustee under the plan, deferred amounts are treated as though equal dollar amounts had been invested in shares of the Fund or in other Oppenheimer funds selected by the Trustee. The Fund purchases shares of the funds selected for deferral by the Trustee in amounts equal to his or her deemed investment, resulting in a Fund asset equal to the deferred compensation liability. Such assets are included as a component of “Other” within the asset section of the Statement of Assets and Liabilities. Deferral of Trustees’ fees under the plan will not affect the net assets of the Fund and will not materially affect the Fund’s assets, liabilities or net investment income per share. Amounts will be deferred until distributed in accordance with the compensation deferral plan.
Distribution and Service Plan (12b-1) Fees. Under its General Distributor’s Agreement with the Fund, OppenheimerFunds Distributor, Inc. (the “Distributor”) acts as the Fund’s principal underwriter in the continuous public offering of the Fund’s classes of shares.
Service Plan for Class A Shares. The Fund has adopted a Service Plan (the “Plan”) for Class A shares pursuant to Rule 12b-1 under the 1940 Act. Under the Plan, the Fund reimburses the Distributor for a portion of its costs incurred for services provided to accounts that hold Class A shares. Reimbursement is made periodically at an annual rate of up to 0.25% of the daily net assets of Class A shares of the Fund. The Distributor currently uses all of those fees to pay dealers, brokers, banks and other financial institutions periodically for providing personal service and maintenance of accounts of their customers that hold Class A shares. Any unreimbursed expenses the Distributor incurs with respect to Class A shares in any fiscal year cannot be recovered in subsequent periods. Fees incurred by the Fund under the Plan are detailed in the Statement of Operations.
Distribution and Service Plans for Class B, Class C and Class R Shares. The Fund has adopted Distribution and Service Plans (the “Plans”) for Class B, Class C and Class R shares pursuant to Rule 12b-1 under the 1940 Act to compensate the Distributor for distributing those share classes, maintaining accounts and providing shareholder services. Under the Plans, the Fund pays the Distributor an annual asset-based sales charge of 0.75% on Class B and Class C shares daily net assets and 0.25% on Class R shares daily net assets. The Fund also pays a service fee under the Plans at an annual rate of 0.25% of daily net assets. The Plans continue in effect from year to year only if the Fund’s Board of Trustees vote annually to approve its continuance at an in person meeting called for that purpose. Fees incurred by the Fund under the Plans are detailed in the Statement of Operations.
Sales Charges. Front-end sales charges and CDSC do not represent expenses of the Fund. They are deducted from the proceeds of sales of Fund shares prior to investment or from redemption proceeds prior to remittance, as applicable. The sales charges retained by the Distributor from the sale of shares and the CDSC retained by the
35 OPPENHEIMER DISCOVERY FUND
NOTES TO FINANCIAL STATEMENTS Unaudited / Continued
7. Fees and Other Transactions with Affiliates (Continued)
Distributor on the redemption of shares is shown in the following table for the period indicated.
| | | | | | | | | | | | | | | | | | | | |
| Six Months Ended | | Class A
Front-End
Sales Charges
Retained by
Distributor | | | Class A
Contingent
Deferred Sales
Charges
Retained by
Distributor | | | Class B
Contingent
Deferred Sales
Charges
Retained by
Distributor | | | Class C
Contingent
Deferred Sales
Charges
Retained by
Distributor | | | Class R
Contingent
Deferred Sales
Charges
Retained by
Distributor | |
March 31, 2015 | | $ | 68,844 | | | $ | 111 | | | $ | 16,453 | | | $ | 1,965 | | | $ | 166 | |
Waivers and Reimbursements of Expenses. The Manager will waive fees and/or reimburse Fund expenses in an amount equal to the indirect management fees incurred through the Fund’s investment in IMMF. During the six months ended March 31, 2015, the Manager waived fees and/or reimbursed the Fund $26,791 for IMMF management fees.
Waivers and/or reimbursements may be modified or terminated as set forth according to the terms in the prospectus.
8. Pending Litigation
In 2009, seven class action lawsuits were filed in the U.S. District Court for the District of Colorado against OppenheimerFunds, Inc. (“OFI”), OppenheimerFunds Distributor, Inc., the Fund’s principal underwriter and distributor (the “Distributor”), and certain funds (but not including the Fund) advised by OFI Global Asset Management, Inc. and distributed by the Distributor (the “Defendant Funds”). The lawsuits also named as defendants certain officers and current and former trustees of the respective Defendant Funds. The lawsuits raised claims under federal securities laws and alleged, among other things, that the disclosure documents of the respective Defendant Funds contained misrepresentations and omissions and that the respective Defendant Funds’ investment policies were not followed. The plaintiffs in these actions sought unspecified damages, equitable relief and awards of attorneys’ fees and litigation expenses. The Defendant Funds’ Boards of Trustees also engaged counsel to represent the Funds and the present and former Independent Trustees named in those suits. In March 2014, the parties in six of these lawsuits executed stipulations and agreements of settlement resolving those actions. In July 2014, the court entered an order and final judgment approving the settlements as fair, reasonable and adequate. The settlements do not resolve a seventh outstanding lawsuit relating to Oppenheimer Rochester California Municipal Fund (the “California Fund Suit”). OFI believes the California Fund Suit is without legal merit and is defending the suit vigorously. While it is premature to render any opinion as to the outcome in the California Fund Suit, or whether any costs that OFI may bear in defending the California Fund Suit might not be reimbursed by insurance, OFI believes the California Fund Suit should not impair the ability of OFI or the Distributor to perform their respective duties to the Fund, and that the outcome of the California Fund Suit should not have any material effect on the operations of any of the Oppenheimer funds.
36 OPPENHEIMER DISCOVERY FUND
PORTFOLIO PROXY VOTING POLICIES AND PROCEDURES;
UPDATES TO STATEMENTS OF INVESTMENTS Unaudited
The Fund has adopted Portfolio Proxy Voting Policies and Procedures under which the Fund votes proxies relating to securities (“portfolio proxies”) held by the Fund. A description of the Fund’s Portfolio Proxy Voting Policies and Procedures is available (i) without charge, upon request, by calling the Fund toll-free at 1.800.CALL OPP (225.5677), (ii) on the Fund’s website at www.oppenheimerfunds.com, and (iii) on the SEC’s website at www.sec.gov. In addition, the Fund is required to file Form N-PX, with its complete proxy voting record for the 12 months ended June 30th, no later than August 31st of each year. The Fund’s voting record is available (i) without charge, upon request, by calling the Fund toll-free at 1.800.CALL OPP (225.5677), and (ii) in the Form N-PX filing on the SEC’s website at www.sec.gov.
The Fund files its complete schedule of portfolio holdings with the SEC for the first quarter and the third quarter of each fiscal year on Form N-Q. The Fund’s Form N-Q filings are available on the SEC’s website at www.sec.gov. Those forms may be reviewed and copied at the SEC’s Public Reference Room in Washington, D.C. Information on the operation of the Public Reference Room may be obtained by calling 1-800-SEC-0330.
Householding—Delivery of Shareholder Documents
This is to inform you about OppenheimerFunds’ “householding” policy. If more than one member of your household maintains an account in a particular fund, OppenheimerFunds will mail only one copy of the fund’s prospectus (or, if available, the fund’s summary prospectus), annual and semiannual report and privacy policy. The consolidation of these mailings, called householding, benefits your fund through reduced mailing expense, and benefits you by reducing the volume of mail you receive from OppenheimerFunds. Householding does not affect the delivery of your account statements.
Please note that we will continue to household these mailings for as long as you remain an OppenheimerFunds shareholder, unless you request otherwise. If you prefer to receive multiple copies of these materials, please call us at 1.800.CALL-OPP (225-5677). You may also notify us in writing or via email. We will begin sending you individual copies of the prospectus (or, if available, the summary prospectus), reports and privacy policy within 30 days of receiving your request to stop householding.
37 OPPENHEIMER DISCOVERY FUND
OPPENHEIMERDISCOVERYFUND
| | |
| Trustees and Officers | | Brian F. Wruble, Chairman of the Board of Trustees and Trustee David K. Downes, Trustee Matthew P. Fink, Trustee Edmund P. Giambastiani, Jr., Trustee Elizabeth Krentzman, Trustee Mary F. Miller, Trustee Joel W. Motley, Trustee Joanne Pace, Trustee Daniel Vandivort, Trustee Ronald J. Zibelli, Jr., Vice President Ash Shah, Vice President William F. Glavin, Jr., Trustee Arthur P. Steinmetz, President and Principal Executive Officer Arthur S. Gabinet, Secretary and Chief Legal Officer Jennifer Sexton, Vice President and Chief Business Officer Mary Ann Picciotto, Chief Compliance Officer and Chief Anti-Money Laundering Officer Brian W. Wixted, Treasurer and Principal Financial & Accounting Officer |
| |
| Manager | | OFI Global Asset Management, Inc. |
| |
| Sub-Adviser | | OppenheimerFunds, Inc. |
| |
| Distributor | | OppenheimerFunds Distributor, Inc. |
| |
| Transfer and Shareholder Servicing Agent | | OFI Global Asset Management, Inc. |
| |
| Sub-Transfer Agent | | Shareholder Services, Inc. DBA OppenheimerFunds Services |
| |
| Independent Registered Public Accounting Firm | | KPMG LLP |
| |
| Legal Counsel | | Kramer Levin Naftalis & Frankel LLP |
| |
| | The financial statements included herein have been taken from the records of the Fund without examination of those records by the independent registered public accounting firm. |
© 2015 OppenheimerFunds, Inc. All rights reserved.
38 OPPENHEIMER DISCOVERY FUND
PRIVACYPOLICYNOTICE
As an Oppenheimer fund shareholder, you are entitled to know how we protect your personal information and how we limit its disclosure.
Information Sources
We obtain nonpublic personal information about our shareholders from the following sources:
| — | | Applications or other forms |
| — | | When you create a user ID and password for online account access |
| — | | When you enroll in eDocs Direct, our electronic document delivery service |
| — | | Your transactions with us, our affiliates or others |
| — | | A software program on our website, often referred to as a “cookie,” which indicates which parts of our site you’ve visited |
| — | | When you set up challenge questions to reset your password online |
If you visit oppenheimerfunds.com and do not log on to the secure account information areas, we do not obtain any personal information about you. When you do log on to a secure area, we do obtain your user ID and password to identify you. We also use this information to provide you with products and services you have requested, to inform you about products and services that you may be interested in and assist you in other ways.
We do not collect personal information through our website unless you willingly provide it to us, either directly by email or in those areas of the website that request information. In order to update your personal information (including your mailing address, email address and phone number) you must first log on and visit your user profile.
If you have set your browser to warn you before accepting cookies, you will receive the warning message with each cookie. You can refuse cookies by turning them off in your browser. However, doing so may limit your access to certain sections of our website.
We use cookies to help us improve and manage our website. For example, cookies help us recognize new versus repeat visitors to the site, track the pages visited, and enable some special features on the website. This data helps us provide a better service for our website visitors.
Protection of Information
We do not disclose any non-public personal information (such as names on a customer list) about current or former customers to anyone, except as permitted by law.
Disclosure of Information
Copies of confirmations, account statements and other documents reporting activity in your fund accounts are made available to your financial advisor (as designated by you). We may also use details about you and your investments to help us, our financial service affiliates, or firms that jointly market their financial products and services with ours, to better serve your investment needs or suggest financial services or educational material that may be of interest to you. If this requires us to provide you with an opportunity to “opt in” or “opt out” of such information sharing with a firm not affiliated with us, you will receive notification on how to do so, before any such sharing takes place.
Right of Refusal
We will not disclose your personal information to unaffiliated third parties (except as permitted by law), unless we first offer you a reasonable opportunity to refuse or “opt out” of such disclosure.
39 OPPENHEIMER DISCOVERY FUND
PRIVACY POLICY NOTICE Continued
Internet Security and Encryption
In general, the email services provided by our website are encrypted and provide a secure and private means of communication with us. To protect your own privacy, confidential and/or personal information should only be communicated via email when you are advised that you are using a secure website.
As a security measure, we do not include personal or account information in non-secure emails, and we advise you not to send such information to us in non-secure emails. Instead, you may take advantage of the secure features of our website to encrypt your email correspondence. To do this, you will need to use a browser that supports Secure Sockets Layer (SSL) protocol.
We do not guarantee or warrant that any part of our website, including files available for download, are free of viruses or other harmful code. It is your responsibility to take appropriate precautions, such as use of an anti-virus software package, to protect your computer hardware and software.
| — | | All transactions, including redemptions, exchanges and purchases, are secured by SSL and 256-bit encryption. SSL is used to establish a secure connection between your PC and OppenheimerFunds’ server. It transmits information in an encrypted and scrambled format. |
| — | | Encryption is achieved through an electronic scrambling technology that uses a “key” to code and then decode the data. Encryption acts like the cable converter box you may have on your television set. It scrambles data with a secret code so that no one can make sense of it while it is being transmitted. When the data reaches its destination, the same software unscrambles the data. |
| — | | You can exit the secure area by either closing your browser, or for added security, you can use the Log Out button before you close your browser. |
Other Security Measures
We maintain physical, electronic and procedural safeguards to protect your personal account information. Our employees and agents have access to that information only so that they may offer you products or provide services, for example, when responding to your account questions.
How You Can Help
You can also do your part to keep your account information private and to prevent unauthorized transactions. If you obtain a user ID and password for your account, do not allow it to be used by anyone else. Also, take special precautions when accessing your account on a computer used by others.
Who We Are
This joint notice describes the privacy policies of the Oppenheimer funds, OppenheimerFunds, Inc., each of its investment adviser subsidiaries, OppenheimerFunds Distributor, Inc. and OFI Global Trust Co. It applies to all Oppenheimer fund accounts you presently have, or may open in the future, using your Social Security number—whether or not you remain a shareholder of our funds. This notice was last updated March 2015. In the event it is updated or changed, we will post an updated notice on our website at oppenheimerfunds.com. If you have any questions about this privacy policy, write to us at P.O. Box 5270, Denver, CO 80217-5270, email us by clicking on the Contact Us section of our website at oppenheimerfunds.com or call us at 1.800.CALL OPP (225.5677).
40 OPPENHEIMER DISCOVERY FUND
THIS PAGE INTENTIONALLY LEFT BLANK.
41 OPPENHEIMER DISCOVERY FUND
THIS PAGE INTENTIONALLY LEFT BLANK.
42 OPPENHEIMER DISCOVERY FUND
THIS PAGE INTENTIONALLY LEFT BLANK.
43 OPPENHEIMER DISCOVERY FUND
THIS PAGE INTENTIONALLY LEFT BLANK.
44 OPPENHEIMER DISCOVERY FUND
THIS PAGE INTENTIONALLY LEFT BLANK.
45 OPPENHEIMER DISCOVERY FUND
THIS PAGE INTENTIONALLY LEFT BLANK.
46 OPPENHEIMER DISCOVERY FUND
THIS PAGE INTENTIONALLY LEFT BLANK.
47 OPPENHEIMER DISCOVERY FUND

Item 2. Code of Ethics.
Not applicable to semiannual reports.
Item 3. Audit Committee Financial Expert.
Not applicable to semiannual reports.
Item 4. Principal Accountant Fees and Services.
Not applicable to semiannual reports.
Item 5. Audit Committee of Listed Registrants
Not applicable.
Item 6. Schedule of Investments.
a) Not applicable. The complete schedule of investments is included in Item 1 of this Form N-CSR.
b) Not applicable.
Item 7. Disclosure of Proxy Voting Policies and Procedures for Closed-End Management Investment Companies.
Not applicable.
Item 8. Portfolio Managers of Closed-End Management Investment Companies.
Not applicable.
Item 9. Purchases of Equity Securities by Closed-End Management Investment Company and Affiliated Purchasers.
Not applicable.
Item 10. Submission of Matters to a Vote of Security Holders.
The Fund’s Governance Committee Provisions with Respect to Nominations of Directors/Trustees to the Respective Boards
None
Item 11. Controls and Procedures.
Based on their evaluation of the registrant’s disclosure controls and procedures (as defined in rule 30a-3(c) under the Investment Company Act of 1940 (17 CFR 270.30a-3(c)) as of 3/31/2015, the registrant’s principal executive officer and principal financial officer found the registrant’s disclosure controls and procedures to provide reasonable assurances that information required to be disclosed by the registrant in the reports that it files under the Securities Exchange Act of 1934 (a) is accumulated and communicated to registrant’s management, including its principal executive officer and principal financial officer, to allow timely decisions regarding required disclosure, and (b) is recorded, processed, summarized and reported, within the time periods specified in the rules and forms adopted by the U.S. Securities and Exchange Commission.
There have been no changes in the registrant’s internal controls over financial reporting that occurred during the registrant’s second fiscal quarter of the period covered by this report that have materially affected, or are reasonably likely to materially affect, the registrant’s internal control over financial reporting.
Item 12. Exhibits.
| (a) | (1) Not applicable to semiannual reports. |
(2) Exhibits attached hereto.
(3) Not applicable.
| (b) | Exhibit attached hereto. |
SIGNATURES
Pursuant to the requirements of the Securities Exchange Act of 1934 and the Investment Company Act of 1940, the registrant has duly caused this report to be signed on its behalf by the undersigned, thereunto duly authorized.
| | |
| Oppenheimer Discovery Fund |
| |
| By: | | /s/ Arthur P. Steinmetz |
| | Arthur P. Steinmetz |
| | Principal Executive Officer |
| Date: | | 5/12/2015 |
Pursuant to the requirements of the Securities Exchange Act of 1934 and the Investment Company Act of 1940, this report has been signed below by the following persons on behalf of the registrant and in the capacities and on the dates indicated.
| | |
| By: | | /s/ Arthur P. Steinmetz |
| | Arthur P. Steinmetz |
| | Principal Executive Officer |
| Date: | | 5/12/2015 |
| | |
| By: | | /s/ Brian W. Wixted |
| | Brian W. Wixted |
| | Principal Financial Officer |
| Date: | | 5/12/2015 |